
Dietary Total Antioxidant Capacity—A New Indicator of Healthy Diet Quality in Cardiovascular Diseases: A Polish Cross-Sectional Study

 ,
,  ,
,  , ,
, ,
Abstract
:
1. Introduction
2. Materials and Methods
2.1. Ethical Approval
2.2. Study Group
2.3. Clinical Measurements
2.4. Dietary Assessment
2.5. Assessment of Dietary Antioxidants
2.6. Assessment of Healthy Diet Indicator (HDI)
2.7. Statistical Analysis
3. Results
4. Discussion
Limitations
5. Conclusions
Author Contributions
Funding
Institutional Review Board Statement
Informed Consent Statement
Data Availability Statement
Conflicts of Interest
References
- World Health Organization. Cardiovascular Diseases (CVDs). Available online: https://www.who.int/news-room/fact-sheets/detail/cardiovascular-diseases-(cvds) (accessed on 13 March 2022).
- Van Horn, L.; Carson, J.A.S.; Appel, L.J.; Burke, L.E.; Economos, C.; Karmally, W.; Lancaster, K.; Lichtenstein, A.H.; Johnson, R.K.; Thomas, R.J.; et al. Recommended dietary pattern to achieve adherence to the American Heart Association/American College of Cardiology (AHA/ACC) Guidelines: A Scientific Statement from the American Heart Association. Circulation 2016, 134, e505–e529. [Google Scholar] [CrossRef] [PubMed]
- Nestel, P.J.; Mori, T.A. Dietary patterns, dietary nutrients and cardiovascular disease. Rev. Cardiovasc. Med. 2022, 23, 17. [Google Scholar] [CrossRef] [PubMed]
- Micek, A.; Godos, J.; Del Rio, D.; Galvano, F.; Grosso, G. Dietary Flavonoids and Cardiovascular Disease: A Comprehensive dose-response meta-analysis. Mol. Nutr. Food Res. 2021, 65, e2001019. [Google Scholar] [CrossRef] [PubMed]
- Gan, Z.H.; Cheong, H.C.; Tu, Y.K.; Kuo, P.H. Association between plant-based dietary patterns and risk of cardiovascular disease: A systematic review and meta-analysis of prospective cohort studies. Nutrients 2021, 13, 3952. [Google Scholar] [CrossRef] [PubMed]
- Zujko, M.E.; Rożniata, M.; Zujko, K. Individual Diet Modification Reduces the Metabolic Syndrome in Patients Before Pharmacological Treatment. Nutrients 2021, 13, 2102. [Google Scholar] [CrossRef]
- Witkowska, A.M.; Waśkiewicz, A.; Zujko, M.E.; Szcześniewska, D.; Stepaniak, U.; Pająk, A.; Drygas, W. Are total and individual dietary lignans related to cardiovascular disease and its risk factors in postmenopausal women? A nationwide study. Nutrients 2018, 10, 865. [Google Scholar] [CrossRef] [Green Version]
- Nascimento-Souza, M.A.; Paiva, P.G.; Martino, H.S.D.; Ribeiro, A.Q. Dietary total antioxidant capacity as a tool in health outcomes in middle-aged and older adults: A systematic review. Crit. Rev. Food Sci. Nutr. 2018, 58, 905–912. [Google Scholar] [CrossRef]
- Pellegrini, N.; Vitaglione, P.; Granato, D.; Fogliano, V. Twenty-five years of total antioxidant capacity measurement of foods and biological fluids: Merits and limitations. J. Sci. Food Agric. 2020, 100, 5064–5078. [Google Scholar] [CrossRef]
- Salari-Moghaddam, A.; Nouri-Majd, S.; Keshteli, A.H.; Emami, F.; Esmaillzadeh, A.; Adibi, P. Association between Dietary Total Antioxidant Capacity and Diet Quality in Adults. Front. Nutr. 2022, 9, 838752. [Google Scholar] [CrossRef]
- Parohan, M.; Anjom-Shoae, J.; Nasiri, M.; Khodadost, M.; Khatibi, S.R.; Sadeghi, O. Dietary total antioxidant capacity and mortality from all causes, cardiovascular disease and cancer: A systematic review and dose-response meta-analysis of prospective cohort studies. Eur. J. Nutr. 2019, 58, 2175–2189. [Google Scholar] [CrossRef]
- da Silva, A.; Caldas, A.P.S.; Pinto, S.L.; Hermsdorff, H.H.M.; Marcadenti, A.; Bersch-Ferreira, A.C.; Torreglosa, C.R.; Weber, B.; Bressan, J. Dietary total antioxidant capacity is inversely associated with cardiovascular events and cardiometabolic risk factors: A cross-sectional study. Nutrition 2021, 89, 111140. [Google Scholar] [CrossRef] [PubMed]
- Zujko, M.E.; Waśkiewicz, A.; Witkowska, A.M.; Szcześniewska, D.; Zdrojewski, T.; Kozakiewicz, K.; Drygas, W. Dietary total antioxidant capacity and dietary polyphenol intake and prevalence of metabolic syndrome in Polish adults: A nationwide study. Oxid. Med. Cell. Longev. 2018, 2018, 7487816. [Google Scholar] [CrossRef] [PubMed]
- Cyuńczyk, M.; Zujko, M.E.; Jamiołkowski, J.; Zujko, K.; Łapińska, M.; Zalewska, M.; Kondraciuk, M.; Witkowska, A.M.; Kamiński, K.A. Dietary total antioxidant capacity is inversely associated with prediabetes and insulin resistance in Bialystok PLUS population. Antioxidants 2022, 11, 283. [Google Scholar] [CrossRef]
- Hermsdorff, H.H.; Puchau, B.; Volp, A.C.; Barbosa, K.B.; Bressan, J.; Zulet, M.Á.; Martínez, J.A. Dietary total antioxidant capacity is inversely related to central adiposity as well as to metabolic and oxidative stress markers in healthy young adults. Nutr. Metab. 2011, 8, 59. [Google Scholar] [CrossRef] [Green Version]
- Georgoulis, M.; Fragopoulou, E.; Kontogianni, M.D.; Margariti, A.; Boulamatsi, O.; Detopoulou, P.; Tiniakos, D.; Zafiropoulou, R.; Papatheodoridis, G. Blood redox status is associated with the likelihood of nonalcoholic fatty liver disease irrespectively of diet’s total antioxidant capacity. Nutr. Res. 2015, 35, 41–48. [Google Scholar] [CrossRef] [PubMed]
- Drygas, W.; Niklas, A.A.; Piwońska, A.; Piotrowski, W.; Flotyńska, A.; Kwaśniewska, M.; Nadrowski, P.; Puch-Walczak, A.; Szafraniec, K.; Bielecki, W.; et al. Multi-center National Population Health Examination Survey (WOBASZ II study): Assumptions, methods and implementation. Kardiol. Pol. 2016, 74, 681–690. [Google Scholar] [CrossRef] [Green Version]
- Witkowska, A.M.; Waśkiewicz, A.; Zujko, M.E.; Cicha-Mikołajczyk, A.; Mirończuk-Chodakowska, I.; Drygas, W. Dietary intake of plant sterols and phytosterol-enriched margarines and their relationship with cardiovascular disease among Polish men and women: Results of the WOBASZ II cross-sectional study. Nutrients 2022, 14, 2665. [Google Scholar] [CrossRef] [PubMed]
- WHO. Body Mass Index—BMI. Available online: https://www.euro.who.int/en/health-topics/disease-prevention/nutrition/ahealthy-lifestyle/body-mass-index-bmi (accessed on 10 April 2022).
- Visseren, F.L.J.; Mach, F.; Smulders, Y.M.; Carballo, D.; Koskinas, K.C.; Bäck, M.; Benetos, A.; Biffi, A.; Boavida, J.M.; Capodanno, D.; et al. 2021 ESC Guidelines on cardiovascular disease prevention in clinical practice with representatives of the European Society of Cardiology and 12 medical societies with the special contribution of the European Association of Preventive Cardiology (EAPC). Eur. Heart. J. 2021, 42, 3227–3337. [Google Scholar] [CrossRef]
- American Diabetes Association. Standards of Medical Care in Diabetes-2022, Abridged for Primary Care Providers. Clin. Diabetes 2022, 40, 10–38. [Google Scholar] [CrossRef]
- Alberti, K.G.; Eckel, R.H.; Grundy, S.M.; Zimmet, P.Z.; Cleeman, J.I.; Donato, K.A.; Fruchart, J.C.; James, W.P.; Loria, C.M.; Smith, S.C., Jr. Harmonizing the metabolic syndrome. A joint interim statement of the International Diabetes Federation Task Force on Epidemiology and Prevention; National Heart, Lung, and Blood Institute; American Heart Association; World Heart Federation; International Atherosclerosis Society; and International Association for the Study of Obesity. Circulation 2009, 120, 1640–1645. [Google Scholar]
- Szponar, L.; Wolnicka, K.; Rychlik, E. Album of Photographs of Food Products and Dishes; National Food and Nutrition Institute Press: Warsaw, Poland, 2000. [Google Scholar]
- Kunachowicz, H.; Nadolna, I.; Przygoda, B.; Iwanow, K. Food Composition Tables; PZWL: Warsaw, Poland, 2005. [Google Scholar]
- Neveu, V.; Perez-Jiménez, J.; Vos, F. Phenol-Explorer: An online comprehensive database on polyphenol contents in foods. J. Biol. Databases Curation 2010, 2010, bap024. [Google Scholar] [CrossRef] [PubMed]
- Zujko, M.E.; Witkowska, A.M. Antioxidant potential and polyphenol content of selected food. Int. J. Food Prop. 2011, 14, 300–308. [Google Scholar] [CrossRef]
- Zujko, M.E.; Witkowska, A.M. Antioxidant potential and polyphenol content of beverages, chocolates, nuts, and seeds. Int. J. Food Prop. 2014, 17, 86–92. [Google Scholar] [CrossRef]
- Carlsen, M.H.; Halvorsen, B.L.; Holte, K.; Bøhn, S.K.; Dragland, S.; Sampson, L.; Willey, C.; Senoo, H.; Umezono, Y.; Sanada, C.; et al. The total antioxidant content of more than 3100 foods, beverages, spices, herbs and supplements used worldwide. Nutr. J. 2010, 9, 3. [Google Scholar] [CrossRef] [PubMed]
- World Health Organisation. Diet, nutrition, and the prevention of chronic diseases. Report of a WHO Study Group. World Health Organ. Tech. Rep. Ser. 1990, 797, 1–204. [Google Scholar]
- Fransen, H.P.; Beulens, J.W.; May, A.M.; Struijk, E.A.; Boer, J.M.; de Wit, G.A.; Onland-Moret, N.C.; van der Schouw, Y.T.; Bueno-de-Mesquita, H.B.; Hoekstra, J.; et al. Dietary patterns in relation to quality-adjusted life years in the EPIC-NL cohort. Prev. Med. 2015, 77, 119–124. [Google Scholar] [CrossRef] [PubMed]
- Koene, R.J.; Prizment, A.E.; Blaes, A.; Konety, S.H. Shared risk factors in cardiovascular disease and cancer. Circulation 2016, 133, 1104–1114. [Google Scholar] [CrossRef] [PubMed] [Green Version]
- Grosso, G.; Godos, J.; Currenti, W.; Micek, A.; Falzone, L.; Libra, M.; Giampieri, F.; Forbes-Hernández, T.Y.; Quiles, J.L.; Battino, M.; et al. The effect of dietary polyphenols on vascular health and hypertension: Current evidence and mechanisms of action. Nutrients 2022, 14, 545. [Google Scholar] [CrossRef]
- Núñez-Córdoba, J.M.; Martínez-González, M.A. Antioxidant vitamins and cardiovascular disease. Curr. Top. Med. Chem. 2011, 11, 1861–1869. [Google Scholar] [CrossRef]
- Grosso, G.; Marventano, S.; Yang, J.; Micek, A.; Pajak, A.; Scalfi, L.; Galvano, F.; Kales, S.N. A comprehensive meta-analysis on evidence of Mediterranean diet and cardiovascular disease: Are individual components equal? Crit. Rev. Food Sci. Nutr. 2017, 57, 3218–3232. [Google Scholar] [CrossRef]
- Siervo, M.; Lara, J.; Chowdhury, S.; Ashor, A.; Oggioni, C.; Mathers, J.C. Effects of the Dietary Approach to Stop Hypertension (DASH) diet on cardiovascular risk factors: A systematic review and meta-analysis. Br. J. Nutr. 2015, 113, 1–15. [Google Scholar] [CrossRef] [PubMed] [Green Version]
- Adamsson, V.; Reumark, A.; Fredriksson, I.B.; Hammarstrom, E.; Vessby, B.; Johansson, G.; Riserus, U. Effects of a healthy Nordic diet on cardiovascular risk factors in hypercholesterolaemic subjects: A randomized controlled trial (NORDIET). J. Intern. Med. 2011, 269, 150–159. [Google Scholar] [CrossRef] [PubMed]
- Lee, K.W.; Cho, M.S. The traditional Korean dietary pattern is associated with decreased risk of metabolic syndrome: Findings from the Korean National Health and Nutrition Examination Survey, 1998–2009. J. Med. Food 2014, 17, 43–56. [Google Scholar] [CrossRef] [PubMed]
- Niu, K.; Momma, H.; Kobayashi, Y.; Guan, L.; Chujo, M.; Otomo, A.; Ouchi, E.; Nagatomi, R. The traditional Japanese dietary pattern and longitudinal changes in cardiovascular disease risk factors in apparently healthy Japanese adults. Eur. J. Nutr. 2016, 55, 267–279. [Google Scholar] [CrossRef]
- Leonetti, F.; Liguori, A.; Petti, F.; Rughini, S.; Silli, L.; Liguori, S.; Bangrazi, S. Effects of basic traditional Chinese diet on body mass index, lean body mass, and eating and hunger behaviours in overweight or obese individuals. J. Tradit. Chin. Med. 2016, 36, 456–463. [Google Scholar] [CrossRef]
- Shan, Z.; Li, Y.; Baden, M.Y.; Bhupathiraju, S.N.; Wang, D.D.; Sun, Q.; Rexrode, K.M.; Rimm, E.B.; Qi, L.; Willett, W.C.; et al. Association between healthy eating patterns and risk of cardiovascular disease. JAMA Intern. Med. 2020, 180, 1090–1100. [Google Scholar] [CrossRef]
- Cena, H.; Calder, P.C. Defining a healthy diet: Evidence for the role of contemporary dietary patterns in health and disease. Nutrients 2020, 12, 334. [Google Scholar] [CrossRef] [Green Version]
- Sunkara, A.; Raizner, A. Supplemental vitamins and minerals for cardiovascular disease prevention and treatment. Methodist Debakey Cardiovasc. J. 2019, 15, 179–184. [Google Scholar] [CrossRef]
- Ha, K.; Kim, K.; Sakaki, J.R.; Chun, O.K. Relative validity of dietary total antioxidant capacity for predicting all-cause mortality in comparison to diet quality indexes in US adults. Nutrients 2020, 12, 1210. [Google Scholar] [CrossRef]
- Senoner, T.; Dichtl, W. Oxidative stress in cardiovascular diseases: Still a therapeutic target? Nutrients 2019, 11, 2090. [Google Scholar] [CrossRef] [Green Version]
- Mancini, F.R.; Aurélie Affret, A.; Dow, C.; Balkau, B.; Bonnet, F.; Boutron-Ruault, M.C.; Fagherazzi, G. Dietary antioxidant capacity and risk of type 2 diabetes in the large prospective E3N-EPIC cohort. Diabetologia 2018, 61, 308–316. [Google Scholar] [CrossRef] [PubMed] [Green Version]
- van der Schaft, N.; Schoufour, J.D.; Nano, J.; Kiefte-de Jong, J.C.; Muka, T.; Sijbrands, E.J.G.; Ikram, M.A.; Franco, O.H.; Voortman, T. Dietary antioxidant capacity and risk of type 2 diabetes mellitus, prediabetes and insulin resistance: The Rotterdam Study. Eur. J. Epidemiol. 2019, 34, 853–861. [Google Scholar] [CrossRef] [PubMed] [Green Version]
- Abbasalizad Farhangi, M.; Vajdi, M. Dietary total antioxidant capacity (TAC) significantly reduces the risk of site-specific cancers: An updated systematic review and meta-analysis. Nutr. Cancer 2021, 73, 721–739. [Google Scholar] [CrossRef]
- Rautiainen, S.; Levitan, E.B.; Orsini, N.; Åkesson, A.; Morgenstern, R.; Mittleman, M.A.; Wolk, A. Total antioxidant capacity from diet and risk of myocardial infarction: A prospective cohort of women. Am. J. Med. 2012, 125, 974–980. [Google Scholar] [CrossRef] [PubMed]
- Rautiainen, S.; Levitan, E.B.; Mittleman, M.A.; Wolk, A. Total antioxidant capacity of diet and risk of heart failure: A population-based prospective cohort of women. Am. J. Med. 2013, 126, 494–500. [Google Scholar] [CrossRef]
- Colarusso, L.; Serafini, M.; Lagerros, Y.T.; Nyren, O.; La Vecchia, C.; Rossi, M.; Ye, W.; Tavani, A.; Adami, H.O.; Grotta, A.; et al. Dietary antioxidant capacity and risk for stroke in a prospective cohort study of Swedish men and women. Nutrition 2017, 33, 234–239. [Google Scholar] [CrossRef]
- de Lima-Reis, S.R.; Silva, T.A.; Costa, L.S.A.; Volp, A.C.P.; Rios-Santos, F.; Reis, É.M.; Bassi-Branco, C.L. Serum levels of vitamin A, selenium and better dietary total antioxidant capacity are related to lower oxidative DNA damage: A cross-sectional study of individuals at cardiovascular risk. J. Nutr. Biochem. 2022, 107, 109070. [Google Scholar] [CrossRef]


| Variables | Men (n = 2554) | p | Women (n = 3136) | p | Total (n = 5690) | p | |||
|---|---|---|---|---|---|---|---|---|---|
| CVD | Non-CVD | CVD | Non-CVD | CVD | Non-CVD | ||||
| n = 494 | n = 2060 | n = 644 | n = 2492 | n = 1138 | n = 4552 | ||||
| Age [years], Mean ± SD | 62.4 ± 13.2 | 45.5 ± 15.2 | <0.0001 | 62.3 ± 14.8 | 47.1 ± 15.5 | <0.0001 | 62.3 ± 14.1 | 46.4 ± 15.4 | <0.0001 |
| BMI [kg/m2], Mean ± SD | 28.5 ± 4.7 | 27.2 ± 4.5 | <0.0001 | 29.0 ± 5.3 | 26.4 ± 5.6 | <0.0001 | 28.8 ± 5.1 | 26.8 ± 5.1 | <0.0001 |
| Current smoking, n (%) | 93 (18.90) | 645 (31.36) | <0.0001 | 99 (15.37) | 486 (19.51) | 0.0163 | 192 (16.90) | 1131 (24.87) | <0.0001 |
| Educational level, n (%) | |||||||||
| Under middle | 118 (23.94) | 258 (12.54) | <0.0001 | 221 (34.32) | 376 (15.11) | <0.0001 | 339 (29.82) | 634 (13.95) | <0.0001 |
| Vocational | 156 (31.64) | 642 (31.20) | 110 (17.08) | 464 (18.65) | 266 (23.39) | 1106 (24.33) | |||
| Middle | 166 (33.67) | 775 (37.66) | 235 (36.49) | 1034 (41.56) | 401 (35.27) | 1809 (39.79) | |||
| Higher | 53 (10.75) | 383 (18.61) | 78 (12.11) | 614 (24.68) | 131 (11.52) | 997 (21.93) | |||
| Physical activity, n (%) | |||||||||
| Low level | 257 (52.34) | 1142 (55.60) | 0.0039 | 363 (56.37) | 1314 (52.96) | 0.0403 | 620 (54.63) | 2456 (54.16) | 0.0017 |
| Middle level | 57 (11.61) | 320 (15.58) | 78 (12.11) | 412 (16.61) | 135 (11.89) | 732 (16.14) | |||
| High level | 165 (33.60) | 535 (26.05) | 187 (29.04) | 705 (28.42) | 352 (31.01) | 1240 (27.34) | |||
| Seasonally | 12 (2.44) | 57 (2.78) | 16 (2.48) | 50 (2.02) | 28 (2.47) | 107 (2.36) | |||
| Energy [kcal/day], Mean ± SD | 2034 ± 829 | 2385 ± 947 | <0.0001 | 1542 ± 555 | 1713 ± 654 | <0.0001 | 1755 ± 729 | 2017 ± 867 | <0.0001 |
| Dietary fiber [g/day], Mean ± SD | 20.3 ± 8.7 | 21.1 ± 9.2 | 0.0733 | 16.8 ± 7.4 | 17.7 ± 7.8 | 0.0019 | 18.3 ± 8.2 | 19.3 ± 8.7 | 0.0005 |
| Alcohol intake [g/day], Mean ± SD | 3.1 ± 15.1 | 5.0 ± 21.0 | 0.0111 | 0.3 ± 2.7 | 0.7 ± 6.4 | 0.0792 | 1.5 ± 10.2 | 2.7 ± 15.0 | 0.0014 |
| Hypertension, n (%) | 359 (73.27) | 890 (43.84) | <0.0001 | 418 (65.21) | 874 (35.56) | <0.0001 | 777 (68.70) | 1764 (39.30) | <0.0001 |
| Diabetes mellitus, n (%) | 129 (27.22) | 161 (8.17) | <0.0001 | 119 (19.44) | 178 (7.51) | <0.0001 | 248 (22.84) | 339 (7.81) | <0.0001 |
| Hypercholesterolemia, n (%) | 401 (82.68) | 1376 (68.97) | <0.0001 | 493 (76.79) | 1563 (64.03) | <0.0001 | 894 (79.33) | 2939 (66.25) | <0.0001 |
| Hypertriglyceridemia, n (%) | 181 (38.19) | 699 (35.50) | 0.2742 | 168 (27.50) | 494 (20.70) | 0.0003 | 349 (32.17) | 1193 (27.39) | 0.0018 |
| Metabolic syndrome, n (%) | 272 (55.06) | 728 (35.34) | <0.0001 | 322 (50.00) | 706 (28.33) | <0.0001 | 594 (52.20) | 1434 (31.50) | <0.0001 |
| Variables | Men 1 | p | Women 1 | p | Total 2 | p | |||
|---|---|---|---|---|---|---|---|---|---|
| CVD | Non-CVD | CVD | Non-CVD | CVD | Non-CVD | ||||
| Mean (95% CI) | Mean (95% CI) | Mean (95% CI) | |||||||
| DTAC [mmol/d] | 11.06 (10.35–11.77) | 12.69 (12.36–13.02) | <0.0001 | 12.15 (11.55–12.74) | 12.29 (12.00–12.58) | 0.6776 | 11.70 (11.24–12.15) | 12.47 (12.25–12.69) | 0.0033 |
| DTAC/1000 kcal | 5.42 (5.09–5.75) | 5.81 (5.66–5.97) | 0.0388 | 8.18 (7.77–8.59) | 7.78 (7.58–7.98) | 0.0931 | 6.86 (6.59–7.13) | 6.79 (6.66–6.92) | 0.6511 |
| DTPI [mg/d] | 1948 (1858–2037) | 2101 (2060–2143) | 0.0029 | 1935 (1866–2004) | 2000 (1967–2034) | 0.1046 | 1947 (1892–2002) | 2050 (2023–2076) | 0.0013 |
| DTPI/1000 kcal | 945 (905–986) | 954 (936–973) | 0.7086 | 1298 (1249–1347) | 1255 (1232–1279) | 0.1302 | 1126 (1094–1159) | 1104 (1088–1120) | 0.2346 |
| Vitamin C [mg/d] | 85.9 (78.2–93.7) | 87.9 (84.3–91.5) | 0.6611 | 92.2 (84.1–100.3) | 96.1 (92.2–100.1) | 0.4020 | 88.9 (83.2–94.6) | 92.0 (89.3–94.7) | 0.3437 |
| Vitamin C/1000 kcal | 43.5 (39.5–47.4) | 40.5 (38.6–42.3) | 0.1851 | 63.5 (57.5–69.4) | 61.2 (58.3–64.1) | 0.5097 | 53.5 (49.7–57.3) | 50.8 (49.0–52.6) | 0.2218 |
| Vitamin E [mg/d] | 12.38 (11.60–13.16) | 12.67 (12.30–13.03) | 0.5262 | 10.47 (9.28–11.65) | 11.11 (10.54–11.69) | 0.3495 | 11.38 (10.63–12.13) | 11.90 (11.54–12.25) | 0.2366 |
| Vitamin E/1000 kcal | 5.71 (5.38–6.04) | 5.52 (5.36–5.67) | 0.3043 | 6.82 (5.90–7.74) | 6.86 (6.41–7.31) | 0.9438 | 6.25 (5.71–6.79) | 6.19 (5.93–6.45) | 0.8444 |
| β-Carotene [μg/d] | 2980 (2685–3275) | 2972 (2836–3109) | 0.9652 | 3210 (2936–3484) | 2923 (2789–3056) | 0.0716 | 3109 (2908–3310) | 2944 (2848–3041) | 0.1577 |
| β-Carotene/1000 kcal | 1601 (1443–1759) | 1396 (1322–1469) | 0.0246 | 2135 (1933–2337) | 1927 (1829–2025) | 0.0764 | 1870 (1737–2003) | 1661 (1597–1725) | 0.0067 |
| Zinc [mg/d] | 11.34 (10.86–11.82) | 11.62 (11.40–11.85) | 0.3089 | 8.26 (7.91–8.61) | 8.64 (8.47–8.81) | 0.0570 | 9.78 (9.49–10.07) | 10.13 (10.00–10.27) | 0.0326 |
| Zinc/1000 kcal | 5.28 (5.12–5.44) | 5.10 (5.03–5.18) | 0.0506 | 5.39 (5.19–5.59) | 5.29 (5.19–5.39) | 0.4099 | 5.33 (5.20–5.46) | 5.20 (5.13–5.26) | 0.0809 |
| Iron [mg/d] | 11.99 (11.40–12.57) | 12.70 (12.43–12.97) | 0.0348 | 10.05 (9.38–10.71) | 10.41 (10.09–10.73) | 0.3369 | 11.03 (10.58–11.48) | 11.55 (11.33–11.77) | 0.0480 |
| Iron/1000 kcal | 5.61 (5.40–5.82) | 5.59 (5.49–5.69) | 0.8788 | 6.55 (6.16–6.93) | 6.35 (6.16–6.53) | 0.3675 | 6.10 (5.86–6.33) | 5.96 (5.85–6.08) | 0.3302 |
| Manganese [mg/d] | 4.75 (4.53–4.96) | 4.66 (4.56–4.76) | 0.4996 | 3.90 (3.74–4.06) | 4.06 (3.98–4.14) | 0.0842 | 4.31 (4.18–4.44) | 4.36 (4.30–4.43) | 0.4498 |
| Manganese/1000 kcal | 2.31 (2.21–2.41) | 2.14 (2.09–2.18) | 0.0032 | 2.65 (2.54–2.76) | 2.56 (2.51–2.62) | 0.1539 | 2.48 (2.40–2.55) | 2.35 (2.32–2.39) | 0.0038 |
| Copper [mg/d] | 1.21 (1.15–1.26) | 1.27 (1.24–1.29) | 0.0429 | 1.03 (0.99–1.07) | 1.07 (1.05–1.09) | 0.0873 | 1.12 (1.08–1.15) | 1.17 (1.15–1.18) | 0.0076 |
| Copper/1000 kcal | 0.568 (0.549–0.587) | 0.562 (0.553–0.571) | 0.5883 | 0.675 (0.650–0.700) | 0.656 (0.644–0.668) | 0.1971 | 0.623 (0.606–0.639) | 0.609 (0.601–0.617) | 0.1450 |
| Variables | Men | p | Women | p | Total | p | |||||||||
|---|---|---|---|---|---|---|---|---|---|---|---|---|---|---|---|
| n = 2554 | n = 3136 | n = 5690 | |||||||||||||
| Q1 | Q2 | Q3 | Q4 | Q1 | Q2 | Q3 | Q4 | Q1 | Q2 | Q3 | Q4 | ||||
| n = 638 | n = 639 | n = 638 | n = 639 | n = 784 | n = 784 | n = 784 | n = 784 | n = 1423 | n = 1422 | n = 1423 | n = 1422 | ||||
| DTAC (mmol/d) | |||||||||||||||
| Mean ± SD | 5.22 ± 1.75 | 9.44 ± 1.02 | 13.17 ± 1.20 | 21.67 ± 8.52 | <0.0001 | 5.52 + 1.77 | 9.72 ± 1.00 | 13.14 ± 1.11 | 20.68 ± 9.07 | <0.0001 | 5.38 ± 1.77 | 9.59 ± 1.01 | 13.15 ± 1.15 | 21.13 ± 8.84 | <0.0001 |
| Me, IQR | 5.50 | 9.43 | 13.14 | 19.10 | 5.78 | 9.77 | 13.08 | 18.50 | 5.67 | 9.62 | 13.11 | 18.73 | |||
| (3.99–6.67) | (8.52–10.34) | (12.12–14.18) | (16.90–23.03) | (4.37–7.08) | (8.85–10.61) | (12.15–14.11) | (16.52–21.56) | (4.18–6.87) | (8.71–10.47) | (12.13–14.16) | (16.76–22.20) | ||||
| Range | 0.47–7.70 | 7.71–11.16 | 11.16–15.38 | 15.39–95.69 | 0.32–7.91 | 7.94–11.35 | 11.35–15.19 | 15.19–191.82 | 0.32–7.85 | 7.85–11.31 | 11.31–15.27 | 15.27–191.82 | |||
| DTAC/1000 kcal | |||||||||||||||
| Mean ± SD | 3.15 ± 1.78 | 4.99 ± 2.07 | 6.15 ± 2.46 | 8.66 ± 4.34 | <0.0001 | 4.55 ± 2.31 | 6.80 ± 2.69 | 8.50 ± 3.10 | 11.62 ± 7.16 | <0.0001 | 3.88 ± 2.16 | 6.02 ± 2.59 | 7.48 ± 3.06 | 10.27 ± 6.24 | <0.0001 |
| Me, IQR | 2.83 | 4.65 | 5.74 | 7.80 | 4.09 | 6.19 | 7.92 | 10.07 | 3.50 | 5.51 | 6.99 | 8.97 | |||
| (2.02–3.90) | (3.65–5.84) | (4.55–7.21) | (5.89–9.98) | (3.03–5.55) | (4.98–7.99) | (6.43–10.02) | (8.16–13.05) | (2.46–4.83) | (4.26–7.14) | (5.42–8.92) | (6.89–11.65) | ||||
| Range | 0.39–21.18 | 1.51–21.98 | 2.25–26.35 | 2.30–33.51 | 0.38–19.06 | 2.05–22.01 | 2.90–29.93 | 3.31–105.64 | 0.38–21.18 | 1.51–22.01 | 2.25–29.93 | 2.30–105.64 | |||
| Mean 1 (95% CI) | |||||||||||||||
| DTPI [mg/d] | 1135 | 1738 | 2226 | 3187 | <0.0001 | 1107 | 1714 | 2165 | 2962 | <0.0001 | 1125 | 1729 | 2199 | 3067 | <0.0001 |
| (1091–1179) | (1694–1782) | (2182–2270) | (3143–3231) | (1071–1143) | (1678–1750) | (2129–2200) | (2927–2998) | (1097–1153) | (1701–1757) | (2171–2227) | (3039–3095) | ||||
| DTPI/1000 kcal | 654 | 886 | 1019 | 1251 | <0.0001 | 876 | 1168 | 1372 | 1640 | <0.0001 | 761 | 1028 | 1197 | 1450 | <0.0001 |
| (626–682) | (858–914) | (991–1047) | (1223–1279) | (839–913) | (1131–1205) | (1335–1409) | (1603–1677) | (737–785) | (1004–1052) | (1173–1221) | (1426–1474) | ||||
| Vitamin C [mg/d] | 60.1 | 79.3 | 92.8 | 117.7 | <0.0001 | 67.2 | 85.7 | 94.8 | 133.7 | <0.0001 | 64.2 | 82.1 | 93.5 | 125.8 | <0.0001 |
| (54.0–66.2) | (73.2–85.4) | (86.7–98.9) | (111.6–123.8) | (60.5–74.0) | (79.0–92.4) | (88.0–101.5) | (126.9–140.4) | (59.6–68.8) | (77.5–86.7) | (88.9–98.1) | (121.2–130.4) | ||||
| Vitamin C/1000 kcal | 34.9 | 40.6 | 42.1 | 46.5 | <0.0001 | 54.4 | 57.9 | 60.2 | 74.0 | <0.0001 | 44.9 | 49.1 | 50.9 | 60.5 | <0.0001 |
| (31.7–38.1) | (37.4–43.8) | (38.9–45.3) | (43.3–49.7) | (49.3–59.5) | (52.9–63.0) | (55.1–65.3) | (69.0–79.1) | (41.8–48.1) | (45.9–52.2) | (47.7–54.0) | (57.4–63.7) | ||||
| Vitamin E [mg/d] | 10.11 | 11.63 | 12.86 | 15.84 | <0.0001 | 8.62 | 10.43 | 11.42 | 13.45 | <0.0001 | 9.43 | 11.03 | 12.10 | 14.62 | <0.0001 |
| (9.49–10.73) | (11.02–12.25) | (12.24–13.48) | (15.22–16.45) | (7.62–9.63) | (9.42–11.44) | (10.41–12.42) | (12.44–14.46) | (8.81–10.05) | (10.41–11.66) | (11.48–12.72) | (13.99–15.24) | ||||
| Vitamin E/1000 kcal | 5.44 | 5.54 | 5.44 | 5.80 | 0.1965 | 6.44 | 6.81 | 7.10 | 7.05 | 0.6479 | 5.95 | 6.17 | 6.26 | 6.43 | 0.5209 |
| (5.17–5.70) | (5.27–5.80) | (5.18–5.71) | (5.53–6.06) | (5.66–7.23) | (6.03–7.60) | (6.31–7.88) | (6.26–7.84) | (5.50–6.40) | (5.72–6.62) | (5.81–6.71) | (5.98–6.88) | ||||
| β-Carotene [μg/d] | 2313 | 2971 | 3194 | 3416 | <0.0001 | 2598 | 2871 | 3086 | 3373 | <0.0001 | 2488 | 2894 | 3142 | 3387 | <0.0001 |
| (2075–2552) | (2733–3210) | (2955–3432) | (3178–3655) | (2364–2832) | (2638–3105) | (2853–3320) | (3139–3607) | (2320–2655) | (2727–3062) | (2974–3310) | (3219–3555) | ||||
| β-Carotene/1000 kcal | 1428 | 1546 | 1432 | 1334 | 0.1568 | 2164 | 1967 | 1907 | 1841 | 0.0574 | 1812 | 1745 | 1666 | 1586 | 0.0309 |
| (1299–1558) | (1417–1676) | (1303–1562) | (1205–1463) | (1992–2337) | (1794–2139) | (1735–2080) | (1668–2013) | (1701–1924) | (1634–1857) | (1555–1778) | (1475–1698) | ||||
| Zinc [mg/d] | 9.96 | 10.99 | 11.94 | 13.38 | <0.0001 | 7.36 | 8.11 | 8.75 | 10.04 | <0.0001 | 8.71 | 9.52 | 10.34 | 11.68 | <0.0001 |
| (9.58–10.34) | (10.61–11.37) | (11.56–12.32) | (13.00–13.76) | (7.07–7.65) | (7.82–8.40) | (8.46–9.04) | (9.75–10.33) | (8.48–8.94) | (9.29–9.76) | (10.11–10.58) | (11.45–11.92) | ||||
| Zinc/1000 kcal | 5.35 | 5.20 | 5.07 | 4.93 | <0.0001 | 5.51 | 5.18 | 5.26 | 5.28 | 0.0459 | 5.43 | 5.19 | 5.16 | 5.12 | 0.0004 |
| (5.22–5.48) | (5.07–5.33) | (4.94–5.20) | (4.80–5.06) | (5.34–5.68) | (5.01–5.35) | (5.09–5.43) | (5.11–5.45) | (5.32–5.54) | (5.08–5.30) | (5.05–5.28) | (5.00–5.23) | ||||
| Iron [mg/d] | 10.26 | 11.58 | 13.29 | 15.12 | <0.0001 | 8.50 | 9.42 | 10.65 | 12.79 | <0.0001 | 9.39 | 10.50 | 11.91 | 13.99 | <0.0001 |
| (9.81–10.72) | (11.13–12.04) | (12.83–13.74) | (14.67–15.58) | (7.94–9.05) | (8.86–9.97) | (10.10–11.20) | (12.24–13.34) | (9.03–9.76) | (10.14–10.87) | (11.54–12.28) | (13.62–14.35) | ||||
| Iron/1000 kcal | 5.52 | 5.56 | 5.68 | 5.62 | 0.5867 | 6.30 | 6.07 | 6.48 | 6.70 | 0.0567 | 5.89 | 5.82 | 6.06 | 6.19 | 0.0411 |
| (5.35–5.69) | (5.39–5.73) | (5.51–5.85) | (5.45–5.79) | (5.97–6.63) | (5.75–6.40) | (6.15–6.80) | (6.37–7.03) | (5.69–6.09) | (5.63–6.02) | (5.86–6.26) | (5.99–6.39) | ||||
| Manganese [mg/d] | 3.67 | 4.40 | 4.85 | 5.80 | <0.0001 | 3.18 | 3.79 | 4.21 | 4.92 | <0.0001 | 3.43 | 4.09 | 4.54 | 5.36 | <0.0001 |
| (3.50–3.83) | (4.24–4.57) | (4.69–5.02) | (5.63–5.96) | (3.05–3.31) | (3.66–3.92) | (4.08–4.34) | (4.79–5.05) | (3.33–3.53) | (3.99–4.20) | (4.43–4.64) | (5.25–5.46) | ||||
| Manganese/1000 kcal | 2.10 | 2.19 | 2.17 | 2.23 | 0.1706 | 2.50 | 2.55 | 2.62 | 2.65 | 0.1216 | 2.29 | 2.37 | 2.39 | 2.45 | 0.0067 |
| (2.02–2.18) | (2.10–2.27) | (2.09–2.25) | (2.15–2.31) | (2.41–2.60) | (2.46–2.65) | (2.52–2.71) | (2.56–2.75) | (2.23–2.36) | (2.31–2.44) | (2.33–2.46) | (2.39–2.51) | ||||
| Copper [mg/d] | 0.96 | 1.13 | 1.32 | 1.61 | <0.0001 | 0.79 | 0.96 | 1.10 | 1.39 | <0.0001 | 0.87 | 1.05 | 1.21 | 1.50 | <0.0001 |
| (0.92–0.99) | (1.09–1.17) | (1.28–1.36) | (1.58–1.65) | (0.75–0.82) | (0.93–1.00) | (1.07–1.13) | (1.36–1.43) | (0.85–0.90) | (1.02–1.07) | (1.18–1.23) | (1.48–1.53) | ||||
| Copper/1000 kcal | 0.523 | 0.548 | 0.575 | 0.607 | <0.0001 | 0.594 | 0.626 | 0.674 | 0.746 | <0.0001 | 0.557 | 0.587 | 0.624 | 0.679 | <0.0001 |
| (0.507–0.538) | (0.532–0.563) | (0.560–0.591) | (0.592–0.623) | (0.573–0.615) | (0.605–0.647) | (0.653–0.695) | (0.725–0.767) | (0.543–0.570) | (0.573–0.600) | (0.611–0.638) | (0.666–0.693) | ||||
| Variables | Men | Women | Total | |||||||||
|---|---|---|---|---|---|---|---|---|---|---|---|---|
| n = 2554 | n = 3136 | n = 5690 | ||||||||||
| Q1 | Q2 | Q3 | Q4 | Q1 | Q2 | Q3 | Q4 | Q1 | Q2 | Q3 | Q4 | |
| n = 638 | n = 639 | n = 638 | n = 639 | n = 784 | n = 784 | n = 784 | n = 784 | n = 1423 | n = 1422 | n = 1423 | n = 1422 | |
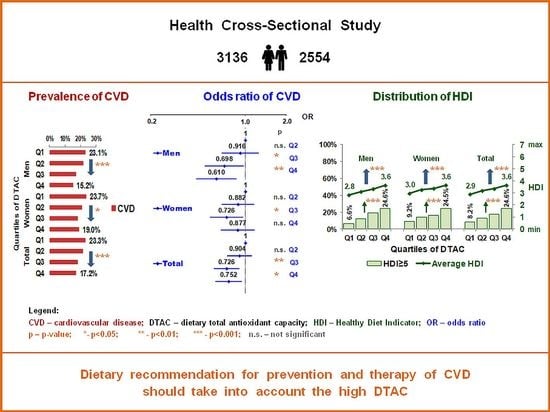
| CVD Prevalence % | 23.1 | 21.8 | 17.2 | 15.2 | 23.7 | 21.1 | 18.3 | 19.0 | 23.3 | 21.4 | 18.1 | 17.2 |
| (95% CI) A | (20.4–25.9) | (19.0–24.6) | (14.4–20.0) | (12.4–18.0) | (21.1–26.3) | (18.5–23.8) | (15.7–21.0) | (16.4–21.6) | (21.4–25.2) | (19.5–23.4) | (16.2–20.0) | (15.3–19.1) |
| p * | - | - | - | 0.0001 | - | - | - | 0.0205 | - | - | - | <0.0001 |
| OR | 1 | 0.921 | 0.643 | 0.563 | 1 | 0.796 | 0.650 | 0.617 | 1 | 0.852 | 0.666 | 0.593 |
| (95% CI) 1 | - | (0.710–1.196) | (0.487–0.848) | (0.424–0.749) | - | (0.629–1.006) | (0.510–0.829) | (0.483–0.788) | - | (0.716–1.015) | (0.555–0.799) | (0.492–0.714) |
| p | - | 0.5387 | 0.0018 | <0.0001 | - | 0.0562 | 0.0005 | 0.0001 | - | 0.0733 | <0.0001 | <0.0001 |
| AOR | 1 | 0.934 | 0.706 | 0.631 | 1 | 0.884 | 0.731 | 0.880 | 1 | 0.906 | 0.733 | 0.770 |
| (95% CI) 2 | - | (0.685–1.274) | (0.511–0.976) | (0.452–0.882) | - | (0.675–1.157) | (0.554–0.965) | (0.663–1.167) | - | (0.740–1.111) | (0.595–0.904) | (0.621–0.955) |
| p | - | 0.6654 | 0.0353 | 0.0071 | - | 0.3692 | 0.0268 | 0.3744 | - | 0.3432 | 0.0037 | 0.0176 |
| AOR | 1 | 0.916 | 0.698 | 0.610 | 1 | 0.882 | 0.726 | 0.877 | 1 | 0.904 | 0.726 | 0.752 |
| (95% CI) 3 | - | (0.671–1.251) | (0.504–0.967) | (0.436–0.855) | - | (0.673–1.155) | (0.550–0.958) | (0.660–1.165) | - | (0.737–1.108) | (0.588–0.895) | (0.605–0.935) |
| p | - | 0.5830 | 0.0306 | 0.0041 | - | 0.3604 | 0.0237 | 0.3636 | - | 0.3304 | 0.0028 | 0.0102 |
Publisher’s Note: MDPI stays neutral with regard to jurisdictional claims in published maps and institutional affiliations. |
© 2022 by the authors. Licensee MDPI, Basel, Switzerland. This article is an open access article distributed under the terms and conditions of the Creative Commons Attribution (CC BY) license (https://creativecommons.org/licenses/by/4.0/).
Share and Cite
Zujko, M.E.; Waśkiewicz, A.; Witkowska, A.M.; Cicha-Mikołajczyk, A.; Zujko, K.; Drygas, W. Dietary Total Antioxidant Capacity—A New Indicator of Healthy Diet Quality in Cardiovascular Diseases: A Polish Cross-Sectional Study. Nutrients 2022, 14, 3219. https://doi.org/10.3390/nu14153219
Zujko ME, Waśkiewicz A, Witkowska AM, Cicha-Mikołajczyk A, Zujko K, Drygas W. Dietary Total Antioxidant Capacity—A New Indicator of Healthy Diet Quality in Cardiovascular Diseases: A Polish Cross-Sectional Study. Nutrients. 2022; 14(15):3219. https://doi.org/10.3390/nu14153219
Chicago/Turabian StyleZujko, Małgorzata Elżbieta, Anna Waśkiewicz, Anna Maria Witkowska, Alicja Cicha-Mikołajczyk, Kinga Zujko, and Wojciech Drygas. 2022. "Dietary Total Antioxidant Capacity—A New Indicator of Healthy Diet Quality in Cardiovascular Diseases: A Polish Cross-Sectional Study" Nutrients 14, no. 15: 3219. https://doi.org/10.3390/nu14153219
APA StyleZujko, M. E., Waśkiewicz, A., Witkowska, A. M., Cicha-Mikołajczyk, A., Zujko, K., & Drygas, W. (2022). Dietary Total Antioxidant Capacity—A New Indicator of Healthy Diet Quality in Cardiovascular Diseases: A Polish Cross-Sectional Study. Nutrients, 14(15), 3219. https://doi.org/10.3390/nu14153219