
Essential Amino Acids-Rich Diet Decreased Adipose Tissue Storage in Adult Mice: A Preliminary Histopathological Study

 ,
, 

Abstract
1. Introduction
2. Materials and Methods
3. Results
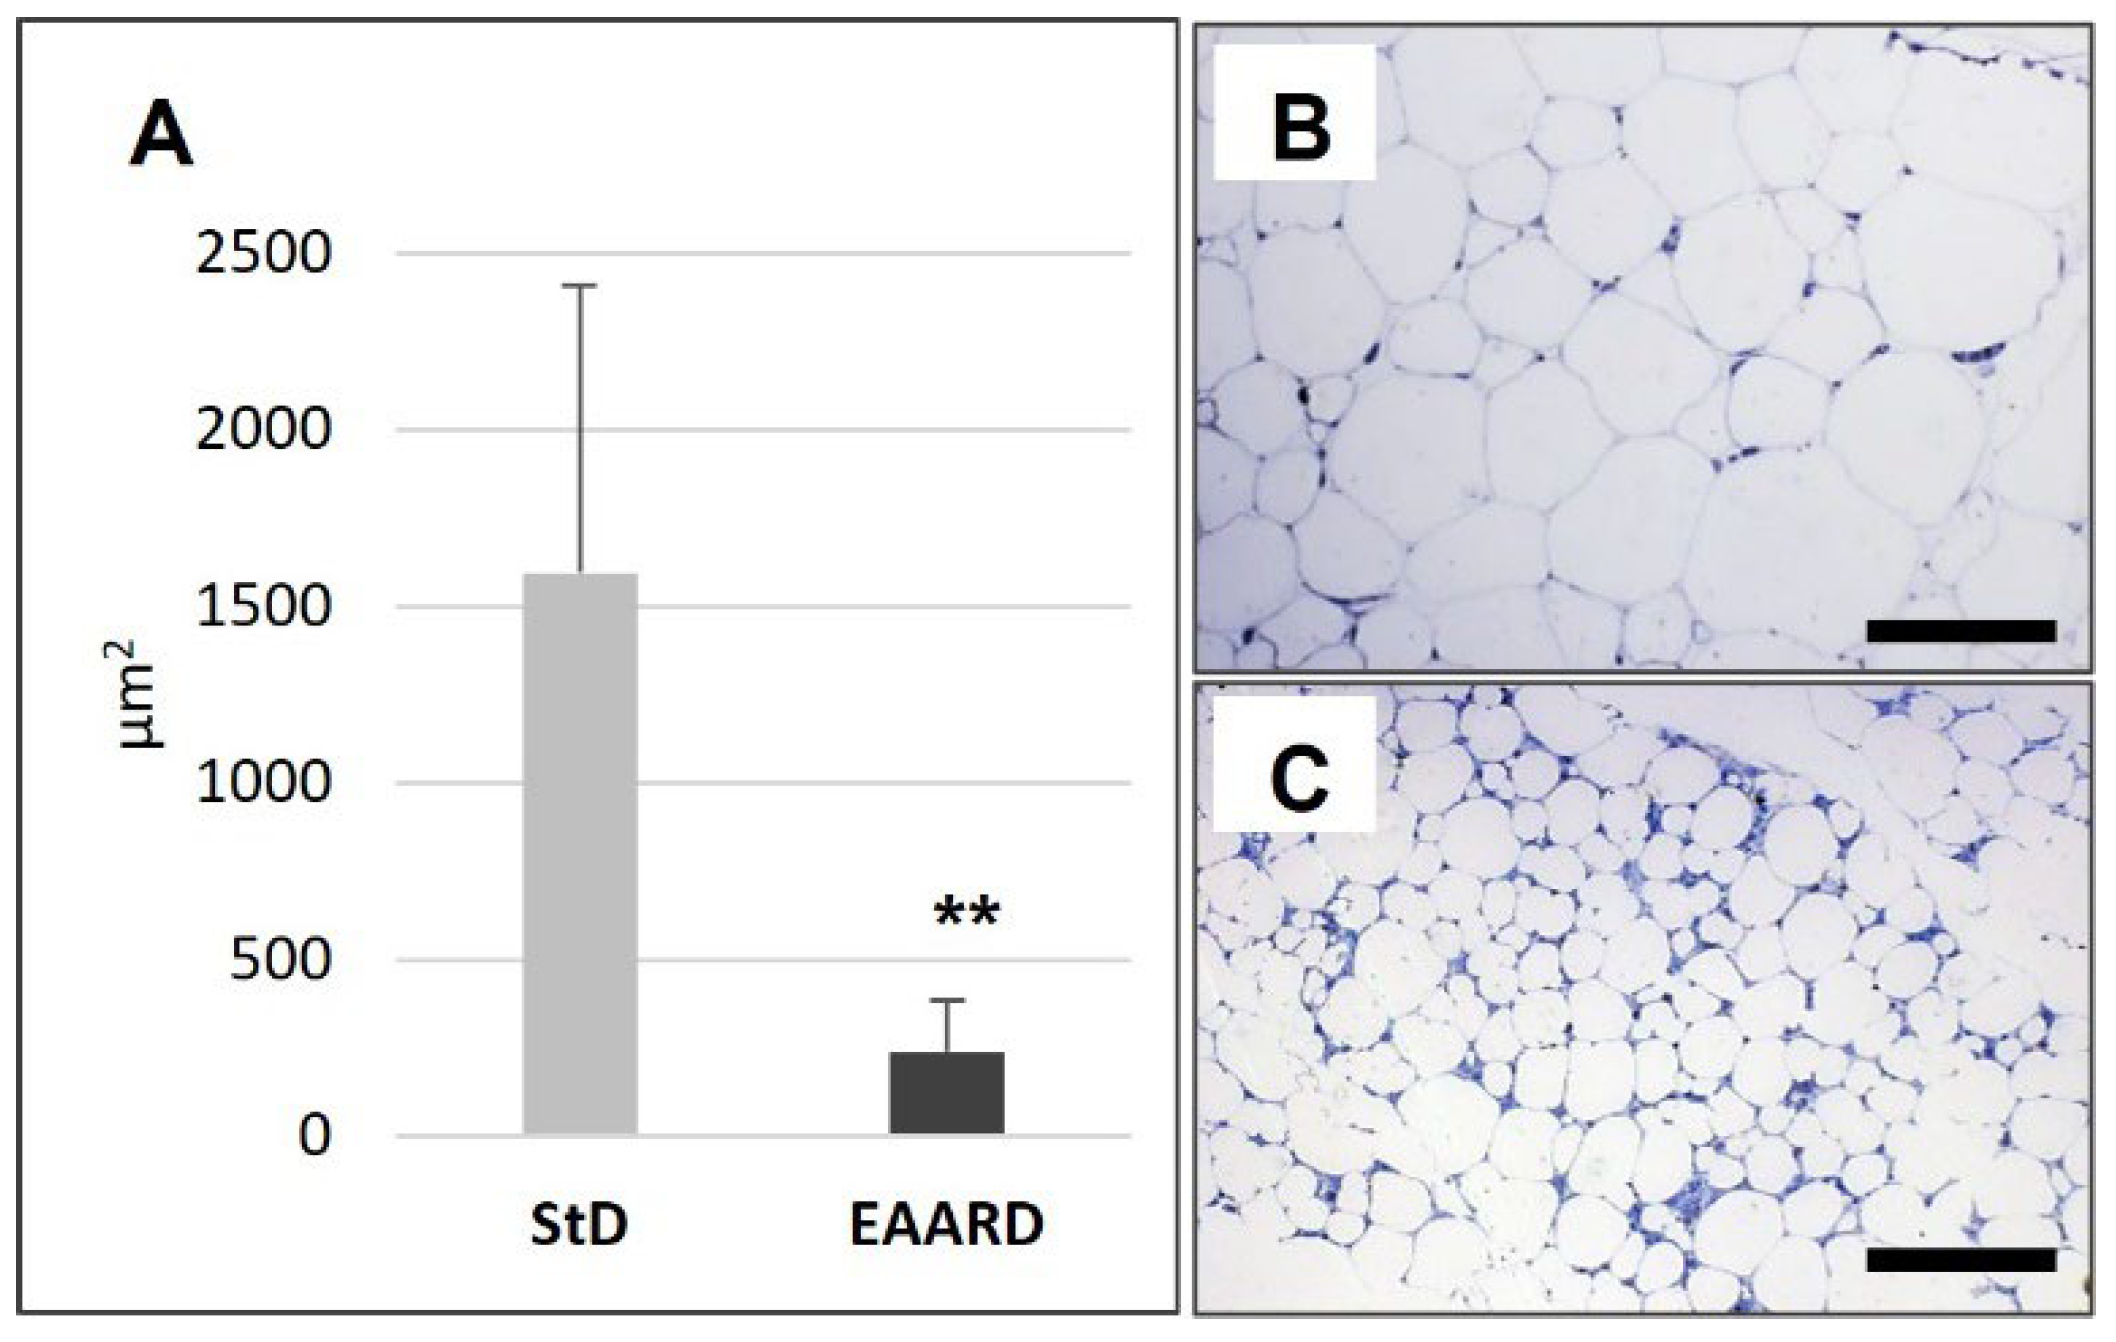
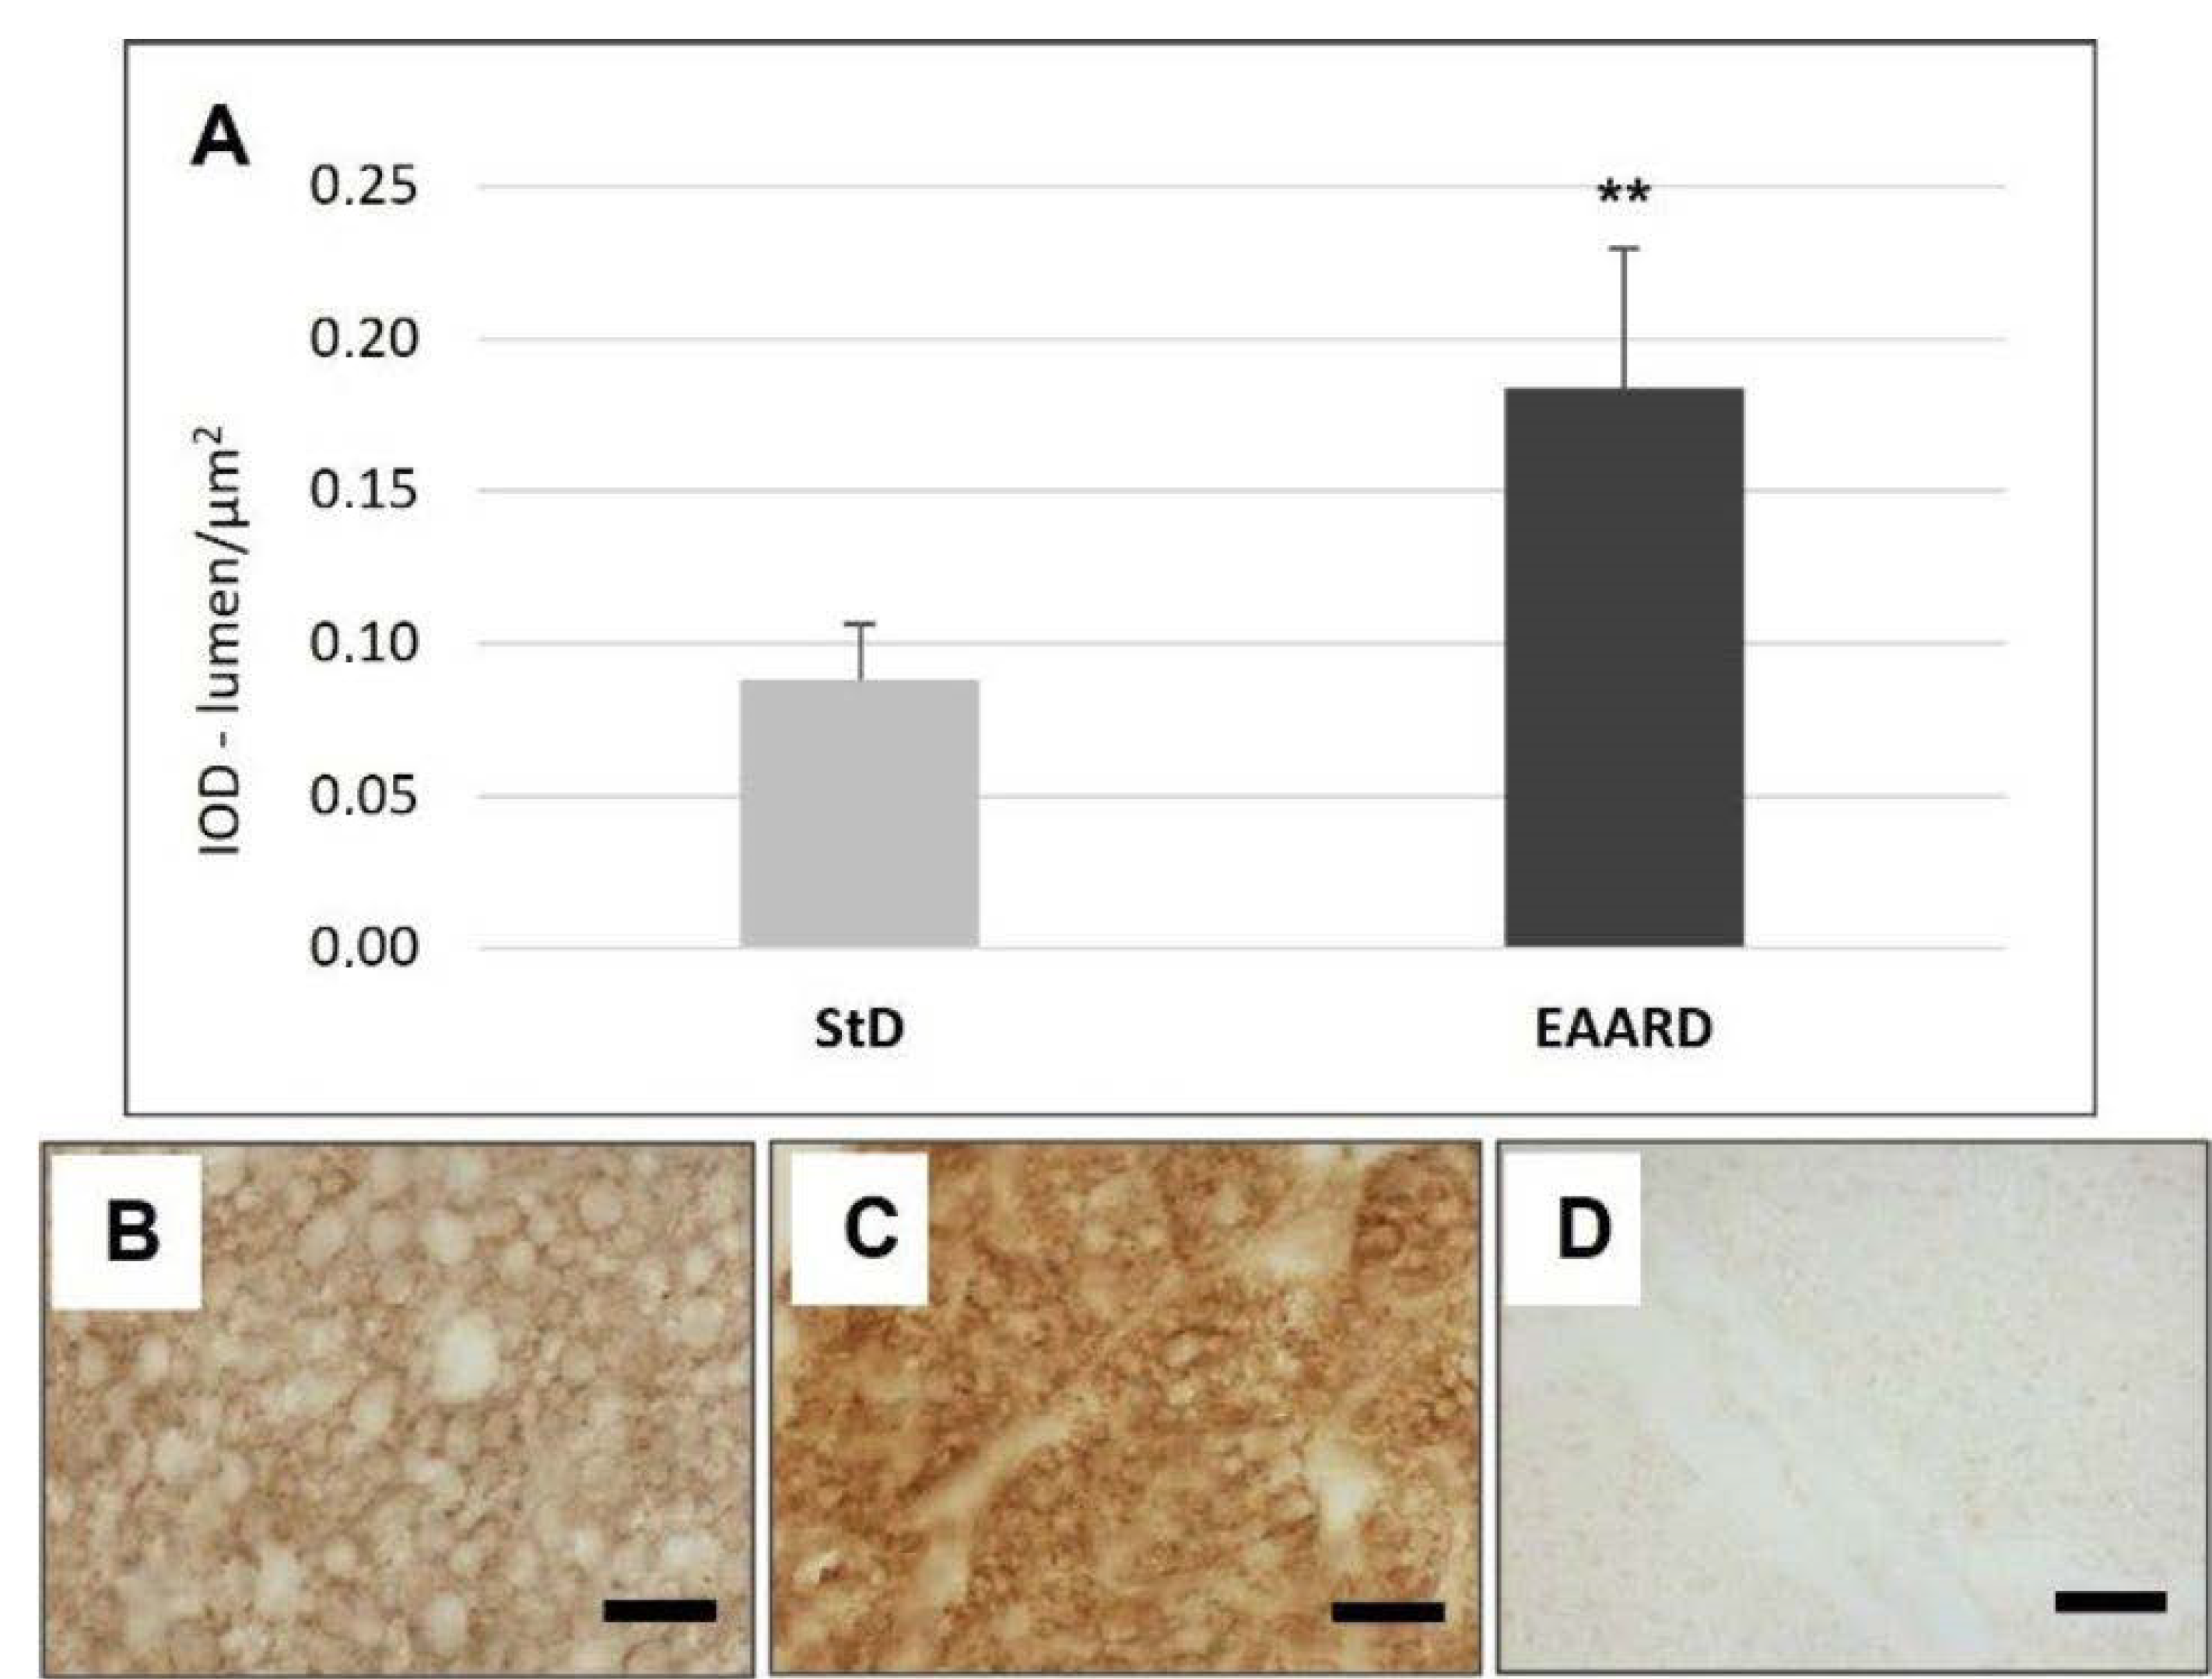
3.1. rpWAT
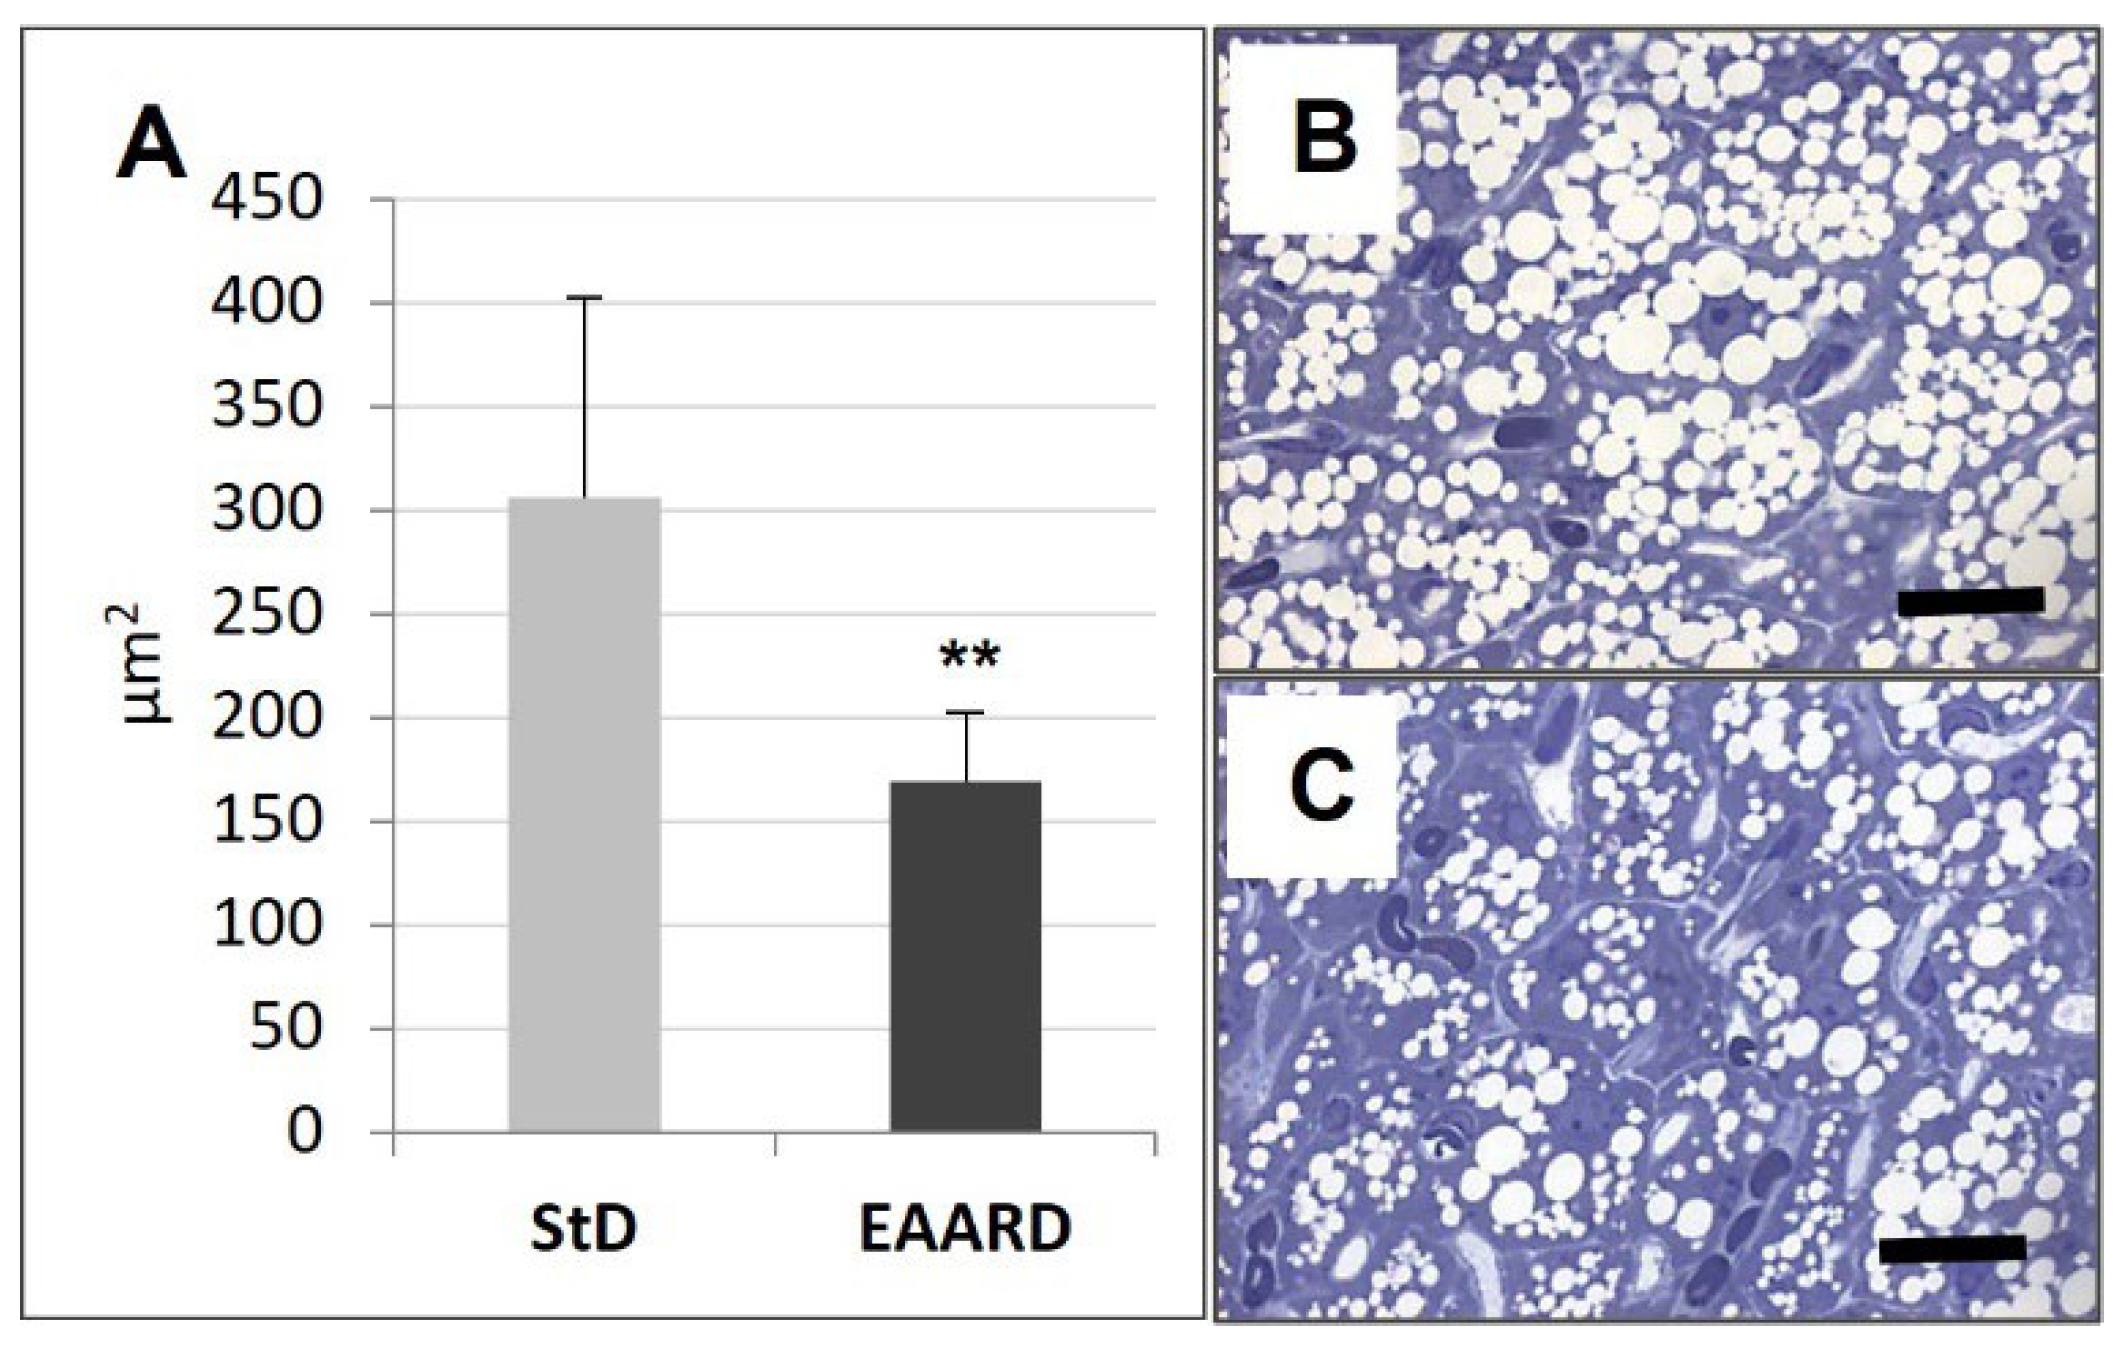
3.2. BAT
4. Discussion
4.1. Clinical Implications
4.2. Study Limitations
Author Contributions
Funding
Institutional Review Board Statement
Informed Consent Statement
Data Availability Statement
Conflicts of Interest
References
- Smerage, G.H. Matter and energy flows in biological and ecological systems. J. Theor. Biol. 1976, 57, 203–223. [Google Scholar] [CrossRef]
- Corsetti, G.; Pasini, E.; Romano, C.; Calvani, R.; Picca, A.; Marzetti, E.; Flati, V.; Dioguardi, F.S. Body weight loss and tissue wasting in late middle-aged mice on slightly imbalanced Essential/Non-essential Amino Acids diet. Front. Med. 2018, 5, 136. [Google Scholar] [CrossRef]
- Romano, C.; Corsetti, G.; Flati, V.; Pasini, E.; Picca, A.; Calvani, R.; Marzetti, E.; Dioguardi, F.S. Influence of diets with varying essential/nonessential amino acid ratios on mouse lifespan. Nutrients 2019, 11, 1367. [Google Scholar] [CrossRef]
- Ramarao, P.B.; Norton, H.W.; Johnson, B.C. The amino acid composition and nutritive value of proteins. V. Amino acid requirements as a pattern for protein evaluation. J. Nutr. 1964, 8, 88–92. [Google Scholar]
- Dioguardi, F.S. Clinical use of amino acids as dietary supplement: Pros and cons. J. Cachexia. Sarcopenia. Muscle 2011, 2, 75–80. [Google Scholar] [CrossRef] [PubMed]
- Walker, D.K.; Dickinson, J.M.; Timmerman, K.L.; Drummond, M.J.; Reidy, P.T.; Fry, C.S.; Gundermann, D.M.; Rasmussen, B.B. Exercise amino acids and aging in the control of human muscle protein synthesis. Med. Sci. Sports Exerc. 2011, 43, 2249–2258. [Google Scholar] [CrossRef] [PubMed]
- Corsetti, G.; Pasini, E.; D’Antona, G.; Nisoli, E.; Flati, V.; Assanelli, D.; Dioguardi, F.S.; Bianchi, R. Morphometric changes induced by amino acid supplementation in skeletal and cardiac muscles of old mice. Am. J. Cardiol. 2008, 101, S26–S34. [Google Scholar] [CrossRef] [PubMed]
- Flati, V.; Pasini, E.; D’Antona, G.; Speca, S.; Toniato, E.; Martinotti, S. Intracellular mechanisms of metabolism regulation: The role of signaling via the mammalian target of rapamycin pathway and other routes. Am. J. Cardiol. 2008, 101, 16E–21E. [Google Scholar] [CrossRef]
- D’Antona, G.; Ragni, M.; Cardile, A.; Tedesco, L.; Dossena, M.; Bruttini, F.; Caliaro, F.; Corsetti, G.; Bottinelli, R.; Carruba, M.O.; et al. Branched-chain amino acid supplementation promotes survival and supports cardiac and skeletal muscle mitochondrial biogenesis in middle-aged mice. Cell Metab. 2010, 12, 362–372. [Google Scholar] [CrossRef]
- Stacchiotti, A.; Corsetti, G.; Lavazza, A.; Rezzani, R. Microscopic features of mitochondria rejuvenation by amino acids. In Current Microscopy Contributions to Advances in Science and Technology; Méndez-Vilas, A., Ed.; Formatex Research Center: Badajoz, Spain, 2012; pp. 286–294. [Google Scholar]
- Corsetti, G.; Stacchiotti, A.; Tedesco, L.; D’Antona, G.; Pasini, E.; Dioguardi, F.S.; Nisoli, E.; Rezzani, R. Essential amino acid supplementation decreases liver damage induced by chronic ethanol consumption in rats. Int. J. Immunopathol. Pharmacol. 2011, 24, 611–619. [Google Scholar] [CrossRef]
- Corsetti, G.; D’Antona, G.; Ruocco, C.; Stacchiotti, A.; Romano, C.; Tedesco, L.; Dioguardi, F.S.; Rezzani, R.; Nisoli, E. Dietary supplementation with essential amino acids boots the beneficial effects of rosuvastatin on mouse kidney. Amino. Acids 2014, 46, 2189–2203. [Google Scholar] [CrossRef][Green Version]
- Corsetti, G.; Romano, C.; Pasini, E.; Marzetti, E.; Calvani, R.; Picca, A.; Flati, V.; Dioguardi, F.S. Diet enrichment with a specific essential free amino acid mixture improves healing of undressed wounds in aged rats. Exp. Geront. 2017, 96, 138–145. [Google Scholar] [CrossRef]
- Bonfili, L.; Cecarini, V.; Cuccioloni, M.; Angeletti, M.; Flati, V.; Corsetti, G.; Pasini, E.; Dioguardi, F.S.; Eleuteri, A.M. Essential amino acid mixtures drive cancer cells to apoptosis through proteasome inhibition and autophagy activation. FEBS J. 2017, 284, 1726–1737. [Google Scholar] [CrossRef]
- Zhang, Y.; Guo, K.; LeBlanc, R.E.; Loh, D.; Schwartz, G.J.; Yu, Y.H. Increasing dietary leucine intake reduces diet-induced obesity and improves glucose and cholesterol metabolism in mice via multimechanisms. Diabetes 2007, 56, 1647–1654. [Google Scholar] [CrossRef]
- Nairizi, A.; She, P.; Vary, T.C.; Lynch, C.J. Leucine supplementation of drinking water does not alter susceptibility to diet-induced obesity in mice. J. Nutr. 2009, 139, 715–719. [Google Scholar] [CrossRef]
- Nishimura, J.; Masaki, T.; Arakawa, M.; Seike, M.; Yoshimatsu, H. Isoleucine prevents the accumulation of tissue triglycerides and upregulates the expression of PPARalpha and uncoupling protein in diet-induced obese mice. J. Nutr. 2010, 140, 496–500. [Google Scholar] [CrossRef]
- Guo, F.; Cavener, D.R. The GCN2 eIF2alpha kinase regulates fatty-acid homeostasis in the liver during deprivation of an essential amino acid. Cell Metab. 2007, 5, 103–114. [Google Scholar] [CrossRef]
- Cheng, Y.; Meng, Q.; Wang, C.; Li, H.; Huang, Z.; Chen, S.; Xiao, F.; Guo, F. Leucine deprivation decreases fat mass by stimulation of lipolysis in white adipose tissue and upregulation of uncoupling protein 1 (UCP1) in brown adipose tissue. Diabetes 2010, 59, 17–25. [Google Scholar] [CrossRef]
- Xiao, F.; Huang, Z.; Li, H.; Yu, J.; Wang, C.; Chen, S.; Meng, Q.; Cheng, Y.; Gao, X.; Li, J.; et al. Leucine deprivation increases hepatic insulin sensitivity via GCN2/mTOR/S6K1 and AMPK pathways. Diabetes 2011, 60, 746–756. [Google Scholar] [CrossRef] [PubMed]
- Du, X.; Kim, Y.J.; Lai, S.; Chen, X.; Lizarzaburu, M.; Turcotte, S.; Fu, Z.; Liu, Q.; Zhang, Y.; Motani, A.; et al. Phenylalanine derivatives as GPR142 agonists for the treatment of type II diabetes. Bioorg. Med. Chem. Lett. 2012, 22, 6218–6223. [Google Scholar] [CrossRef] [PubMed]
- Xiao, F.; Du, Y.; Lv, Z.; Chen, S.; Zhu, J.; Sheng, H.; Guo, F. Effects of essential amino acids on lipid metabolism in mice and humans. J. Mol. Endocrinol. 2016, 57, 223–231. [Google Scholar] [CrossRef] [PubMed]
- Young, E.M. Food and Development, 1st ed.; Routledge: London, UK, 2012. [Google Scholar] [CrossRef]
- Combs, T.P.; Berg, A.H.; Rajala, M.W.; Klebanov, S.; Iyengar, P.; Jimenez-Chillaron, J.C.; Patti, M.E.; Klein, S.L.; Weinstein, R.S.; Scherer, P.E. Sexual differentiation, pregnancy, calorie restriction, and aging affect the adipocyte-specific secretory protein adiponectin. Diabetes 2003, 52, 268–276. [Google Scholar] [CrossRef]
- Qiao, L.; Lee, B.; Kinney, B.; Yoo, H.S.; Shao, J. Energy intake and adiponectin gene expression. Am. J. Physiol. Endocrinol. Metab. 2011, 300, E809–E816. [Google Scholar] [CrossRef]
- Wang, Z.; Masternak, M.M.; Al-Regaiey, K.A.; Bartke, A. Adipocytokines and the regulation of lipid metabolism in growth hormone transgenic and calorie-restricted mice. Endocrinology 2007, 148, 2845–2853. [Google Scholar] [CrossRef]
- Zhu, M.; Miura, J.; Lu, L.X.; Bernier, M.; DeCabo, R.; Lane, M.A.; Roth, G.S.; Ingram, D.K. Circulating adiponectin levels increase in rats on caloric restriction: The potential for insulin sensitization. Exp. Gerontol. 2004, 39, 1049–1059. [Google Scholar] [CrossRef]
- Enerbäck, S. The origins of brown adipose tissue. N. Engl. J. Med. 2009, 360, 2021–2023. [Google Scholar] [CrossRef]
- Potier, M.; Darcela, N.; Tome, D. Protein, amino acids and the control of food intake. Curr. Opin. Clin. Nutr. Metab. Care 2009, 12, 54–58. [Google Scholar] [CrossRef]
- Brennan, A.M.; Mantzoros, C.S. Drug Insight: The role of leptin in human physiology and pathophysiology—Emerging clinical applications. Nat. Clin. Pract. Endocrinol. Metab. 2006, 2, 318–327. [Google Scholar] [CrossRef] [PubMed]
- Bouret, S.; Levin, B.E.; Ozanne, S.E. Gene-environment interactions controlling energy and glucose homeostasis and the developmental origins of obesity. Physiol. Rev. 2015, 95, 47–82. [Google Scholar] [CrossRef] [PubMed]
- Asensio, C.S.; Arsenijevic, D.; Lehr, L.; Giacobino, J.P.; Muzzin, P.; Rohner-Jeanrenaud, F. Effects of leptin on energy metabolism in beta-less mice. Int. J. Obes. 2008, 32, 936–942. [Google Scholar] [CrossRef] [PubMed][Green Version]
- Lynch, C.J.; Gern, B.; Lloyd, C.; Hutson, S.M.; Eicher, R.; Vary, T.C. Leucine in food mediates some of the postprandial rise in plasma leptin concentrations. Am. J. Physiol. Endocrinol. Metab. 2006, 291, E621–E630. [Google Scholar] [CrossRef]
- Roh, C.; Han, J.R.; Tzatsos, A.; Kandror, K.V. Nutrient-sensing mTOR mediated pathway regulates leptin production in isolated rat adipocytes. Am. J. Physiol. Endocrinol. Metab. 2003, 284, E322–E330. [Google Scholar] [CrossRef]
- Lee, M.J.; Yang, R.Z.; Gong, D.W.; Fried, S.K. Feeding and insulin increase leptin translation. Importance of the leptin mRNA untranslated regions. J. Biol. Chem. 2007, 282, 72–80. [Google Scholar] [CrossRef]
- Barr, V.A.; Malide, D.; Zarnowski, M.J.; Taylor, S.I.; Cushman, S.W. Insulin stimulates both leptin secretion and production by rat white adipose tissue. Endocrinology 1997, 138, 4463–4472. [Google Scholar] [CrossRef]
- Mueller, W.M.; Gregoire, F.M.; Stanhope, K.L.; Mobbs, C.V.; Mizuno, T.M.; Warden, C.H.; Stern, J.S.; Havel, P.J. Evidence that glucose metabolism regulates leptin secretion from cultured rat adipocytes. Endocrinology 1998, 139, 551–558. [Google Scholar] [CrossRef]
- Cammisotto, P.G.; Gelinas, Y.; Deshaies, Y.; Bukowiecki, L.J. Regulation of leptin secretion from white adipocytes by insulin, glycolytic substrates, and amino acids. Am. J. Physiol. Endocrinol. Metab. 2005, 289, E166–E171. [Google Scholar] [CrossRef]
- Wueest, S.; Konrad, D. The role of adipocyte-specific IL-6-type cytokine signaling in FFA and leptin release. Adipocyte 2018, 7, 226–228. [Google Scholar] [CrossRef]
- Rotter, V.; Nagaev, I.; Smith, U. Interleukin-6 (IL-6) induces insulin resistance in 3T3-L1 adipocytes and is, like IL-8 and tumor necrosis factor-alpha, overexpressed in human fat cells from insulin-resistant subjects. J. Biol. Chem. 2003, 278, 45777–45784. [Google Scholar] [CrossRef] [PubMed]
- Scheller, J.; Grötzinger, J.; Rose-John, S. Updating IL-6 classic- and trans-signaling. Signal Transduct. 2006, 6, 240–259. [Google Scholar] [CrossRef]
- Müllberg, J.; Geib, T.; Jostock, T.; Hoischen, S.H.; Vollmer, P.; Voltz, N.; Heinz, D.; Galle, P.R.; Klouche, M.; Rose-John, S. IL-6-receptor independent stimulation of human gp130 by viral IL-6. J. Immunol. 2000, 164, 4672–4677. [Google Scholar] [CrossRef]
- Shirazi, R.; Palsdottir, V.; Collander, J.; Anesten, F.; Vogel, H.; Langlet, F.; Jaschke, A.; Schürmann, A.; Prévot, V.; Shao, R.; et al. Glucagon-like peptide 1 receptor induced suppression of food intake, and body weight is mediated by central IL-1 and IL-6. Proc. Natl. Acad. Sci. USA 2013, 110, 16199–16204. [Google Scholar] [CrossRef]
- Pal, M.; Febbraio, M.A.; Whitham, M. From cytokine to myokine: The emerging role of interleukin-6 in metabolic regulation. Immunol. Cell Biol. 2014, 92, 331–339. [Google Scholar] [CrossRef]
- Trujillo, M.E.; Sullivan, S.; Harten, I.; Schneider, S.H.; Greenberg, A.S.; Fried, S.K. Interleukin-6 regulates human adipose tissue lipid metabolism and leptin production in vitro. J. Clin. Endocrinol. Metab. 2004, 89, 5577–5582. [Google Scholar] [CrossRef]
- Schmidt-Arras, D.; Rose-John, S. IL-6 pathway in the liver: From physiopathology to therapy. J. Hepatol. 2016, 64, 1403–1415. [Google Scholar] [CrossRef]
- Scheller, J.; Chalaris, A.; Schmidt-Arras, D.; Rose-John, S. The pro- and anti-inflammatory properties of the cytokine interleukin-6. Biochim. Biophys. Acta. 2011, 1813, 878–888. [Google Scholar] [CrossRef]
- Fäldt, J.; Wernstedt, I.; Fitzgerald, S.M.; Wallenius, K.; Bergström, G.; Jansson, J.O. Reduced exercise endurance in interleukin-6-deficient mice. Endocrinology 2004, 145, 2680–2686. [Google Scholar] [CrossRef]
- Hubler, M.J.; Kennedy, A.J. Role of lipids in the metabolism and activation of immune cells. J. Nutr. Biochem. 2016, 34, 1–7. [Google Scholar] [CrossRef]
- Pellegrino, M.A.; Patrini, C.; Pasini, E.; Brocca, L.; Flati, V.; Corsetti, G.; D’Antona, G. Amino acid supplementation counteracts metabolic and functional damage of diabetic rat heart. Am. J. Cardiol. 2008, 101, S49–S56. [Google Scholar] [CrossRef]
- Pinderski Oslund, L.J.; Hedrick, C.C.; Olvera, T.; Hagenbaugh, A.; Territo, M.; Berliner, J.A.; Fyfe, A.I. Interleukin-10 blocks atherosclerotic events In Vitro and In Vivo. Arterioscler. Thromb. Vasc. Biol. 1999, 19, 2847–2853. [Google Scholar] [CrossRef]
- van Exel, E.; Gussekloo, J.; de Craen, A.J.M.; Frolich, M.; Bootsma-van der Wiel, A.; Westendorp, R.G.J. Low production capacity of interleukin-10 associates with the metabolic syndrome and type 2 diabetes: The Leiden 85-plus study. Diabetes 2002, 51, 1088–1092. [Google Scholar] [CrossRef]
- van Exel, E.; Gussekloo, J.; de Craen, A.J.M.; Bootsma-van der Wiel, A.; Frolich, M.; Westendorp, R.G.J. Inflammation and stroke: The Leiden 85-Plus Study. Stroke 2002, 33, 1135–1138. [Google Scholar] [CrossRef] [PubMed]
- Juge-Aubry, E.C.; Somm, E.; Pernin, A.; Alizadeh, N.; Giusti, V.; Dayer, J.M.; Meier, C.A. Adipose tissue is a regulated source of interleukin-10. Cytokine 2005, 29, 270–274. [Google Scholar] [PubMed]
- Kumada, M.; Kihara, S.; Ouchi, N.; Kobayashi, H.; Okamoto, Y.; Ohashi, K.; Maeda, K.; Nagaretani, H.; Kishida, K.; Maeda, N.; et al. Adiponectin specifically increased tissue inhibitor of metalloproteinase-1 through interleukin-10 expression in human macrophages. Circulation 2004, 109, 2046–2049. [Google Scholar] [CrossRef] [PubMed]
- Tourneur, L.; Chiocchia, G. FADD: A regulator of life and death. Trends Immunol. 2010, 31, 260–269. [Google Scholar] [CrossRef]
- Gómez-Angelats, M.; Cidlowski, J.A. Molecular evidence for the nuclear localization of FADD. Cell Death Differ. 2003, 10, 791–797. [Google Scholar] [CrossRef] [PubMed]
- Berg, A.H.; Combs, T.P.; Scherer, P.E. ACRP30/adiponectin: An adipokine regulating glucose and lipid metabolism. Trends Endocrinol. Metab. 2002, 13, 84–89. [Google Scholar] [CrossRef]
- Turer, A.T.; Scherer, P.E. Adiponectin: Mechanistic insights and clinical implications. Diabetologia 2012, 55, 2319–2326. [Google Scholar] [CrossRef]
- Lihn, A.S.; Pedersen, S.B.; Richelsen, B. Adiponectin: Action, regulation and association to insulin sensitivity. Obes. Rev. 2005, 6, 13–21. [Google Scholar] [CrossRef]
- Stefan, N.; Vozarova, B.; Funahashi, T.; Matsuzawa, Y.; Weyer, C.; Lindsay, R.S.; Youngren, J.F.; Havel, P.J.; Pratley, R.E.; Bogardus, C.; et al. Plasma adiponectin concentration is associated with skeletal muscle insulin receptor tyrosine phosphorylation, and low plasma concentration precedes a decrease in whole-body insulin sensitivity in humans. Diabetes 2002, 51, 1884–1888. [Google Scholar] [CrossRef]
- Krakoff, J.; Funahashi, T.; Stehouwer, C.D.; Schalkwijk, C.G.; Tanaka, S.; Matsuzawa, Y.; Kobes, S.; Tataranni, P.A.; Hanson, R.L.; Knowler, W.C.; et al. Inflammatory markers, adiponectin, and risk of type 2 diabetes in the Pima Indian. Diabetes Care 2003, 26, 1745–1751. [Google Scholar] [CrossRef]
- Lindsay, R.S.; Funahashi, T.; Hanson, R.L.; Matsuzawa, Y.; Tanaka, S.; Tataranni, P.A.; Knowler, W.C.; Krakoff, J. Adiponectin and development of type 2 diabetes in the Pima Indian population. Lancet 2002, 360, 57–58. [Google Scholar] [CrossRef]
- Bauche, I.B.; El Mkadem, S.A.; Pottier, A.M.; Senou, M.; Many, M.C.; Rezsohazy, R.; Penicaud, L.; Maeda, N.; Funahashi, T.; Brichard, S.M. Overexpression of adiponectin targeted to adipose tissue in transgenic mice: Impaired adipocyte differentiation”. Endocrinology 2007, 148, 1539–1549. [Google Scholar] [CrossRef] [PubMed]
- Yamauchi, T.; Kamon, J.; Waki, H.; Terauchi, Y.; Kubota, N.; Hara, K.; Mori, Y.; Ide, T.; Murakami, K.; Tsuboyama-Kasaoka, N.; et al. The fat-derived hormone adiponectin reverses insulin resistance associated with both lipoatrophy and obesity. Nat. Med. 2001, 7, 941–946. [Google Scholar] [CrossRef]
- Zimmermann, R.; Strauss, J.G.; Haemmerle, G.; Schoiswohl, G.; Birner-Gruenberger, R.; Riederer, M.; Lass, A.; Neuberger, G.; Eisenhaber, F.; Hermetter, A.; et al. Fat mobilization in adipose tissue is promoted by adipose triglyceride lipase. Science 2004, 306, 1383–1386. [Google Scholar] [CrossRef]
- Schreiber, R.; Xie, H.; Schweiger, M. Of mice and men: The physiological role of adipose triglyceride lipase (ATGL). Biochim. Biophy. Acta Mol. Cell Biol. Lipids 2019, 1864, 880–899. [Google Scholar] [CrossRef]
- Nielsen, T.S.; Vendelbo, M.H.; Jessen, N.; Pedersen, S.B.; Jørgensen, J.O.; Lund, S.; Møller, N. Fasting, but not exercise, increases adipose triglyceride lipase (ATGL) protein and reduces G(0)/G(1) switch gene 2 (G0S2) protein and mRNA content in human adipose tissue. J. Clin. Endocrinol. Metab. 2011, 96, E1293–E1297. [Google Scholar] [CrossRef]
- Wu, J.W.; Wang, S.P.; Casavant, S.; Moreau, A.; Yang, G.S.; Mitchell, G.A. Fasting energy homeostasis in mice with adipose deficiency of desnutrin/adipose triglyceride lipase. Endocrinology 2012, 153, 2198–2207. [Google Scholar] [CrossRef]
- Ricquier, D. Uncoupling protein 1 of brown adipocytes, the only uncoupler: A historical perspective. Front. Endocrinol. 2011, 2, 85. [Google Scholar] [CrossRef]
- Onyango, P.; Celic, I.; McCaffery, J.M.; Boeke, J.D.; Feinberg, A.P. SIRT3, a human SIR2 homologue, is an NAD-dependent deacetylase localized to mitochondria. Proc. Natl. Acad. Sci. USA 2002, 99, 13653–13658. [Google Scholar] [CrossRef]
- Anderson, R.M.; Weindruch, R. Metabolic reprogramming, caloric restriction and aging. Trends Endocrinol. Metab. 2010, 21, 134–141. [Google Scholar] [CrossRef]
- Miller, K.N.; Burhans, M.S.; Clark, J.P.; Howell, P.R.; Polewski, M.A.; DeMuth, T.M.; Eliceiri, K.W.; Lindstrom, M.J.; Ntambi, J.M.; Anderson, R.M. Aging and caloric restriction impact adipose tissue, adiponectin, and circulating lipids. Aging Cell 2017, 16, 497–507. [Google Scholar] [CrossRef]
- Lago, F.; Dieguez, C.; Gomez-Reino, J.; Gualillo, O. The emerging role of adipokines as mediators of inflammation and immune responses. Cytokine Growth Factor Rev. 2007, 18, 313–325. [Google Scholar] [CrossRef]
- Sethi, J.K.; Vidal-Puig, A.J. Thematic review series: Adipocyte biology. Adipose tissue function and plasticity orchestrate nutritional adaptation. J. Lipid Res. 2007, 48, 1253–1262. [Google Scholar] [CrossRef]
- Ouchi, N.; Parker, J.L.; Lugus, J.J.; Walsh, K. Adipokines in inflammation and metabolic disease. Nat. Rev. Immunol. 2011, 11, 85–97. [Google Scholar] [CrossRef]
- Heilbronn, L.K.; de Jonge, L.; Frisard, M.I.; DeLany, J.P.; Larson-Meyer, D.E.; Rood, J.; Nguyen, T.; Martin, C.K.; Volaufova, J.; Most, M.M.; et al. Pennington CALERIE Team. Effect of 6-month calorie restriction on biomarkers of longevity, metabolic adaptation, and oxidative stress in overweight individuals: A randomized controlled trial. JAMA 2006, 295, 1539–1548. [Google Scholar] [CrossRef]
- Ingram, D.K.; Anson, R.M.; de Cabo, R.; Mamczarz, J.; Zhu, M.; Mattison, J.; Lane, M.A.; Roth, G.S. Development of calorie restriction mimetics as a prolongevity strategy. Ann. N. Y. Acad. Sci. 2004, 1019, 412–423. [Google Scholar] [CrossRef]
- Ruocco, C.; Ragni, M.; Rossi, F.; Carullo, P.; Ghini, V.; Piscitelli, F.; Cutignano, A.; Manzo, E.; Ioris, R.M.; Bontems, F.; et al. Manipulation of dietary amino acids prevents and reverses obesity in mice through multiple mechanisms that modulate energy homeostasis. Diabetes 2020, 69, 2324–2339. [Google Scholar] [CrossRef]
- Dirks, A.J.; Leeuwenburgh, C. Caloric restriction in humans: Potential pitfalls and health concerns. Mech. Ageing Dev. 2006, 127, 1–7. [Google Scholar] [CrossRef]
- Weinheimer, E.M.; Sands, L.P.; Campbell, W.W. A systematic review of the separate and combined effects of energy restriction and exercise on fat-free mass in middle-aged and older adults: Implications for sarcopenic obesity. Nutr. Rev. 2010, 68, 375–388. [Google Scholar] [CrossRef]
- Fielding, R.A.; Vellas, B.; Evans, W.J.; Bhasin, S.; Morley, J.E.; Newman, A.B.; Abellan van Kan, G.; Andrieu, S.; Bauer, J.; Breuille, D.; et al. Sarcopenia: An undiagnosed condition in older adults. Current consensus definition: Prevalence, etiology, and consequences. International working group on sarcopenia. J. Am. Med. Dir. Assoc. 2011, 12, 249–256. [Google Scholar] [CrossRef]


| StD | EAARD | |
|---|---|---|
| KCal/Kg | 3952 | 3995 |
| Carbohydrates (%) | 54.61 | 61.76 |
| Lipids (%) | 7.5 | 6.12 |
| Nitrogen (%) | 21.8 ° | 20 * |
| Proteins: % of total N content | 95.93 | -- |
| Free AA: % of total N content | 4.07 | 100 |
| EAA/NEAA (% in grams) | - | 86/14 |
| Free AA composition (%) | ||
| l-Leucine (BCAA) | -- | 13.53 |
| l-Isoleucine (BCAA) | -- | 9.65 |
| l-Valine (BCAA) | -- | 9.65 |
| l-Lysine | 0.97 | 11.6 |
| l-Threonine | -- | 8.7 |
| l-Histidine | -- | 11.6 |
| l-Phenylalanine | -- | 7.73 |
| l-Methionine | 0.45 | 4.35 |
| l-Tyrosine | -- | 5.80 |
| l-Tryptophan | 0.28 | 3.38 |
| l-Cystine | 0.39 | 8.20 |
| l-Cysteine | -- | -- |
| l-Alanine | -- | -- |
| l-Glycine | 0.88 | -- |
| l-Arginine | 1.1 | -- |
| l-Proline | -- | -- |
| l-Glutamine | -- | -- |
| l-Serine | -- | 2.42 |
| l-Glutamic acid | -- | -- |
| l-Asparagine | -- | -- |
| l-Aspartic acid | -- | -- |
| Ornithine-αKG | -- | 2.42 |
| N-acetyl-cysteine | -- | 0.97 |
| StD | EAARD | t | p | |
|---|---|---|---|---|
| Food (g/day) | 4.43 ± 0.33 | 2.8 ± 0.23 * | 12.142 | 0.00 |
| Calories (Kcal/day) | 17.51 ± 1.3 | 11.19 ± 0.92 * | 11.906 | 0.00 |
| Heart | Kidney | Liver | Spleen | Triceps | rpWAT | BAT | |
|---|---|---|---|---|---|---|---|
| StD | 0.21 ± 0.02 | 0.58 ± 0.06 | 1.68 ± 0.2 | 0.15 ± 0.01 | 0.21 ± 0.03 | 0.16 ± 0.03 | 0.15 ± 0.02 |
| EAARD | 0.18 ± 0.02 * | 0.48 ± 0.04 * | 1.46 ± 0.03 * | 0.12 ± 0.02 * | 0.27 ± 0.02 * | 0.01 ± 0.00 * | 0.11 ± 0.05 * |
| t | 3.286 | 4.140 | 3.088 | 4.431 | 4.968 | 14.137 | 2.489 |
| p | 0.002 | 0.000 | 0.004 | 0.000 | 0.000 | 0.000 | 0.025 |
| Heart/bw | Kidney/bw | Liver/bw | Spleen/bw | Triceps/bw | rpWAT/bw | BAT/bw | |
|---|---|---|---|---|---|---|---|
| StD | 0.72 ± 0.04 | 2.02 ± 0.23 | 5.89 ± 0.92 | 0.54 ± 0.05 | 0.72 ± 0.03 | 0.57 ± 0.09 | 0.51 ± 0.04 |
| EAARD | 0.70 ± 0.02 | 1.84 ± 0.14 | 5.57 ± 0.24 | 0.47 ± 0.04 * | 1.03 ± 0.06 * | 0.04 ± 0.02 * | 0.41 ± 0.17 |
| t | 1.309 | 1.982 | 0.962 | 3.315 | 15.263 | 16.389 | 1.958 |
| p | 0.381 | 0.095 | 0.672 | 0.002 | 0.000 | 0.000 | 0.100 |
Publisher’s Note: MDPI stays neutral with regard to jurisdictional claims in published maps and institutional affiliations. |
© 2022 by the authors. Licensee MDPI, Basel, Switzerland. This article is an open access article distributed under the terms and conditions of the Creative Commons Attribution (CC BY) license (https://creativecommons.org/licenses/by/4.0/).
Share and Cite
Corsetti, G.; Romano, C.; Codenotti, S.; Pasini, E.; Fanzani, A.; Dioguardi, F.S. Essential Amino Acids-Rich Diet Decreased Adipose Tissue Storage in Adult Mice: A Preliminary Histopathological Study. Nutrients 2022, 14, 2915. https://doi.org/10.3390/nu14142915
Corsetti G, Romano C, Codenotti S, Pasini E, Fanzani A, Dioguardi FS. Essential Amino Acids-Rich Diet Decreased Adipose Tissue Storage in Adult Mice: A Preliminary Histopathological Study. Nutrients. 2022; 14(14):2915. https://doi.org/10.3390/nu14142915
Chicago/Turabian StyleCorsetti, Giovanni, Claudia Romano, Silvia Codenotti, Evasio Pasini, Alessandro Fanzani, and Francesco S. Dioguardi. 2022. "Essential Amino Acids-Rich Diet Decreased Adipose Tissue Storage in Adult Mice: A Preliminary Histopathological Study" Nutrients 14, no. 14: 2915. https://doi.org/10.3390/nu14142915
APA StyleCorsetti, G., Romano, C., Codenotti, S., Pasini, E., Fanzani, A., & Dioguardi, F. S. (2022). Essential Amino Acids-Rich Diet Decreased Adipose Tissue Storage in Adult Mice: A Preliminary Histopathological Study. Nutrients, 14(14), 2915. https://doi.org/10.3390/nu14142915