
Lifestyle Screening Tools for Children in the Community Setting: A Systematic Review

 , , , ,
  and
and
Abstract
:1. Introduction
- (1)
- What lifestyle screening tools for children in the community setting are available?
- (2)
- What are the main features of these lifestyle screening tools regarding design, psychometric properties (i.e., reliability and validity) and implementation?
2. Materials and Methods
2.1. Search Strategy
2.2. Eligibility Criteria
- The study described a screening tool to identify lifestyle risk (factors) on an individual level for
- children up to 18 years of age in
- the community setting.
- The tool had to be applied by a parent/caregiver, health professional (e.g., physician, nurse) or by the child him- or herself, and
- the study was published in English or Dutch
- between January 2004 and July 2020.
- studies reporting on lifestyle questionnaires, with a purpose other than screening for lifestyle risk (factors) on an individual level (e.g., general questionnaires in national surveys);
- studies on lifestyle assessment tools (e.g., (derivatives of) food frequency questionnaires, diet quality scores, anthropometry);
- studies on a single specific lifestyle or nutrition factor (e.g., solely screen time or vegetable intake);
- studies reporting prevalence rates of malnutrition or growth charts as a measure of nutrition risk;
- tools to identify eating disorders;
- tools developed for hospital settings or specific patient groups;
- commentaries and conference abstracts.
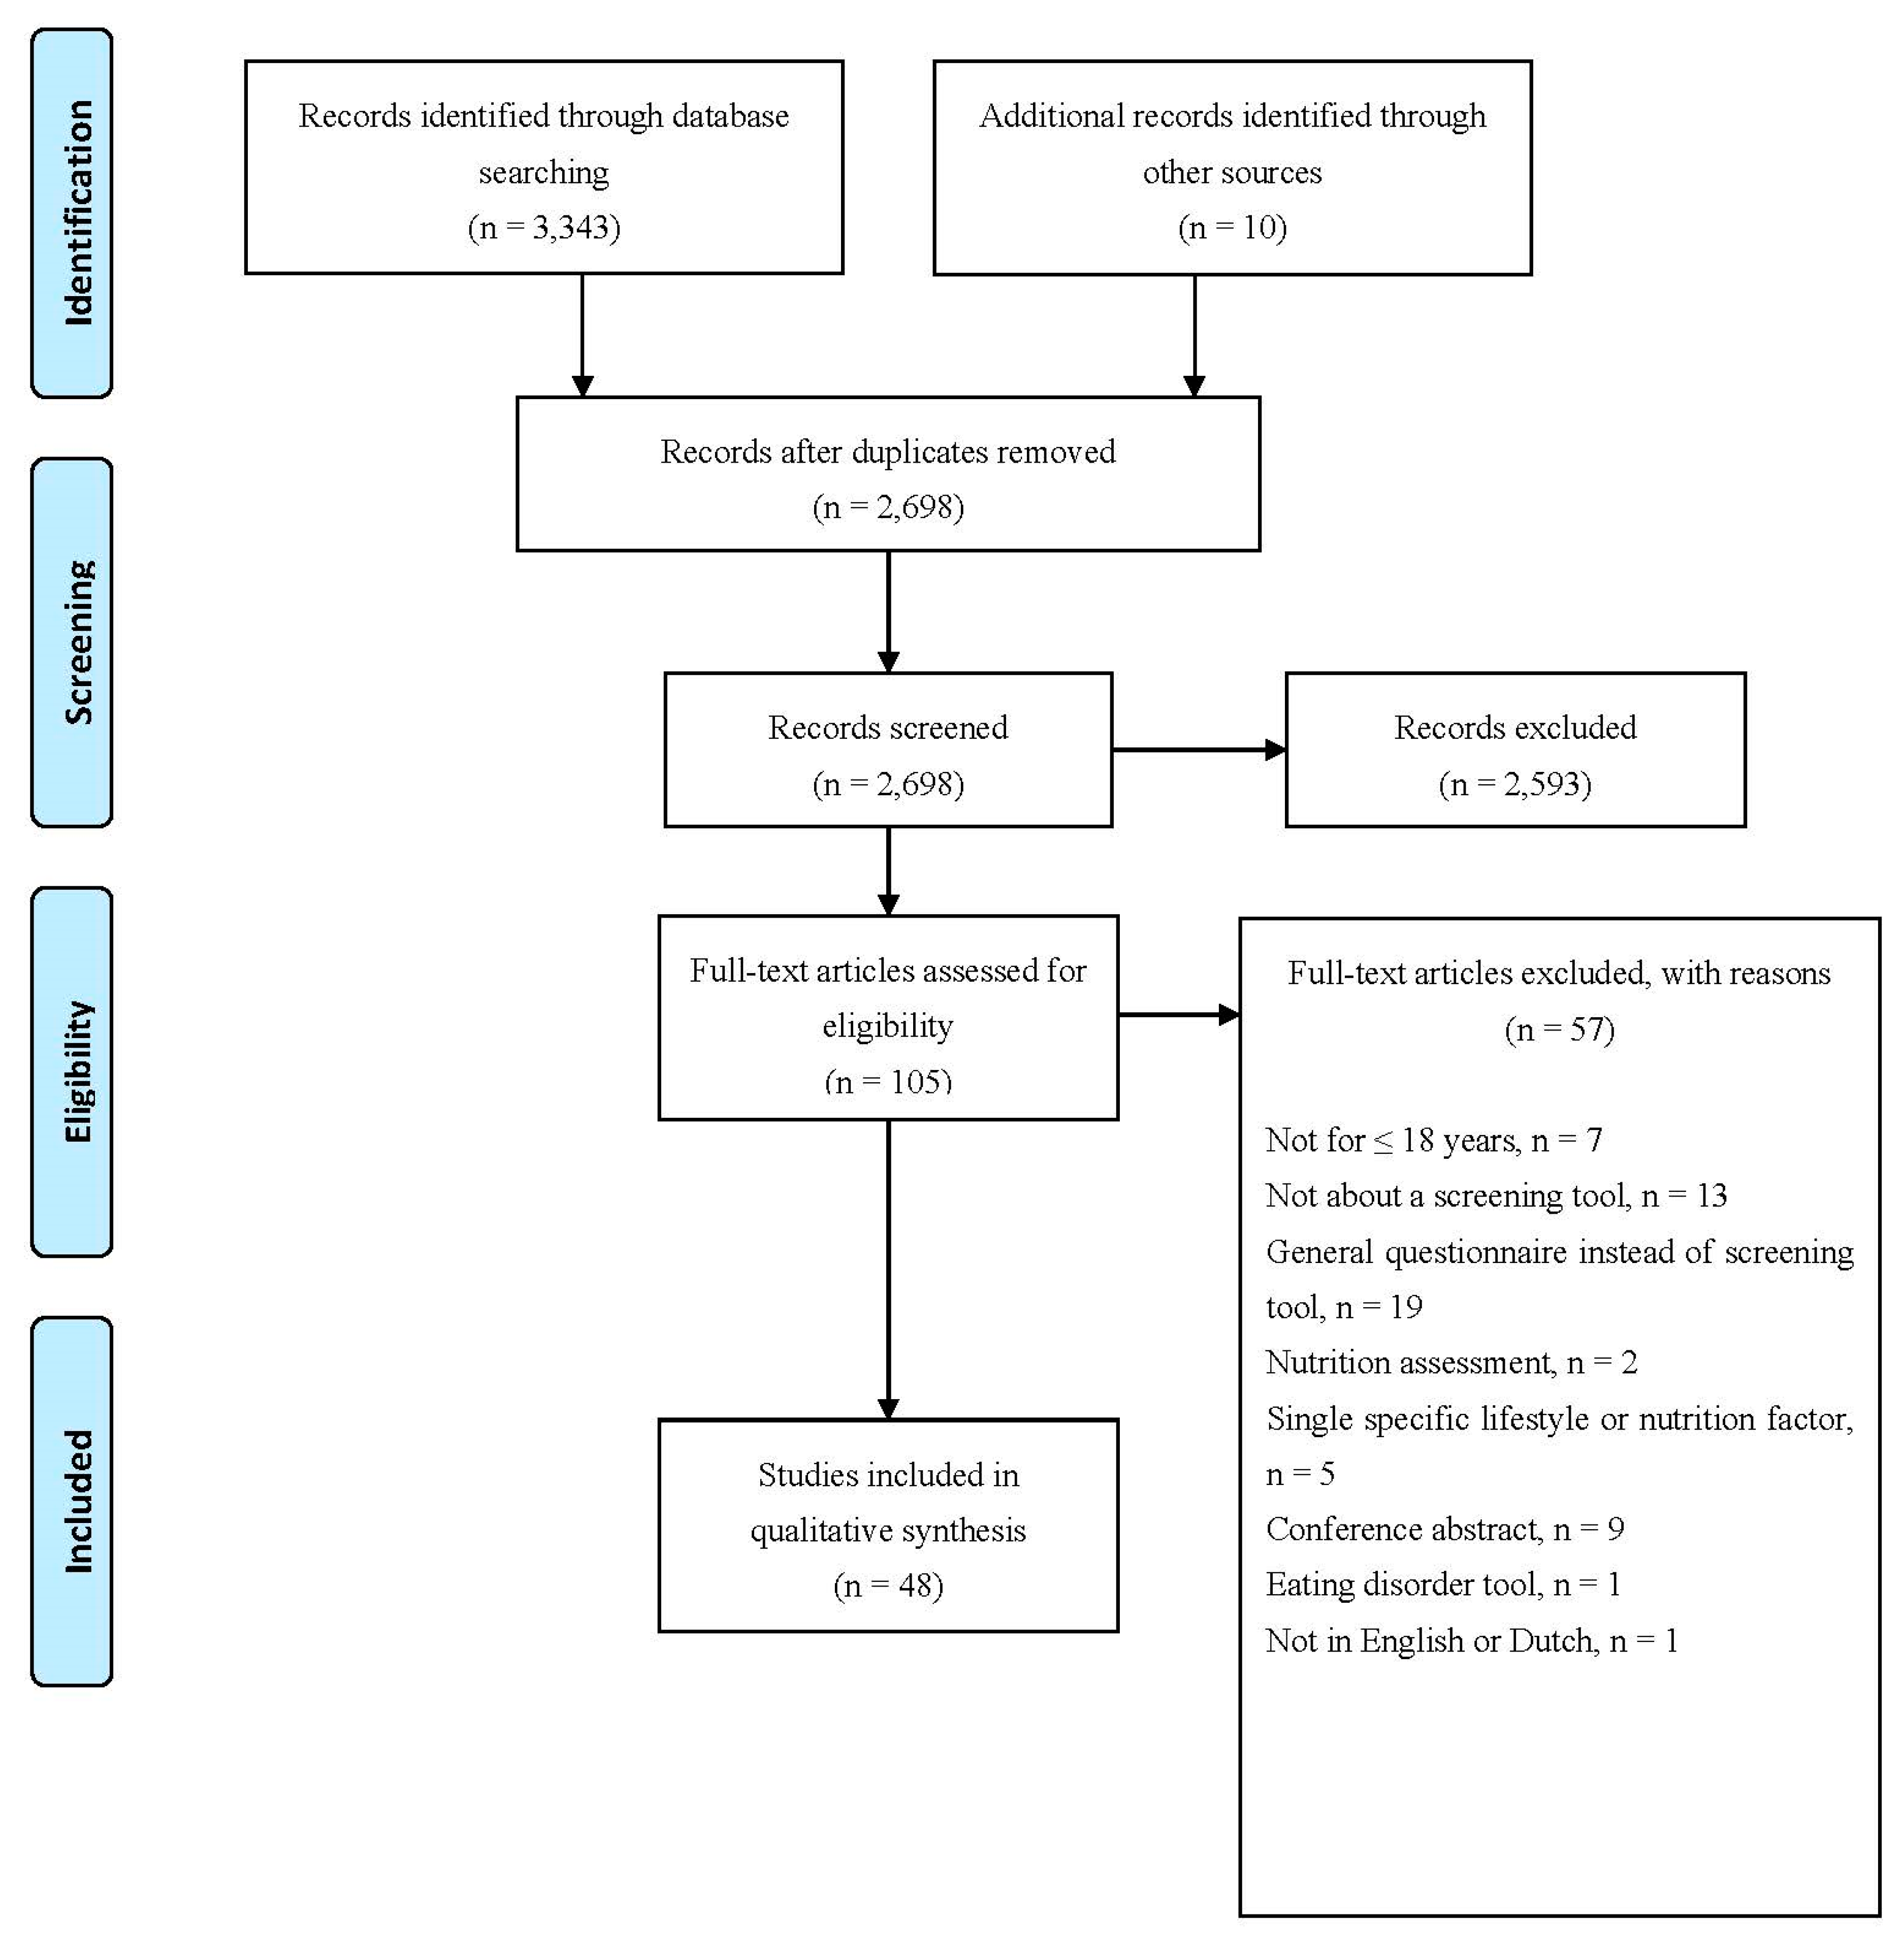
2.3. Screening, Selection and Data Extraction
2.4. Data Analysis
3. Results
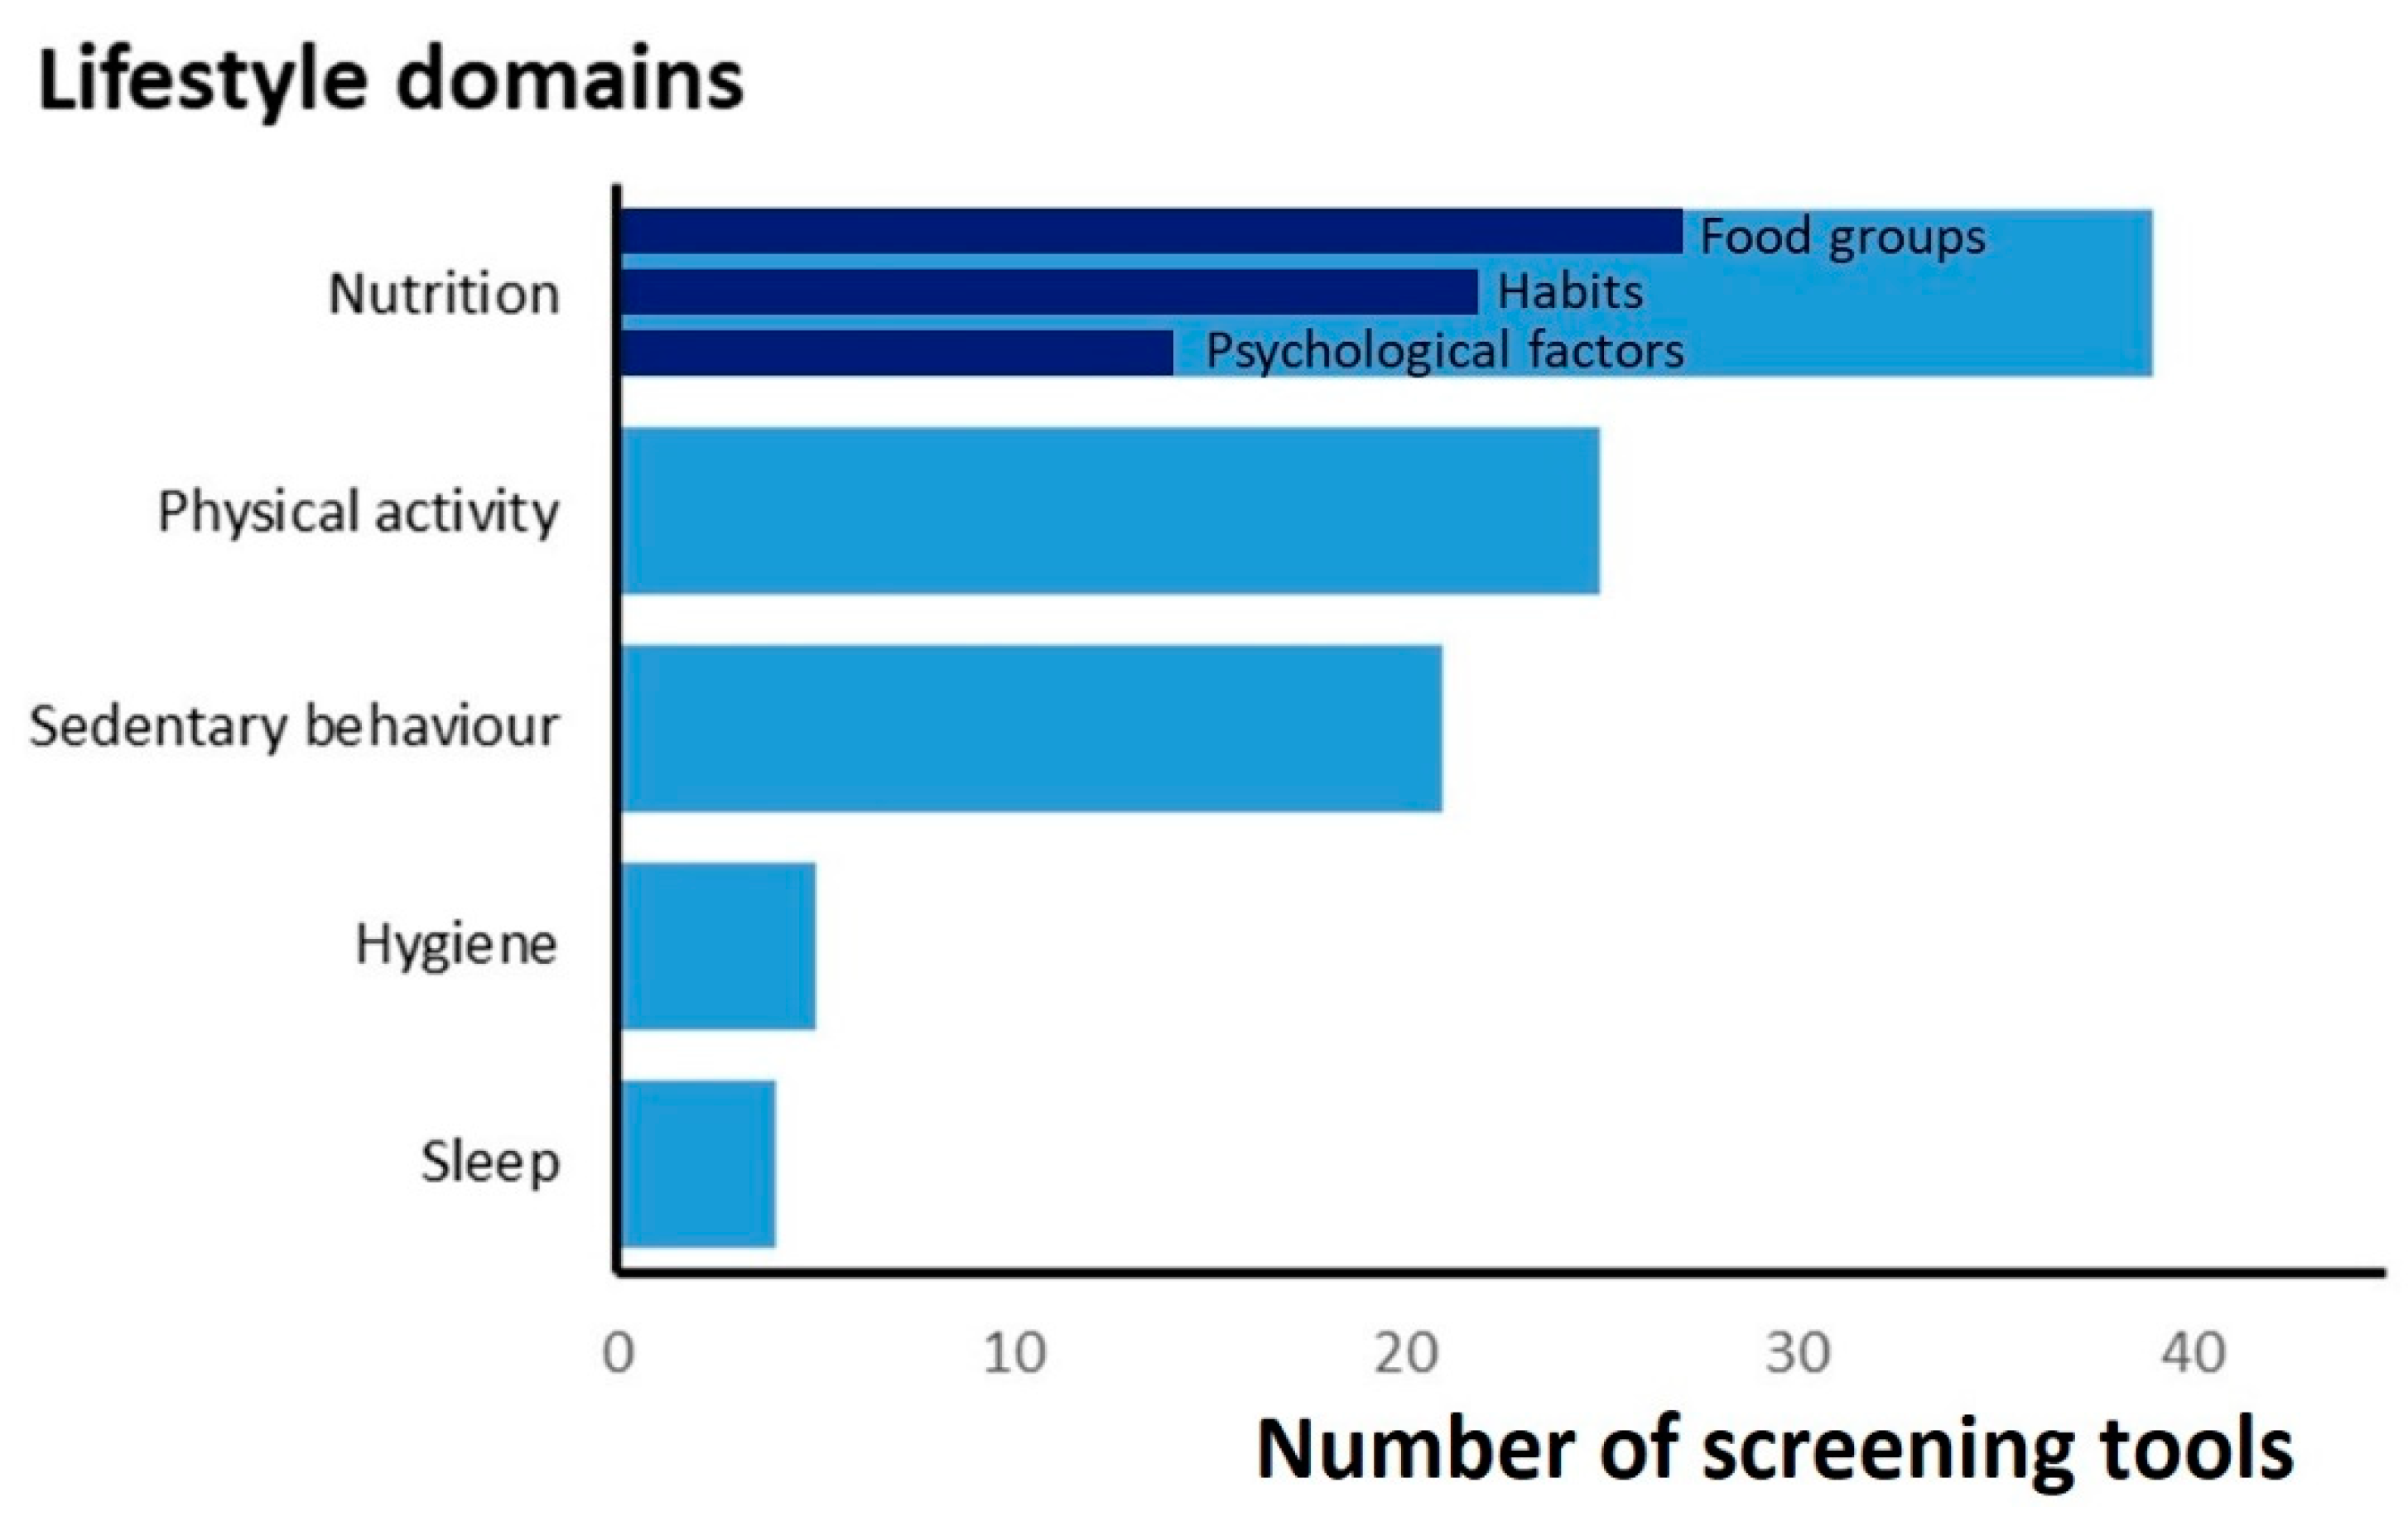
3.1. Design of Screening Tools

| Tool Name | Tool Aim | Target Population | Administered by | Number of Items | Item Response Format | Tool Scoring | Prospect of Action |
|---|---|---|---|---|---|---|---|
| 1. NutricheQ [18,19,20] | Assess dietary risk | Toddlers | Parent b | 11 c | 3-point Likert scale | Subsection score and total score; ranging from 0 to 22 Cut-offs for low, moderate and high risk are available per section | Tool identifies children who may need blood screening and nutritional intervention |
| 2. Toddler Feeding Questionnaire (TFQ) [21] | Assess indulgent, authoritative and environmental feeding practices | Toddlers | Parent a | 24 | 5-point Likert scale (never-always) | Subscale scores | NR |
| 3. Toddler NutriSTEP [22] | Assess nutritional risk | Toddlers | Parent b | 17 | Likert-type scale | Total score; ranging from 0 to 68 Cut-offs for low, moderate and high risk | Treat impaired state and refer to needed services |
| 4. Toddler Dietary Questionnaire (TDQ) [23] | Assess dietary risk | Toddlers | Parent b | 19 | Likert-type scale | Total score; ranging from 0 to 100 Cut-offs for low, moderate, high and very high dietary risk | Health care professionals may refer to a dietitian based on identified risk |
| 5. Child Eating Behavior Questionnaire (CEBQ) [24] | Assess eating behaviours | Preschoolers | Parent b | 35 | 5-point Likert scale (never-always) | Subscale scores | NR |
| 6. Nutrition Screening Tool for Every Preschooler (NutriSTEP) [25,26,27] | Assess nutritional risk | Preschoolers | Parent b | 17 | Likert-type scale (varying) | Total score; ranging from 0 to 68 Cut-offs for low, moderate and high risk | Parents receive results, customised feedback and resources such as links to credible health information websites |
| 7. Preschooler Dietary Questionnaire (PDQ) [28] | Assess diet and provide a dietary risk score | Preschoolers | Parent b | 19 | Likert-type scale | Total score; ranging from 0 to 100 Cut-offs for low, moderate, high and very high dietary risk | Health care professionals may refer to a dietitian based on identified risk |
| 8. Preschoolers Diet–Lifestyle Index (PDL-index) [29] | Assess adherence to diet–lifestyle recommendations | Preschoolers | Health care professional b | 11 | Likert-type scale (varying) | Total score; ranging from 0 to 44 | Tool may guide health care professionals in counselling parents and policy makers in developing interventions |
| 9. Healthy Kids [30] | Assess diet, lifestyle and parenting domains to determine obesity risk | Children aged 2–5 y from low-income families | Parent a,b | 19 | Combination of closed and open questions | Total score; ranging from 19 to 95 | Tool can be used to target counselling or nutrition education for families and to supplement physical examination |
| 10. Tool by Das and Ghosh [31] | Assess nutrition knowledge | Children aged 3–6 y | Parent a | 32 | Closed questions | Total score; ranging 0–32 | NR |
| 11. Start the Conversation 4–12 (STC-4–12) [32] | Assess and counsel nutrition and PA barriers and behaviours | Children aged 4–12 y | Parent a,b | 22 | Likert-type scale (varying) | No score | The tool provides tips that serve as cues for action for parents and guide counselling by health care professionals |
| 12. Healthy Families Survey [33] | Assess nutrition and PA behaviours | Elementary school children | Parent a,b | 45 | Combination of closed and open questions | Subscale scores | NR |
| 13. Knowledge, Attitudes and Habits (KAH-) questionnaire [34] | Assess knowledge, attitudes and habits towards a healthy lifestyle | Elementary school children | Child a | 48 | 3-point Likert scale | Subscale scores and total score; ranging from 0 to 96 | NR |
| 14. Parental Self-efficacy Questionnaire [35] | Assess parental self-efficacy for enacting healthy diet and PA behaviours in their children | Children aged 6–11 y | Parent a | 34 | 11-point Likert scale | Subscale scores and total score; ranging from 0 to 340 | NR |
| 15. Tool by Chacko and Ganesan [36] | Assess dietary gaps | School children aged 6–17 y | Child a | 10 | 2-point Likert scales (yes–no) | Total score; ranging from 0 to 10 | Parents and children can receive corrective counselling on the identified gaps |
| 16. Food, Health and Choices questionnaire (FHC-Q) [37] | Assess energy balance behaviours and related theory-based psychosocial determinants | Upper elementary school children | Child a | 116 | Likert-type scale | Subscale scores | NR |
| 17. Healthy Eating and Physical Activity Self-Efficacy Questionnaire for Children (HEPASEQ-C) [38] | Assess self-efficacy of healthy eating and PA | Upper elementary school children | Child a | 9 | 3-point Likert scale (there is no way I can do this–I believe I can do this) | Total score; ranging from 9 to 27 | NR |
| 18. Healthy Eating and Physical Activity Behavior Recall Questionnaire for Children (HEPABRQ-C) [38] | Assess recall of healthy eating and PA | Upper elementary school children | Child a | 10 | Combination of closed and open questions | Total score; ranging from 0 to 21 | NR |
| 19. Eating Behavior Questionnaire for School Children [39] | Assess eating behaviours | School children | Child a | 23 | 5-point Likert scale (never-always) | Subscore per domain | NR |
| 20. Tool by Drouin and Winickoff [40] | Assess health-related behavioural risk factors | Children aged 0–18 y | Parent b | 3 | Closed questions | No score | Parents receive a handout with information about identified risk factors Health care professionals receive the survey results and an evidence-based suggested course of action |
| 21. Child Nutrition and Physical Activity (CNPA) Screening Tool [41] | Assess behaviours that increase the risk of obesity | Children aged 2–18 y | Parent a,b | 22 | 4-point Likert scale and open questions | Subscores for generated readiness to change and perception factors only | Tool provides health care professionals means to start the conversation about a healthy lifestyle with parents |
| 22. Electronic Kids Dietary Index (E-KINDEX) [42] | Assess food habits, dietary beliefs and practices related to obesity | Children | Child a, parent b or health care professional b | 30 | Likert-type scale (varying) | Subscale scores and total score; ranging from 1 to 87 | In clinical practice, the score can be used as visual educational tool, provide continuous feedback and individual items may be used as specific goals for obesity status improvement |
| 23. Family Health Behavior Scale (FHBS) [43] | Assess family eating and PA habits related to obesity | Children | Parent a,b | 27 | 5-point Likert scale (never-nearly always) | Subscale scores and total score | NR |
| 24. Family Nutrition and Physical Activity (FNPA) screening tool [44,45] | Assess risk factors for overweight/obesity in the home environment | Children | Parent a,b | 20 | 4-point Likert scale (never-always) | Subscore per domain and total score | Korean version: based on scores, interventions such as counselling and education should be developed and provided |
| 25. HABITS questionnaire [46] | Assess weight-related behaviours and intervention targets | Children | Child a | 19 | Likert-type scale (varying) | Subscale scores | Tool can establish a dialogue about weight-related lifestyle behaviours between health care professional and families |
| 26. Healthy Living for Kids Survey (HLKS) [47] | Assess healthy lifestyle perceptions and behaviours | Children | Child a | 59 | Likert-type scale (varying) | Subscale scores and total score | Education of parents and children to redress inaccurate perceptions of a healthy lifestyle |
| 27. HeartSmartKids (HSK) [48] (HeartSmartKids, LLC, Boulder, US) | Assess lifestyle habits to guide behaviour change counselling | Children | Child a | 21 | Likert-type scale (varying) | NR | Patient-specific education handouts with lifestyle recommendations are generated |
| 28. Home Self-Administered Tool for Environmental Assessment of Activity and Diet (HomeSTEAD) [49] | Assess home environment factors related to children’s diet and PA | Children | Parent a | 86 | 5-point Likert scale | Subscale scores | Promotion of healthy feeding practices |
| 29. Lifestyle Behavior Checklist (LBC) [50,51] | Assess parental perceptions and self-efficacy in managing problems related child eating, activity and weight issues | Children with obesity | Parent a | 25 | Combination of closed and open questions | Subscale scores | NR |
| 30. Pediatric Adapted Liking Survey (PALS) [52] | Assess dietary behaviours linked to caries and obesity risk | Children | Parent b | 33 | Horizontal visual 5-point Likert scale, (hates it–loves it) | Subscore per domain; ranging from −100 to +100 | Tailored motivational diet-related messages for dental caries and obesity prevention |
| 31. Short-Form, Multicomponent Dietary Questionnaire (SF-FFQ4PolishChildren) [53] | Assess dietary and lifestyle behaviours | Children | Child a or parent b | 44 | Likert-type scale (varying) | Subscore per domain Cut-offs for low, moderate and high subscores | NR |
| 32. Tool by Hendrie et al. [54] | Assess family activity environment | Children | Parent a | 25 | 5-point Likert scales (strongly disagree–strongly agree) | NR | NR |
| 33. Tool by Huang et al. [55] | Assess correlates of PA and screen time behaviours | Children | Child a and parent a,b | 46 | Likert-type scale (varying) | NR | NR |
| 34. Adolescent Lifestyle Profile (ALP) [56,57] | Assess health-promoting behaviours | Adolescents | Child a | 42 | 4-point Likert scale (never-routinely) | Total score; ranging from 42 to 168 | NR |
| 35. Childhood Family Mealtime Questionnaire (CFMQ) (reduced) [58] | Assess mealtime environment | Adolescents | Child a | 22 | 5-point Likert scale (never–always) | NR | NR |
| 36. Diet–Lifestyle Index [59] | Assess nutrition and lifestyle quality related to overweight and obesity | Adolescents | Child a | 13 | Likert-type scale (varying) | Total score; ranging from 11 to 57 | NR |
| 37. Shortened Health-Promoting Lifestyle Profile (HPLP) II [60] | Assess health-promoting behaviours | Adolescents | Child a | 34 | 4-point Likert scale (never–routinely) | Subscale scores and total score | NR |
| 38. Tool by Fernald et al. [61] | Assess health behaviour | Adolescents | Child a | 16 | NR | Total score; ranging from 0 to 3 | NR |
| 39. Tool by Hyun et al. [62] | Assess nutrition knowledge | Adolescents | Child a | 20 | 2-point Likert scales (wrong–right) | Total score; ranging from 0 to 20 | NR |
| 40. Tool by Hyun et al. [62] | Assess dietary habits | Adolescents | Child a | 9 | 5-point Likert scales (always–never) | Total score; ranging from 0 to 5 | NR |
| 41. VISA-TEEN [63] | Assess lifestyle | Adolescents | Child a | 11 | Combination of closed and open questions | Total score | NR |
| Tool Name | Nutrition a | Physical Activity | Sedentary Behaviour/Screen Time | Sleep | Hygiene | Environment | Other |
|---|---|---|---|---|---|---|---|
| 1. NutricheQ [18,19,20] | ✓ | ||||||
| 2. Toddler Feeding Questionnaire (TFQ) b [21] | ✓ | ||||||
| 3. Toddler NutriSTEP b [22] | ✓ | Duration of watching TV or using the computer | Growth adequacy, child’s weight status | ||||
| 4. Toddler Dietary Questionnaire (TDQ) [23] | ✓ | ||||||
| 5. Child Eating Behavior Questionnaire (CEBQ) b [24] | ✓ | ||||||
| 6. Nutrition Screening Tool for Every Preschooler (NutriSTEP) [25,26,27] | ✓ | Frequency of PA | Frequency and duration of watching TV, using computer and playing video games | Parental satisfaction of child’s growth, child’s weight status | |||
| 7. Preschooler Dietary Questionnaire (PDQ) b [28] | ✓ | ||||||
| 8. Preschoolers Diet–Lifestyle Index (PDL-index) [29] | ✓ | Duration of moderate-to-vigorous PA | Duration of watching TV | ||||
| 9. Healthy Kids [30] | ✓ | Preference for playing over watching TV | Duration of watching TV and playing video or computer games | Bedtime | |||
| 10. Tool by Das and Ghosh b [31] | ✓ | General knowledge on health and lifestyle | |||||
| 11. Start the Conversation 4–12 (STC-4-12) [32] | ✓ | Frequency and duration of sports, playing outside and being active, barriers and readiness to change regarding PA | Duration of screen time | ||||
| 12. Healthy Families Survey [33] | ✓ | Duration of PA, child sees parent being physically active | Duration of watching TV and using other screens, availability of TV in child’s bedroom | ||||
| 13. Knowledge, Attitudes and Habits (KAH-) questionnaire [34] | ✓ | Frequency of playing active games, liking exercise, activities after school and during weekends, knowledge and attitudes towards PA | Activities after school and during weekends | Brushing teeth, washing hands, taking bath or shower | Knowledge, attitudes and habits regarding the human body and emotions | ||
| 14. Parental Self-efficacy Questionnaire [35] | ✓ | Confidence regarding child being physically active and playing outside | Confidence regarding limiting amount of screen time | ||||
| 15. Tool by Chacko and Ganesan [36] | ✓ | ||||||
| 16. Food, Health and Choices questionnaire (FHC-Q) [37] | ✓ | Frequency of specific activities, medium PA and heavy PA | Frequency and duration of watching TV and playing video games | Self-determination, outcome expectations, self-efficacy, habit strength, goal intention, knowledge and social desirability regarding a healthy lifestyle | |||
| 17. Healthy Eating and Physical Activity Self-Efficacy Questionnaire for Children (HEPASEQ-C) [38] | ✓ | Self-efficacy regarding PA | |||||
| 18. Healthy Eating and Physical Activity Behavior Recall Questionnaire for Children (HEPABRQ-C) [38] | ✓ | Duration of PA | |||||
| 19. Eating Behavior Questionnaire for School Children b [39] | ✓ | ✓ Not further specified | ✓ Not further specified | ||||
| 20. Tool by Drouin and Winickoff [40] | ✓ | Recent dental care visit | Tobacco smoke exposure | ||||
| 21. Child Nutrition and Physical Activity (CNPA) Screening Tool [41] | ✓ | Frequency and duration of PA | Duration of media use, availability of media in child’s bedroom | Perception, confidence and importance items on healthy choices | |||
| 22. Electronic Kids Dietary Index (E-KINDEX) [42] | ✓ | ||||||
| 23. Family Health Behavior Scale (FHBS) [43] | ✓ | Duration of being physically active, PA with parents, playing outside, doing sports, preferring indoor activities over outdoor activities, parental PA with child | |||||
| 24. Family Nutrition and Physical Activity (FNPA) screening tool b [44,45] | ✓ | Child’s PA, family PA | Screen time behaviour and monitoring | Sleep duration | Healthy environment | ||
| 25. HABITS questionnaire [46] | ✓ | Frequency of playing outside | Duration of watching TV | ||||
| 26. Healthy Living for Kids Survey (HLKS) b [47] | ✓ | Frequency and duration of ‘hard’, ‘moderate’ and ‘mild’ exercise, frequency of any activity to work up a sweat, self-efficacy for PA | Duration of screen time, number of TV shows/videos watched, self-efficacy for screen time | ||||
| 27. HeartSmartKids (HSK) b [48] (HeartSmartKids, LLC, Boulder, US) | ✓ | Duration of active play or sports | Duration of watching TV and using other screens | ✓ Not further specified | Anthropometric measures | ||
| 28. Home Self-Administered Tool for Environmental Assessment of Activity and Diet (HomeSTEAD) [49] | ✓ | ||||||
| 29. Lifestyle Behavior Checklist (LBC) [50,51] | ✓ | Parental problems experiencing and confidence in dealing with child complaining about PA | Parental problem experience and confidence in dealing with child watching too much TV and playing too many computer games | Parental problems experiencing and confidence in dealing with child complaining about problems related to obesity | |||
| 30. Pediatric Adapted Liking Survey (PALS) [52] | ✓ | Liking/disliking of brushing teeth, taking a bath, getting dressed | |||||
| 31. Short-Form, Multicomponent Dietary Questionnaire (SF-FFQ4PolishChildren) b [53] | ✓ | Intensity of PA at school and leisure time | Duration of screen time | Family affluence, height, weight | |||
| 32. Tool by Hendrie et al. [54] | Parental PA involvement, parental opportunity for PA role modelling, parental support of PA | Parental opportunity for screen time role modelling | See domain PA | ||||
| 33. Tool by Huang et al. [55] | Child’s self-efficacy regarding PA, home PA environment, sports facilities in neighbourhood, family and peer support for PA | Child’s perceived enjoyment of screen-based behaviours with parents, parental role modelling regarding screen time, rules and guidance on screen-based behaviours, availability of electronic screens | Child’s perceived neighbourhood safety, social environment in neighbourhood | ||||
| 34. Adolescent Lifestyle Profile (ALP) b [56,57] | ✓ | At least: frequency and duration of vigorous PA, playing active games with friends | Health responsibility, interpersonal relations, stress management, personal growth | ||||
| 35. Childhood Family Mealtime Questionnaire (CFMQ) (reduced) [58] | ✓ | ||||||
| 36. Diet–Lifestyle Index [59] | ✓ | Duration of extracurricular sport activities | Duration of watching TV and playing electronic games | Obesity status of parents | |||
| 37. Shortened Health-Promoting Lifestyle Profile (HPLP) II b [60] | ✓ | ✓ Not further specified | Health responsibility, stress management | ||||
| 38. Tool by Fernald et al. b [61] | ✓ | At least: frequency and duration of PA | Duration of watching TV | Alcohol use, smoking | |||
| 39. Tool by Hyun et al. [62] | ✓ | ||||||
| 40. Tool by Hyun et al. [62] | ✓ | ||||||
| 41. VISA-TEEN [63] | ✓ | Duration of moderate and intense PA | Duration of using internet or gaming | Sleep duration | Frequency of brushing teeth and washing hands | Amount of cigarettes smoked, frequency of consuming alcohol and using drugs |
| Tool Name | Consumption of Food Groups | Dietary Habits | Psychological Factors Associated with Nutrition | Other |
|---|---|---|---|---|
| 1. NutricheQ [18,19,20] | Vegetables, fruits, milk, dairy products, sweetened beverages, fortified cereals, red meat instead of oily or dark fish, fast food, unhealthy snacks | Age moving to cow’s milk, avoiding foods due to allergy or intolerance | ||
| 2. Toddler Feeding Questionnaire (TFQ) a [21] | Parental indulgent and authoritative practices, not further specified | Food environment-related, not further specified | ||
| 3. Toddler NutriSTEP a [22] | Vegetables and fruits, flavoured beverages, dairy and substitutes, grains, meat and alternatives, fast food | Eating while watching TV, eating episodes per day, child feeds him- or herself, drinking from bottle with a nipple | Food is expensive, problems with chewing or swallowing when eating, being hungry at mealtimes, child controls amount consumed | |
| 4. Toddler Dietary Questionnaire (TDQ) [23] | Vegetables, fruits, dairy, milk beverages, non-milk beverages, grains, white versus non-white bread, meat products, lean red meat, fish, hot potato products, snack products, sweet snacks, spreadable fats, vegemite-type spreads | |||
| 5. Child Eating Behavior Questionnaire (CEBQ) a [24] | Food fussiness, emotional overeating, emotional undereating, satiety responsiveness, slowness in eating, desire to drink, food responsiveness | Enjoyment of food | ||
| 6. Nutrition Screening Tool for Every Preschooler (NutriSTEP) [25,26,27] | Vegetables, fruits, dairy, grain products, meat or fish or poultry or alternatives, fast food, supplements | Eating while watching TV, eating episodes per day | Difficulty buying food because of costs, problems with chewing, swallowing, gagging or choking when eating, not hungry because of drinking all day, parental control of amount consumed | |
| 7. Preschooler Dietary Questionnaire (PDQ) a [28] | Vegetables, fruits, dairy, milk beverages, non-milk beverages, grains, white versus non-white bread, meat products, lean red meat, fish, hot potato products, snack products, sweet snacks, spreadable fats, vegemite-type spreads | |||
| 8. Preschoolers Diet–Lifestyle Index (PDL-index) [29] | Vegetables, fruits, sweets, dairy products, grains, red meat (products), white meat and legumes, fish and seafood, unsaturated fats | |||
| 9. Healthy Kids [30] | Vegetables, fruits, sugar-sweetened beverages, dairy, unhealthy snacks | Parent and child eating together, removing fat from meat | ||
| 10. Tool by Das and Ghosh a [31] | Knowledge on healthy dietary habits, nutrients and child nutrition practice | |||
| 11. Start the Conversation 4–12 (STC-4-12) [32] | Vegetables and fruits, sugar-sweetened beverages, milk type, unhealthy snacks, fast food | Barriers and readiness to change regarding healthy eating | ||
| 12. Healthy Families Survey [33] | Vegetables, fruits, sugar-sweetened beverages, healthy snacks, unhealthy snacks | Eating out, parent and child eating together, picky eating | Parental modelling and parent–child interactions regarding healthy eating, parental food resource management and shopping behaviours | |
| 13. Knowledge, Attitudes and Habits (KAH-) questionnaire [34] | Vegetables, fruits, pastries | Consuming breakfast, lunch and dinner, having mid-morning snack, trying new foods | Attitudes towards healthy and unhealthy eating | Knowledge on healthy and unhealthy eating |
| 14. Parental Self-efficacy Questionnaire [35] | Confidence regarding intake of vegetables, fruits, fruit juice, sugary drinks, sweets, dairy, grains, meat and alternatives, sodium, fats and eating out, eating together, child making healthy choices | |||
| 15. Tool by Chacko and Ganesan [36] | Vegetables, green leafy vegetables, fruit, cereals, pulses and dahl and non-vegetarian food, milk and coffee and tea and flavoured milk and curd, junk food, food from street shops | Mid-morning and evening snack, meal skipping | ||
| 16. Food, Health and Choices questionnaire (FHC-Q) [37] | Vegetables, fruits, sugar-sweetened beverages, processed packaged snacks, fast food | Self-determination, outcome expectations, self-efficacy, habit strength, goal intention, knowledge and social desirability regarding a healthy diet | ||
| 17. Healthy Eating and Physical Activity Self-Efficacy Questionnaire for Children (HEPASEQ-C) [38] | Self-efficacy to adhere to recommendations and to choose the healthy option when in temptation | |||
| 18. Healthy Eating and Physical Activity Behavior Recall Questionnaire for Children (HEPABRQ-C) [38] | Vegetables, number of colours of vegetables, fruits, soda pop, dairy, healthy snacks | Choosing the healthy option when eating out | ||
| 19. Eating Behavior Questionnaire for School Children a [39] | Food responsiveness, meal timings, eating problems, meal preparation | |||
| 20. Tool by Drouin and Winickoff [40] | Sugar-sweetened beverages | |||
| 21. Child Nutrition and Physical Activity (CNPA) Screening Tool [41] | Vegetables, fruits, sugar-sweetened beverages, milk, milk type, fast food | Consuming breakfast, dinner eaten with adult | Perception, confidence and importance items on a healthy diet | |
| 22. Electronic Kids Dietary Index (E-KINDEX) [42] | Vegetables, fruits and fruit juices, sweets and junk food, soft drinks, milk, bread, cereals and grain foods, meat, salted and smoked meat food, fish and seafood, legumes, fried food, grilled food | Consuming breakfast, number of main meals and snacks, eating in fast food restaurants or other eating places, eating with family, eating alone, eating of healthy food, eating meals in afternoon school, eating foods because they are advertised, eating whatever food is prepared at home, parental insistence to eat all the food, eating when not hungry | Beliefs and attitudes regarding an (un)healthy diet, weight, dieting | |
| 23. Family Health Behavior Scale (FHBS) [43] | Consuming breakfast, eating three meals a day, eating at table, staying seated at the table, eating at a routine time, asking for unhealthy snacks, eating when bored, emotional eating, eating frequently, sneaking of food | Being influenced to eat or offered unhealthy foods by others | Choices and teaching on healthy foods by parents | |
| 24. Family Nutrition and Physical Activity (FNPA) screening tool a [44,45] | Food choices, beverage choices | Family eating patterns, family eating habits | Restriction/rewarding | |
| 25. HABITS questionnaire [46] | Vegetables, fruits, fruit juice, sugar-sweetened beverages, milk, water, fast food meals, unhealthy snacks | Eating while watching TV, eating three meals a day, eating extra meals or snacks | ||
| 26. Healthy Living for Kids Survey (HLKS) a [47] | Vegetables, fruits, low fat milk, whole wheat bread | Self-efficacy and nutritional intention for healthy eating | ||
| 27. HeartSmartKids (HSK) a [48] (HeartSmartKids, LLC, Boulder, US) | At least: vegetables and fruits, sugar-sweetened beverages (incl. juice), milk, unhealthy snacks | At least: consuming breakfast, eating at restaurants, eating while watching TV | ||
| 28. Home Self-Administered Tool for Environmental Assessment of Activity and Diet (HomeSTEAD) [49] | Parent and child eating together at table, eating while TV is on | Parental autonomy support, atmosphere during meals | Parental control and limit setting, eating area decoration | |
| 29. Lifestyle Behavior Checklist (LBC) [50,51] | Parental problems experiencing and confidence in dealing with child’s eating habits (e.g., eats too quickly, yells about food, hides food) | |||
| 30. Pediatric Adapted Liking Survey (PALS) [52] | b Vegetables, fruits, sugar-sweetened beverages, dairy, meat, fish, beans, peanut butter, unhealthy snacks (sweet, salty and fat) | |||
| 31. Short-Form, Multicomponent Dietary Questionnaire (SF-FFQ4PolishChildren) a [53] | Vegetables, fruits, sugar-sweetened beverages, energy drinks, juices, sweets, dairy, fish, fast food | Breakfast consumption, frequency of having two meals per day | Nutrition knowledge | |
| 34. Adolescent Lifestyle Profile (ALP) a [56,57] | At least: vegetables, fruits, sweets, low fat dairy, chicken or fish instead of beef | At least: consuming breakfast | ||
| 35. Childhood Family Mealtime Questionnaire (CFMQ) (reduced) [58] | Mealtime structure, mealtime communication | Family mealtime stress | Appearance weight control | |
| 36. Diet–Lifestyle Index [59] | Vegetables, fruits, sweets and added sugars, dairy type, wholegrain, breakfast cereals | Consuming breakfast, eating foods not prepared at home, eating episodes per day, removing visible fat from meat/poultry | ||
| 37. Shortened Health-Promoting Lifestyle Profile (HPLP) II a [60] | NR | NR | NR | NR |
| 38. Tool by Fernald et al. a [61] | At least: vegetables, fruits | |||
| 39. Tool by Hyun et al. [62] | Nutrition knowledge, including general knowledge and knowledge regarding food composition, nutrients and diseases | |||
| 40. Tool by Hyun et al. [62] | Vegetables, green and orange vegetables, seaweed, fruits, dairy, meat and fish and egg and beans | Consuming breakfast, eating adequate amounts, combining food groups at each meal | ||
| 41. VISA-TEEN [63] | Vegetables and fruit, soft drinks, dairy, grains and potatoes, red meats, chicken and fish and eggs, butter and sweets, liquid excluding soft drinks |
3.2. Psychometric Properties
| Tool Name | Country | Sample Size | Age | Reliability | Criterion Validity |
|---|---|---|---|---|---|
| 1. NutricheQ | Ireland [18] | N = 371 | 1–3 y | Internal consistency, α = 0.50 | Total score was associated with (4-day weighted food diary) intakes of fruits, vegetables, protein, dietary fibre, non-milk sugars, iron, vitamin D, zinc, calcium, riboflavin, niacin, folate, thiamine, phosphorous, potassium, carotene and retinol (r = −0.390–0.119, p < 0.05) A score > 4 (AUC = 76%) identified moderate risk with sensitivity = 83% and specificity = 48% A score > 8 (AUC = 85%) identified high risk with sensitivity = 70% and specificity = 80% |
| Italy [19] | N = 201 | 1–3 y | Internal consistency, α = 0.83 for Section 1 and α = 0.70 for Section 2 ICC = 0.73 (95% CI [0.40, 0.89], p = 0.0002) for Section 1 and ICC = 0.55 (95% CI [0.13, 0.81], p = 0.0074) for Section 2 | In Section 1, a score ≥ 4 identified toddlers with a poor iron intake (AUC = 0.678, p = 0.001) and a score of ≥2 identified toddlers exceeding the En% protein intake (AUC = 0.6024, p = 0.009). In Section 2, a score of ≥3 identified toddlers with poor fibre intake (AUC = 0.7028, p < 0.0001) | |
| Lebanon [20] | N = 467 | 1–3 y | Total score was associated with age and BMI (r = 0.11, p = 0.021 (for both)), and with fat (ρ = 0.148, p = 0.039) and fibre (ρ = −0.137, p = 0.031) intake AUC = 0.457 for correctly classifying toddlers into the high risk group based on their BMI z-score | ||
| 2. Toddler Feeding Questionnaire (TFQ) [21] | United States | N = 629 | 3–5 y | Internal consistency, α = 0.66 for indulgent subscale, α = 0.65 for authoritative subscale, α = 0.48 for environmental subscale | Indulgent subscale scores were correlated with the HEI-2010 (ρ = −0.22, p < 0.001), kcal/d (ρ = 0.11, p = 0.011), grams of fat/day (ρ = 0.12, p = 0.008), servings of vegetables (ρ = −0.11, p = 0.01), servings of desserts (ρ = 0.13, p = 0.002) and servings of sugary drinks (ρ = 0.23, p < 0.001) Authoritative subscale scores were correlated with the HEI-2010 (ρ = 0.15, p < 0.001), servings of vegetables (ρ = 0.11, p = 0.011), servings of desserts (ρ = −0.15, p < 0.001) and servings of sugary drinks (ρ = − 0.09, p < 0.039) Environmental subscale scores were correlated with HEI-2010 (ρ = − 0.12, p = 0.004), kcals/day (ρ = 0.12, p = 0.007), grams of fat/day (ρ = 0.14, p = 0.001), servings of desserts (ρ = 0.13, p = 0.003) and servings of sugary drinks (ρ = 0.22, p < 0.001) |
| 3. Toddler NutriSTEP [22] | Canada | N = 200 | 18–35 m | ICC = 0.951 (p < 0.001) | Total score was associated with dietician risk score (ρ = 0.67, p < 0.000) A score ≥ 21 identified moderate risk with sensitivity = 86% and specificity = 61% A score ≥ 26 identified high risk with sensitivity = 95% and specificity = 63% |
| 4. Toddler Dietary Questionnaire (TDQ) [23] | Australia | N = 111 | 12–36 m | Total score ICC = 0.90 (p < 0.001) All children were classified into the same (n = 83, 75%) or adjacent (n = 28, 25%) dietary risk category during each administration Test–retest reliability for individual items, κw = 0.40–0.78 | Total score and food frequency questionnaire risk score were associated (r = 0.71, p < 0.001) Classification analysis between the TDQ and food frequency questionnaire revealed that all the participants were classified into the same (n = 88, 79%) or adjacent (n = 23, 21%) dietary risk category |
| 5. Child Eating Behavior Questionnaire (CEBQ) [24] | Sweden | N = 1271 | 3–8 y | Internal consistency: α = 0.73 | NR |
| 6. Nutrition Screening Tool for Every Preschooler (NutriSTEP) | Canada [25] | N = 269 | 3–5 y | Total score ICC = 0.89 (95% CI [0.85, 0.92], p < 0.001)Test–retest reliability for individual items, κ = 0.39–1.0 | Total score was associated with dietician risk rating (r = 0.48, p = 0.01) A score > 20 identified moderate risk with sensitivity = 53% and specificity = 79% A score > 25 identified high risk with sensitivity = 84% and specificity = 46% |
| Canada [26] | N = 63 for internet use N = 64 for onscreen use | 3–5 y | Internet use total score ICC = 0.91 (95% CI [0.90, 0.96]) Onscreen use total score ICC = 0.91 (95% CI [0.85, 0.95]) Test–retest reliability among risk categories, κ = 0.58 (p = 0.000) for internet use and κ = 0.50 (p = 0.000) for onscreen use | NR | |
| Iran [27] | N = 192 | 4–6 y | Test–retest reliability, r = 0.68 (p < 0.001) | Total score was associated with nutritionist risk score (r = 0.23, p = 0.003) and with healthy eating index (r = −0.16, p = 0.03) A score > 27 identified moderate risk with sensitivity = 41.7% and specificity = 85.7% A score > 31 identified high risk with sensitivity = 38.9% and specificity = 84.4% | |
| 7. Preschooler Dietary Questionnaire (PDQ) [28] | Australia | N = 74 | 3–5 y | Total score ICC = 0.87 (95% CI [0.07, 2.95], p = 0.040) | Total score and food frequency questionnaire risk score were associated (r = 0.85, p = 0.009) PDQ scores were associated with the number of people per household (β = −0.32, 95% CI [−6.69, −0.59], p = 0.020), but not BMI z-score (β = −0.09, 95% CI [−0.02, −0.04], p = 0.512) |
| 8. Preschoolers Diet–Lifestyle Index (PDL-index) [29] | Greece | N = 2287 | 2–5 y | NR | A 1/44 unit score increase was associated with an OR for obesity of 0.95 (95% CI [0.92, 0.98]) and an OR of 0.97 (95% CI [0.95, 0.99]) for overweight/obesity Correct classification rate for obesity = 85%, for overweight/obesity = 67% Sensitivity for obesity = 60%, for overweight/obesity = 55% Specificity for obesity and overweight/obesity = 52% |
| 9. Healthy Kids [30] | United States | N = 133 | 2–5 y | Internal consistency, α = 0.76 Test–retest reliability coefficient = 0.74 (p ≤ 0.01) | The Healthy Kids scale score was inversely associated with BMI percentiles (p = 0.02) |
| 10. Tool by Das and Ghosh [31] | India | N = 134 | 3–6 y | Internal consistency, α = 0.87 Total score ICC = 0.77 (p <0.01) | NR |
| 11. Start the Conversation 4–12 (STC-4-12) [32] | United States | N = 115 | 4–12 y | NR | Three of five queried dietary barriers were found to be significantly associated with at least one healthy eating behaviour Four of five queried barriers to PA were significantly associated with at least one PA-related behaviour |
| 12. Healthy Families Survey [33] | United States | N = 1376 | 6–11 y | Internal consistency for subscales, α = 0.51–0.77 | NR |
| 13. Knowledge, Attitudes and Habits (KAH-) questionnaire [34] | Spain | N = 295 | 6–7 y | Internal consistency, α = 0.79 | NR |
| 14. Parental Self-efficacy Questionnaire [35] | United States | N = 146 | 6–11 y | Internal consistency, α = 0.94 Test–retest reliability, r = 0.94 (p < 0.001) | NR |
| 15. Tool by Chacko and Ganesan [36] | India | NR | 6–17 y | NR | NR |
| 16. Food, Health and Choices questionnaire (FHC-Q) [37] | United States | N = 221 | 9–11 y | Internal consistency: α = 0.77–0.92 for behaviour scales and α = 0.44–0.83 for psychosocial scales ICC = 0.59–0.81 for behaviours (p < 0.001) and ICC = 0.51–0.68 for continuous psychosocial determinants (p <0.05) | Correlation coefficients between the FHC-Q and reference questionnaires were all statistically significant (p < 0.01) |
| 17. Healthy Eating and Physical Activity Self-Efficacy Questionnaire for Children (HEPASEQ-C) [38] | United States | N = 492 | 9–13 y | Internal consistency, α = 0.75 | HEPASEQ-C was significantly correlated with HEPABRQ-C, r = 0.50 (p = 0.000) |
| 18. Healthy Eating and Physical Activity Behavior Recall Questionnaire for Children (HEPABRQ-C) [38] | United States | N = 492 | 9–13 y | NR | HEPABRQ-C was significantly correlated with HEPASEQ-C, r = 0.50 (p = 0.000) |
| 19. Eating Behavior Questionnaire for School Children [39] | India | N = 462 | 10–12 y | NR | No correlation between tool subscores and anthropometric measures (exact numerical data NR) |
| 20. Tool by Drouin and Winickoff [40] | United States | N = 626 | 0–18 y | NR | Parents receiving the tool were not more likely to receive counselling or service delivery by clinicians than participants not screened No statistical difference in the proportion of parents reporting having taken steps towards correcting the behaviour in the parents that received the screening after one month follow-up |
| 21. Child Nutrition and Physical Activity (CNPA) Screening Tool [41] | United States | N = 2230 | 2–18 y | Internal consistency: α = ‘low’, exact value NR | Both generated readiness to change and perception subscores were associated with weight status categories (p < 0.001) |
| 22. Electronic Kids Dietary Index (E-KINDEX) [42] | Greece | N = 622 | 9–13 y | Internal consistency: α = 0.60 | Each 1 SD (i.e., 7.81 points) score increase was associated with a 2.31 ± 0.23 kg/m2 decrease in BMI (p < 0.001), a 2.23 ± 0.35 decrease in calculated % body fat (p < 0.001) and a 2.16 ± 0.61 cm decrease in waist circumference (p < 0.001) Correct classification rate for excess body fat was 84% (95% CI [0.74, 0.94]) Sensitivity for overweight/obesity versus normal weight = 74%, for obesity versus normal weight/overweight = 61% Specificity for overweight/obesity versus normal weight = 46%, for obesity versus normal weight/overweight = 79% |
| 23. Family Health Behavior Scale (FHBS) [43] | United States | N = 233 | 5–12 y | Internal consistency: α = 0.86 Test–retest reliability coefficient = 0.85 | FHBS was inversely associated with zBMI (r = −0.28, p< 0.01) Every unit increase was associated with an OR of 0.96 (95% CI [0.95, 0.99] for overweight/obesity (p < 0.01) Correct classification rate for weight classification = 63% |
| 24. Family Nutrition and Physical Activity (FNPA) screening tool | United States [44] | N = 349 | 1st and 10th grade | NR | At both ages, the FNPA score was not significantly correlated with BMI% Only in first graders, scores in the lowest tertile were associated with higher odds for overweight/obesity compared to the highest tertile (OR = 2.49, 95% CI [1.17, 5.31]) |
| United States [45] | N = 19 | 2–5 y | NR | NR | |
| 25. HABITS questionnaire [46] | United States | N = 35 | 7–16 y | Internal consistency, α = 0.61 for dietary subscale and α = 0.59 for PA/sedentary behaviour subscale Test–retest reliability, κ = 0.27–0.78 for individual items of dietary subscale and κ = 0.29–0.48 for PA/sedentary behaviour subscale As a whole, the dietary subscale and PA/sedentary behaviour subscales had test–retest reliabilities of r = 0.94 and r = 0.87, respectively | NR |
| 26. Healthy Living for Kids Survey (HLKS) [47] | United States | N = 88 | 9–12 y | Internal consistency for subscales, α = 0.63–0.80 Test–retest reliability for subscales: r = 0.37–0.78 | NR |
| 27. HeartSmartKids (HSK) [48] (HeartSmartKids, LLC, Boulder, US) | United States | N = 103 | 9–14 y | Test–retest reliability, ρ = 0.38–0.78 | Each item of the HSK was significantly correlated with the HABITS, ρ = 0.21–0.65 (p <0.05) |
| 28. Home Self-Administered Tool for Environmental Assessment of Activity and Diet (HomeSTEAD) [49] | United States | N = 129 | 3–12 y | Internal consistency for subscales, α = 0.62–0.93 Subscale ICC = 0.57–0.89 | No statistically significant correlation between factor composite scores and child BMI z-scores |
| 29. Lifestyle Behavior Checklist (LBC) | Australia [50] | N = 182 | 4–11 y | Internal consistency, α = 0.97 for Problem scale and α = 0.92 for Confidence scale Test–retest reliability, ρ = 0.87 (p < 0.001) for Problem scale and ρ = 0.66 (p < 0.001) for Confidence scale | Correct classification rate for obesity was 91% |
| The Netherlands [51] | N = 273 | 3–13 y | Internal consistency, α = 0.92 for Problem scale and α = 0.98 for Confidence scale Test–retest reliability, ρ = 0.74 (p < 0.001) for Problem scale and ρ = 0.70 (p < 0.001) for Confidence scale | Parents with healthy weight children scored lower on the Problem scale, F = 16.94 (p < 0.001), compared to those with overweight children The Problem scale was associated with nurturance (ρ = −0.23, p < 0.01), restrictiveness (ρ = 0.14, p < 0.05), psychological control (ρ = 0.19, p < 0.01) and BMI of child (ρ = 0.21, p < 0.01), mother (ρ = 0.23, p < 0.01) and father (ρ = 0.14, p < 0.05) The Confidence scale was associated with nurturance (ρ = 0.14, p < 0.05) and psychological control (ρ = −0.22, p < 0.01) | |
| 30. Pediatric Adapted Liking Survey (PALS) [52] | United States | N = 144 | 5–17 y | Internal consistency for subscales, α = 0.40–0.72 ICC for individual items = 0.79–0.91 | In girls, higher BMI was associated with greater preference for fat/sweet/salty foods (β = 0.32, 95% CI [0.14, 1.15], p < 0.05) |
| 31. Short-Form, Multicomponent Dietary Questionnaire (SF-FFQ4PolishChildren) [53] | Poland | N = 437 children N = 630 adolescents | 6–10 y 11–15 y | Test–retest reliability for consumption of food items and meals, κ = 0.46–0.81 in children, κ = 0.30–0.54 in adolescent’s test–retest, and κ = 0.27–0.56 in adolescent’s test and parent’s retest Across study groups, test–retest reliability, κ = 0.31–0.72 for active/sedentary lifestyle items, κ = 0.55–0.93 for components of the Family Affluence Scale, κ = 0.64–0.67 for BMI categories, κ = 0.36 for the nutrition knowledge of adolescents and κ = 0.62 for the nutrition knowledge of children’s parents | NR |
| 32. Tool by Hendrie et al. [54] | Australia | N = 106 | 5–11 y | Internal consistency, α = 0.83 | The family activity environment was associated with children’s fruit and vegetable intake assessed with a 24-h recall (r = 0.34, p < 0.01), PA assessed by the Children’s Leisure Activity Study Survey (r = 0.27, p < 0.01) and screen time (r = −0.24, p < 0.05) assessed by a survey |
| 33. Tool by Huang et al. [55] | China | N = 303 | 9–14 y | Internal consistency for identified factors, α = 0.50–0.86 Identified factor ICC = 0.82–0.89 | Self-efficacy (r = 0.25, p < 0.05), home physical activity environment (r = 0.14, p < 0.05) and peer support (r = 0.25, p < 0.05) were associated with child-reported moderate-to-vigorous PA Family support for PA was associated with screen time (r = −0.22, p < 0.05) |
| 34. Adolescent Lifestyle Profile (ALP) | United States [56] | N = 207 | 10–15 y | Internal consistency: α = 0.91 | ALP correlated with hope (r = 0.60, p = 0.001), self-efficacy (r = 0.47, p = 0.001) and self-esteem (r = 0.35, p = 0.001) scores |
| Portugal [57] | N = 236 | 12–18 y | Internal consistency: α = 0.87 | NR | |
| 35. Childhood Family Mealtime Questionnaire (CFMQ) (reduced) [58] | United States | N = 280 | 11–15 y | Internal consistency for identified factors, α = 0.76–0.82 | Childhood mealtime communication was associated with physically active days (β = 0.20, 95% CI [0.07, 0.32], p < 0.01), fruits and vegetable intake (β = 0.29, 95% CI [0.15, 0.45], p < 0.001) and added sugar intake (β = 0.23, 95% CI [0.09, 0.37], p < 0.001) Childhood mealtime stress was associated with fruits and vegetable intake (β = 0.26, 95% CI [0.08, 0.45], p < 0.01) and added sugar intake (β = 0.38, 95% CI [0.21, 0.57], p < 0.001) |
| 36. Diet–Lifestyle Index [59] | Greece | N = 2008 | 12–17 y | NR | The Diet–Lifestyle Index was inversely associated with BMI in boys (ρ = −0.169, p < 0.001) and girls (ρ = −0.143, p < 0.001) An 11/57 unit score increase was associated with an OR of 0.93 (95% CI [0.90, 0.96]) for overweight/obesity (p < 0.001) Correct classification rate for BMI category = 83% Sensitivity for overweight/obesity = 66%, specificity = 50% |
| 37. Shortened Health-Promoting Lifestyle Profile (HPLP) II [60] | Iran | N = 495 | 14–18 y | Internal consistency, α = 0.86 | Total HPLP-II was associated with quality of life (r = 0.24, p< 0.001), self-efficacy (r = 0.48, p < 0.001) and demographic variables (data NR) |
| 38. Tool by Fernald et al. [61] | United States | N = 227 | Average 15 y | NR | NR |
| 39. Tool by Hyun et al. [62] | Korea and China | N = 406 | 15–18 y | NR | Nutrition knowledge was associated with body shape satisfaction in Korean boys (r = 0.208, p < 0.01), not in Chinese boys |
| 40. Tool by Hyun et al. [62] | Korea and China | N = 406 | 15–18 y | NR | Healthy dietary habits were associated with body shape satisfaction in Chinese boys (r = 0.210, p < 0.01), not in Korean boys |
| 41. VISA-TEEN [63] | Spain | N = 419 | 13–19 y | Internal consistency, α = 0.66 Total score ICC = 0.86 (95% CI [0.82, 0.89]) | Total VISA-TEEN score was associated with KIDSCREEN-10 (r = 0.21, p < 0.001) and self-rated health (p < 0.001) |
3.3. Implementation
4. Discussion
5. Conclusions
Supplementary Materials
Author Contributions
Funding
Institutional Review Board Statement
Informed Consent Statement
Data Availability Statement
Conflicts of Interest
References
- Prado, E.L.; Dewey, K.G. Nutrition and brain development in early life. Nutr Rev. 2014, 72, 267–284. [Google Scholar] [CrossRef] [PubMed] [Green Version]
- Laitinen, T.T.; Pahkala, K.; Magnussen, C.G.; Viikari, J.S.; Oikonen, M.; Taittonen, L.; Mikkila, V.; Jokinen, E.; Hutri-Kahonen, N.; Laitinen, T.A.; et al. Ideal cardiovascular health in childhood and cardiometabolic outcomes in adulthood: The Cardiovascular Risk in Young Finns Study. Circulation 2012, 125, 1971–1978. [Google Scholar] [CrossRef] [PubMed] [Green Version]
- World Health Organization. Healthy Living: What Is a Healthy Lifestyle? WHO Regional Office for Europe: Copenhagen, Denmark, 1999. [Google Scholar]
- Kumar, S.; Kelly, A.S. Review of childhood obesity: From epidemiology, etiology, and comorbidities to clinical assessment and treatment. Mayo Clin. Proc. 2017, 92, 251–265. [Google Scholar] [CrossRef] [PubMed] [Green Version]
- Carson, V.; Lee, E.Y.; Hewitt, L.; Jennings, C.; Hunter, S.; Kuzik, N.; Stearns, J.A.; Powley Unrau, S.; Poitras, V.J.; Gray, C.; et al. Systematic review of the relationships between physical activity and health indicators in the early years (0–4 years). BMC Public Health 2017, 17 (Suppl. 5), 854. [Google Scholar]
- Poitras, V.J.; Gray, C.E.; Janssen, X.; Aubert, S.; Carson, V.; Faulkner, G.; Goldfield, G.S.; Reilly, J.J.; Sampson, M.; Tremblay, M.S. Systematic review of the relationships between sedentary behaviour and health indicators in the early years (0–4 years). BMC Public Health 2017, 17 (Suppl. 5), 868. [Google Scholar] [CrossRef] [Green Version]
- Chaput, J.P.; Gray, C.E.; Poitras, V.J.; Carson, V.; Gruber, R.; Birken, C.S.; MacLean, J.E.; Aubert, S.; Sampson, M.; Tremblay, M.S. Systematic review of the relationships between sleep duration and health indicators in the early years (0–4 years). BMC Public Health 2017, 17 (Suppl. 5), 855. [Google Scholar] [CrossRef]
- Correia, M. Nutrition screening vs nutrition assessment: What’s the difference? Nutr. Clin. Pract. 2018, 33, 62–72. [Google Scholar] [CrossRef]
- Hartman, C.; Shamir, R.; Hecht, C.; Koletzko, B. Malnutrition screening tools for hospitalized children. Curr. Opin. Clin. Nutr. Metab. Care 2012, 15, 303–309. [Google Scholar] [CrossRef]
- Huysentruyt, K.; Devreker, T.; Dejonckheere, J.; De Schepper, J.; Vandenplas, Y.; Cools, F. Accuracy of nutritional screening tools in assessing the risk of undernutrition in hospitalized children. J. Pediatr. Gastroenterol. Nutr. 2015, 61, 159–166. [Google Scholar] [CrossRef] [Green Version]
- Joosten, K.F.; Hulst, J.M. Nutritional screening tools for hospitalized children: Methodological considerations. Clin. Nutr. 2014, 33, 1–5. [Google Scholar] [CrossRef]
- Klanjsek, P.; Pajnkihar, M.; Marcun Varda, N.; Povalej Brzan, P. Screening and assessment tools for early detection of malnutrition in hospitalised children: A systematic review of validation studies. BMJ Open 2019, 9, e025444. [Google Scholar] [CrossRef] [PubMed]
- Teixeira, A.F.; Viana, K.D. Nutritional screening in hospitalized pediatric patients: A systematic review. J. Pediatr. 2016, 92, 343–352. [Google Scholar] [CrossRef] [PubMed] [Green Version]
- Becker, P.J.; Gunnell Bellini, S.; Wong Vega, M.; Corkins, M.R.; Spear, B.A.; Spoede, E.; Hoy, K.; Piemonte, T.A.; Rozga, M. Validity and reliability of pediatric nutrition screening tools for hospital, outpatient, and community settings: A 2018 evidence analysis center systematic review. J. Acad. Nutr. Diet. 2020, 120, 288–318.e2. [Google Scholar] [CrossRef] [PubMed]
- Moher, D.; Liberati, A.; Tetzlaff, J.; Altman, D.G.; Group, P. Preferred reporting items for systematic reviews and meta-analyses: The PRISMA statement. PLoS Med. 2009, 6, e1000097. [Google Scholar]
- Cochrane. Cochrane PICO Ontology. Available online: https://linkeddata.cochrane.org/pico-ontology (accessed on 15 December 2020).
- Byrne, R.; Bell, L.; Taylor, R.W.; Mauch, C.; Mihrshahi, S.; Zarnowiecki, D.; Hesketh, K.D.; Ming Wen, L.; Trost, S.G.; Golley, R. Brief tools to measure obesity-related behaviours in children under 5 years of age: A systematic review. Obes. Rev. 2019, 20, 432–447. [Google Scholar]
- Rice, N.; Gibbons, H.; McNulty, B.A.; Walton, J.; Flynn, A.; Gibney, M.J.; Nugent, A.P. Development and validation testing of a short nutrition questionnaire to identify dietary risk factors in preschoolers aged 12–36 months. Food Nutr. Res. 2015, 59, 27912. [Google Scholar] [CrossRef] [Green Version]
- Morino, G.S.; Cinelli, G.; Di Pietro, I.; Papa, V.; Spreghini, N.; Manco, M. NutricheQ Questionnaire assesses the risk of dietary imbalances in toddlers from 1 through 3 years of age. Food Nutr. Res. 2015, 59, 29686. [Google Scholar]
- Aramouny, E.; Sacy, R.; Chokr, I.; Joudy, B. Local validation study for NutricheQ tool in Lebanon. J. Compr. Pediatrics 2018, 9, e63573. [Google Scholar] [CrossRef] [Green Version]
- Heerman, W.J.; Lounds-Taylor, J.; Mitchell, S.; Barkin, S.L. Validity of the toddler feeding questionnaire for measuring parent authoritative and indulgent feeding practices which are associated with stress and health literacy among Latino parents of preschool children. Nutr. Res. 2018, 49, 107–112. [Google Scholar] [CrossRef]
- Randall Simpson, J.; Gumbley, J.; Whyte, K.; Lac, J.; Morra, C.; Rysdale, L.; Tufryer, M.; McGibbon, K.; Beyers, J.; Keller, H. Development, reliability, and validity testing of Toddler NutriSTEP: A nutrition risk screening questionnaire for children 18–35 months of age. Appl. Physiol. Nutr. Metab. 2015, 40, 877–886. [Google Scholar] [CrossRef] [Green Version]
- Bell, L.K.; Golley, R.K.; Magarey, A.M. A short food-group-based dietary questionnaire is reliable and valid for assessing toddlers’ dietary risk in relatively advantaged samples. Br. J. Nutr. 2014, 112, 627–637. [Google Scholar] [CrossRef] [PubMed]
- Sandvik, P.; Ek, A.; Somaraki, M.; Hammar, U.; Eli, K.; Nowicka, P. Picky eating in Swedish preschoolers of different weight status: Application of two new screening cut-offs. Int. J. Behav. Nutr. Phys. Act. 2018, 15, 74. [Google Scholar] [PubMed]
- Randall Simpson, J.A.; Keller, H.H.; Rysdale, L.A.; Beyers, J.E. Nutrition Screening Tool for Every Preschooler (NutriSTEP): Validation and test-retest reliability of a parent-administered questionnaire assessing nutrition risk of preschoolers. Eur. J. Clin. Nutr. 2008, 62, 770–780. [Google Scholar] [CrossRef] [PubMed] [Green Version]
- Carducci, B.; Reesor, M.; Haresign, H.; Rysdale, L.; Keller, H.; Beyers, J.; Paquette-Duhaime, S.; O’Connor, A.; Simpson, J.R. NutriSTEP® is reliable for internet and onscreen use. Can. J. Diet Pract. Res. 2015, 76, 9–14. [Google Scholar] [CrossRef]
- Mehdizadeh, A.; Vatanparast, H.; Khadem-Rezaiyan, M.; Norouzy, A.; Abasalti, Z.; Rajabzadeh, M.; Nematy, M. Validity and reliability of the persian version of nutrition screening tool for every preschooler (NutriSTEP®) in iranian preschool children. J. Pediatr. Nurs. 2020, 52, e90–e95. [Google Scholar] [CrossRef]
- Bell, L.K.; Golley, R.K.; Mauch, C.E.; Mathew, S.M.; Magarey, A.M. Validation testing of a short food-group-based questionnaire to assess dietary risk in preschoolers aged 3–5 years. Nutr. Diet. 2019, 76, 642–645. [Google Scholar] [CrossRef] [Green Version]
- Manios, Y.; Kourlaba, G.; Grammatikaki, E.; Androutsos, O.; Moschonis, G.; Roma-Giannikou, E. Development of a diet-lifestyle quality index for young children and its relation to obesity: The Preschoolers Diet-Lifestyle Index. Public Health Nutr. 2010, 13, 2000–2009. [Google Scholar] [CrossRef] [Green Version]
- Townsend, M.S.; Ontai, L.; Shilts, M.K.; Styne, D.M.; Drake, C.; Lanoue, L. An obesity risk assessment tool for young children: Validity with BMI and nutrient values. J. Nutr. Educ. Behav. 2018, 50, 705–717. [Google Scholar] [CrossRef]
- Das, N.; Ghosh, A. Psychometric validation of a nutrition knowledge questionnaire among parents of 3–6-Year-Old Asian Indian children in east Barddhaman district, West Bengal, India. Indian J. Community Med. 2020, 45, 130–134. [Google Scholar]
- Jacobson Vann, J.C.; Finkle, J.; Ammerman, A.; Wegner, S.; Skinner, A.C.; Benjamin, J.T.; Perrin, E.M. Use of a tool to determine perceived barriers to children’s healthy eating and physical activity and relationships to health behaviors. J. Pediatr. Nurs. 2011, 26, 404–415. [Google Scholar] [CrossRef] [Green Version]
- Zemeir, L.A.; Butler, J.; Howard, D.E. Validity and reliability of the healthy families survey: A key component of the maryland Supplemental Nutrition Assistance Program–Education (SNAP-Ed) evaluation. J. Nutr. Educ. Behav. 2018, 50, 632–637. [Google Scholar] [CrossRef] [PubMed]
- Santos-Beneit, G.; Sotos-Prieto, M.; Bodega, P.; Rodríguez, C.; Orrit, X.; Pérez-Escoda, N.; Bisquerra, R.; Fuster, V.; Penalvo, J.L. Development and validation of a questionnaire to evaluate lifestyle-related behaviors in elementary school children. BMC Public Health 2015, 15, 901. [Google Scholar]
- Decker, J.W. Initial development and testing of a questionnaire of parental self-efficacy for enacting healthy lifestyles in their children. J. Spec. Pediatr. Nurs. 2012, 17, 147–158. [Google Scholar] [CrossRef] [Green Version]
- Chacko, T.V.; Ganesan, S. A tool for quickly identifying gaps in diet of school children for nutritional educational interventions. Indian J. Public Health 2018, 62, 146–149. [Google Scholar] [PubMed]
- Gray, H.L.; Koch, P.A.; Contento, I.R.; Bandelli, L.N.; Ang, I.; Di Noia, J. Validity and reliability of behavior and theory-based psychosocial determinants measures, using audience response system technology in urban upper-elementary schoolchildren. J. Nutr. Educ. Behav. 2016, 48, 437–452.e1. [Google Scholar] [CrossRef] [PubMed] [Green Version]
- Lassetter, J.H.; Macintosh, C.I.; Williams, M.; Driessnack, M.; Ray, G.; Wisco, J.J. Psychometric testing of the healthy eating and physical activity self-efficacy questionnaire and the healthy eating and physical activity behavior recall questionnaire for children. J. Spec. Pediatr. Nurs. 2018, 23, e12207. [Google Scholar] [CrossRef] [PubMed] [Green Version]
- Ayesha Fathima, A.; Hema, T.H.; Hemamalini, A.J. Development and validation of a questionnaire on eating behaviour for school children and its correlation with nutritional status. Indian J. Public Health Res. Dev. 2020, 11, 1–6. [Google Scholar]
- Drouin, O.; Winickoff, J.P. Screening for behavioral risk factors is not enough to improve preventive services delivery. Acad. Pediatr. 2018, 18, 460–467. [Google Scholar] [CrossRef]
- Nemec, K.B.; Keim, K.S.; Mullen, M.; Sowa, D.; Lui, K.J. Reliability and validity of the Child Nutrition and Physical Activity Screening Tool. Top. Clin. Nutr. 2018, 33, 106–117. [Google Scholar] [CrossRef]
- Lazarou, C.; Panagiotakos, D.B.; Spanoudis, G.; Matalas, A.L. E-KINDEX: A dietary screening tool to assess children’s obesogenic dietary habits. J. Am. Coll. Nutr. 2011, 30, 100–112. [Google Scholar] [CrossRef]
- Moreno, J.P.; Kelley, M.L.; Landry, D.N.; Paasch, V.; Terlecki, M.A.; Johnston, C.A.; Foreyt, J.P. Development and validation of the Family Health Behavior Scale. Int. J. Pediatr. Obes. 2011, 6, e480–e486. [Google Scholar] [CrossRef] [PubMed]
- Peyer, K.L.; Welk, G.J. Construct validity of an obesity risk screening tool in two age groups. Int. J. Environ. Res. Public Health 2017, 14, 419. [Google Scholar] [CrossRef] [PubMed] [Green Version]
- Park, S.H.; Park, C.G.; McCreary, L.; Norr, K.F. Cognitive interviews for validating the family nutrition physical activity instrument for korean-american families with young children. J. Pediatr. Nurs. 2017, 36, 1–6. [Google Scholar] [CrossRef] [PubMed]
- Wright, N.D.; Groisman-Perelstein, A.E.; Wylie-Rosett, J.; Vernon, N.; Diamantis, P.M.; Isasi, C.R. A lifestyle assessment and intervention tool for pediatric weight management: The HABITS questionnaire. J. Hum. Nutr. Diet. 2011, 24, 96–100. [Google Scholar] [CrossRef] [PubMed] [Green Version]
- Quelly, S.B. Developing and testing adapted measures of children’s self-efficacy, intentions, and behaviors associated with childhood obesity. Child. Health Care 2018, 47, 67–82. [Google Scholar] [CrossRef]
- Gance-Cleveland, B.; Schmiege, S.; Aldrich, H.; Stevens, C.; Scheller, M. Reliability and validity of HeartSmartKids: A survey of cardiovascular risk factors in children. J. Pediatr. Health Care 2018, 32, 381–386. [Google Scholar] [CrossRef]
- Vaughn, A.E.; Dearth-Wesley, T.; Tabak, R.G.; Bryant, M.; Ward, D.S. Development of a comprehensive assessment of food parenting practices: The Home Self-Administered Tool for Environmental Assessment of Activity and Diet Family Food Practices Survey. J Acad. Nutr. Diet. 2017, 117, 214–227. [Google Scholar] [CrossRef]
- West, F.; Sanders, M.R. The Lifestyle Behaviour Checklist: A measure of weight-related problem behaviour in obese children. Int. J. Pediatr. Obes. 2009, 4, 266–273. [Google Scholar] [CrossRef]
- Gerards, S.M.; Hummel, K.; Dagnelie, P.C.; de Vries, N.K.; Kremers, S.P. Parental self-efficacy in childhood overweight: Validation of the Lifestyle Behavior Checklist in the Netherlands. Int. J. Behav. Nutr. Phys Act. 2013, 10, 7. [Google Scholar] [CrossRef] [Green Version]
- Smith, S.R.; Johnson, S.T.; Oldman, S.M.; Duffy, V.B. Pediatric Adapted Liking Survey: A novel, feasible and reliable dietary screening in clinical practice. Caries Res. 2019, 53, 153–159. [Google Scholar] [CrossRef]
- Kowalkowska, J.; Wadolowska, L.; Hamulka, J.; Wojtas, N.; Czlapka-Matyasik, M.; Kozirok, W.; Bronkowska, M.; Sadowska, J.; Naliwajko, S.; Dziaduch, I.; et al. Reproducibility of a short-form, multicomponent dietary questionnaire to assess food frequency consumption, nutrition knowledge, and lifestyle (SF-FFQ4PolishChildren) in polish children and adolescents. Nutrients 2019, 11, 2929. [Google Scholar] [CrossRef] [PubMed] [Green Version]
- Hendrie, G.A.; Coveney, J.; Cox, D.N. Factor analysis shows association between family activity environment and children’s health behaviour. Aust. NZJ Public Health 2011, 35, 524–529. [Google Scholar] [CrossRef] [PubMed]
- Huang, Y.J.; Wong, S.H.; Salmon, J.; Hui, S.S. Reliability and validity of psychosocial and environmental correlates measures of physical activity and screen-based behaviors among Chinese children in Hong Kong. Int. J. Behav. Nutr. Phys. Act. 2011, 8, 16. [Google Scholar] [CrossRef] [PubMed] [Green Version]
- Hendricks, C.; Murdaugh, C.; Pender, N. The Adolescent Lifestyle Profile: Development and psychometric characteristics. J. Natl. Black Nurses Assoc. 2006, 17, 1–5. [Google Scholar]
- Sousa, P.; Gaspar, P.; Fonseca, H.; Hendricks, C.; Murdaugh, C. Health promoting behaviors in adolescence: Validation of the Portuguese version of the Adolescent Lifestyle Profile. J. Pediatr. 2015, 91, 358–365. [Google Scholar] [CrossRef] [PubMed] [Green Version]
- Lebron, C.N.; Lee, T.K.; Prado, G.; St. George, S.M.; Pantin, H.; Messiah, S.E. Psychometric properties of an abbreviated Childhood Family Mealtime Questionnaire among overweight and obese Hispanic adolescents. Appetite 2019, 140, 169–179. [Google Scholar] [CrossRef]
- Kosti, R.I.; Panagiotakos, D.B.; Mariolis, A.; Zampelas, A.; Athanasopoulos, P.; Tountas, Y. The Diet-Lifestyle Index evaluating the quality of eating and lifestyle behaviours in relation to the prevalence of overweight/obesity in adolescents. Int. J. Food. Sci. Nutr. 2009, 60 (Suppl. 3), 34–47. [Google Scholar] [CrossRef]
- Mohamadian, H.; Ghannaee, M.; Kortdzanganeh, J.; Meihan, L. Reliability and construct validity of the Iranian version of health-promoting lifestyle profile in a female adolescent population. Int. J. Prev. Med. 2013, 4, 42–49. [Google Scholar]
- Fernald, D.H.; Froshaug, D.B.; Dickinson, L.M.; Balasubramanian, B.A.; Dodoo, M.S.; Holtrop, J.S.; Hung, D.Y.; Glasgow, R.E.; Niebauer, L.J.; Green, L.A. Common measures, better outcomes (COMBO): A field test of brief health behavior measures in primary care. Am. J. Prev. Med. 2008, 35, S414–S422. [Google Scholar] [CrossRef]
- Hyun, H.; Lee, H.; Ro, Y.; Gray, H.L.; Song, K. Body image, weight management behavior, nutritional knowledge and dietary habits in high school boys in Korea and China. Asia Pac. J. Clin. Nutr. 2017, 26, 923–930. [Google Scholar]
- Costa-Tutusaus, L.; Guerra-Balic, M. Development and psychometric validation of a scoring questionnaire to assess healthy lifestyles among adolescents in Catalonia. BMC Public Health 2016, 16, 89. [Google Scholar] [CrossRef] [PubMed] [Green Version]
- Tavakol, M.; Dennick, R. Making sense of Cronbach’s alpha. Int. J. Med. Educ. 2011, 2, 53–55. [Google Scholar] [CrossRef] [PubMed]
- Prinsen, C.A.C.; Mokkink, L.B.; Bouter, L.M.; Alonso, J.; Patrick, D.L.; de Vet, H.C.W.; Terwee, C.B. COSMIN guideline for systematic reviews of patient-reported outcome measures. Qual. Life Res. 2018, 27, 1147–1157. [Google Scholar] [CrossRef] [PubMed] [Green Version]
- Ledoux, T.A.; Hingle, M.D.; Baranowski, T. Relationship of fruit and vegetable intake with adiposity: A systematic review. Obes. Rev. 2011, 12, e143–e150. [Google Scholar] [CrossRef] [PubMed]
- Monzani, A.; Ricotti, R.; Caputo, M.; Solito, A.; Archero, F.; Bellone, S.; Prodam, F. A systematic review of the association of skipping breakfast with weight and cardiometabolic risk factors in children and adolescents. What should we better investigate in the future? Nutrients 2019, 11, 387. [Google Scholar] [CrossRef] [Green Version]
- Berge, J.M.; Wall, M.; Hsueh, T.F.; Fulkerson, J.A.; Larson, N.; Neumark-Sztainer, D. The protective role of family meals for youth obesity: 10-year longitudinal associations. J. Pediatr. 2015, 166, 296–301. [Google Scholar] [CrossRef] [Green Version]
- Morrissey, B.; Taveras, E.; Allender, S.; Strugnell, C. Sleep and obesity among children: A systematic review of multiple sleep dimensions. Pediatr. Obes. 2020, 15, e12619. [Google Scholar] [CrossRef] [Green Version]
- Matricciani, L.; Paquet, C.; Galland, B.; Short, M.; Olds, T. Children’s sleep and health: A meta-review. Sleep Med. Rev. 2019, 46, 136–150. [Google Scholar] [CrossRef]
- Córdova, F.V.; Barja, S.; Brockmann, P.E. Consequences of short sleep duration on the dietary intake in children: A systematic review and metanalysis. Sleep Med. Rev. 2018, 42, 68–84. [Google Scholar] [CrossRef]
- Gazmararian, J.; Smith, J. Role of sleep duration and obesity-related health behaviors in young children. Prev. Med. Rep. 2020, 20, 101199. [Google Scholar] [CrossRef]
- Xu, H.; Wen, L.M.; Rissel, C. Associations of parental influences with physical activity and screen time among young children: A systematic review. J. Obes. 2015, 2015, 546925. [Google Scholar] [CrossRef] [PubMed] [Green Version]
- Golan, M.; Crow, S. Parents are key players in the prevention and treatment of weight-related problems. Nutr. Rev. 2004, 62, 39–50. [Google Scholar] [CrossRef]
- De Moor, C.; Baranowski, T.; Cullen, K.W.; Nicklas, T. Misclassification associated with measurement error in the assessment of dietary intake. Public Health Nutr. 2003, 6, 393–399. [Google Scholar] [CrossRef] [PubMed]
- Hulst, J.M.; Zwart, H.; Hop, W.C.; Joosten, K.F. Dutch national survey to test the STRONGkids nutritional risk screening tool in hospitalized children. Clin. Nutr. 2010, 29, 106–111. [Google Scholar] [CrossRef] [PubMed]
- McCarthy, H.; Dixon, M.; Crabtree, I.; Eaton-Evans, M.J.; McNulty, H. The development and evaluation of the Screening Tool for the Assessment of Malnutrition in Paediatrics (STAMP©) for use by healthcare staff. J. Hum. Nutr. Diet. 2012, 25, 311–318. [Google Scholar] [CrossRef] [Green Version]
- Gerasimidis, K.; Keane, O.; Macleod, I.; Flynn, D.M.; Wright, C.M. A four-stage evaluation of the Paediatric Yorkhill Malnutrition Score in a tertiary paediatric hospital and a district general hospital. Br. J. Nutr. 2010, 104, 751–756. [Google Scholar] [CrossRef]
- White, M.; Lawson, K.; Ramsey, R.; Dennis, N.; Hutchinson, Z.; Soh, X.Y.; Matsuyama, M.; Doolan, A.; Todd, A.; Elliott, A.; et al. Simple Nutrition Screening Tool for Pediatric Inpatients. JPEN J. Parenter. Enteral Nutr. 2016, 40, 392–398. [Google Scholar] [CrossRef]
- Rolstad, S.; Adler, J.; Rydén, A. Response burden and questionnaire length: Is shorter better? A review and meta-analysis. Value Health 2011, 14, 1101–1108. [Google Scholar] [CrossRef] [Green Version]


Publisher’s Note: MDPI stays neutral with regard to jurisdictional claims in published maps and institutional affiliations. |
© 2022 by the authors. Licensee MDPI, Basel, Switzerland. This article is an open access article distributed under the terms and conditions of the Creative Commons Attribution (CC BY) license (https://creativecommons.org/licenses/by/4.0/).
Share and Cite
Krijger, A.; ter Borg, S.; Elstgeest, L.; van Rossum, C.; Verkaik-Kloosterman, J.; Steenbergen, E.; Raat, H.; Joosten, K. Lifestyle Screening Tools for Children in the Community Setting: A Systematic Review. Nutrients 2022, 14, 2899. https://doi.org/10.3390/nu14142899
Krijger A, ter Borg S, Elstgeest L, van Rossum C, Verkaik-Kloosterman J, Steenbergen E, Raat H, Joosten K. Lifestyle Screening Tools for Children in the Community Setting: A Systematic Review. Nutrients. 2022; 14(14):2899. https://doi.org/10.3390/nu14142899
Chicago/Turabian StyleKrijger, Anne, Sovianne ter Borg, Liset Elstgeest, Caroline van Rossum, Janneke Verkaik-Kloosterman, Elly Steenbergen, Hein Raat, and Koen Joosten. 2022. "Lifestyle Screening Tools for Children in the Community Setting: A Systematic Review" Nutrients 14, no. 14: 2899. https://doi.org/10.3390/nu14142899
APA StyleKrijger, A., ter Borg, S., Elstgeest, L., van Rossum, C., Verkaik-Kloosterman, J., Steenbergen, E., Raat, H., & Joosten, K. (2022). Lifestyle Screening Tools for Children in the Community Setting: A Systematic Review. Nutrients, 14(14), 2899. https://doi.org/10.3390/nu14142899