Abstract
Pre-pregnancy, pregnancy and postpartum are critical life stages associated with higher weight gain and obesity risk. Among these women, the sociodemographic groups at highest risk for suboptimal lifestyle behaviours and core lifestyle components associated with excess adiposity are unclear. This study sought to identify subgroups of women meeting diet/physical activity (PA) recommendations in relation to sociodemographics and assess diet/PA components associated with body mass index (BMI) across these life stages. Cross-sectional data (Australian National Nutrition and Physical Activity Survey 2011–2012) were analysed for pre-pregnancy, pregnant and postpartum women. The majority (63–95%) of women did not meet dietary or PA recommendations at all life stages. Core and discretionary food intake differed by sociodemographic factors. In pre-pregnant women, BMI was inversely associated with higher whole grain intake (β = −1.58, 95% CI −2.96, −0.21; p = 0.025) and energy from alcohol (β = −0.08, −0.14, −0.005; p = 0.035). In postpartum women, BMI was inversely associated with increased fibre (β = −0.06, 95% CI −0.11, −0.004; p = 0.034) and PA (β = −0.002, 95% CI −0.004, −0.001; p = 0.013). This highlights the need for targeting whole grains, fibre and PA to prevent obesity across life stages, addressing those most socioeconomically disadvantaged.
1. Introduction
Reproductive age women are at higher risk of longitudinal weight gain and developing obesity [1]. Data from longitudinal studies reports that women gain on average up to 0.7 kg per year, and there are greater rates of weight gain in women aged 18–50 years compared to women aged 50 and over [1]. Reproductive life stages, including preconception, pregnancy and postpartum, are critical windows that drive weight gain and maternal adiposity [2]. Nearly 50% of women enter pregnancy with overweight or obesity [3] or gain weight above the Institute of Medicine guidelines’ recommendation during pregnancy [4], and postpartum women retain an extra 0.5–3 kg on average during each pregnancy [5]. Overweight and obesity in preconception and during pregnancy increase the risk of maternal complications and adverse birth outcomes [4,6]. Maternal obesity at conception increases the time to conceive, reduces fertility and increases the risk of future comorbidities, such as type-2 diabetes and cardiovascular diseases, including hypertension [6]. Furthermore, higher pre-pregnancy body mass index (BMI) is a strong predictor of excessive gestational and pregnancy complications [7]. Excessive gestational weight gain additionally drives postpartum weight retention (PPWR), which further increases risks for subsequent pregnancies and exacerbates maternal obesity [8].
Diet and physical activity (PA) are key modifiable risk factors in weight gain and obesity, and optimal diet and regular PA are inversely associated with weight gain and obesity [9,10]. Optimal diet and a higher level of PA can therefore prevent weight gain and obesity [11]. Suboptimal diet and PA have been reported in adults at the population level [12,13]. As a specific high-risk population for weight gain and future obesity, women in pre-pregnancy, during pregnancy and postpartum also have unhealthy dietary patterns and poor diet quality [14]. For example, only 7–10% of pregnant and postpartum women meet population-level recommended intakes of healthy core foods [15,16], and 80% of pregnant women are insufficiently active, which persists into postpartum [16,17,18]. This may be related to barriers such as fatigue or a lack of motivation, and confidence and time. Women may also prioritise family commitments (e.g., parenting or household responsibilities) over their personal lifestyles [19,20]. All these barriers to a healthy lifestyle and sociodemographic factors are potentially associated with increased adiposity in pre-pregnancy, excessive gestational weight gain during pregnancy and PPWR. However, there is limited and conflicting research on sociodemographic factors associated with meeting population-level diet and PA recommendations in women across the reproductive life stages [21].
National guidelines broadly recommend targeting unhealthy diet and sedentary behaviour for management of overweight and obesity in the general population [22]. Women at key reproductive life stages may also benefit from targeting specific diet and PA components to prevent excess adiposity. Identifying both specific diet and PA components and specific groups of reproductive age women could contribute to future interventions for preventing weight again and obesity. This would also contribute to the evidence base for tailoring intervention strategies to improve healthy eating and increase PA in specific high-risk groups of women. We hypothesise that women across reproductive life stages have inadequate diets and PA levels, which may be disparately linked with sociodemographic characteristics, including age, ethnicity, geographic location, marital status, employment and educational and socioeconomic disadvantages. We also hypothesise that higher intakes of specific core foods and increased PA will be associated with lower BMI, but increased total energy intake and higher energy from total discretionary foods will be associated with higher BMI.
The aims of this study were: (ⅰ) to identify women who meet and do not meet diet and PA population-level recommendations based on sociodemographic factors and (ⅱ) to assess the key diet and PA components associated with BMI in women across the reproductive life stages.
2. Materials and Methods
2.1. Data Source and Study Participants
We used data from the National Nutrition and PA Survey (NNPAS) component of the 2011–2012 Australian Health Survey (AHS) conducted by the Australian Bureau of Statistics (ABS) between May 2011 and June 2012. This national survey was designed to provide detailed information on the health and wellbeing of the Australian population. A stratified multistage sampling of urban and rural private dwellings was obtained to ensure a representative sample of Australians (N = 12,153). Detailed information on participant recruitment, the survey design, data collection and response rates have been previously reported in the Australian Health Survey User Guide [23].
Data were collected using a face-to-face interview from randomly selected people in each selected household (one adult ≥ 18 years and one child aged 2–17 years where applicable). Ethical approval was not required because this study was based on secondary data using Confidentialised Unit Record Files (CURF).
This sub-study was a cross-sectional analysis limited to reproductive age women in various key reproductive life stages (pre-pregnancy, pregnancy and postpartum) (Figure 1) (N = 2492). Key reproductive life stages were identified based on proxy questions on ‘female life stages’ and ‘number of children’ in the household (household type, ‘HHTYP’ variable). The question ‘female life stages’ has responses: 1: Have never menstruated. 2: Currently pregnant. 3: Currently breastfeeding. 4: Currently experiencing menopause. 5: Post menopause. 6: None of these apply. 9: Not applicable. To identify pre-pregnancy and postpartum, responses 4 and 5 were excluded. Then, female life stage responses 1 or 6 or 9 (have never menstruated OR none of these apply OR not applicable) AND household type responses: 1 (person living alone), 2 (couple only), 5 (unrelated persons aged 15+ only), 6 (all other households) AND age 18–48 (to exclude lower limit of perimenopause [24]) were classified as pre-pregnancy. Female life stage responses: 3 or 6 or 9 (current breastfeeding OR none of these apply OR not applicable) AND household type responses: 3 (couple family with children) or 4 (one parent family with children) AND age 18–48 were classified as postpartum women; and those who responded currently pregnant taken as pregnant women (Table S1). We note that by this definition, pre-pregnant women were all reproductive age women who were not pregnant or postpartum at the time of the survey.
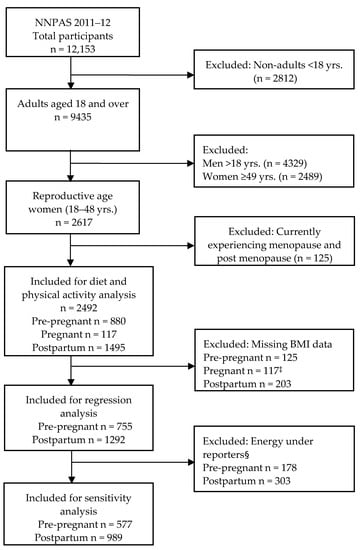
Figure 1.
Flow diagram of study participant inclusion for analysis. NNPA, National Nutrition and Physical activity Survey. ‡ Weight/BMI measurement from pregnant women was not taken. § Energy under reporters based on Goldberg cut-off (EI:BMR < 0.9).
2.2. Variables and Measures
2.2.1. Dietary Assessment
Dietary information was collected face-to-face using 24 h dietary recall administered by trained interviewers. ABS used an Automated Multiple-Pass Method (AMPM) [25] developed by the Agricultural Research Service of the United States Department of Agriculture to capture all foods, beverages and dietary supplements. The nutrients and energy (kJ) intake were calculated from each food and beverage consumed using the 2011–13 Australian Food and Nutrient (AUSNUT) food composition database developed by Food Standards Australia New Zealand (FSANZ). Individual foods were each given an eight-digit food code and classified into food classification groups using the AUSNUT 2011–13 database. Two-day and 24 h dietary recall were collected; the second day was collected via a telephone interview conducted 8 days or more after the first interview. The first day’s dietary recall response rate was 98% (n = 12,153), and the second day’s recall response rate was 64% (n = 7735). The first day of dietary recall was used for all analyses to retain a larger sample size and ensure national representativeness consistent with previous studies [13,26,27].
Daily serves of the five core food groups and total daily energy from discretionary foods/beverages were calculated. Details of the five core food group serving size definitions and daily recommended intake are presented in Table S2. The usual daily intakes of fruit and vegetables (serves per day), grain/cereal foods (serves/day), whole grains (serves/day, g/day, as half proportion of grains), dairy products (serves per day), lean meats and alternatives (serves per day), total energy intake (kJ/d), energy from macronutrients (carbohydrate (%E), protein (%E), total fat (%E), saturated fat (%E), polyunsaturated fat (%E), monounsaturated fat (%E)) and fibre (g/day) were included in the analyses. Discretionary foods and beverages, including percentages of energy from total discretionary foods/beverages, sugar sweetened beverages (SSBs), saturated fats, alcohol intake and added sugar, were included in the analyses. The ABS classified discretionary foods and beverages in the NNPAS using the discretionary flag list, which was based on food grouping level (five-digit code, e.g., 11,501 soft drinks non-cola, 11,503 soft drinks cola) or individual food level (eight-digit codes where the flag is assigned to individual food codes within the five-digit subgroup). A list of discretionary choices and respective food codes with examples are presented in Table S3.
2.2.2. PA
Self-reported PA levels were assessed using the Active Australia Survey, which has been validated against accelerometers in middle-aged women [28]. Respondents reported the estimated time spent in walking, moderate-intensity activity (e.g., gentle swimming, social tennis doubles, golf) and vigorous PA (e.g., jogging, fast cycling, circuit training, competitive tennis) in the past week. The reported durations (excluding the number of sessions) of these activities were summed (sum of minutes) to estimate the total time spent in PA. We used only the duration of PA reported during the previous week to ensure comparability with international guidelines. Total minutes of PA was dichotomised as meeting (≥150 min/week) or not meeting the guidelines (<150 min/week) according to the 2014 Australia’s PA and Sedentary Behaviour Guidelines for Adults [29]. Furthermore, the reported durations for moderate and vigorous activity (multiplied by two) were summed to estimate the total time spent in moderate–vigorous PA (MVPA), which was used both as a continuous variable and dichotomised as ≥150 MVPA minutes/week or ≤ 150 MVPA minutes/week. In multivariable analysis, we included total PA, as it includes all types of activity, such as walking and moderate to vigorous activities, which can be common across life stages.
2.2.3. Covariates
Covariates in the analyses included age (in years), marital status (married vs. not married), country of birth (Australian born, mainly English-speaking country born, other countries), educational level (bachelor/graduate diploma, certificates/advanced diploma or other no non-school qualifications), socio-economic index for areas (SEIFA) or index of relative socio-economic disadvantage (IRSD) (in quintiles: quintile one corresponds to the lowest scores for the most disadvantaged areas and quintile five represents the highest scores for the most advantaged areas), remoteness (inner regional Australia, major cities and other (outer regional/remote)), household income (in quintiles considered as continuous in regression analyses) and health behaviours, such as smoking status (current smoker, ex-smoker or never smoked) and self-assessed health (excellent/very good, good, fair and poor). Participants were also asked whether they were currently on a diet: responses included currently on a diet to lose weight, currently on a diet for health reasons, currently on a diet to lose weight and for health reasons, not currently on a diet or not applicable. Responses were dichotomized to currently on a diet for any reason and not currently on diet.
2.2.4. Dependent Variable
Anthropometric measures (weight and height) of the respondents were taken during the interview using a digital scale (maximum 150 kg and recoded to the nearest 0.1 kg) and a stadiometer (maximum 210 cm and recorded to the nearest 0.1 cm) respectively. Participants were encouraged to remove their shoes and heavy clothing before measurements were taken. Height measurements were repeated on a random 10% sample of respondents to validate the measurement, and if the second measurement of height or waist varied by more than one centimetre, then a third reading was taken. Body mass index (BMI, kg/m2) was calculated from measured weight and height as weight in kilograms divided by the square of height in metres. Anthropometric data of women who were pregnant at the time of the survey were not obtained. According to WHO categories, BMI was defined as underweight (<18.5 kg/m2), normal weight (18.5–24.9 kg/m2), overweight (25.0–29.9 kg/m2) and obese (≥30 kg/m2).
2.3. Statistical Analysis
Descriptive statistics were used to estimate the proportion and mean consumption of dietary intake and PA across reproductive life stages (pre-pregnancy, pregnancy and postpartum). Pearson Chi-square tests were used to determine differences between categorical variables and student’s t-test for continuous variables.
Univariable and multivariable linear regression analyses were performed to investigate diet, PA and sociodemographic factors associated with BMI in pre-pregnancy and postpartum. For multivariable regression, residuals were checked and met the normality assumption. All estimates (proportion, means, standard error, beta-coefficients and 95% CI) were population weighted to take into account sampling weights and sampling design of the survey by applying replicate weights. Jack knife replicate weights were used to obtain unbiased standard errors and coefficient estimates. The analysis was based on complete case data, and codes followed recommendations [30] to account for the complex survey design.
The backward stepwise regression technique was used to select most appropriate variables, removing the least significant variables one by one (variable with the highest p-value in the model) and continued until a parsimonious model was reached (p < 0.05). The variables were assessed for multicollinearity through the variance inflation factor (VIF) and tolerance statistics (VIF > 10) to exclude the redundant explanatory variables. Collinear variables were excluded, as they showed linear relationship with the other independent variables. All statistical analyses were performed using STATA SE version 16.1 (StataCorp LLC, College Station, TX, USA). Statistical significance was considered at p-value ≤ 0.05.
2.4. Sensitivity Analysis
Under-reporting is common in nutrition surveys, as people tend to underestimate their food intakes [31], which would affect the overall results. The most utilised method to identify under-reporters is to compare each person’s basal metabolic rate (BMR) with their reported energy intake (EI) and apply Goldberg cut-off values to examine whether the EI reported is plausible. We employed this approach to identify under-reporters, and a sensitivity analysis was performed in women only with plausible energy intakes (excluding under-reporters) consistent with previous studies [32,33]. Briefly, BMR is the amount of energy needed for an individual’s minimum set of body functions required for life over a 24 h period. This was calculated in kilojoules per 24 h based on individual’s age, sex and weight without activity level adjustment. The ratio of energy intake (EI) to BMR (EI:BMR) was used to identify under-reporters (implausibly low energy intakes) using the Goldberg cut-off limit of 0.9 for EI:BMR. This is for data below the 95% confidence limit for an individual, allowing for daily variation in energy intakes and errors in EI:BMR computation. After excluding 481 women (pre-pregnancy n = 178 and postpartum n = 303) with implausibly low energy intake, n = 577 pre-pregnant and n = 989 postpartum women were included for sensitivity analysis in the multivariable model (Figure 1). Approximately a quarter of the total analytical sample, with similar proportions of pre-pregnant (23.6%) and postpartum women (23.5%), were excluded in the sensitivity analysis.
3. Results
3.1. Sociodemographic Characteristics
Socio-demographic characteristics across reproductive life stages are presented in Table 1. The mean ages of study participants were 31.2 ± 8.4, 29.3 ± 5.3 and 33.6 ± 8.7 years for pre-pregnant, pregnant and postpartum women, respectively. One in five (20.7%) and 19.3% of pre-pregnant women were overweight and obese, respectively, whereas 25.4% and 22.3% of postpartum women were overweight and obese, respectively. The majority of the participants (64.8% pre-pregnant, 66.7% pregnant and 74.9% postpartum) were Australian born. Next, 42.0% of pre-pregnant, 33.8% of pregnant and 29.4% of postpartum women had high education levels (bachelor’s degree or graduate diploma); 38.6% of pre-pregnant, 69.6% of pregnant and 52.2% of postpartum women were married; 58.6% of prepregnant, 55.6% of pregnant and 60.3% of postpartum women reported never smoking; and 90.0% of pre-pregnant, 96.0% of pregnant and 90.6% of postpartum women reported ‘excellent/very good/good’ self-rated health.

Table 1.
Sociodemographic characteristics across reproductive life stages (n = 2492).
3.2. Proportion of Reproductive Age Women Meeting Recommended Intakes of Core Foods, Discretionary Choices and PA
The mean intakes of core food groups, discretionary foods, energy from macronutrients and PA across reproductive life stages are shown in Table 2 and Table 3; and the proportions of women who met and did not meet population-level dietary recommendations are shown in Figure 2. Similar mean proportions of total daily energy were from discretionary foods, beverages and SSBs in pre-pregnant (33.4% and 3.77% respectively), pregnant (29.1% and 4.94% respectively) and postpartum (31.5% and 3.51% respectively) women (Table 2).
Table 2.
Core food groups and energy from discretionary foods in women across reproductive life stages.
Table 3.
Energy and macronutrient intake and PA in women across reproductive life stages.
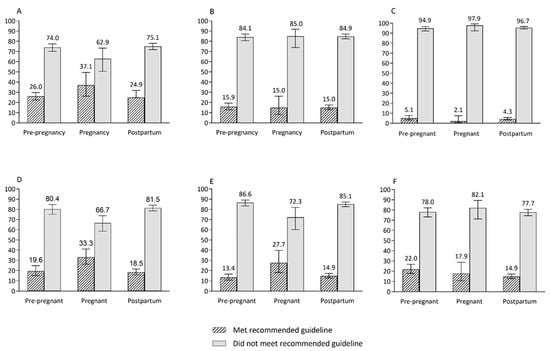
Figure 2.
The proportions of women who met and do not meet the population-level recommended intakes of core food groups across reproductive life stages. (A) Fruit, (B) vegetables and legumes, (C) fruit and vegetable combined, (D) grain (cereal) foods, (E) milk and alternatives, (F) meat and alternatives.
Approximately one in ten women across all life stages obtained much of their daily energy from added sugars, and this portion was slightly higher in pregnant women (11.8%).
Despite reproductive age women not meeting the recommended serves of core foods, energy intake from macronutrients was generally in the optimal range across reproductive life stages (Table 3) (acceptable macronutrient distribution range: 15–25% of energy from protein, 20–35% of energy from fat and 45–65% of energy from carbohydrates) [34]. Similar proportions of women met the recommended daily intakes of both fruit and vegetables (5.12% of pre-pregnant, 2.14% of pregnant and 4.35% of postpartum women), vegetables (15.9% for pre-pregnant and 15.0% for pregnant and postpartum women) and meat and alternatives (17.9% of pregnant and 22.0% of pre-pregnant and postpartum women) (Figure 2). The proportions of women who met recommended intakes of fruit, grains/cereals and dairy or alternatives were higher for pregnant women (37.1%, 33.3% and 27.7%, respectively) than pre-pregnant (26.0%, 19.6% and 13.4%, respectively) and postpartum (24.9%, 18.5% and 14.9%, respectively) women (Figure 2). The proportion of women meeting PA guidelines (total activity in minutes) was lower for pregnant women (31.0%) than for pre-pregnant (59.4%) and postpartum (48.8%) women. Similarly, a low proportion of pregnant women (6.9%) had ≥150 min MVPA/week compared to pre-pregnant (30.6%) and postpartum women (25.4%) (Figure 3).
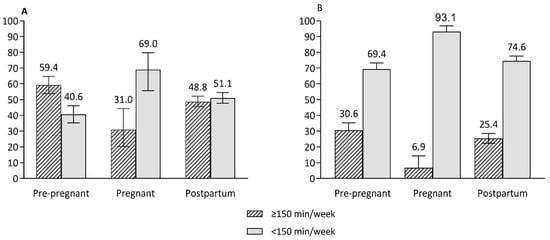
Figure 3.
The proportions of women who spent time performing physical activity at least 150 min per week or more across reproductive life stages. (A) Total minutes of physical activity per week, (B) moderate–vigorous intensity activity per week. Error bars represent 95% CI of proportions.
Differences in sociodemographic characteristics for women meeting or not meeting population recommendations for diet and PA pre-pregnancy and postpartum are reported in Tables S4a–g. These data are not presented for pregnant women due to the small sample size. For pre-pregnant women, the recommended intakes of vegetables; fruit; dairy or alternatives; and meat or alternatives, did not differ by sociodemographic factors. For post-partum women, the recommended intakes of dairy or alternatives and meat or alternatives did not differ by sociodemographic factors. Pre-pregnant women born in Australia were less likely to meet the recommended intake of grains/cereals and more likely to have intake of discretionary foods above the recommended level (>2.5 serves/day). Those with a higher education and SEIFA were more likely to meet the PA recommendations. Postpartum women with a higher education were more likely to meet the recommended intakes of vegetables and fruit; those born in Australia were less likely to meet the recommended intakes of fruit and grains/cereals and discretionary foods; those with professional jobs were more likely to meet the recommended intake of fruit, and those with a higher education and SEIFA were more likely to meet the PA recommendations.
3.3. Diet and PA Variables Associated with BMI
In multivariable analysis among pre-pregnant women, BMI was inversely associated with higher intake of whole grains (β = −1.58, 95% CI −2.96, −0.21; p = 0.025) and with increased energy from alcohol (β = −0.08, 95% CI −0.14, −0.005; p = 0.035) (Table 4). However, no associations were found among core foods (fruit, vegetable, grain/cereal foods, dairy, meat and/or alternatives), total energy intake, energy from discretionary foods/beverages, SSBs and PA. With regard to sociodemographic factors, in pre-pregnant women, age (β = 0.22, 95% CI 0.15, 0.29; p < 0.001), being born in other county (β = −3.20, 95% CI −4.52, −1.88; p < 0.001), being a current smoker (β = −1.40, 95% CI −2.76, −0.04; p = 0.044), excellent/very good/good health (β = −2.89, 95% CI −5.51, −0.28; p = 0.030) and currently on a diet (β = 2.25, 95% CI 0.25, 4.24; p = 0.028) were independently associated with BMI (Table 4).
Table 4.
Associations between diet and physical activity and BMI in pre-pregnant women (N = 755).
In postpartum women, BMI was inversely associated with increased fibre intake (β = −0.06, 95% CI −0.11, −0.004; p = 0.034) and each minute increase in PA per week (β = −0.002, 95% CI −0.004, −0.001; p = 0.013) (Table 5). There were no significant associations between fruit, vegetable, whole grain, dairy, meat and/or alternatives, total energy intake and energy from discretionary foods and BMI in postpartum. Higher socioeconomic disadvantage (β = −1.73,95% CI −3.12, −0.05; p = 0.017; Q5 vs. Q1) and excellent/very good/good health condition (β = −2.30, 95% CI −4.06, −0.54; p = 0.011) were inversely associated with BMI, whereas currently on diet (β = 2.82, 95% CI 1.76, 3.89; p < 0.001) and increased age (β = 0.13, 95% CI 0.08, 0.19; p < 0.001) were positively associated with BMI (Table 5).
Table 5.
Associations between diet and physical activity and BMI in postpartum women (N = 1292).
3.4. Results from Sensitivity Analysis
Multivariable linear regression analysis results of diet and PA and BMI after excluding implausible energy reporters in pre-pregnant and postpartum women are presented in Table 6. In pre-pregnant women, the associations between whole grains and energy from alcohol and BMI were not maintained in the sensitivity analysis. Other diet variables showed similar associations in terms of directionality without substantial differences in the magnitudes of estimates (<20% relative change) from the main analysis. In postpartum women, the association between fibre and BMI was no longer statistically significant, but the total energy intake’s association with BMI became statistically significant. The inverse association between increased PA and BMI was maintained after excluding implausible energy reporters.
Table 6.
Sensitivity analysis of the associations between diet and physical activity and BMI after excluding implausible energy reporters among pre-pregnant and postpartum women.
4. Discussion
4.1. Main Findings
We report here for the first time on diet and PA and their associations with BMI in a nationally representative sample of Australian women across key reproductive life stages. We confirm women across life stages failed, on average, to meet population-level recommended intakes of key core foods. A higher proportion of daily energy from discretionary foods persisted in pre-pregnant, pregnant and postpartum women. Sociodemographic factors, including country of birth, education, occupation and socioeconomic disadvantage areas, were associated with core and discretionary food intake and PA in pre-pregnancy and postpartum women. An inverse association was observed for both higher whole grain intake and higher energy from alcohol and BMI in pre-pregnant women, whereas increased fibre intake and PA were inversely associated with BMI in postpartum women.
4.2. Meeting Recommended Intakes of Core Foods, Discretionary Choices and PA
Our findings of failure to meet population-level recommendations for core foods, discretionary foods and PA are consistent with previous studies in pre-pregnant, pregnant [21,36] and postpartum women [37,38] and in the general population [13]. Failure to meet dietary or PA recommendations may be explained by factors, including lack of awareness, limited resources for accessing healthy foods for low-socioeconomic-status women, [36], cultural influences on food choice, lack of social support, exposure to fast food outlets [39] and other psychosocial barriers [40]. Low proportions of pregnant and postpartum women met the PA guidelines, which is consistent with previous studies [41,42,43]. Several barriers may prevent pregnant women from engaging in PA, including perceived mother–baby safety concerns, fatigue, lack of motivation and lack of social support [44,45]; and barriers such as time limitations, lack of childcare, lack of partner support and family responsibilities may prevent PA by postpartum women [20].
4.3. Socioeconomic Factors
Consistent with prior research in the general population [46,47,48], a range of sociodemographic characteristics were associated with meeting the recommended intakes of PA guidelines in pre-pregnant and postpartum women. For women pre-pregnancy, those born in Australia were less likely to have an optimal intake of grains/cereals, and those with higher education and the least socioeconomically disadvantaged were more likely to meet PA guidelines. Conversely, the recommended intakes of vegetables, fruit, dairy or alternatives and meat or alternatives did not differ by sociodemographic factors in pre-pregnant women, as previously reported [21]. Postpartum women with higher education and living in socioeconomically advantaged areas were more likely to have the recommended intakes of vegetables and fruits and the recommended level of PA. While research is limited in postpartum women, this finding is consistent with previous studies reporting socio-economic disadvantage as being a strong determinant of fruit and vegetable intake [46] and PA [48] in the general population. A disparity in overall food and nutrient intake has been previously reported between Australian-born and overseas-born women, with overseas born women having higher intakes of cereals/beans but less vegetable/legume, dairy and meat intakes than Australian-born women [49]. This suggests that future interventions could potentially target grains/cereals and PA for pregnant women; and vegetables, fruit, discretionary foods and PA for postpartum women, specifically those from different ethnic and socioeconomic backgrounds.
4.4. Dietary Components and BMI
A higher whole grain intake (≥3 servings/day) in pre-pregnant women and increased fibre intake in postpartum were associated with decreased BMI (kg/m2). The association between wholegrains and BMI in pre-pregnancy is consistent with previous meta-analyses in the general population reporting ≥3 servings/day whole grains was associated with a lower BMI and less central adiposity [50]. In postpartum women, a 1 g/d increase in fibre was associated with a 0.06 kg/m2 lower BMI and 0.15 kg lower postpartum weight gain [51]; and fibre intake below the recommendation (<29 g/day) increased the risk of PPWR by 24% [52]. These findings may be related to the effects of whole grains [53] and fibre [54] on satiety and fullness and the subsequent inhibitory effect on energy intake. Given the mean wholegrains and fibre intakes were ~1.2 serves/day and ~20 g/day, respectively (compared to broad guidelines of ≥3 serves/day [55] and population recommendations of 25–30 g/day [34], respectively), it is imperative to target both fibre and wholegrains for optimising weight management in women at key reproductive life-stages.
We report an inverse association between BMI and energy from alcohol in pre-pregnant women. While there is a lack of research currently on the association between alcohol and obesity in pre-pregnant and postpartum women, there are inconsistent findings in the general population [56,57,58,59]. This may be partly attributed to variations in frequency, amount or types of alcohol, and variations in lifestyle and dietary habits or energy intake for drinkers and non-drinkers [60]. Our analysis was adjusted for factors such as dieting and total energy intake, and indicates an independent relationship between alcohol and BMI in pre-pregnant women. The link between alcohol intake and BMI is likely complex and modifiable across life stages due to physiological variations. Furthermore, given that a large proportion of pregnancies are unplanned [61] and population recommendations are to stop alcohol intake when trying to conceive [35], the contribution of alcohol to both BMI and adverse pregnancy outcomes must be considered.
We observed no significant association between fruit or vegetable intake and BMI in pre-pregnant and postpartum women. This is in contrast to prior studies reporting inverse associations between the ‘vegetables and meat’ pattern and BMI in preconception [14] and the fruit and vegetable index and weight gain in young women [62], and systematic reviews reporting an inverse association between fruit and vegetable intake and BMI in the general population [63]. This discrepancy could be due to the lack of consistent adjustment for important confounders, including total energy intake and the low intake of fruit and vegetables. In contrast to reports in the general population [64,65], we also report no association between energy from discretionary foods or SSBs and BMI in pre-pregnant and postpartum women. These disparate results are unclear, but may be due to the use of different analysis approaches. We used energy from discretionary foods, unlike prior studies that assessed individual discretionary foods [65]. Total energy intake was not also associated with BMI in pre-pregnant and postpartum women, in contrast to prior studies of postpartum women [66]. This may be partly explained by energy misreporting, particularly in women with higher BMIs [67], or other factors, such as the relatively high rate of dieting. In sensitivity analysis, however, increased energy intake was associated with BMI in postpartum women, even after exclusion of energy misreporters. Here, for our main analysis, we reported results without exclusion of energy misreporters, as these are consistent with prior reports from this large national survey [68].
4.5. PA and BMI
We report here a modest but significant inverse association between PA and BMI in postpartum women, which is consistent with some [69,70] but not all [71] observational studies. Conversely, we found no significant association between PA and BMI in pre-pregnant women, which is in contrast to longitudinal studies in reproductive-aged women that reported an inverse association between a higher level of MVPA and weight gain [72] or overweight and obesity [73]. However, these studies did not consistently adjust for important confounders, such as energy intake and other dietary factors. Differences in study design (cross-sectional vs. longitudinal) may partly explain the inconsistent reports. It is difficult to explain the finding here that PA is more closely associated with BMI only in postpartum women, but this may be related to the smaller sample size for the pre-pregnant population. Given over half of women currently undertake suboptimal amounts of PA [16] and the benefits of PA for psychological and physical wellbeing [74] and weight management [69], there is a need for further research to elucidate the mixed findings of PA and BMI in free-living pre-pregnant and postpartum women.
4.6. Strength and Limitations
This study has several strengths. Given the use of a subsample from a nationally representative survey, the results can be generalisable to the Australian population of reproductive age women. Height and weight were collected based on measured data, which give accurate BMI status and more reliable estimates than self-reported data. Furthermore, our analysis followed rigorous methods by accounting for sampling weight and survey design, resulting in unbiased estimates. The analysis also adjusted for several important confounders, such as dieting. However, the limitations of this study should be acknowledged. First, self-reported dietary data based on 24 h recall may be subject to recall bias or misreporting due to social desirability bias [75], which affects the results towards the null. However, the use of AMPM aids to minimize recall bias by maximising the recall of foods and accounting for intrapersonal variability [25]. Second, although 24 h recall gives a good estimation of dietary intake at the population level, dietary data based on one day recall may not reflect the usual intake of foods and nutrients. Third, we used a proxy method to identify reproductive life stages using prespecified terms ‘female life stages’ and ‘number of children’ in the household that may not definitely separate pre-pregnancy and postpartum women. Despite the lack of certainty on the definitions of the specific reproductive life stages, this dataset allowed the use of robust methods of dietary assessment by 24 h recall. Fourth, the sample size for pre-pregnant and pregnant women was relatively small, which may have reduced the power in the multivariable analysis for pre-pregnant women. Finally, the cross-sectional study design precluded the assessment of any causal relationships and may also explain inconsistencies with previous longitudinal studies. We also note that some food group recommendations are different for lactating women. We did not differentiate postpartum women based on breastfeeding status, as the subgroup sample sizes, particularly for sociodemographic analysis, would have been too small.
5. Conclusions
Our findings showed that women across reproductive life stages, in particular, those from lower socioeconomic groups and those born in Australia, failed to meet population-level diet and PA recommendations. In pre-pregnant women, whole grains and energy from alcohol were inversely associated with BMI, and fibre and PA were associated with BMI in postpartum women. This study suggests that the lifestyle components of whole grains, fibre, alcohol and PA; and sociodemographic groups of country of birth, education and socioeconomic disadvantage, should be targeted in future interventions to prevent weight gain or obesity in women across reproductive life stages. The findings, however, should be interpreted with caution due to the indirect definitions of reproductive life stages.
Supplementary Materials
The following supporting information can be downloaded at: https://www.mdpi.com/article/10.3390/nu14132607/s1. Table S1: Definitions of reproductive life stages. Table S2: Core food components, servings and daily recommended intakes according to the Australian Dietary Guideline (ADG 2013). Table S3: Discretionary food groups (food flag) based on the food code assigned in the food classifications system based on Australian Bureau of Statistics. Table S4 a–g: Dietary intake and physical activity by sociodemographic characteristics in pre-pregnant and postpartum women.
Author Contributions
Conceptualization, L.J.M., M.A.A. and T.P.W.; statistical analyses and initial draft of the manuscript, M.A.A.; manuscript review, interpretation of results, edits and supervision, H.S., A.E., T.P.W. and L.J.M. All authors have read and agreed to the published version of the manuscript.
Funding
No funding support was obtained for this study. M.A.A was funded by the Monash International Tuition Scholarship and Monash Graduate Scholarship; L.J.M. is funded by the National Heart Foundation Future Leader Fellowship.
Informed Consent Statement
Informed consent was obtained from all subjects involved in the study.
Data Availability Statement
Publicly available datasets were analysed in this study and can be requested from the Australian Bureau of Statistics: the National Nutrition and Physical Activity Survey 2011–2012 in de-identified format.
Conflicts of Interest
The authors declare no conflict of interest.
References
- Lucke, J.; Waters, B.; Hockey, R.; Spallek, M.; Gibson, R.; Byles, J.; Dobson, A. Trends in women’s risk factors and chronic conditions: Findings from the Australian Longitudinal Study on Women’s Health. Women’s Health 2007, 3, 423–432. [Google Scholar] [CrossRef] [PubMed]
- Ziauddeen, N.; Roderick, P.J.; Macklon, N.S.; Alwan, N.A. The duration of the interpregnancy interval in multiparous women and maternal weight gain between pregnancies: Findings from a UK population-based cohort. Sci. Rep. 2019, 9, 9175. [Google Scholar] [CrossRef] [PubMed]
- National Research Council; Institute of Medicine. Weight Gain during Pregnancy: Reexamining the Guidelines; National Academies Press: Washington, DC, USA, 2010. [Google Scholar]
- Goldstein, R.F.; Abell, S.K.; Ranasinha, S.; Misso, M.L.; Boyle, J.A.; Harrison, C.L.; Black, M.H.; Li, N.; Hu, G.; Corrado, F. Gestational weight gain across continents and ethnicity: Systematic review and meta-analysis of maternal and infant outcomes in more than one million women. BMC Med. 2018, 16, 153. [Google Scholar] [CrossRef] [PubMed]
- Gore, S.A.; Brown, D.M.; West, D.S. The role of postpartum weight retention in obesity among women: A review of the evidence. Ann. Behav. Med. 2003, 26, 149–159. [Google Scholar] [CrossRef]
- Poston, L.; Caleyachetty, R.; Cnattingius, S.; Corvalán, C.; Uauy, R.; Herring, S.; Gillman, M.W. Preconceptional and maternal obesity: Epidemiology and health consequences. Lancet Diabetes Endocrinol. 2016, 4, 1025–1036. [Google Scholar] [CrossRef]
- Marchi, J.; Berg, M.; Dencker, A.; Olander, E.; Begley, C. Risks associated with obesity in pregnancy, for the mother and baby: A systematic review of reviews. Obes. Rev. 2015, 16, 621–638. [Google Scholar] [CrossRef]
- Nehring, I.; Schmoll, S.; Beyerlein, A.; Hauner, H.; von Kries, R. Gestational weight gain and long-term postpartum weight retention: A meta-analysis. Am. J. Clin. Nutr. 2011, 94, 1225–1231. [Google Scholar] [CrossRef]
- Seifu, C.N.; Fahey, P.P.; Hailemariam, T.G.; Frost, S.A.; Atlantis, E. Dietary patterns associated with obesity outcomes in adults: An umbrella review of systematic reviews. Public Health Nutr. 2021, 24, 6390–6414. [Google Scholar] [CrossRef]
- World Health Organization. Overweight and Obesity. Available online: https://www.who.int/news-room/fact-sheets/detail/obesity-and-overweight (accessed on 2 November 2021).
- Farpour-Lambert, N.J.; Ells, L.J.; Martinez de Tejada, B.; Scott, C. Obesity and weight gain in pregnancy and postpartum: An evidence review of lifestyle interventions to inform maternal and child health policies. Front. Endocrinol. 2018, 9, 546. [Google Scholar] [CrossRef]
- Bennie, J.A.; Pedisic, Z.; van Uffelen, J.G.; Gale, J.; Banting, L.K.; Vergeer, I.; Stamatakis, E.; Bauman, A.E.; Biddle, S.J. The descriptive epidemiology of total physical activity, muscle-strengthening exercises and sedentary behaviour among Australian adults–results from the National Nutrition and Physical Activity Survey. BMC Public Health 2015, 16, 73. [Google Scholar] [CrossRef]
- Fayet-Moore, F.; McConnell, A.; Cassettari, T.; Tuck, K.; Petocz, P.; Kim, J. Discretionary intake among Australian adults: Prevalence of intake, top food groups, time of consumption and its association with sociodemographic, lifestyle and adiposity measures. Public Health Nutr. 2019, 22, 1576–1589. [Google Scholar] [CrossRef] [PubMed]
- Cuco, G.; Fernandez-Ballart, J.; Sala, J.; Viladrich, C.; Iranzo, R.; Vila, J.; Arija, V. Dietary patterns and associated lifestyles in preconception, pregnancy and postpartum. Eur. J. Clin. Nutr. 2006, 60, 364–371. [Google Scholar] [CrossRef] [PubMed]
- Wen, L.M.; Flood, V.M.; Simpson, J.M.; Rissel, C.; Baur, L.A. Dietary behaviours during pregnancy: Findings from first-time mothers in southwest Sydney, Australia. Int. J. Behav. Nutr. Phys. Act. 2010, 7, 13. [Google Scholar] [CrossRef] [PubMed]
- van der Pligt, P.; Olander, E.K.; Ball, K.; Crawford, D.; Hesketh, K.D.; Teychenne, M.; Campbell, K. Maternal dietary intake and physical activity habits during the postpartum period: Associations with clinician advice in a sample of Australian first time mothers. BMC Pregnancy Childbirth 2016, 16, 27. [Google Scholar] [CrossRef]
- Carmen, A.-P.; Pablo, L.-C.; Rocío, O.-R.; Juan, M.-M.; Aurora, B.-C.; José, J.J.-M. Compliance with leisure-time physical activity recommendations in pregnant women. Acta Obstet. Gynecol. Scand. 2011, 90, 245–252. [Google Scholar]
- Pereira, M.A.; Rifas-Shiman, S.L.; Kleinman, K.P.; Rich-Edwards, J.W.; Peterson, K.E.; Gillman, M.W. Predictors of change in physical activity during and after pregnancy: Project Viva. Am. J. Prev. Med. 2007, 32, 312–319. [Google Scholar] [CrossRef]
- Carter-Edwards, L.; Østbye, T.; Bastian, L.A.; Yarnall, K.S.; Krause, K.M.; Simmons, T.-J. Barriers to adopting a healthy lifestyle: Insight from postpartum women. BMC Res. Notes 2009, 2, 161. [Google Scholar] [CrossRef]
- Makama, M.; Awoke, M.A.; Skouteris, H.; Moran, L.J.; Lim, S. Barriers and facilitators to a healthy lifestyle in postpartum women: A systematic review of qualitative and quantitative studies in postpartum women and healthcare providers. Obes. Rev. 2021, 22, e13167. [Google Scholar] [CrossRef]
- Olmedo-Requena, R.; Gomez-Fernandez, J.; Mozas-Moreno, J.; Lewis-Mikhael, A.-M.; Bueno-Cavanillas, A.; Jimenez-Moleon, J.-J. Factors associated with adherence to nutritional recommendations before and during pregnancy. Women Health 2018, 58, 1094–1111. [Google Scholar] [CrossRef]
- NHMRC. Australian Dietary Guidelines, Canberra: National Health and Medical Research Council. Available online: https://www.nhmrc.gov.au/adg (accessed on 16 July 2021).
- Australian Bureau of Statistic. Australian Health Survey: Nutrition First Results-Foods and Nutrients. Users’ Guide, 2011–2013 (cat. no. 4363.0.55.001). Canberra, ACT (2013). Available online: https://www.abs.gov.au/statistics/health/health-conditions-and-risks/australian-health-survey-nutrition-first-results-foods-and-nutrients/latest-release (accessed on 16 July 2021).
- Johnston, J.M.; Colvin, A.; Johnson, B.D.; Santoro, N.; Harlow, S.D.; Merz, C.N.B.; Sutton-Tyrrell, K. Comparison of SWAN and WISE menopausal status classification algorithms. J. Women’s Health 2006, 15, 1184–1194. [Google Scholar] [CrossRef]
- Bliss, R.M. Researchers produce innovation in dietary recall. Agric. Res. 2004, 52, 10–13. [Google Scholar]
- Blumfield, M.; McConnell, A.; Cassettari, T.; Petocz, P.; Warner, M.; Campos, V.; Lê, K.-A.; Minehira, K.; Marshall, S.; Fayet-Moore, F. Balanced carbohydrate ratios are associated with improved diet quality in Australia: A nationally representative cross-sectional study. PLoS ONE 2021, 16, e0253582. [Google Scholar] [CrossRef] [PubMed]
- Seifu, C.N.; Fahey, P.P.; Atlantis, E. Unhealthy Diet Pattern Mediates the Disproportionate Prevalence of Obesity among Adults with Socio-Economic Disadvantage: An Australian Representative Cross-Sectional Study. Nutrients 2021, 13, 1363. [Google Scholar] [CrossRef] [PubMed]
- Brown, W.J.; Burton, N.W.; Marshall, A.L.; Miller, Y.D. Reliability and validity of a modified self-administered version of the Active Australia physical activity survey in a sample of mid-age women. Aust. N. Z. J. Public Health 2008, 32, 535–541. [Google Scholar] [CrossRef]
- Australian Government Department of Health. Australia’s Physical Activity and Sedentary Behaviour Guidelines. Available online: http://www.health.gov.au/internet/main/publishing.nsf/Content/health-pubhlth-strateg-phys-act-guidelines (accessed on 23 July 2021).
- Birrell, C.L.; Steel, D.G.; Batterham, M.J.; Arya, A. How to use replicate weights in health survey analysis using the National Nutrition and Physical Activity Survey as an example. Public Health Nutr. 2019, 22, 3315–3326. [Google Scholar] [CrossRef]
- Livingstone, M.B.E.; Black, A.E. Markers of the validity of reported energy intake. J. Nutr. 2003, 133, 895S–920S. [Google Scholar] [CrossRef]
- Johnson, B.J.; Bell, L.K.; Zarnowiecki, D.; Rangan, A.M.; Golley, R.K. Contribution of discretionary foods and drinks to Australian children’s intake of energy, saturated fat, added sugars and salt. Children 2017, 4, 104. [Google Scholar] [CrossRef]
- Dutch, D.C.; Golley, R.K.; Johnson, B.J. Diet Quality of Australian Children and Adolescents on Weekdays versus Weekend Days: A Secondary Analysis of the National Nutrition and Physical Activity Survey 2011–2012. Nutrients 2021, 13, 4128. [Google Scholar] [CrossRef]
- Australian Government and New Zealand Ministry of Health. Nutrient Reference Values for Australia and New Zealand; Commonwealth of Australia: Canberra, Australia, 2005; Available online: https://www.nrv.gov.au/nutrients (accessed on 11 October 2021).
- National Health Medical Research Council. Australian Alcohol Guidelines: Health Risks and Benefits; National Health and Medical Research Council: Canberra, Australia, 2001. [Google Scholar]
- Caut, C.; Leach, M.; Steel, A. Dietary guideline adherence during preconception and pregnancy: A systematic review. Matern. Child Nutr. 2020, 16, e12916. [Google Scholar] [CrossRef]
- George, G.C.; Milani, T.J.; Hanss-Nuss, H.; Freeland-Graves, J.H. Compliance with dietary guidelines and relationship to psychosocial factors in low-income women in late postpartum. J. Am. Diet. Assoc. 2005, 105, 916–926. [Google Scholar] [CrossRef]
- Kay, M.C.; Wasser, H.; Adair, L.S.; Thompson, A.L.; Siega-Riz, A.M.; Suchindran, C.M.; Bentley, M.E. Consumption of key food groups during the postpartum period in low-income, non-Hispanic black mothers. Appetite 2017, 117, 161–167. [Google Scholar] [CrossRef] [PubMed]
- Williams, L.K.; Thornton, L.; Crawford, D.; Ball, K. Perceived quality and availability of fruit and vegetables are associated with perceptions of fruit and vegetable affordability among socio-economically disadvantaged women. Public Health Nutr. 2012, 15, 1262–1267. [Google Scholar] [CrossRef] [PubMed]
- Malek, L.; Umberger, W.; Zhou, S.J.; Makrides, M. Understanding drivers of dietary behavior before and during pregnancy in industrialized countries. In Health and Nutrition in Adolescents and Young Women: Preparing for the Next Generation; Karger: Basel, Switzerland, 2015; Volume 80, pp. 117–140. [Google Scholar]
- Santos, P.C.; Abreu, S.; Moreira, C.; Lopes, D.; Santos, R.; Alves, O.; Silva, P.; Montenegro, N.; Mota, J. Impact of compliance with different guidelines on physical activity during pregnancy and perceived barriers to leisure physical activity. J. Sports Sci. 2014, 32, 1398–1408. [Google Scholar] [CrossRef]
- Borodulin, K.; Evenson, K.R.; Herring, A.H. Physical activity patterns during pregnancy through postpartum. BMC Women’s Health 2009, 9, 32. [Google Scholar] [CrossRef] [PubMed]
- Durham, H.A.; Morey, M.C.; Lovelady, C.A.; Brouwer, R.J.N.; Krause, K.M.; Østbye, T. Postpartum physical activity in overweight and obese women. J. Phys. Act. Health 2011, 8, 988–993. [Google Scholar] [CrossRef] [PubMed]
- Coll, C.V.; Domingues, M.R.; Gonçalves, H.; Bertoldi, A.D. Perceived barriers to leisure-time physical activity during pregnancy: A literature review of quantitative and qualitative evidence. J. Sci. Med. Sport 2017, 20, 17–25. [Google Scholar] [CrossRef] [PubMed]
- Harrison, A.L.; Taylor, N.F.; Shields, N.; Frawley, H.C. Attitudes, barriers and enablers to physical activity in pregnant women: A systematic review. J. Physiother. 2018, 64, 24–32. [Google Scholar] [CrossRef]
- Ball, K.; Lamb, K.E.; Costa, C.; Cutumisu, N.; Ellaway, A.; Kamphuis, C.B.; Mentz, G.; Pearce, J.; Santana, P.; Santos, R. Neighbourhood socioeconomic disadvantage and fruit and vegetable consumption: A seven countries comparison. Int. J. Behav. Nutr. Phys. Act. 2015, 12, 68. [Google Scholar] [CrossRef]
- Giskes, K.; Avendaňo, M.; Brug, J.; Kunst, A. A systematic review of studies on socioeconomic inequalities in dietary intakes associated with weight gain and overweight/obesity conducted among European adults. Obes. Rev. 2010, 11, 413–429. [Google Scholar] [CrossRef]
- O’Donoghue, G.; Kennedy, A.; Puggina, A.; Aleksovska, K.; Buck, C.; Burns, C.; Cardon, G.; Carlin, A.; Ciarapica, D.; Colotto, M. Socio-economic determinants of physical activity across the life course: A “Determinants of DIet and Physical ACtivity” (DEDIPAC) umbrella literature review. PLoS ONE 2018, 13, e0190737. [Google Scholar] [CrossRef]
- Liu, H.; Hall, J.J.; Xu, X.; Mishra, G.D.; Byles, J.E. Differences in food and nutrient intakes between Australian-and Asian-born women living in Australia: Results from the Australian Longitudinal Study on Women’s Health. Nutr. Diet. 2018, 75, 142–150. [Google Scholar] [CrossRef] [PubMed]
- Harland, J.I.; Garton, L.E. Whole-grain intake as a marker of healthy body weight and adiposity. Public Health Nutr. 2008, 11, 554–563. [Google Scholar] [CrossRef] [PubMed]
- Alderete, T.L.; Wild, L.E.; Mierau, S.M.; Bailey, M.J.; Patterson, W.B.; Berger, P.K.; Jones, R.B.; Plows, J.F.; Goran, M.I. Added sugar and sugar-sweetened beverages are associated with increased postpartum weight gain and soluble fiber intake is associated with postpartum weight loss in Hispanic women from Southern California. Am. J. Clin. Nutr. 2020, 112, 519–526. [Google Scholar] [CrossRef] [PubMed]
- Drehmer, M.; Camey, S.A.; Nunes, M.A.; Duncan, B.B.; Lacerda, M.; Pinheiro, A.P.; Schmidt, M.I. Fibre intake and evolution of BMI: From pre-pregnancy to postpartum. Public Health Nutr. 2013, 16, 1403–1413. [Google Scholar] [CrossRef]
- Sanders, L.M.; Zhu, Y.; Wilcox, M.L.; Koecher, K.; Maki, K.C. Effects of Whole Grain Intake, Compared with Refined Grain, on Appetite and Energy Intake: A Systematic Review and Meta-Analysis. Adv. Nutr. 2021, 12, 1177–1195. [Google Scholar] [CrossRef]
- Howarth, N.C.; Saltzman, E.; Roberts, S.B. Dietary fiber and weight regulation. Nutr. Rev. 2001, 59, 129–139. [Google Scholar] [CrossRef]
- U.S. Department of Health and Human Services; U.S. Department of Agriculture. 2015–2020 Dietary Guidelines for Americans, 8th ed.; USDA; HHS: Washington, DC, USA, 2015. [Google Scholar]
- Wang, L.; Lee, I.-M.; Manson, J.E.; Buring, J.E.; Sesso, H.D. Alcohol consumption, weight gain, and risk of becoming overweight in middle-aged and older women. Arch. Intern. Med. 2010, 170, 453–461. [Google Scholar] [CrossRef]
- Wannamethee, S.G.; Field, A.E.; Colditz, G.A.; Rimm, E.B. Alcohol intake and 8-year weight gain in women: A prospective study. Obes. Res. 2004, 12, 1386–1396. [Google Scholar] [CrossRef]
- O’Donovan, G.; Stamatakis, E.; Hamer, M. Associations between alcohol and obesity in more than 100,000 adults in England and Scotland. Br. J. Nutr. 2018, 119, 222–227. [Google Scholar] [CrossRef]
- Poudel, P.; Ismailova, K.; Andersen, L.B.; Larsen, S.C.; Heitmann, B.L. Adolescent wine consumption is inversely associated with long-term weight gain: Results from follow-up of 20 or 22 years. Nutr. J. 2019, 18, 56. [Google Scholar] [CrossRef]
- Ruf, T.; Nagel, G.; Altenburg, H.-P.; Miller, A.; Thorand, B. Food and nutrient intake, anthropometric measurements and smoking according to alcohol consumption in the EPIC Heidelberg study. Ann. Nutr. Metab. 2005, 49, 16–25. [Google Scholar] [CrossRef] [PubMed]
- Bearak, J.; Popinchalk, A.; Alkema, L.; Sedgh, G. Global, regional, and subregional trends in unintended pregnancy and its outcomes from 1990 to 2014: Estimates from a Bayesian hierarchical model. Lancet Glob. Health 2018, 6, e380–e389. [Google Scholar] [CrossRef]
- Aljadani, H.M.; Patterson, A.; Sibbritt, D.; Taylor, R.M.; Collins, C.E. Frequency and variety of usual intakes of healthy foods, fruit, and vegetables predicts lower 6-year weight gain in young women. Eur. J. Clin. Nutr. 2020, 74, 945–952. [Google Scholar] [CrossRef] [PubMed]
- Mytton, O.T.; Nnoaham, K.; Eyles, H.; Scarborough, P.; Mhurchu, C.N. Systematic review and meta-analysis of the effect of increased vegetable and fruit consumption on body weight and energy intake. BMC Public Health 2014, 14, 886. [Google Scholar] [CrossRef]
- Malik, V.S.; Pan, A.; Willett, W.C.; Hu, F.B. Sugar-sweetened beverages and weight gain in children and adults: A systematic review and meta-analysis. Am. J. Clin. Nutr. 2013, 98, 1084–1102. [Google Scholar] [CrossRef] [PubMed]
- Sui, Z.; Wong, W.K.; Louie, J.C.Y.; Rangan, A. Discretionary food and beverage consumption and its association with demographic characteristics, weight status, and fruit and vegetable intakes in Australian adults. Public Health Nutr. 2017, 20, 274–281. [Google Scholar] [CrossRef] [PubMed]
- Boghossian, N.S.; Yeung, E.H.; Lipsky, L.M.; Poon, A.K.; Albert, P.S. Dietary patterns in association with postpartum weight retention. Am. J. Clin. Nutr. 2013, 97, 1338–1345. [Google Scholar] [CrossRef][Green Version]
- Tam, K.W.; Veerman, J.L. Prevalence and characteristics of energy intake under-reporting among Australian adults in 1995 and 2011 to 2012. Nutr. Diet. 2019, 76, 546–559. [Google Scholar] [CrossRef]
- Grech, A.; Rangan, A.; Allman-Farinelli, M. Macronutrient composition of the Australian Population’s diet; trends from three National Nutrition Surveys 1983, 1995 and 2012. Nutrients 2018, 10, 1045. [Google Scholar] [CrossRef]
- Ha, A.V.V.; Zhao, Y.; Binns, C.W.; Pham, N.M.; Nguyen, P.T.H.; Nguyen, C.L.; Chu, T.K.; Lee, A.H. Postpartum physical activity and weight retention within one year: A prospective cohort study in Vietnam. Int. J. Environ. Res. Public Health 2020, 17, 1105. [Google Scholar] [CrossRef]
- Fadzil, F.; Shamsuddin, K.; Puteh, S.E.W.; Tamil, A.M.; Ahmad, S.; Hayi, N.S.A.; Samad, A.A.; Ismail, R.; Shauki, N.I.A. Predictors of postpartum weight retention among urban Malaysian mothers: A prospective cohort study. Obes. Res. Clin. Pract. 2018, 12, 493–499. [Google Scholar] [CrossRef]
- Oken, E.; Taveras, E.M.; Popoola, F.A.; Rich-Edwards, J.W.; Gillman, M.W. Television, walking, and diet: Associations with postpartum weight retention. Am. J. Prev. Med. 2007, 32, 305–311. [Google Scholar] [CrossRef]
- Byambasukh, O.; Vinke, P.; Kromhout, D.; Navis, G.; Corpeleijn, E. Physical activity and 4-year changes in body weight in 52,498 non-obese people: The Lifelines cohort. Int. J. Behav. Nutr. Phys. Act. 2021, 18, 75. [Google Scholar] [CrossRef]
- Pavey, T.G.; Peeters, G.G.; Gomersall, S.R.; Brown, W.J. Long-term effects of physical activity level on changes in healthy body mass index over 12 years in young adult women. Mayo Clin. Proc. 2016, 91, 735–744. [Google Scholar] [CrossRef]
- Larson-Meyer, D.E. Effect of postpartum exercise on mothers and their offspring: A review of the literature. Obes. Res. 2002, 10, 841–853. [Google Scholar] [CrossRef]
- Lafay, L.; Mennen, L.; Basdevant, A.; Charles, M.; Borys, J.; Eschwege, E.; Romon, M. Does energy intake underreporting involve all kinds of food or only specific food items? Results from the Fleurbaix Laventie Ville Sante (FLVS) study. Int. J. Obes. 2000, 24, 1500–1506. [Google Scholar] [CrossRef]
Publisher’s Note: MDPI stays neutral with regard to jurisdictional claims in published maps and institutional affiliations. |
© 2022 by the authors. Licensee MDPI, Basel, Switzerland. This article is an open access article distributed under the terms and conditions of the Creative Commons Attribution (CC BY) license (https://creativecommons.org/licenses/by/4.0/).