
Early Feeding Factors and Eating Behaviors among Children Aged 1–3: A Cross-Sectional Study


Abstract
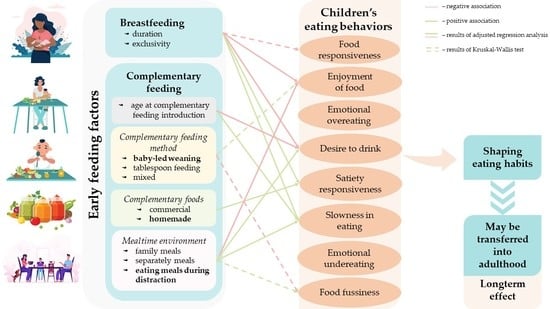
:
1. Introduction
2. Materials and Methods
2.1. Study Design and Participants
- Internet access;
- Living in Poland;
- Willingness to participation in the study.
- Child’s age less than 12 or more than 36 months;
- Living abroad;
- Lack or incomplete data about breastfeeding, complementary feeding, and maternal anthropometry;
- Gestational age less than 23 or more than 44 weeks.
2.2. Questionnaire
2.2.1. Early Feeding Practices
2.2.2. Feeding Practices and Toddlers’ Dietary Habits in the Last 3 months
Children’s Eating Behavior Questionnaire
2.2.3. Children and Maternal Anthropometry
2.2.4. Birth-Related Data
2.2.5. Toddlers’ Health and Development
2.2.6. Demographic Data
2.3. Statistical Analysis
3. Results
3.1. Sociodemographic Factors and Eating Behaviors
3.2. Birth-Related Factors, Maternal BMI and Eating Behaviors
3.3. Early Feeding Factors and Eating Behaviors
3.4. Early Feeding Factors Associating with the CEBQ Results
3.4.1. Early Feeding Pattern
3.4.2. Complementary Feeding Method
3.4.3. Types of Complementary Food Pattern
3.4.4. Mealtime Environment Pattern
4. Discussion
4.1. Early Feeding Pattern—Breastfeeding and Age at Complementary Feeding Introduction
4.2. Method of Complementary Feeding Introduction
4.3. Types of Complementary Foods
4.4. Mealtime Environment
4.5. Possible Mechanisms
4.6. Strengths and Limitations
5. Conclusions
Supplementary Materials
Author Contributions
Funding
Institutional Review Board Statement
Informed Consent Statement
Data Availability Statement
Acknowledgments
Conflicts of Interest
References
- Ventura, A.K. Does breastfeeding shape food preferences? Links to obesity. Ann. Nutr. Metab. 2017, 70, 8–15. [Google Scholar] [CrossRef]
- Alles, M.S.; Eussen, S.R.B.M.; van der Beek, E.M. Nutritional challenges and opportunities during the weaning period and in young childhood. Ann. Nutr. Metab. 2014, 64, 284–293. [Google Scholar] [CrossRef]
- Jayedi, A.; Soltani, S.; Abdolshahi, A.; Shab-Bidar, S. Healthy and unhealthy dietary patterns and the risk of chronic disease: An umbrella review of meta-Analyses of prospective cohort studies. Br. J. Nutr. 2020, 124, 1133–1144. [Google Scholar] [CrossRef]
- American Academy of Pediatrics. Breastfeeding and the use of human milk. Pediatrics 2012, 129, e827–e841. [Google Scholar] [CrossRef] [Green Version]
- Agostoni, C.; Braegger, C.; Decsi, T.; Kolacek, S.; Koletzko, B.; Michaelsen, K.F.; Mihatsch, W.; Moreno, L.A.; Puntis, J.; Shamir, R.; et al. Breast-Feeding: A commentary by the ESPGHAN Committee on Nutrition. J. Pediatr. Gastroenterol. Nutr. 2009, 49, 112–125. [Google Scholar] [CrossRef] [Green Version]
- Victora, C.G.; Bahl, R.; Barros, A.J.D.; França, G.V.A.; Horton, S.; Krasevec, J.; Murch, S.; Sankar, M.J.; Walker, N.; Rollins, N.C. Breastfeeding in the 21st century: Epidemiology, mechanisms, and lifelong effect. Lancet 2016, 387, 475–490. [Google Scholar] [CrossRef] [Green Version]
- Scaglioni, S.; De Cosmi, V.; Ciappolino, V.; Parazzini, F.; Brambilla, P.; Agostoni, C. Factors influencing children’s eating behaviours. Nutrients 2018, 10, 706. [Google Scholar] [CrossRef] [Green Version]
- Yelverton, C.A.; Geraghty, A.A.; O’Brien, E.C.; Killeen, S.L.; Horan, M.K.; Donnelly, J.M.; Larkin, E.; Mehegan, J.; McAuliffe, F.M. Breastfeeding and maternal eating behaviours are associated with child eating behaviours: Findings from the ROLO Kids Study. Eur. J. Clin. Nutr. 2020, 75, 670–679. [Google Scholar] [CrossRef]
- Nicklaus, S. The role of dietary experience in the development of eating behavior during the first years of life. Ann. Nutr. Metab. 2017, 70, 241–245. [Google Scholar] [CrossRef] [Green Version]
- Fewtrell, M.; Bronsky, J.; Campoy, C.; Domellöf, M.; Embleton, N.; Mis, N.F.; Hojsak, I.; Hulst, J.M.; Indrio, F.; Lapillonne, A.; et al. Complementary feeding: A position paper by the European Society for Paediatric Gastroenterology, Hepatology, and Nutrition (ESPGHAN) Committee on Nutrition. J. Pediatr. Gastroenterol. Nutr. 2017, 64, 119–132. [Google Scholar] [CrossRef]
- Szajewska, H.; Socha, P.; Horvath, A.; Rybak, A.; Zalewski, B.M.; Nehring-Guglska, M.; Mojska, H.; Czerwionka-Szaflarska, M.; Gajewska, D.; Helwich, E.; et al. Nutrition of healthy term infants. Recommendations of the Polish Society for Paediatrics Gastroenterology, Hepatology and Nutrition. Stand. Med. 2021, 18, 805–822. [Google Scholar] [CrossRef]
- Schwartz, C.; Scholtens, P.A.M.J.; Lalanne, A.; Weenen, H.; Nicklaus, S. Development of healthy eating habits early in life. Review of recent evidence and selected guidelines. Appetite 2011, 57, 796–807. [Google Scholar] [CrossRef]
- Pérez-Escamilla, R.; Segura-Pérez, S.; Lott, M. Feeding guidelines for infants and young toddlers: A responsive parenting approach. Nutr. Today 2017, 52, 223–231. [Google Scholar] [CrossRef]
- Boswell, N. Complementary feeding methods—A review of the benefits and risks. Int. J. Environ. Res. Public Health 2021, 18, 7165. [Google Scholar] [CrossRef]
- World Health Organization. Commercial foods for infants and young children in the WHO European region. In A Study of the Availability, Composition and Marketing of Baby Foods in Four European Countries; World Health Organization: Geneva, Switzerland, 2019. [Google Scholar]
- World Health Organization. Commercial foods for infants and young children in Poland. In A Study of the Availability, Composition and Marketing of Baby Foods in Warsaw, Poland; WHO Regional Office for Europe: Copenhagen, Denmark, 2021. [Google Scholar]
- Harrison, M.E.; Norris, M.L.; Obeid, N.; Fu, M.; Weinstangel, H.; Sampson, M. Systematic review of the effects of family meal frequency on psychosocial outcomes in youth. Can. Fam. Physician 2015, 61, e96–e106. [Google Scholar]
- Finnane, J.M.; Jansen, E.; Mallan, K.M.; Daniels, L.A. Mealtime structure and responsive feeding practices are associated with less food fussiness and more food enjoyment in children. J. Nutr. Educ. Behav. 2017, 49, 11–18. [Google Scholar] [CrossRef] [Green Version]
- Trofholz, A.C.; Tate, A.D.; Miner, M.H.; Berge, J.M. Associations between TV viewing at family meals and the emotional atmosphere of the meal, meal healthfulness, child dietary intake, and child weight status. Appetite 2017, 108, 361–366. [Google Scholar] [CrossRef] [Green Version]
- Brown, A.; Lee, M. Breastfeeding during the first year promotes satiety responsiveness in children aged 18-24 months. Pediatr. Obes. 2012, 7, 382–390. [Google Scholar] [CrossRef]
- Brown, A.; Lee, M.D. Early influences on child satiety-responsiveness: The role of weaning style. Pediatr. Obes. 2013, 10, 57–66. [Google Scholar] [CrossRef] [Green Version]
- Reyes, M.; Hoyos, V.; Martinez, S.M.; Lozoff, B.; Castillo, M.; Burrows, R.; Blanco, E.; Gahagan, S. Satiety responsiveness and eating behavior among Chilean adolescents and the role of breastfeeding. Int. J. Obes. 2014, 38, 552–557. [Google Scholar] [CrossRef] [Green Version]
- Rogers, S.L.; Blissett, J. Breastfeeding duration and its relation to weight gain, eating behaviours and positive maternal feeding practices in infancy. Appetite 2017, 108, 399–406. [Google Scholar] [CrossRef] [Green Version]
- Pang, W.W.; McCrickerd, K.; Quah, P.L.; Fogel, A.; Aris, I.M.; Yuan, W.L.; Fok, D.; Chua, M.C.; Lim, S.B.; Shek, L.P.; et al. Is breastfeeding associated with later child eating behaviours? Appetite 2020, 150, 104653. [Google Scholar] [CrossRef]
- Rahill, S.; Kennedy, A.; Walton, J.; McNulty, B.A.; Kearney, J. The factors associated with food fussiness in Irish school-aged children. Public Health Nutr. 2018, 22, 164–174. [Google Scholar] [CrossRef]
- de Barse, L.M.; Jansen, P.W.; Edelson-Fries, L.R.; Jaddoe, V.W.V.; Franco, O.H.; Tiemeier, H.; Steenweg-de Graaff, J. Infant feeding and child fussy eating: The Generation R Study. Appetite 2017, 114, 374–381. [Google Scholar] [CrossRef]
- Möller, L.M.; de Hoog, M.L.A.; van Eijsden, M.; Gemke, R.J.B.J.; Vrijkotte, T.G.M. Infant nutrition in relation to eating behaviour and fruit and vegetable intake at age 5 years. Br. J. Nutr. 2013, 109, 564–571. [Google Scholar] [CrossRef] [Green Version]
- Higgins, R.C.; Keller, K.L.; Aruma, J.C.; Masterson, T.D.; Adise, S.; Fearnbach, N.; Stein, W.M.; English, L.K.; Fuchs, B.; Pearce, A.L. Influence of exclusive breastfeeding on hippocampal structure, satiety responsiveness, and weight status. Matern. Child Nutr. 2022, e13333. [Google Scholar] [CrossRef]
- Fu, X.X.; Conlon, C.A.; Haszard, J.J.; Beck, K.L.; von Hurst, P.R.; Taylor, R.W.; Heath, A.L.M. Food fussiness and early feeding characteristics of infants following baby-led weaning and traditional spoon-feeding in New Zealand: An internet survey. Appetite 2018, 130, 110–116. [Google Scholar] [CrossRef]
- Taylor, R.W.; Williams, S.M.; Fangupo, L.J.; Wheeler, B.J.; Taylor, B.J.; Daniels, L.; Fleming, E.A.; McArthur, J.; Morison, B.; Erickson, L.W.; et al. Effect of a baby-led approach to complementary feeding on infant growth and overweight: A randomized clinical trial. JAMA Pediatr. 2017, 171, 838–846. [Google Scholar] [CrossRef]
- Gregory, J.E.; Paxton, S.J.; Brozovic, A.M. Pressure to eat and restriction are associated with child eating behaviours and maternal concern about child weight, but not child body mass index, in 2- to 4-year-old children. Appetite 2010, 54, 550–556. [Google Scholar] [CrossRef]
- Moroshko, I.; Brennan, L. Maternal controlling feeding behaviours and child eating in preschool-aged children. Nutr. Diet. 2013, 70, 49–53. [Google Scholar] [CrossRef]
- World Health Organization. Breastfeeding. Available online: https://apps.who.int/nutrition/topics/exclusive_breastfeeding/en/index.html (accessed on 9 May 2022).
- Wardle, J.; Guthrie, C.A.; Sanderson, S.; Rapoport, L. Development of the Children’s Eating Behaviour Questionnaire. J. Child Psychol. Psychiatry Allied Discip. 2001, 42, 963–970. [Google Scholar] [CrossRef] [Green Version]
- Cao, Y.-T.; Svensson, V.; Marcus, C.; Zhang, J.; Zhang, J.-D.; Sobko, T. Eating behaviour patterns in Chinese children aged 12-18 months and association with relative weight—Factorial validation of the Children’s Eating Behaviour Questionnaire. Int. J. Behav. Nutr. Phys. Act. 2012, 9, 5. [Google Scholar] [CrossRef] [Green Version]
- Czepczor-Bernat, K.; Brytek-Matera, A. Children’s and mothers’ perspectives of problematic eating behaviours in young children and adolescents: An exploratory study. Int. J. Environ. Res. Public Health 2019, 16, 2692. [Google Scholar] [CrossRef] [Green Version]
- Nasirzadeh, R. Validity and reliability of Children’s Eating Behavior Questionnaire. Sadra Med. Sci. J. 2017, 5, 77–86. [Google Scholar]
- Sleddens, E.F.C.; Kremers, S.P.J.; Thijs, C. The Children’s Eating Behaviour Questionnaire: Factorial validity and association with body mass index in Dutch children aged 6–7. Int. J. Behav. Nutr. Phys. Act. 2008, 5, 49. [Google Scholar] [CrossRef] [Green Version]
- Al-Hamad, A.H.; Al-Naseeb, A.M.; Al-Assaf, M.S.; Al-Obaid, S.A.; Al-Abdulkarim, B.S.; Olszewski, P.K. Preliminary exploration of obesity-related eating behaviour patterns in a sample of Saudi preschoolers aged 2–6 years through the Children’s Eating Behaviour Questionnaire. Nutrients 2021, 13, 4156. [Google Scholar] [CrossRef]
- Domoff, S.E.; Miller, A.L.; Kaciroti, N.; Lumeng, J.C. Validation of the Children’s Eating Behaviour Questionnaire in a low-income preschool-aged sample in the United States. Appetite 2015, 1, 415–420. [Google Scholar] [CrossRef] [Green Version]
- Mallan, K.M.; Liu, W.H.; Mehta, R.J.; Daniels, L.A.; Magarey, A.; Battistutta, D. Maternal report of young children’s eating styles. Validation of the Children’s Eating Behaviour Questionnaire in three ethnically diverse Australian samples. Appetite 2013, 64, 48–55. [Google Scholar] [CrossRef] [Green Version]
- Ashcroft, J.; Semmler, C.; Carnell, S.; van Jaarsveld, C.H.M.; Wardle, J. Continuity and stability of eating behaviour traits in children. Eur. J. Clin. Nutr. 2008, 62, 985–990. [Google Scholar] [CrossRef] [Green Version]
- Njardvik, U.; Klar, E.K.; Thorsdottir, F. The factor structure of the Children’s Eating Behaviour Questionnaire: A comparison of four models using confirmatory factor analysis. Heal. Sci. Reports 2018, 1, e28. [Google Scholar] [CrossRef]
- Manzano, M.A.; Strong, D.R.; Kang Sim, D.E.; Rhee, K.E.; Boutelle, K.N. Psychometric properties of the Child Eating Behavior Questionnaire (CEBQ) in school age children with overweight and obesity: A proposed three-factor structure. Pediatr. Obes. 2021, 16, e12795. [Google Scholar] [CrossRef]
- Sparks, M.A.; Radnitz, C.L. Confirmatory factor analysis of the Children’s Eating Behaviour Questionnaire in a low-income sample. Eat. Behav. 2012, 13, 267–270. [Google Scholar] [CrossRef]
- Farrow, C.; Blissett, J. Stability and continuity of parentally reported child eating behaviours and feeding practices from 2 to 5 years of age. Appetite 2012, 58, 151–156. [Google Scholar] [CrossRef] [Green Version]
- Gregory, J.E.; Paxton, S.J.; Brozovic, A.M. Maternal feeding practices, child eating behaviour and body mass index in preschool-aged children: A prospective analysis. Int. J. Behav. Nutr. Phys. Act. 2010, 7, 55. [Google Scholar] [CrossRef] [Green Version]
- World Health Organization. The Anthro Survey Analyser. Available online: https://worldhealthorg.shinyapps.io/anthro/ (accessed on 9 May 2022).
- World Health Organization. Training Course on Child Growth Assessment; World Health Organization: Geneva, Switzerland, 2008. [Google Scholar]
- World Health Organization/Europe. Nutrition—Body Mass Index—BMI. Available online: https://www.euro.who.int/en/health-topics/disease-prevention/nutrition/a-healthy-lifestyle/body-mass-index-bmi (accessed on 9 May 2022).
- INTERGROWTH-21st Neonatal Size Calculator. Available online: http://intergrowth21.ndog.ox.ac.uk/ (accessed on 9 May 2022).
- Eurostat. GDP at Current Market Prices. Available online: https://ec.europa.eu/eurostat/databrowser/view/NAMA_10R_2GDP__custom_2187938/default/table?lang=en (accessed on 9 May 2022).
- Boswell, N.; Byrne, R.; Davies, P.S.W. Eating behavior traits associated with demographic variables and implications for obesity outcomes in early childhood. Appetite 2018, 120, 482–490. [Google Scholar] [CrossRef] [Green Version]
- Mallan, K.M.; Daniels, L.A.; de Jersey, S.J. Confirmatory factor analysis of the Baby Eating Behaviour Questionnaire and associations with infant weight, gender and feeding mode in an Australian sample. Appetite 2014, 82, 43–49. [Google Scholar] [CrossRef] [Green Version]
- Vandyousefi, S.; Messito, M.J.; Katzow, M.W.; Scott, M.A.; Gross, R.S. Infant appetite traits, feeding practices and child obesity in low-income Hispanic families. Pediatr. Obes. 2022, e12913. [Google Scholar] [CrossRef]
- Albuquerque, G.; Severo, M.; Oliveira, A. Early life characteristics associated with appetite-related eating behaviors in 7-year-old children. J. Pediatr. 2017, 180, 38–46. [Google Scholar] [CrossRef] [Green Version]
- Komninou, S.; Halford, J.C.G.; Harrold, J.A. Differences in parental feeding styles and practices and toddler eating behaviour across complementary feeding methods: Managing expectations through consideration of effect size. Appetite 2019, 137, 198–206. [Google Scholar] [CrossRef] [Green Version]
- Harris, H.A.; Staton, S.; Morawska, A.; Gallegos, D.; Oakes, C.; Thorpe, K. A comparison of maternal feeding responses to child fussy eating in low-income food secure and food insecure households. Appetite 2019, 137, 259–266. [Google Scholar] [CrossRef]
- Jansen, P.W.; Roza, S.J.; Jaddoe, V.W.V.; Mackenbach, J.D.; Raat, H.; Hofman, A.; Verhulst, F.C.; Tiemeier, H. Children’s eating behavior, feeding practices of parents and weight problems in early childhood: Results from the population-based Generation R Study. Int. J. Behav. Nutr. Phys. Act. 2012, 9, 130. [Google Scholar] [CrossRef] [Green Version]
- Farrow, C.V.; Galloway, A.T.; Fraser, K. Sibling eating behaviours and differential child feeding practices reported by parents. Appetite 2009, 52, 307–312. [Google Scholar] [CrossRef] [Green Version]
- Webber, L.; Cooke, L.; Hill, C.; Wardle, J. Associations between children’s appetitive traits and maternal feeding practices. J. Am. Diet. Assoc. 2010, 110, 1718–1722. [Google Scholar] [CrossRef]
- Vandyousefi, S.; Gross, R.S.; Katzow, M.W.; Scott, M.A.; Messito, M.J. Infant and early child appetite traits and child weight and obesity risk in low-income Hispanic families. J. Acad. Nutr. Diet. 2021, 121, 2210–2220. [Google Scholar] [CrossRef]
- Ballard, O.; Morrow, A.L. Human milk composition. Nutrients and bioactive factors. Pediatr. Clin. North Am. 2013, 60, 49–74. [Google Scholar] [CrossRef] [Green Version]
- Mennella, J.A. Ontogeny of taste preferences: Basic biology and implications for health. Am. J. Clin. Nutr. 2014, 99, 704–711. [Google Scholar] [CrossRef] [Green Version]
- Taveras, E.M.; Scanlon, K.S.; Birch, L.; Rifas-Shiman, S.L.; Rich-Edwards, J.W.; Gillman, M.W. Association of breastfeeding with maternal control of infant feeding at age 1 year. Pediatrics 2004, 114, e577–e583. [Google Scholar] [CrossRef] [Green Version]
- DiSantis, K.I.; Hodges, E.A.; Fisher, J.O. The association of breastfeeding duration with later maternal feeding styles in infancy and toddlerhood: A cross-sectional analysis. Int. J. Behav. Nutr. Phys. Act. 2013, 10, 136. [Google Scholar] [CrossRef] [Green Version]
- Zielinska, M.A.; Rust, P.; Masztalerz-Kozubek, D.; Bichler, J.; Hamułka, J. Factors influencing the age of complementary feeding —A cross-sectional study from two European countries. Int. J. Environ. Res. Public Health 2019, 16, 3799. [Google Scholar] [CrossRef] [Green Version]
- Schwartz, C.; Chabanet, C.; Lange, C.; Issanchou, S.; Nicklaus, S. The role of taste in food acceptance at the beginning of complementary feeding. Physiol. Behav. 2011, 104, 646–652. [Google Scholar] [CrossRef]
- Northstone, K.; Emmett, P.; Nethersole, F. The effect of age of introduction to lumpy solids on foods eaten and reported feeding difficulties at 6 and 15 months. J. Hum. Nutr. Diet. 2001, 14, 43–54. [Google Scholar] [CrossRef] [PubMed]
- Foterek, K.; Hilbig, A.; Alexy, U. Breast-Feeding and weaning practices in the DONALD Study: Age and time trends. J. Pediatr. Gastroenterol. Nutr. 2014, 58, 361–367. [Google Scholar] [CrossRef] [PubMed]
- Li, R.; Scanlon, K.S.; Serdula, M.K. The validity and reliability of maternal recall of breastfeeding practice. Nutr. Rev. 2005, 63, 103–110. [Google Scholar] [CrossRef]
- Amissah, E.A.; Kancherla, V.; Ko, Y.-A.; Li, R. Validation study of maternal recall on breastfeeding duration 6 years after childbirth. J. Hum. Lact. 2017, 33, 390–400. [Google Scholar] [CrossRef] [PubMed]
- Demographic Situation in Poland up to 2017; Births and Fertility; Statistics Poland: Warsaw, Poland, 2018. Available online: www.stat.gov.pl (accessed on 25 May 2022). (In Polish)
- Quah, P.L.; Chan, Y.H.; Aris, I.M.; Pang, W.W.; Toh, J.Y.; Tint, M.T.; Broekman, B.F.P.; Saw, S.M.; Kwek, K.; Godfrey, K.M.; et al. Prospective associations of appetitive traits at 3 and 12 months of age with body mass index and weight gain in the first 2 years of life. BMC Pediatr. 2015, 15, 153. [Google Scholar] [CrossRef] [PubMed] [Green Version]
- Syrad, H.; van Jaarsveld, C.H.M.; Wardle, J.; Llewellyn, C.H. The role of infant appetite in extended formula feeding. Arch. Dis. Child. 2015, 100, 758–762. [Google Scholar] [CrossRef] [PubMed]
- Ayine, P.; Selvaraju, V.; Venkatapoorna, C.M.K.; Bao, Y.; Gaillard, P.; Geetha, T. Eating behaviors in relation to child weight status and maternal education. Children 2021, 8, 32. [Google Scholar] [CrossRef]
- Sandvik, P.; Ek, A.; Somaraki, M.; Hammar, U.; Eli, K.; Nowicka, P. Picky eating in Swedish preschoolers of different weight status: Application of two new screening cut-offs. Int. J. Behav. Nutr. Phys. Act. 2018, 15, 74. [Google Scholar] [CrossRef]
- Vilela, S.; Hetherington, M.M.; Oliveira, A.; Lopes, C. Tracking diet variety in childhood and its association with eating behaviours related to appetite: The generation XXI birth cohort. Appetite 2018, 123, 241–248. [Google Scholar] [CrossRef] [Green Version]


| Variable | n | % | CEBQ Subscales | |||||||
|---|---|---|---|---|---|---|---|---|---|---|
| FR | EOE | EF | DD | SR | SE | EUE | FF | |||
| Total | 467 | 100.0 | 2.05 ± 0.73 | 1.44 ± 0.51 | 3.54 ± 0.75 | 2.74 ± 0.87 | 2.92 ± 0.64 | 2.76 ± 0.61 | 2.59 ± 0.98 | 2.61 ± 0.90 |
| Maternal age (years): | ||||||||||
| <29 | 145 | 31.0 | 2.13 ± 0.84 | 1.47 ± 0.52 | 3.62 ± 0.77 | 2.80 ± 0.93 | 2.84 ± 0.68 | 2.77 ± 0.65 | 2.64 ± 0.96 | 2.49 ± 0.89 |
| 30–34 | 222 | 47.5 | 2.05 ± 0.69 | 1.46 ± 0.51 | 3.53 ± 0.74 | 2.77 ± 0.82 | 2.95 ± 0.62 | 2.75 ± 0.58 | 2.64 ± 0.97 | 2.66 ± 0.89 |
| ≥35 | 100 | 21.4 | 1.90 ± 0.63 | 1.37 ± 0.46 | 3.44 ± 0.72 | 2.60 ± 0.86 | 2.94 ± 0.64 | 2.81 ± 0.61 | 2.41 ± 1.01 | 2.67 ± 0.91 |
| p-value | 0.147 | 0.213 | 0.112 | 0.169 | 0.478 | 0.747 | 0.077 | 0.221 | ||
| Maternal education: | ||||||||||
| high school and lower | 69 | 14.8 | 2.10 ± 0.82 | 1.45 ± 0.49 | 3.61 ± 0.69 | 2.83 ± 0.90 | 2.86 ± 0.66 | 2.85 ± 0.70 | 2.59 ± 0.94 | 2.37 ± 0.83 |
| university | 398 | 85.2 | 2.04 ± 0.72 | 1.44 ± 0.51 | 3.53 ± 0.76 | 2.73 ± 0.86 | 2.93 ± 0.64 | 2.75 ± 0.59 | 2.59 ± 0.99 | 2.65 ± 0.90 |
| p-value | 0.724 | 0.876 | 0.496 | 0.475 | 0.615 | 0.286 | 0.897 | 0.026 | ||
| Macroeconomic region residence (% GDP EU-27 average): | ||||||||||
| 51–100 | 360 | 77.1 | 2.07 ± 0.73 | 1.43 ± 0.50 | 3.53 ± 0.74 | 2.76 ± 0.88 | 2.90 ± 0.65 | 2.77 ± 0.62 | 2.55 ± 0.97 | 2.61 ± 0.88 |
| 101–130 | 107 | 22.9 | 1.97 ± 0.72 | 1.47 ± 0.53 | 3.56 ± 0.76 | 2.67 ± 0.82 | 2.98 ± 0.59 | 2.75 ± 0.56 | 2.74 ± 1.02 | 2.60 ± 0.96 |
| p-value | 0.213 | 0.465 | 0.657 | 0.331 | 0.152 | 0.781 | 0.097 | 0.786 | ||
| Child’s gender: | ||||||||||
| female | 233 | 49.9 | 2.07 ± 0.71 | 1.47 ± 0.54 | 3.51 ± 0.74 | 2.71 ± 0.87 | 2.97 ± 0.61 | 2.80 ± 0.63 | 2.64 ± 0.92 | 2.58 ± 0.88 |
| male | 234 | 50.1 | 2.03 ± 0.76 | 1.42 ± 0.47 | 3.56 ± 0.75 | 2.77 ± 0.87 | 2.86 ± 0.67 | 2.73 ± 0.59 | 2.54 ± 1.04 | 2.64 ± 0.91 |
| p-value | 0.345 | 0.693 | 0.622 | 0.353 | 0.114 | 0.294 | 0.177 | 0.482 | ||
| Child’s age (months): | ||||||||||
| 12–18 | 176 | 37.7 | 2.08 ± 0.75 | 1.44 ± 0.49 | 3.73 ± 0.69 a | 2.68 ± 0.88 | 2.82 ± 0.61 a | 2.69 ± 0.59 a | 2.55 ± 1.01 | 2.26 ± 0.81 a |
| 19–24 | 120 | 25.7 | 2.03 ± 0.81 | 1.41 ± 0.50 | 3.43 ± 0.80 b | 2.75 ± 0.91 | 3.03 ± 0.67 b | 2.86 ± 0.64 b | 2.58 ± 1.02 | 2.78 ± 0.90 b |
| 25–36 | 171 | 36.6 | 2.03 ± 0.65 | 1.47 ± 0.52 | 3.42 ± 0.73 b | 2.81 ± 0.82 | 2.94 ± 0.64 ab | 2.77 ± 0.60 ab | 2.64 ± 0.93 | 2.84 ± 0.87 b |
| p-value | 0.636 | 0.574 | ≤0.001 | 0.288 | 0.024 | 0.045 | 0.629 | ≤0.001 | ||
| Variable | n | % | CEBQ Subscales | |||||||
|---|---|---|---|---|---|---|---|---|---|---|
| FR | EOE | EF | DD | SR | SE | EUE | FF | |||
| Early feeding pattern: | ||||||||||
| longer ABF | 174 | 37.1 | 1.91 ± 0.65 a | 1.43 ± 0.46 | 3.50 ± 0.69 | 2.55 ± 0.80 a | 3.00 ± 0.56 a | 2.83 ± 0.60 | 2.63 ± 1.01 | 2.54 ± 0.85 |
| formula | 160 | 34.3 | 2.09 ± 0.76 ab | 1.41 ± 0.50 | 3.50 ± 0.85 | 2.89 ± 0.93 b | 2.89 ± 0.73 ab | 2.70 ± 0.63 | 2.56 ± 0.99 | 2.63 ± 0.96 |
| longer EBF | 133 | 28.5 | 2.17 ± 0.78 b | 1.50 ± 0.56 | 3.63 ± 0.69 | 2.83 ± 0.83 b | 2.83 ± 0.63 b | 2.75 ± 0.60 | 2.58 ± 0.94 | 2.67 ± 0.87 |
| p-value | 0.009 | 0.434 | 0.298 | 0.002 | 0.009 | 0.173 | 0.805 | 0.489 | ||
| Age at CFI (months): | ||||||||||
| <4 | 54 | 11.6 | 2.03 ± 0.77 | 1.37 ± 0.49 | 3.29 ± 0.84 | 3.03 ± 1.14 | 3.05 ± 0.80 | 2.77 ± 0.70 ab | 2.69 ± 1.02 | 2.89 ± 0.98 |
| 4–6 | 380 | 81.4 | 2.05 ± 0.74 | 1.45 ± 0.52 | 3.58 ± 0.74 | 2.71 ± 0.83 | 2.90 ± 0.62 | 2.74 ± 0.59 a | 2.58 ± 0.98 | 2.56 ± 0.88 |
| ≥ 7 | 33 | 7.1 | 2.00 ± 0.63 | 1.45 ± 0.39 | 3.52 ± 0.62 | 2.66 ± 0.69 | 2.93 ± 0.57 | 3.03 ± 0.61 b | 2.54 ± 0.91 | 2.69 ± 0.87 |
| p-value | 0.933 | 0.260 | 0.062 | 0.283 | 0.611 | 0.030 | 0.821 | 0.051 | ||
| CF method: | ||||||||||
| BLW | 134 | 28.7 | 2.03 ± 0.71 | 1.41 ± 0.45 | 3.66 ± 0.76 a | 2.62 ± 0.78 | 2.98 ± 0.56 | 2.76 ± 0.60 | 2.51 ± 0.96 | 2.50 ± 0.90 a |
| mixed | 141 | 30.2 | 2.06 ± 0.79 | 1.49 ± 0.54 | 3.63 ± 0.72 a | 2.74 ± 0.86 | 2.86 ± 0.61 | 2.70 ± 0.58 | 2.59 ± 0.94 | 2.45 ± 0.81 a |
| TSF | 192 | 41.1 | 2.04 ± 0.71 | 1.43 ± 0.52 | 3.38 ± 0.73 b | 2.84 ± 0.92 | 2.92 ± 0.71 | 2.81 ± 0.64 | 2.64 ± 1.02 | 2.80 ± 0.92 b |
| p-value | 0.984 | 0.501 | ≤0.001 | 0.111 | 0.310 | 0.560 | 0.446 | ≤0.001 | ||
| Types of complementary food pattern: | ||||||||||
| homemade | 257 | 55.0 | 2.05 ± 0.73 | 1.48 ± 0.52 | 3.59 ± 0.74 | 2.69 ± 0.81 | 2.98 ± 0.59 | 2.79 ± 0.59 | 2.55 ± 0.96 | 2.56 ± 0.88 |
| commercial | 210 | 45.0 | 2.04 ± 0.73 | 1.40 ± 0.49 | 3.48 ± 0.75 | 2.81 ± 0.93 | 2.84 ± 0.69 | 2.74 ± 0.63 | 2.64 ± 1.00 | 2.66 ± 0.92 |
| p-value | 0.923 | 0.079 | 0.113 | 0.408 | 0.011 | 0.477 | 0.434 | 0.203 | ||
| Mealtime environment pattern: | ||||||||||
| distracted | 55 | 11.8 | 2.07 ± 0.67 | 1.51 ± 0.55 | 3.13 ± 0.71 a | 3.02 ± 1.06 a | 3.05 ± 0.65 | 2.97 ± 0.60 a | 2.83 ± 1.07 | 2.97 ± 0.85 a |
| separated | 115 | 24.6 | 2.05 ± 0.75 | 1.42 ± 0.47 | 3.33 ± 0.78 a | 2.59 ± 0.83 b | 2.94 ± 0.71 | 2.73 ± 0.64 b | 2.51 ± 0.98 | 2.74 ± 0.99 ab |
| family | 297 | 63.6 | 2.04 ± 0.74 | 1.44 ± 0.51 | 3.69 ± 0.70 b | 2.75 ± 0.83 ab | 2.88 ± 0.61 | 2.74 ± 0.59 b | 2.58 ± 0.96 | 2.49 ± 0.84 b |
| p-value | 0.816 | 0.568 | ≤0.001 | 0.035 | 0.157 | 0.026 | 0.189 | ≤0.001 | ||
| Factors | CEBQ Subscales | |||||||
|---|---|---|---|---|---|---|---|---|
| FR β (95% CI) | EOE β (95% CI) | EF β (95% CI) | DD β (95% CI) | SR β (95% CI) | SE β (95% CI) | EUE β (95% CI) | FF β (95% CI) | |
| Early feeding pattern: | ||||||||
| longer ABF | −0.169 (−0.273–0.064) | −0.035 (−0.139–0.069) | −0.107 (−0.207–−0.007) * | −0.187 (−0.289–−0.085) *** | 0.117 (0.014–0.220) * | 0.110 (0.006–0.214) * | 0.045 (−0.060–0.149) | −0.024 (−0.126–0.079) |
| formula | 0.044 (−0.059–0.147) | −0.043 (−0.146–0.060) | 0.005 (−0.094–0.104) | 0.114 (0.013–0.215) ** | −0.018 (−0.120–0.084) | −0.084 (−0.187–0.019) | −0.036 (−0.140–0.068) | −0.016 (−0.118–0.085) |
| longer EBF | Ref | Ref | Ref | Ref | Ref | Ref | Ref | Ref |
| CF method: | ||||||||
| BLW | 0.012 (−0.117–0.142) | −0.097 (−0.227–0.032) | 0.026 (−0.098–0.151) | −0.090 (−0.218–0.037) | 0.044 (−0.085–0.173) | −0.025 (−0.155–0.104) | −0.051 (−0.181–0.079) | −0.013 (−0.141–0.114) |
| mixed | 0.018 (−0.094–0.131) | 0.095 (−0.017–0.208) | 0.083 (−0.025–0.190) | 0.021 (−0.089–0.132) | −0.057 (−0.168–0.055) | −0.059 (−0.171–0.052) | 0.014 (−0.099–0.126) | −0.124 (−0.234–−0.013) * |
| TSF | Ref | Ref | Ref | Ref | Ref | Ref | Ref | Ref |
| Types of complementary food pattern: | ||||||||
| homemade | 0.021 (−0.081–0.123) | 0.108 (0.000–0.210) | −0.003 (−0.101–0.095) | −0.014 (−0.115–0.086) | 0.118 (0.017–0.219)* | 0.059 (−0.043–0.160) | −0.030 (−0.133–0.073) | 0.002 (−0.099–0.103) |
| commercial | Ref | Ref | Ref | Ref | Ref | Ref | Ref | Ref |
| Mealtime environment pattern: | ||||||||
| distracted | 0.022 (−0.115–0.158) | 0.092 (−0.044–0.229) | −0.212 (−0.343–−0.081) ** | 0.151 (0.018–0.285) * | 0.122 (−0.013–0.257) | 0.171 (0.035–0.307) * | 0.125 (−0.012–0.262) | 0.149 (0.015–0.284) ** |
| separated | −0.015 (−0.149–0.119) | −0.071 (−0.205–0.064) | −0.068 (−0.197–0.061) | −0.226 (−0.357–−0.094) *** | 0.010 (−0.123–0.143) | −0.101 (−0.234–0.033) | −0.121 (−0.255–0.014) | 0.004 (−0.128–0.136) |
| family | Ref | Ref | Ref | Ref | Ref | Ref | Ref | Ref |
| R2 | 0.01 | 0.01 | 0.09 *** | 0.05 *** | 0.03 ** | 0.02 * | 0.00 | 0.04 *** |
| Factors | CEBQ Subscales | |||||||
|---|---|---|---|---|---|---|---|---|
| FR β (95% CI) | EOE β (95% CI) | EF β (95% CI) | DD β (95% CI) | SR β (95% CI) | SE β (95% CI) | EUE β (95% CI) | FF β (95% CI) | |
| Early feeding pattern: | ||||||||
| longer ABF | −0.197 (−0.307–0.087) | −0.029 (−0.139–0.082) | −0.178 (−0.282–−0.075) *** | −0.183 (−0.292–−0.074) ** | 0.158 (0.050–0.267) ** | 0.146 (0.037–0.255) ** | 0.064 (–0.047–0.175) | 0.062 (−0.042–0.166) |
| formula | 0.047 (−0.058–0.151) | −0.042 (–0.146–0.063) | 0.018 (−0.080–0.116) | 0.109 (0.006–0.212) * | −0.026 (−0.128–0.076) | −0.105 (−0.208–−0.002) * | −0.039 (−0.144–0.067) | −0.025 (−0.124–0.073) |
| longer EBF | Ref | Ref | Ref | Ref | Ref | Ref | Ref | Ref |
| CF method: | ||||||||
| BLW | 0.013 (−0.117–0.143) | −0.100 (−0.231–0.030) | 0.035 (−0.087–0.157) | −0.090 (−0.218–0.038) | 0.036 (−0.092–0.163) | −0.036 (−0.164–0.093) | −0.056 (−0.187–0.075) | −0.017 (−0.139–0.105) |
| mixed | 0.010 (−0.102–0.123) | 0.095 (−0.018–0.208) | 0.064 (−0.042–0.169) | 0.022 (−0.089–0.133) | −0.044 (−0.155–0.066) | −0.052 (−0.163–0.059) | 0.016 (−0.097–0.130) | −0.096 (−0.202–0.010) |
| TSF | Ref | Ref | Ref | Ref | Ref | Ref | Ref | Ref |
| Types of complementary food pattern: | ||||||||
| homemade | 0.025 (−0.077–0.127) | 0.108 (0.000–0.210) | 0.008 (−0.088–0.104) | −0.014 (−0.115–0.086) | 0.110 (0.009–0.210) ** | 0.053 (−0.048–0.154) | −0.032 (−0.135–0.071) | −0.013 (−0.109–0.083) |
| commercial | Ref | Ref | Ref | Ref | Ref | Ref | Ref | Ref |
| Mealtime environment pattern: | ||||||||
| distracted | 0.030 (−0.107–0.166) | 0.092 (−0.046–0.229) | −0.192 (−0.321–−0.064) ** | 0.150 (0.015–0.285) * | 0.110 (−0.024–0.244) | 0.160 (0.025–0.295) * | 0.120 (−0.017–0.258) | 0.125 (−0.004–0.253) |
| separated | −0.019 (−0.153–0.115) | −0.071 (−0.206–0.064) | −0.078 (−0.205–0.048) | −0.224 (−0.356– −0.092) *** | 0.016 (−0.116–0.147) | −0.093 (−0.026–0.039) | −0.119 (−0.254–0.016) | 0.018 (−0.109–0.144) |
| family | Ref | Ref | Ref | Ref | Ref | Ref | Ref | Ref |
| R2 | 0.01 | 0.00 | 0.12 *** | 0.04 ** | 0.05 *** | 0.03 ** | 0.00 | 0.12 *** |
Publisher’s Note: MDPI stays neutral with regard to jurisdictional claims in published maps and institutional affiliations. |
© 2022 by the authors. Licensee MDPI, Basel, Switzerland. This article is an open access article distributed under the terms and conditions of the Creative Commons Attribution (CC BY) license (https://creativecommons.org/licenses/by/4.0/).
Share and Cite
Masztalerz-Kozubek, D.; Zielinska-Pukos, M.A.; Hamulka, J. Early Feeding Factors and Eating Behaviors among Children Aged 1–3: A Cross-Sectional Study. Nutrients 2022, 14, 2279. https://doi.org/10.3390/nu14112279
Masztalerz-Kozubek D, Zielinska-Pukos MA, Hamulka J. Early Feeding Factors and Eating Behaviors among Children Aged 1–3: A Cross-Sectional Study. Nutrients. 2022; 14(11):2279. https://doi.org/10.3390/nu14112279
Chicago/Turabian StyleMasztalerz-Kozubek, Daria, Monika A. Zielinska-Pukos, and Jadwiga Hamulka. 2022. "Early Feeding Factors and Eating Behaviors among Children Aged 1–3: A Cross-Sectional Study" Nutrients 14, no. 11: 2279. https://doi.org/10.3390/nu14112279
APA StyleMasztalerz-Kozubek, D., Zielinska-Pukos, M. A., & Hamulka, J. (2022). Early Feeding Factors and Eating Behaviors among Children Aged 1–3: A Cross-Sectional Study. Nutrients, 14(11), 2279. https://doi.org/10.3390/nu14112279