
Impact of an Innovative Equipment to Monitor and Control Salt Usage during Cooking at Home on Salt Intake and Blood Pressure—Randomized Controlled Trial iMC SALT

 ,
,  , , , , ,
Abstract
:1. Introduction
2. Materials and Methods
2.1. Study Design and Participants
2.2. Randomization
2.3. Intervention
2.4. Control Group
2.5. Outcomes
2.5.1. Primary and Secondary Outcomes
2.5.2. Sample Characterization and Adjustment Variables
2.6. Blinding
2.7. Statistical Methods
3. Results
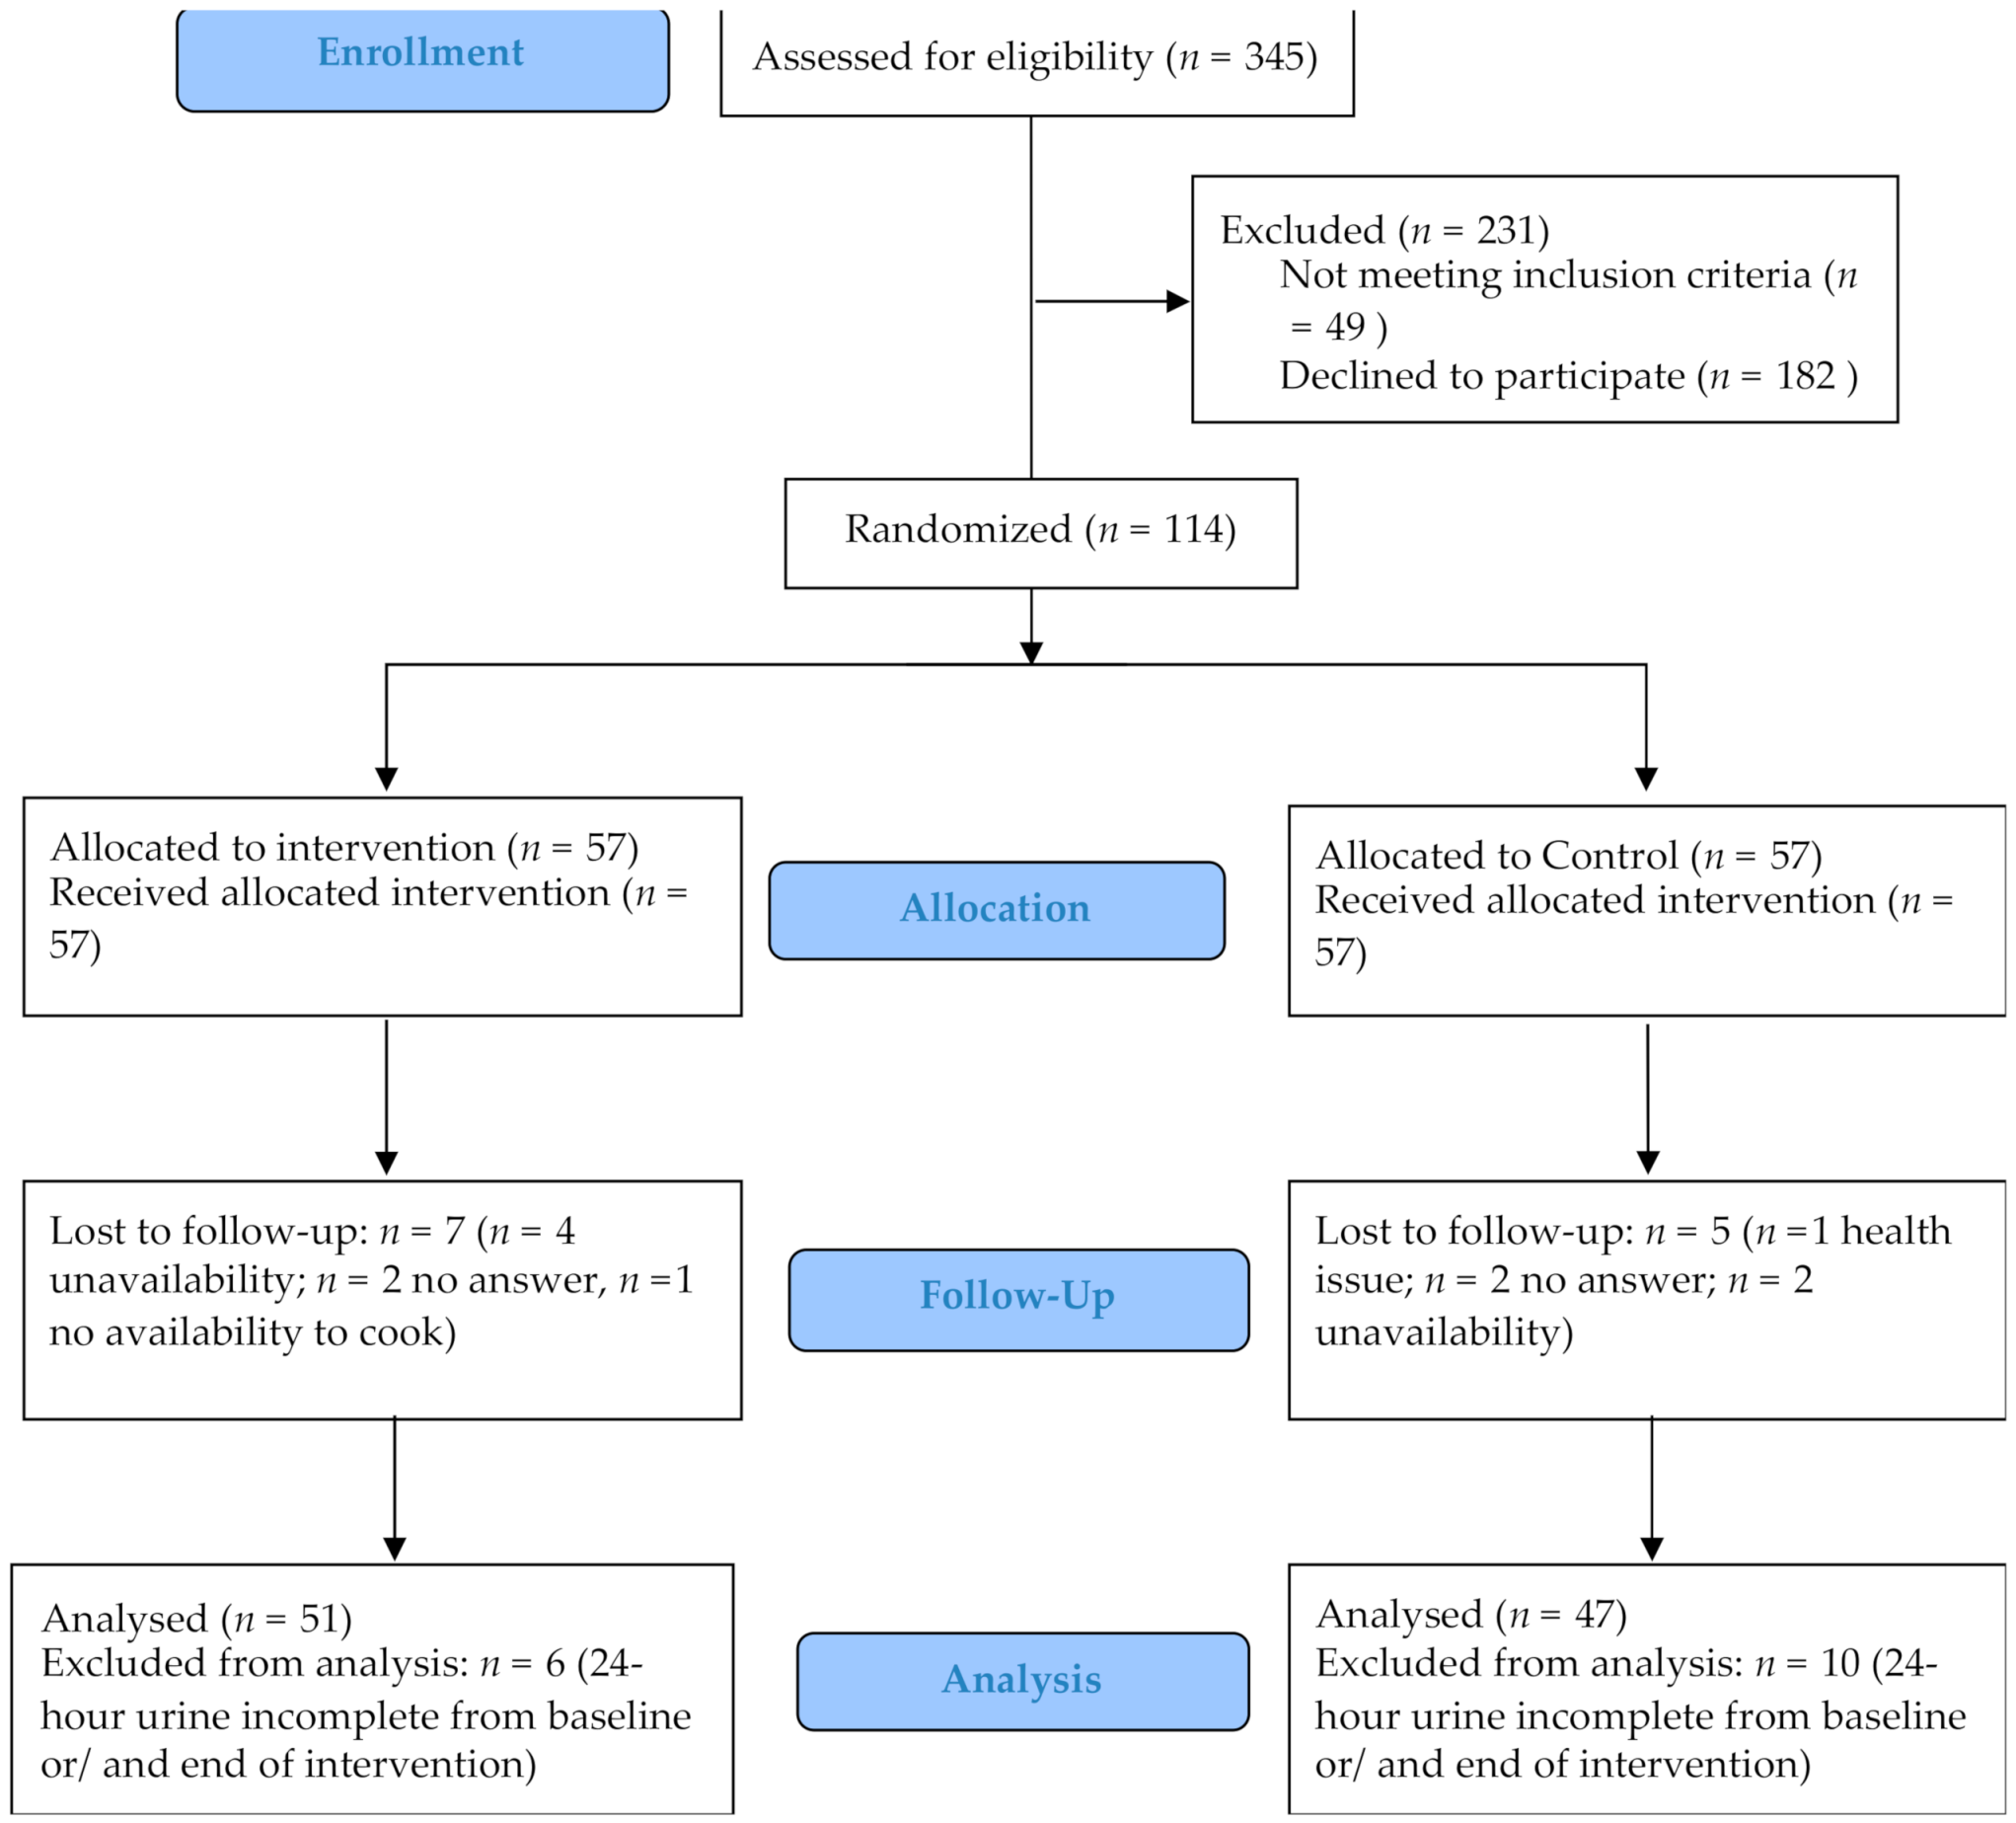
3.1. Participants
3.2. Baseline Data
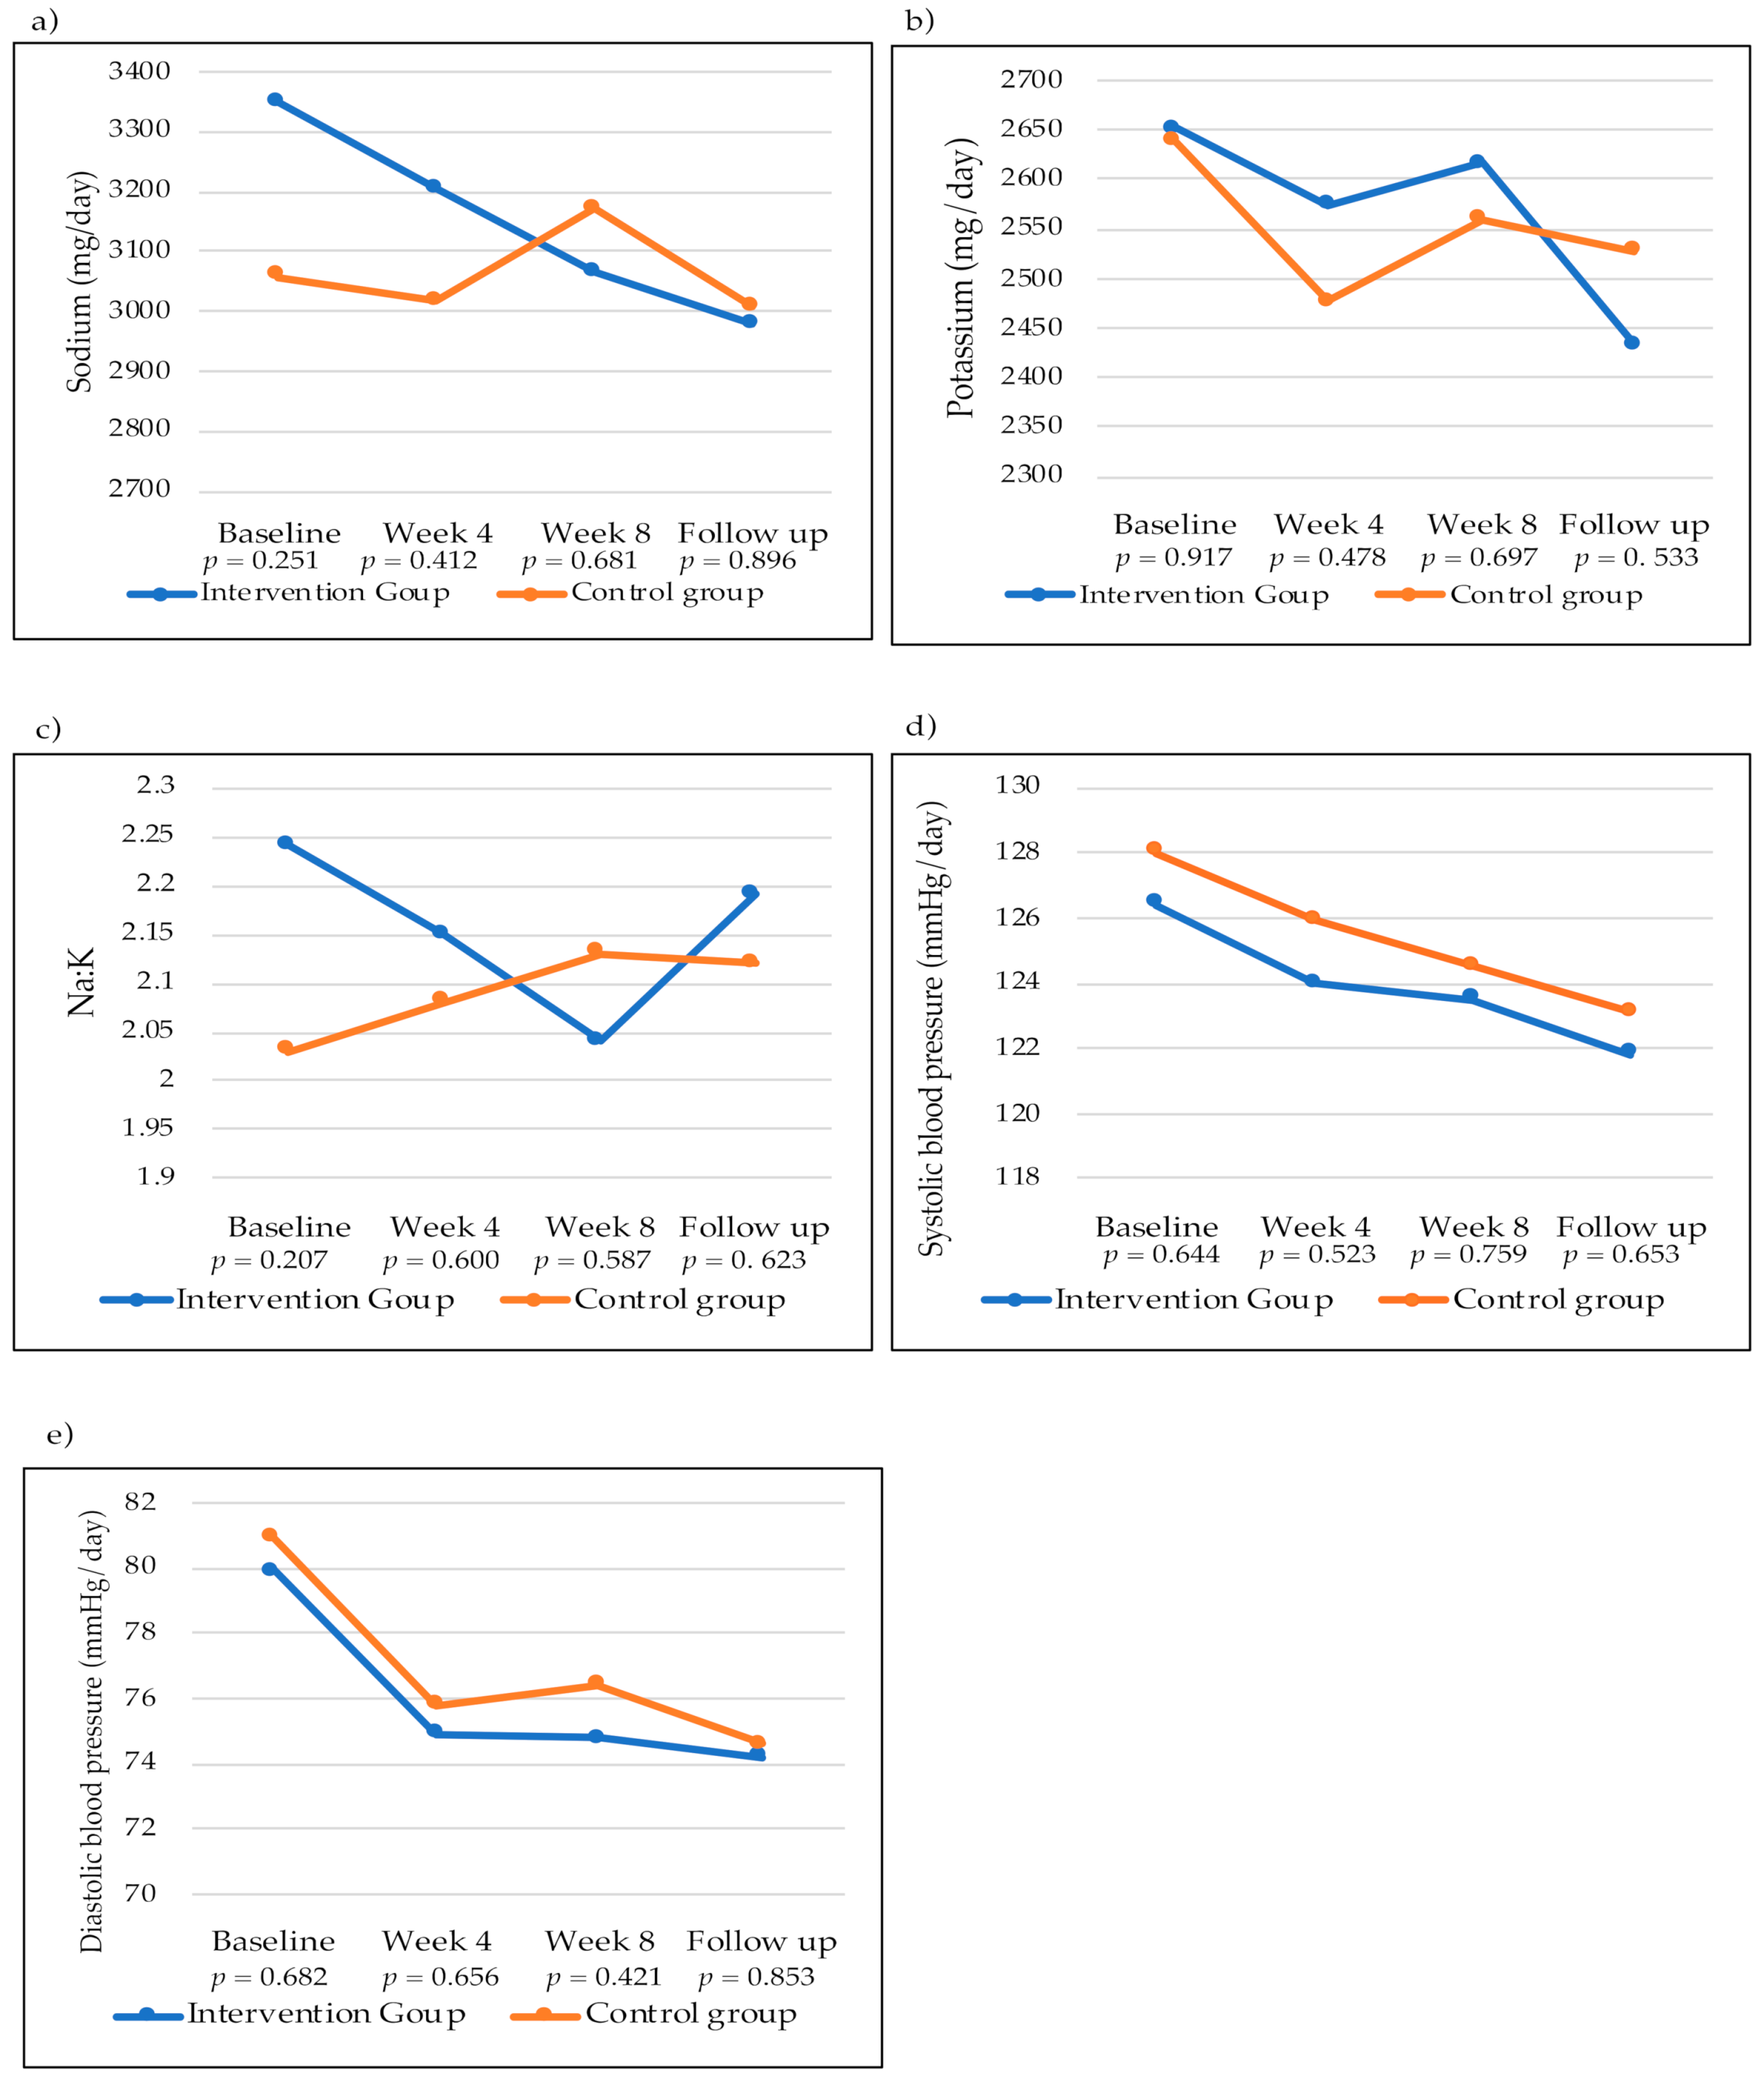
3.3. Outcomes
4. Discussion
5. Conclusions
Author Contributions
Funding
Institutional Review Board Statement
Informed Consent Statement
Data Availability Statement
Conflicts of Interest
References
- Graudal, N.A.; Hubeck-Graudal, T.; Jurgens, G. Effects of low sodium diet versus high sodium diet on blood pressure, renin, aldosterone, catecholamines, cholesterol, and triglyceride. Cochrane Database Syst. Rev. 2011, 25, Cd004022. [Google Scholar] [CrossRef]
- Afshin, A.; Sur, P.J.; Fay, K.A.; Cornaby, L.; Ferrara, G.; Salama, J.S.; Mullany, E.C.; Abate, K.H.; Abbafati, C.; Abebe, Z.; et al. Health effects of dietary risks in 195 countries, 1990-2017: A systematic analysis for the Global Burden of Disease Study 2017. Lancet 2019, 393, 1958–1972. [Google Scholar] [CrossRef] [Green Version]
- He, F.J.; Li, J.; Macgregor, G.A. Effect of longer term modest salt reduction on blood pressure: Cochrane systematic review and meta-analysis of randomised trials. BMJ 2013, 346, f1325. [Google Scholar] [CrossRef] [PubMed] [Green Version]
- Brown, I.J.; Tzoulaki, I.; Candeias, V.; Elliott, P. Salt intakes around the world: Implications for public health. Int. J. Epidemiol. 2009, 38, 791–813. [Google Scholar] [CrossRef] [Green Version]
- da Saúde, D.G. A Saúde dos Portugueses; Direção-Geral da Saúde: Lisbon, Portugal, 2016. [Google Scholar]
- Polonia, J.; Martins, L.; Pinto, F.; Nazare, J. Prevalence, awareness, treatment and control of hypertension and salt intake in Portugal: Changes over a decade. The PHYSA study. J. Hypertens. 2014, 32, 1211–1221. [Google Scholar] [CrossRef] [Green Version]
- World Health Organization. The SHAKE Technical Package for Salt Reduction. Available online: https://apps.who.int/iris/handle/10665/250135 (accessed on 20 November 2021).
- Powles, J.; Fahimi, S.; Micha, R.; Khatibzadeh, S.; Shi, P.; Ezzati, M.; Engell, R.E.; Lim, S.S.; Danaei, G.; Mozaffarian, D. Global, regional and national sodium intakes in 1990 and 2010: A systematic analysis of 24 h urinary sodium excretion and dietary surveys worldwide. BMJ Open 2013, 3, e003733. [Google Scholar] [CrossRef] [Green Version]
- Bhat, S.; Marklund, M.; Henry, M.E.; Appel, L.J.; Croft, K.D.; Neal, B.; Wu, J.H.Y. A Systematic Review of the Sources of Dietary Salt Around the World. Adv. Nutr. 2020, 11, 677–686. [Google Scholar] [CrossRef]
- Lopes, C.; Torres, D.; Oliveira, A.; Severo, M.; Alarcão, V.; Guiomar, S.; Mota, J.; Teixeira, P.; Rodrigues, S.; Lobato, L.; et al. Inquérito Alimentar Nacional e de Atividade Física, IAN-AF 2015–2016—Relatório de Resultados. Available online: https://ian-af.up.pt/sites/default/files/IAN-AF%20Relatório%20Resultados_0.pdf (accessed on 20 November 2021).
- Beaglehole, R.; Bonita, R.; Horton, R.; Adams, C.; Alleyne, G.; Asaria, P.; Baugh, V.; Bekedam, H.; Billo, N.; Casswell, S.; et al. Priority actions for the non-communicable disease crisis. Lancet 2011, 377, 1438–1447. [Google Scholar] [CrossRef]
- Trieu, K.; Neal, B.; Hawkes, C.; Dunford, E.; Campbell, N.; Rodriguez-Fernandez, R.; Legetic, B.; McLaren, L.; Barberio, A.; Webster, J. Salt Reduction Initiatives around the World—A Systematic Review of Progress towards the Global Target. PLoS ONE 2015, 10, e0130247. [Google Scholar] [CrossRef] [Green Version]
- Gonçalves, C.; Silva-Santos, T.; Abreu, S.; Padrão, P.; Graça, P.; Oliveira, L.; Esteves, S.; Norton, P.; Moreira, P.; Pinho, O. Innovative equipment to monitor and control salt usage when cooking at home: iMC SALT research protocol for a randomised controlled trial. BMJ Open 2020, 10, e035898. [Google Scholar] [CrossRef]
- Taylor, R.S.; Ashton, K.E.; Moxham, T.; Hooper, L.; Ebrahim, S. Reduced dietary salt for the prevention of cardiovascular disease: A meta-analysis of randomized controlled trials (Cochrane review). Am. J. Hypertens. 2011, 24, 843–853. [Google Scholar] [CrossRef] [PubMed] [Green Version]
- Esteves, S.; Oliveira, L.; Teixeira, J.; Gonçalves, C.; Moreira, P.; Pinho, O.; Graça, P. Dosing Device and Method of Operating the Dosing Device. 2019. Available online: https://hdl.handle.net/10216/131801 (accessed on 20 November 2021).
- Rodrigues, S.S.; Franchini, B.; Graça, P.; de Almeida, M.D. A new food guide for the Portuguese population: Development and technical considerations. J. Nutr. Educ. Behav. 2006, 38, 189–195. [Google Scholar] [CrossRef]
- Cardiovascular Disease and Alimentary Comparison (CARDIAC) Study Committee. CARDIAC Study Protocol and Manual of Operations; WHO Collaborating Center on Primary Prevention of Cardiovascular Diseases, and Cardiovascular Disease Unit: Shimane/Geneva, Switzerland, 1986. [Google Scholar]
- World Health Organization. STEPS Instruments for NCD Risk Factors (core and Expanded Version 1.4). 2001. Available online: https://apps.who.int/iris/handle/10665/68346 (accessed on 20 November 2021).
- Fitzpatrick, T. “Soleil et peau” [Sun and skin]. J. Médecine Esthétique 1975, 2, 33–34. [Google Scholar]
- Campaniço, H. Validade Simultânea do Questionário Internacional de Actividade Física Através da Medição Objectiva da Actividade Física por Actigrafia Proporcional; University of Lisbon: Lisbon, Portugal, 2016. [Google Scholar]
- Stewart, A.; Marfell-Jones, M.; Olds, T.; Ridder, H. International Standards for Anthropometric Assesment (2011); ISAK. International Society for the Advancement of Kinanthropometry: Potchfstroom, South Africa, 2016. [Google Scholar]
- Armijo-Olivo, S.; Warren, S.; Magee, D. Intention to treat analysis, compliance, drop-outs and how to deal with missing data in clinical research: A review. Phys. Ther. Rev. 2009, 14, 36–49. [Google Scholar] [CrossRef]
- Land, M.A.; Wu, J.H.; Selwyn, A.; Crino, M.; Woodward, M.; Chalmers, J.; Webster, J.; Nowson, C.; Jeffery, P.; Smith, W.; et al. Effects of a community-based salt reduction program in a regional Australian population. BMC Public Health 2016, 16, 388. [Google Scholar] [CrossRef] [Green Version]
- Anderson, C.A.; Cobb, L.K.; Miller, E.R., 3rd; Woodward, M.; Hottenstein, A.; Chang, A.R.; Mongraw-Chaffin, M.; White, K.; Charleston, J.; Tanaka, T.; et al. Effects of a behavioral intervention that emphasizes spices and herbs on adherence to recommended sodium intake: Results of the SPICE randomized clinical trial. Am. J. Clin. Nutr. 2015, 102, 671–679. [Google Scholar] [CrossRef] [PubMed] [Green Version]
- Chen, S.L.; Dahl, C.; Meyer, H.E.; Madar, A.A. Estimation of Salt Intake Assessed by 24-Hour Urinary Sodium Excretion among Somali Adults in Oslo, Norway. Nutrients 2018, 10, 900. [Google Scholar] [CrossRef] [Green Version]
- Zhang, X.; Chen, B.; Jia, P.; Han, J. Locked on salt? Excessive consumption of high-sodium foods during COVID-19 presents an underappreciated public health risk: A review. Environ. Chem. Lett. 2021, 19, 3583–3595. [Google Scholar] [CrossRef]
- Han, J.; Zhang, X.; He, S.; Jia, P. Can the coronavirus disease be transmitted from food? A review of evidence, risks, policies and knowledge gaps. Environ. Chem. Lett. 2020, 19, 5–16. [Google Scholar] [CrossRef]
- Bogataj Jontez, N.; Novak, K.; Kenig, S.; Petelin, A.; Jenko Pražnikar, Z.; Mohorko, N. The Impact of COVID-19-Related Lockdown on Diet and Serum Markers in Healthy Adults. Nutrients 2021, 13, 1082. [Google Scholar] [CrossRef]
- Perez, V.; Chang, E.T. Sodium-to-potassium ratio and blood pressure, hypertension, and related factors. Adv. Nutr. 2014, 5, 712–741. [Google Scholar] [CrossRef]
- Pengo, M.F.; Albini, F.; Guglielmi, G.; Mollica, C.; Soranna, D.; Zambra, G.; Zambon, A.; Bilo, G.; Parati, G. Home blood pressure during COVID-19-related lockdown in patients with hypertension. Eur. J. Prev. Cardiol. 2021, zwab010. [Google Scholar] [CrossRef]
- Girerd, N.; Meune, C.; Duarte, K.; Vercamer, V.; Lopez-Sublet, M.; Mourad, J.J. Evidence of a Blood Pressure Reduction During the COVID-19 Pandemic and Associated Lockdown Period: Insights from e-Health Data. Telemed. e-Health 2021. [Google Scholar] [CrossRef] [PubMed]
- Takada, T.; Imamoto, M.; Fukuma, S.; Yamamoto, Y.; Sasaki, S.; Uchida, M.; Miura, Y.; Shimizu, S.; Nihata, K.; Fukuhara, S. Effect of cooking classes for housewives on salt reduction in family members: A cluster randomized controlled trial. Public Health 2016, 140, 144–150. [Google Scholar] [CrossRef]
- Yokokawa, H.; Yuasa, M.; Nedsuwan, S.; Moolphate, S.; Fukuda, H.; Kitajima, T.; Minematsu, K.; Tanimura, S.; Marui, E. An impact of dietary intervention on blood pressures among diabetic and/or hypertensive patients with high cardiovascular disorders risk in northern Thailand by cluster randomized trial. J. Gen. Fam. Med. 2021, 22, 28–37. [Google Scholar] [CrossRef] [PubMed]
- Chen, J.; Tian, Y.; Liao, Y.; Yang, S.; Li, Z.; He, C.; Tu, D.; Sun, X. Salt-restriction-spoon improved the salt intake among residents in China. PLoS ONE 2013, 8, e78963. [Google Scholar] [CrossRef] [PubMed]
- Holbrook, J.T.; Patterson, K.Y.; Bodner, J.E.; Douglas, L.W.; Veillon, C.; Kelsay, J.L.; Mertz, W.; Smith, J.C., Jr. Sodium and potassium intake and balance in adults consuming self-selected diets. Am. J. Clin. Nutr. 1984, 40, 786–793. [Google Scholar] [CrossRef]
- Ginos, B.N.R.; Engberink, R. Estimation of Sodium and Potassium Intake: Current Limitations and Future Perspectives. Nutrients 2020, 12, 3275. [Google Scholar] [CrossRef]
- Campbell, N.R.C.; He, F.J.; Tan, M.; Cappuccio, F.P.; Neal, B.; Woodward, M.; Cogswell, M.E.; McLean, R.; Arcand, J.; MacGregor, G.; et al. The International Consortium for Quality Research on Dietary Sodium/Salt (TRUE) position statement on the use of 24-h, spot, and short duration (<24 h) timed urine collections to assess dietary sodium intake. J. Clin. Hypertens. 2019, 21, 700–709. [Google Scholar] [CrossRef] [Green Version]


| Participants’ Characteristics | Total (n = 114) | Intervention Group (n = 57) | Control Group (n = 57) | p-Value |
|---|---|---|---|---|
| Age (mean ± SD) | 48 ± 11 | 47 ± 10 | 49 ± 11 | 0.178 |
| Women (%) | 54.4 | 52.6 | 56.1 | 0.707 |
| Education (%) | 0.166 | |||
| No higher education | 13.2 | 8.8 | 17.5 | |
| Higher education | 86.8 | 91.2 | 82.5 | |
| Marital Status (%) | ||||
| Single | 16.7 | 17.5 | 15.8 | 0.813 |
| Married | 68.4 | 64.9 | 71.9 | |
| Divorced | 11.4 | 14 | 8.8 | |
| Widow/er | 3.5 | 3.5 | 3.5 | |
| Hypertensive (%) | 38.6 | 42.1 | 35.1 | 0.442 |
| Body mass index, kg/m2 (mean ± SD) | 26.0 ± 3.9 | 25.8 ± 4.0 | 26.2 ± 3.9 | 0.587 |
| Energy intake (kcal) (median [P25; P75]) | 2033 [1632; 2596] | 2042 [1697; 2629] | 2007 [1559; 2461] | 0.375 |
| Moderate and/or vigorous physical activity/week (minutes per week) (median [P25; P75]) | 60 [0; 240] | 70 [0; 255] | 60 [0; 210] | 0.804 |
| Skin phenotypes 1 (%) | ||||
| Type 1 | 1.8 | 1.8 | 1.8 | NA |
| Type 2 | 10.5 | 10.5 | 10.5 | |
| Type 3 | 51.8 | 50.9 | 52.6 | |
| Type 4 | 34.2 | 35.1 | 33.3 | |
| Type 5 | 0.0 | 0.0 | 0.0 | |
| Type 6 | 1.8 | 1.8 | 1.8 | |
| Smoking habits (%) | ||||
| Non smoking | 63.2 | 63.2 | 63.2 | 0.424 |
| Smoker | 12.3 | 15.8 | 8.8 | |
| Former smoker | 24.6 | 21.1 | 28.1 | |
| Alcohol intake, drinks/week (median [P25; P75]) | 0.29 [0.15; 0.75] | 0.29 [0.1; 0.7] | 0.29 [0.14; 0.86] | 0.590 |
| Outcomes | Intervention Group | Control Group | ||||||
|---|---|---|---|---|---|---|---|---|
| Baseline (Mean [95%CI]) | End of Intervention, Week 8 (Mean [95%CI]) | Change from Baseline [95%CI] | p-Value | Baseline (Mean [95%CI]) | End of Intervention, Week 8 (Mean [95%CI]) | Change from Baseline [95%CI] | p-Value | |
| Sodium (mg) * | 3369 [3021 to 3717] | 3033 [2653, 3413] | −336 [−723 to 51] | 0.088 | 3135 [2782 to 3488] | 3185 [2812 to 3558] | 50 [−327 to 428] | 0.792 |
| Potassium (mg) * | 2658 [2454 to 2862] | 2615 [2403, 2828] | −43 [−270 to 184] | 0.710 | 2665 [2457 to 2871] | 2565 [2357 to 2773] | −99 [−321 to 123] | 0.377 |
| Na:K * | 2.2 [2.0 to 2.5] | 2.0 [1.8 to 2.2] | −0.2 [−0.5 to 0.0] | 0.104 | 2.1 [1.8 to 2.3] | 2.1 [1.9 to 2.4] | 0.1 [−0.2 to 0.4] | 0.583 |
| SBP (mmHg) ** | 126.2 [121.4 to 131.0] | 123.0 [118.8 to 127.2] | −3.2 [−7.0 to 0.6] | 0.094 | 127.7 [122.9 to 132.6] | 124.1 [119.9 to 128.2] | −3.7 [−7.4 to −0.0] | 0.048 |
| DBP (mmHg) ** | 79.7 [76.5 to 82.8] | 74.9 [72.0 to 77.7] | −4.8 [−6.7 to −2.9] | <0.001 | 81.2 [78.0 to 84.4] | 76.4 [73.6 to 79.2] | −4.8 [−6.7 to −2.9] | <0.001 |
| Outcomes | Intention to Treat | Per Protocol | ||
|---|---|---|---|---|
| Adjusted Difference [95%CI] (Intervention vs. Control) | p-Value | Adjusted Difference [95%CI] (Intervention vs. Control) | p-Value | |
| Sodium (mg) * | −152 [−684 to 380] | 0.350 | −163 [−753 to 428] | 0.585 |
| Potassium (mg) * | 50 [−247 to 347] | 0.738 | −58 [−223 to 107] | 0.487 |
| Na:K * | −0.1 [−0.4 to 0.2] | 0.426 | −0.2 [−0.5 to 0.2] | 0.267 |
| SBP (mmHg) ** | −1.0 [−6.9 to 4.8] | 0.729 | −1.2 [−7.7 to 5.3] | 0.715 |
| DBP (mmHg) ** | −1.6 [−5.6 to 2,4] | 0.441 | −1.7 [−6.1 to 2.7] | 0.445 |
| Intervention Group | Control Group | |||||||
|---|---|---|---|---|---|---|---|---|
| Outcomes | Sex | Hypertension | Adjusted Difference [95%CI] (Change from Baseline) | p-Value | Adjusted Difference [95%CI] (Change from Baseline) | p-Value | Adjusted Difference [95%CI] (Intervention vs. Control) | p-Value |
| Sodium (mg) * | Women | Yes | 105 [−795 to 1013] | 0.810 | 109 [−795 to 1013] | 0.798 | −536 [−1916 to 845] | 0.420 |
| No | −253 [−761 to 256] | 0.320 | 211 [−263 to 685] | 0.320 | 42 [−638 to 721] | 0.902 | ||
| Men | Yes | −1009 [−1876 to −142] | 0.025 | 26 [−977 to 1030] | 0.957 | −649 [−1778 to 481] | 0.245 | |
| No | 127 [−808 to 1062] | 0.781 | −126 [−977 to 726] | 0.764 | 175 [−1036 to 1385] | 0.768 | ||
| Potassium (mg) * | Women | Yes | −31 [−543 to 482] | 0.899 | −157 [−674 to 359] | 0.518 | −194 [−820 to 433] | 0.518 |
| No | 126 [−255 to 507] | 0.506 | 113 [−247 to 473] | 0.528 | 135 [−285 to 555] | 0.518 | ||
| Men | Yes | 199 [−348 to 745] | 0.453 | −316 [−933 to 301] | 0.296 | −24 [−894 to 847] | 0.955 | |
| No | −474 [−958 to 11] | 0.055 | −154 [−594 to 285] | 0.473 | 136 [−566 to 839] | 0.692 | ||
| Na:K * | Women | Yes | 0.2 [−0.4 to 0.9] | 0.473 | 0.3 [−0.4 to 0.9] | 0.369 | −0.3 [−1.3 to 0.7] | 0.543 |
| No | −0.3 [−0.7 to 0.017] | 0.062 | 0.0 [−0.3 to 0.4] | 0.811 | −0.1 [−0.5 to 0.3] | 0.562 | ||
| Men | Yes | −0.9 [−1.5 to −0.3] | 0.007 | 0.3 [−0.4 to 1.1] | 0.376 | −0.4 [−1.2 to 0.4] | 0.292 | |
| No | 0.4 [−0.3 to 1.1] | 0.442 | −0.2 [−0.3 to 1.1] | 0.203 | 0.2 [−0.4 to 0.8] | 0.512 | ||
| SBP (mmHg) ** | Women | Yes | −10.5 [−23.7 to 2.6] | 0.109 | −7.3 [−20.3 to 5.6] | 0.109 | −9.3 [−27.4 to 8.7] | 0.287 |
| No | −3.4 [−8.6 to 1.9] | 0.203 | 1.6 [−3.2 to 6.6] | 0.501 | −3.7 [−10.5 to 3.2] | 0.284 | ||
| Men | Yes | −6.7 [−14.8 to 1.4] | 0.100 | −11.3 [−20.4 to −2.2] | 0.018 | 0.8 [−11.9 to 13.5] | 0.901 | |
| No | 5.2 [−1.1 to 11.4] | 0.101 | −2.9 [−8.7 to 2.9] | 0.306 | 2.5 [−8.4 to 13.4] | 0.642 | ||
| DBP (mmHg) ** | Women | Yes | −8.4 [−15.1 to −1.6] | 0.018 | −8.4 [−15.1 to −1.6] | 0.018 | −0.6 [−8.9 to 7.6] | 0.872 |
| No | −2.6 [−5.0 to −0.1] | 0.040 | −2.6 [−5.0 to −0.1] | 0.040 | −0.7 [−5.2 to 3.8] | 0.758 | ||
| Men | Yes | −8.1 [−12.6 to −3.6] | 0.001 | −8.1 [−12.6 to −3.6] | 0.001 | −5.9 [−12.9 to 1.0] | 0.089 | |
| No | −2.6 [−5.6 to 0.5] | 0.097 | −2.6 [−5.6 to 0.5] | 0.097 | −0.7 [−9.4 to 7.9] | 0.866 | ||
Publisher’s Note: MDPI stays neutral with regard to jurisdictional claims in published maps and institutional affiliations. |
© 2021 by the authors. Licensee MDPI, Basel, Switzerland. This article is an open access article distributed under the terms and conditions of the Creative Commons Attribution (CC BY) license (https://creativecommons.org/licenses/by/4.0/).
Share and Cite
Silva-Santos, T.; Moreira, P.; Pinho, O.; Padrão, P.; Abreu, S.; Esteves, S.; Oliveira, L.; Norton, P.; Rodrigues, M.; Ndrio, A.; et al. Impact of an Innovative Equipment to Monitor and Control Salt Usage during Cooking at Home on Salt Intake and Blood Pressure—Randomized Controlled Trial iMC SALT. Nutrients 2022, 14, 8. https://doi.org/10.3390/nu14010008
Silva-Santos T, Moreira P, Pinho O, Padrão P, Abreu S, Esteves S, Oliveira L, Norton P, Rodrigues M, Ndrio A, et al. Impact of an Innovative Equipment to Monitor and Control Salt Usage during Cooking at Home on Salt Intake and Blood Pressure—Randomized Controlled Trial iMC SALT. Nutrients. 2022; 14(1):8. https://doi.org/10.3390/nu14010008
Chicago/Turabian StyleSilva-Santos, Tânia, Pedro Moreira, Olívia Pinho, Patrícia Padrão, Sandra Abreu, Sílvia Esteves, Luís Oliveira, Pedro Norton, Micaela Rodrigues, Altin Ndrio, and et al. 2022. "Impact of an Innovative Equipment to Monitor and Control Salt Usage during Cooking at Home on Salt Intake and Blood Pressure—Randomized Controlled Trial iMC SALT" Nutrients 14, no. 1: 8. https://doi.org/10.3390/nu14010008
APA StyleSilva-Santos, T., Moreira, P., Pinho, O., Padrão, P., Abreu, S., Esteves, S., Oliveira, L., Norton, P., Rodrigues, M., Ndrio, A., & Gonçalves, C. (2022). Impact of an Innovative Equipment to Monitor and Control Salt Usage during Cooking at Home on Salt Intake and Blood Pressure—Randomized Controlled Trial iMC SALT. Nutrients, 14(1), 8. https://doi.org/10.3390/nu14010008