
‘Food for Thought’—The Relationship between Diet and Cognition in Breast and Colorectal Cancer Survivors: A Feasibility Study

 , and
, and 
Abstract
:1. Introduction
2. Materials and Methods
2.1. Design
2.2. Eligibility
2.3. Procedure
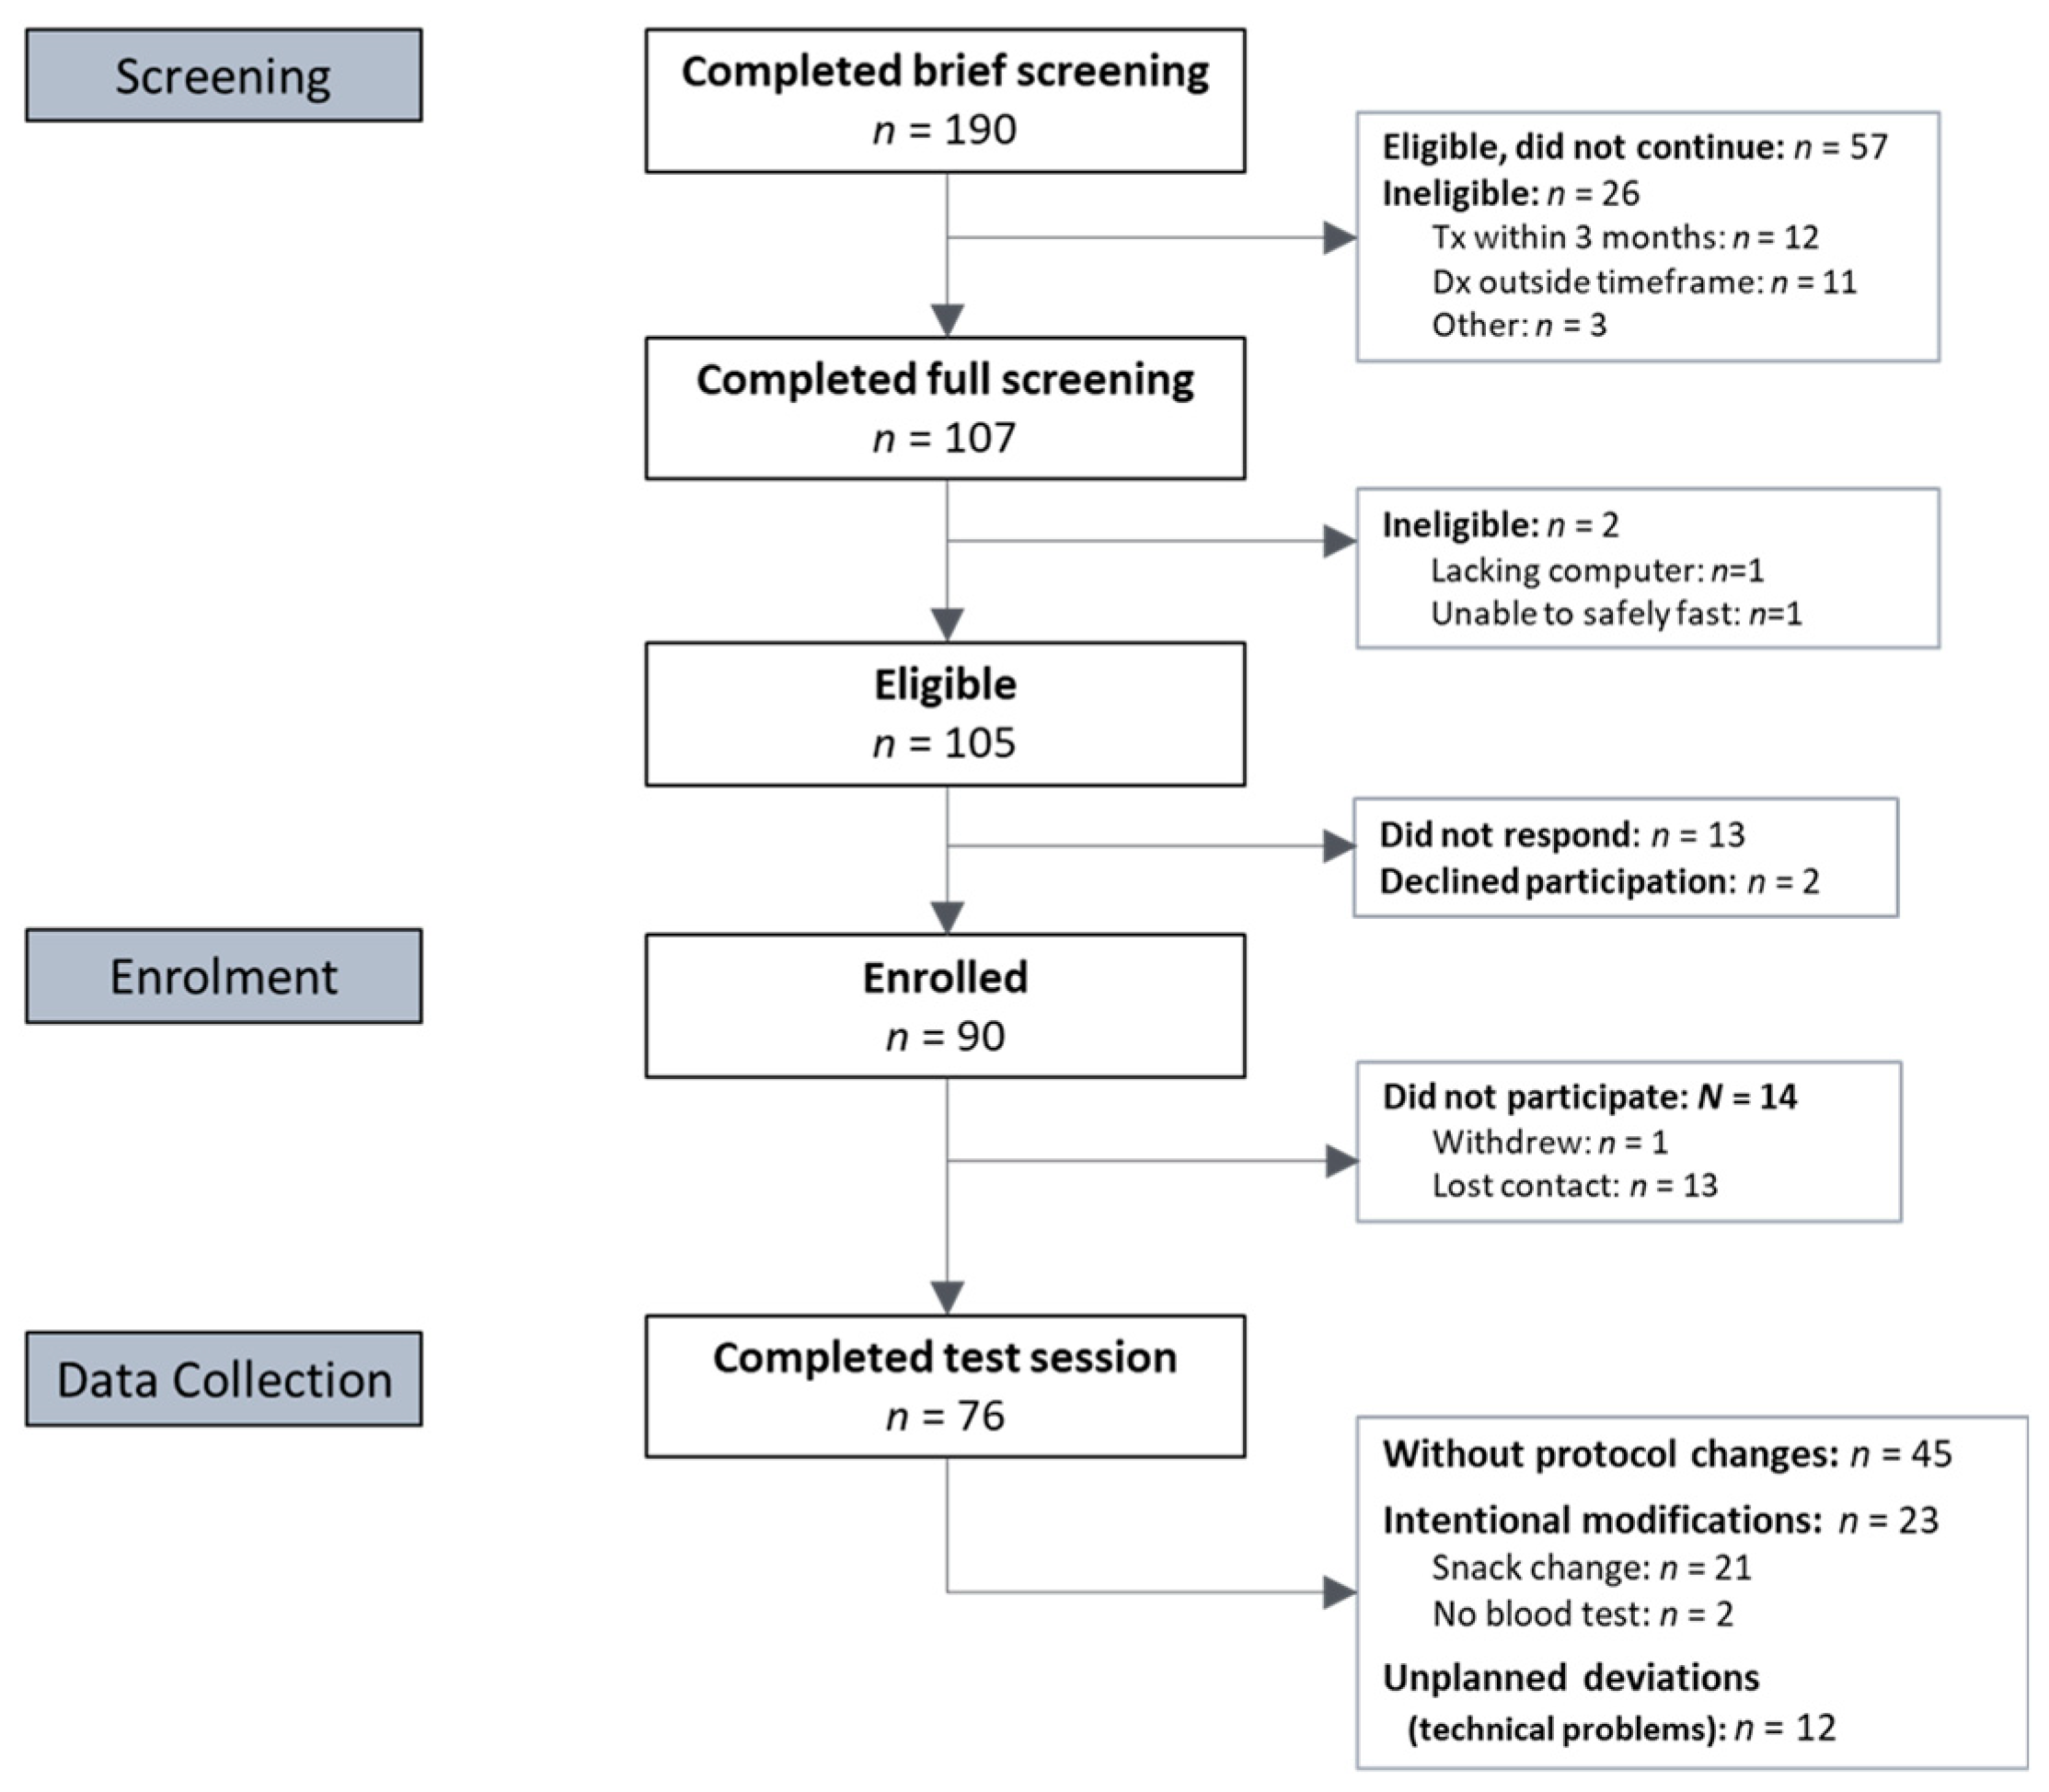
2.3.1. Recruitment
2.3.2. Screening
2.3.3. Enrolment
2.3.4. Data Collection
2.4. Instruments
2.4.1. Feasibility Measures
2.4.2. Clinical Measures
2.5. Data Analysis
3. Results
3.1. Participants
3.2. Feasibility Outcomes
3.3. Clinical Outcomes
4. Discussion
5. Conclusions
Author Contributions
Funding
Institutional Review Board Statement
Informed Consent Statement
Data Availability Statement
Acknowledgments
Conflicts of Interest
Appendix A

| Test Name | Version | Related Domains | Task Description | Outcome Type | Outcome Name |
|---|---|---|---|---|---|
| Paired Associates Learning (PAL) | Recommended standard | Visual memory & learning Episodic memory | Six coloured shapes are randomly and temporarily revealed under ‘boxes’ and re-covered. One pattern is presented and the participant must choose the location where it was originally located. | Accuracy Errors | PALFAMS PALTEA |
| Spatial Working Memory (SWM) | Recommended standard 2.0 extended | Visuospatial working memory Executive function | Hidden tokens must be collected from under various ‘boxes’, requiring the participant to remember which boxes have yielded tokens. | Use of strategy Errors | SWMS SWMBE468 |
| Delayed Matching to Sample (DMS) | Recommended standard | Attention Short term visual memory | A complex visual pattern is shown to the participant. Following a delay, they must identify the target pattern from three distractor patterns. | Accuracy Error tendency | DMSPCAD DMSPEGE |
| Rapid Visual Processing (RVP) | 3 targets | Sustained attention | Single digits appear rapidly on-screen. Participants are asked to click a button when a specific sequence of numbers is presented. | Accuracy (detection sensitivity) Error tendency | RVPA RVPPFA |
| One Touch Stockings of Cambridge (OTS) | Standard | Executive function & planning Working memory | Based on the ‘Tower of Hanoi’ problem. Participant is shown two different configurations of coloured balls and must calculate in their head how many moves are needed to match configurations. | Accuracy | OTSPSFC |
Appendix B
| Outcome Measure | r | n |
|---|---|---|
| SWMS | 0.99 * | 72 |
| SWMBE468 | 0.87 * | 72 |
| PALFAMS | 0.98 * | 72 |
| PALTEA | 0.95 * | 72 |
| DMSPEGE | 0.97 * | 72 |
| DMSPCAD | 0.95 * | 72 |
| OTSPSFC | 0.98 * | 72 |
| RVPPFA | 0.77 * | 71 |
| RVPA | 0.97 * | 71 |
Appendix C
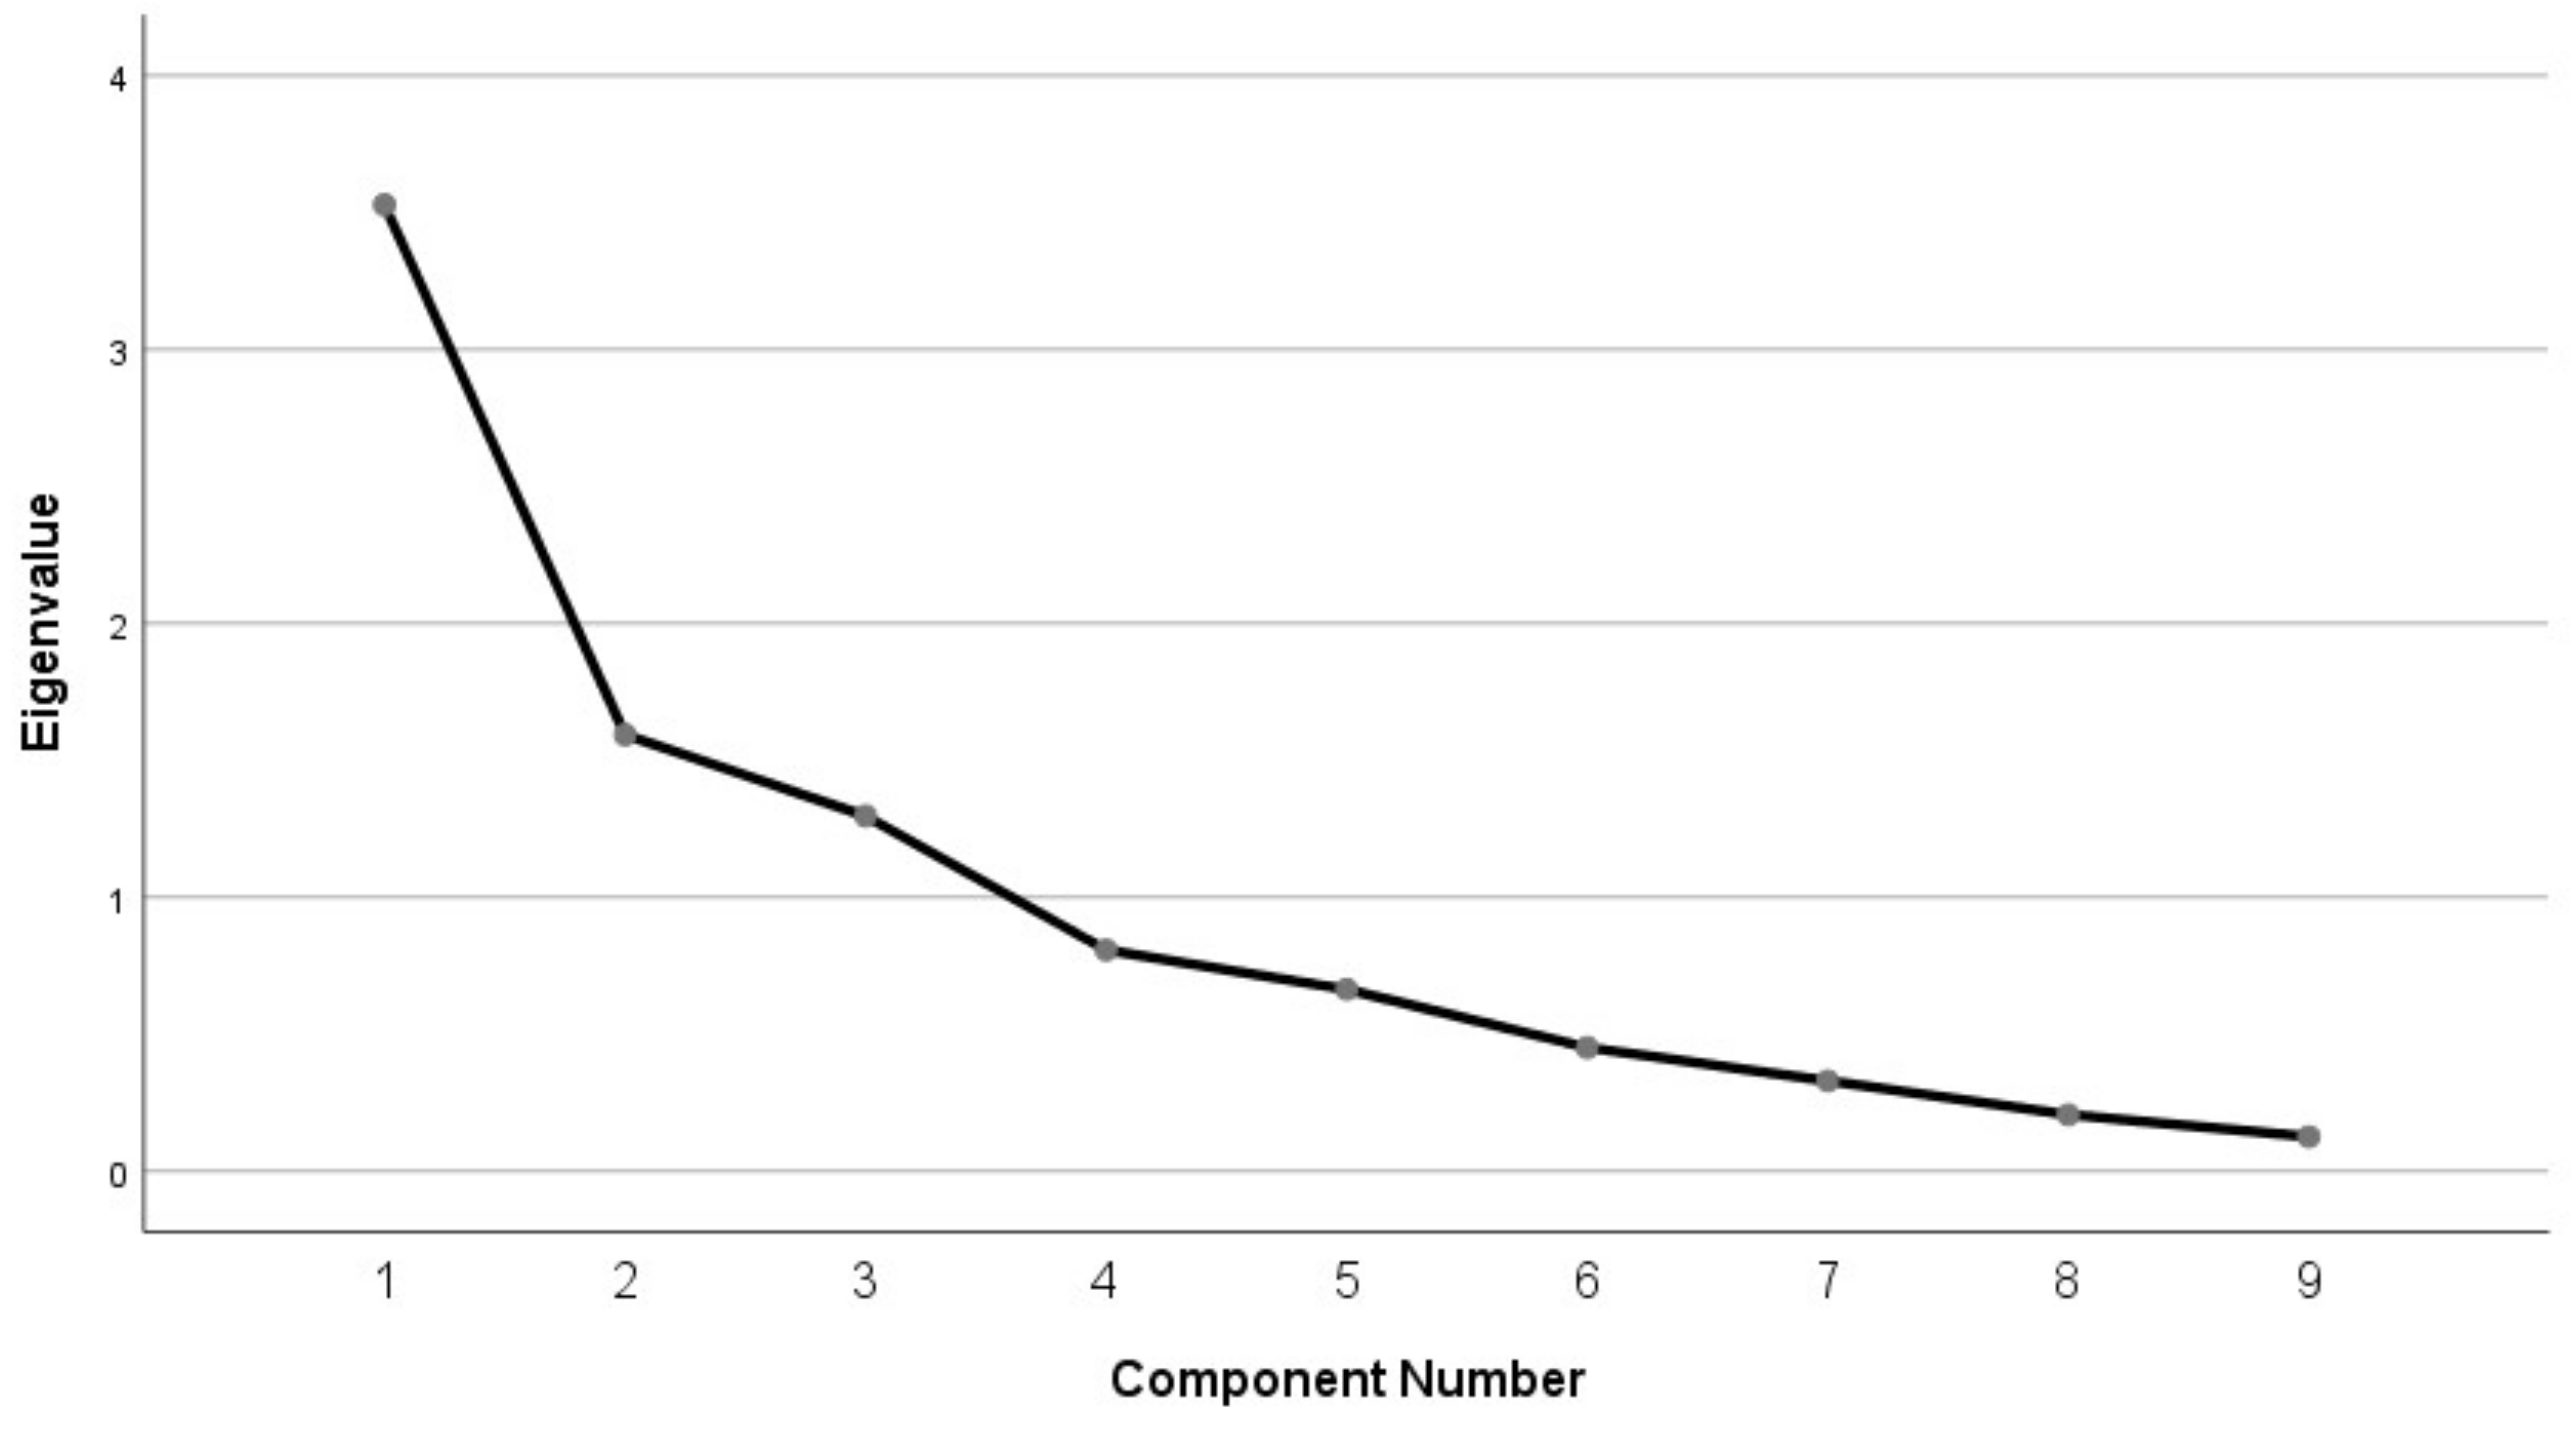
| Component | ||||
|---|---|---|---|---|
| 1 | 2 | 3 | 4 | |
| SWMS | 0.909 | |||
| SWMBE468 | 0.865 | |||
| PALFAMS | 0.951 | |||
| PALTEA | 0.917 | |||
| DMSPEGE | 0.876 | |||
| DMSPCAD | 0.847 | |||
| OTSPSFC | 0.513 | |||
| RVPPFA | 0.886 | |||
| RVPA | 0.800 | |||
Appendix D
| Pearson r | CogPCI (+) | CANTAB SWM (+) | CANTAB PAL (+) | CANTAB DMS/OTS (+) | CANTAB RVP (+) | Omega-3 Index | Fruit | Vegetable | Age | BMI | Time since Diagnosis | Months of Chemo | Months of Radio | Fatigue (+) | Depression (−) | Anxiety (−) | Stress (−) | |
|---|---|---|---|---|---|---|---|---|---|---|---|---|---|---|---|---|---|---|
Kendall’s τ | ||||||||||||||||||
| CogPCI (+) | 1 | −0.08 | 0.07 | 0.05 | −0.06 | 0.03 | −0.10 | −0.07 | 0.22 | −0.25 * | −0.10 | −0.06 | −0.12 | 0.27 * | −0.14 | −0.18 | −0.29 * | |
| CANTAB SWM (+) | −0.06 | 1 | 0.32 ** | 0.29 * | 0.52 ** | −0.10 | −0.30 ** | −0.38 ** | −0.55 ** | 0.17 | −0.21 | 0.20 | 0.06 | −0.16 | −0.10 | 0.03 | 0.16 | |
| CANTAB PAL (+) | 0.00 | 0.20 * | 1 | 0.32 ** | 0.24 * | −0.06 | −0.25 * | −0.26 * | −0.27 * | −0.08 | −0.13 | 0.18 | 0.26* | −0.13 | −0.01 | −0.05 | 0.05 | |
| CANTAB DMS/OTS (+) | −0.05 | 0.23 ** | 0.15 | 1 | 0.26 * | −0.11 | −0.09 | −0.23 | −0.34 ** | 0.15 | −0.22 | 0.20 | 0.04 | −0.10 | −0.19 | 0.09 | −0.02 | |
| CANTAB RVP (+) | −0.02 | 0.33 ** | 0.15 | 0.23 ** | 1 | −0.03 | −0.10 | −0.26 * | −0.19 | 0.09 | −0.12 | 0.32 ** | −0.04 | 0.14 | −0.20 | −0.10 | −0.01 | |
| Omega-3 Index | 0.06 | −0.08 | −0.03 | −0.07 | 0.05 | 1 | 0.11 | 0.05 | 0.13 | −0.09 | 0.28 * | 0.08 | 0.10 | 0.06 | −0.13 | −0.20 | −0.26 * | |
| Fruit | −0.06 | −0.19 * | −0.16 | −0.08 | −0.04 | 0.08 | 1 | 0.32 ** | 0.16 | −0.18 | 0.08 | −0.22 | −0.05 | 0.25 * | −0.10 | −0.14 | −0.12 | |
| Vegetable | −0.04 | −0.22 ** | −0.15 | −0.11 | −0.18 * | −0.03 | 0.27 ** | 1 | 0.32 ** | −0.10 | 0.17 | −0.23 * | −0.16 | 0.23 * | 0.09 | −0.01 | −0.04 | |
| Age | 0.15 | −0.36 ** | −0.18 * | −0.25 ** | −0.11 | 0.06 | 0.15 | 0.21 ** | 1 | −0.25 * | 0.24 * | −0.13 | 0.01 | 0.36 ** | 0.11 | −0.25 * | −0.25 * | |
| BMI | −0.17 * | 0.08 | −0.05 | 0.09 | −0.03 | −0.02 | −0.10 | −0.11 | −0.16 * | 1 | −0.04 | 0.13 | 0.03 | −0.34 ** | 0.14 | 0.42 ** | 0.16 | |
| Time since diagnosis | −0.07 | −0.15 | −0.07 | −0.07 | −0.06 | 0.18 * | 0.07 | 0.10 | 0.17* | −0.02 | 1 | 0.15 | 0.31 ** | −0.09 | 0.19 | 0.02 | 0.03 | |
| Months of chemotherapy | −0.06 | 0.18 * | 0.13 | 0.10 | 0.25 ** | 0.08 | −0.11 | −0.12 | −0.09 | 0.21 * | 0.15 | 1 | 0.09 | −0.04 | 0.02 | −0.01 | 0.05 | |
| Months of radiotherapy | −0.09 | 0.05 | 0.20 * | 0.07 | 0.03 | 0.07 | −0.02 | −0.09 | −0.01 | 0.05 | 0.23 ** | 0.11 | 1 | −0.12 | 0.25* | 0.17 | 0.18 | |
| Fatigue (+) | 0.22 ** | −0.14 | −0.08 | −0.10 | 0.07 | 0.06 | 0.15 | 0.16 * | 0.28 ** | −0.22 ** | −0.06 | −0.06 | −0.08 | 1 | −0.37 ** | −0.53 ** | −0.40 ** | |
| Depression (−) | −0.13 | −0.07 | 0.02 | −0.08 | −0.14 | −0.13 | −0.06 | −0.02 | 0.07 | 0.13 | 0.10 | 0.06 | 0.18 | −0.32 ** | 1 | 0.43 ** | 0.44 ** | |
| Anxiety (−) | −0.11 | 0.02 | −0.08 | 0.02 | −0.13 | −0.13 | −0.13 | −0.05 | −0.14 | 0.17 * | 0.03 | −0.04 | 0.13 | −0.45 ** | 0.32 ** | 1 | 0.72 ** | |
| Stress (−) | −0.21 * | 0.14 | 0.05 | 0.00 | 0.03 | −0.20 * | −0.11 | −0.04 | −0.16 * | 0.06 | 0.01 | 0.06 | 0.12 | −0.31 ** | 0.38 ** | 0.48 ** | 1 | |
Appendix E
References
- Wefel, J.S.; Kesler, S.R.; Noll, K.R.; Schagen, S.B. Clinical Characteristics, Pathophysiology, and Management of Noncentral Nervous System Cancer-Related Cognitive Impairment in Adults. CA A Cancer J. Clin. 2015, 65, 123–138. [Google Scholar] [CrossRef] [Green Version]
- Ahles, T.A.; Root, J.C. Cognitive Effects of Cancer and Cancer Treatments. Annu. Rev. Clin. Psychol. 2018, 14, 425–451. [Google Scholar] [CrossRef] [PubMed]
- Hutchinson, A.D.; Hosking, J.R.; Kichenadasse, G.; Mattiske, J.K.; Wilson, C. Objective and Subjective Cognitive Impairment Following Chemotherapy for Cancer: A Systematic Review. Cancer Treat. Rev. 2012, 38, 926–934. [Google Scholar] [CrossRef] [PubMed]
- Janelsins, M.C.; Kesler, S.R.; Ahles, T.A.; Morrow, G.R. Prevalence, Mechanisms, and Management of Cancer-Related Cognitive Impairment. Int. Rev. Psychiatry 2014, 26, 102–113. [Google Scholar] [CrossRef] [PubMed] [Green Version]
- Janelsins, M.C.; Heckler, C.E.; Peppone, L.J.; Kamen, C.; Mustian, K.M.; Mohile, S.G.; Magnuson, A.; Kleckner, I.R.; Guido, J.J.; Young, K.L.; et al. Cognitive Complaints in Survivors of Breast Cancer After Chemotherapy Compared with Age-Matched Controls: An Analysis from a Nationwide, Multicenter, Prospective Longitudinal Study. J. Clin. Oncol. 2017, 35, 506–514. [Google Scholar] [CrossRef] [PubMed]
- Leigh, S.-J.; Morris, M.J. Diet, Inflammation and the Gut Microbiome: Mechanisms for Obesity-Associated Cognitive Impairment. Biochim. Biophys. Acta (BBA)—Mol. Basis Dis. 2020, 1866, 165767. [Google Scholar] [CrossRef] [PubMed]
- James-Martin, G.; Koczwara, B.; Smith, E.L.; Miller, M.D. Information Needs of Cancer Patients and Survivors Regarding Diet, Exercise and Weight Management: A Qualitative Study. Eur. J. Cancer Care 2014, 23, 340–348. [Google Scholar] [CrossRef]
- Coro, D.G.; Hutchinson, A.D.; Banks, S.; Coates, A.M. Diet and Cognitive Function in Cancer Survivors with Cancer-Related Cognitive Impairment: A Qualitative Study. Eur. J. Cancer Care 2020, 29, e13303. [Google Scholar] [CrossRef]
- Spitznagel, M.B.; Garcia, S.; Miller, L.A.; Strain, G.; Devlin, M.; Wing, R.; Cohen, R.; Paul, R.; Crosby, R.; Mitchell, J.E.; et al. Cognitive Function Predicts Weight Loss Following Bariatric Surgery. Surg. Obes. Relat. Dis. 2013, 9, 453–459. [Google Scholar] [CrossRef] [Green Version]
- Coro, D.G.; Hutchinson, A.; Dahlenburg, S.; Banks, S.; Coates, A. The Relationship between Diet and Cognitive Function in Adult Cancer Survivors: A Systematic Review. J. Cancer Surviv. 2019, 13, 773–791. [Google Scholar] [CrossRef]
- Huang, Z.; Shi, Y.; Bao, P.; Cai, H.; Hong, Z.; Ding, D.; Jackson, J.; Shu, X.-O.; Dai, Q. Associations of Dietary Intake and Supplement Use with Post-Therapy Cognitive Recovery in Breast Cancer Survivors. Breast Cancer Res. Treat. 2018, 171, 189–198. [Google Scholar] [CrossRef]
- Martí, A.; Fortique, F. Omega-3 Fatty Acids and Cognitive Decline: A Systematic Review. Nutr. Hosp. 2019, 36, 939–949. [Google Scholar]
- Dyall, S.C. Long-Chain Omega-3 Fatty Acids and the Brain: A Review of the Independent and Shared Effects of EPA, DPA and DHA. Front. Aging Neurosci. 2015, 7, 1–15. [Google Scholar] [CrossRef] [PubMed] [Green Version]
- Marventano, S.; Kolacz, P.; Castellano, S.; Galvano, F.; Buscemi, S.; Mistretta, A.; Grosso, G. A Review of Recent Evidence in Human Studies of N-3 and n-6 PUFA Intake on Cardiovascular Disease, Cancer, and Depressive Disorders: Does the Ratio Really Matter? Int. J. Food Sci. Nutr. 2015, 66, 611–622. [Google Scholar] [CrossRef] [PubMed]
- Australian Institute of Health and Welfare Cancer in Australia 2017. Available online: https://www.aihw.gov.au/getmedia/3da1f3c2-30f0-4475-8aed-1f19f8e16d48/20066-cancer-2017.pdf.aspx (accessed on 22 October 2021).
- Harris, P.A.; Taylor, R.; Thielke, R.; Payne, J.; Gonzalez, N.; Conde, J.G. Research Electronic Data Capture (REDCap)—A Metadata-Driven Methodology and Workflow Process for Providing Translational Research Informatics Support. J. Biomed. Inform. 2009, 42, 377–381. [Google Scholar] [CrossRef] [Green Version]
- Wagner, L.I.; Sweet, J.; Butt, Z.; Lai, J.; Cella, D. Measuring Patient Self-Reported Cognitive Function: Development of the Functional Assessment of Cancer Therapy-Cognitive Function Instrument. J. Support Oncol. 2009, 7, W32–W39. [Google Scholar]
- Koch, V.; Wagner, L.I.; Green, H.J. Assessing neurocognitive symptoms in cancer patients and controls: Psychometric properties of the FACT-Cog3. Curr. Psychol. 2021, 1–11. [Google Scholar] [CrossRef]
- Cambridge Cognition Limited. Cambridge Neuro-Psychological Test Automated Battery; Cambridge Cognition Limited: Cambridge, UK, 2021. [Google Scholar]
- Backx, R.; Skirrow, C.; Dente, P.; Barnett, J.H.; Cormack, F.K. Comparing Web-Based and Lab-Based Cognitive Assessment Using the Cambridge Neuropsychological Test Automated Battery: A Within-Subjects Counterbalanced Study. J. Med. Internet Res. 2020, 22, e16792. [Google Scholar] [CrossRef] [PubMed]
- Harris, W.S.; von Schacky, C. The Omega-3 Index: A New Risk Factor for Death from Coronary Heart Disease? Prev. Med. 2004, 39, 212–220. [Google Scholar] [CrossRef]
- Harris, W.S.; Polreis, J. Measurement of the Omega-3 Index in Dried Blood Spots. Ann. Clin. Lab. Res. 2016, 4, 1–7. [Google Scholar] [CrossRef]
- Collins, C.E.; Boggess, M.M.; Watson, J.F.; Guest, M.; Duncanson, K.; Pezdirc, K.; Rollo, M.; Hutchesson, M.J.; Burrows, T.L. Reproducibility and Comparative Validity of a Food Frequency Questionnaire for Australian Adults. Clin. Nutr. 2014, 33, 906–914. [Google Scholar] [CrossRef]
- Burrows, T.L.; Hutchesson, M.J.; Rollo, M.E.; Boggess, M.M.; Guest, M.; Collins, C.E. Fruit and Vegetable Intake Assessed by Food Frequency Questionnaire and Plasma Carotenoids: A Validation Study in Adults. Nutrients 2015, 7, 3240–3251. [Google Scholar] [CrossRef]
- Cella, D.; Lai, J.; Chang, C.-H.; Peterman, A.; Slavin, M. Fatigue in Cancer Patients Compared with Fatigue in the General United States Population. Cancer 2002, 94, 528–538. [Google Scholar] [CrossRef]
- Lovibond, P.F.; Lovibond, S.H. The Structure of Negative Emotional States: Comparison of the Depression Anxiety Stress Scales (DASS) with the Beck Depression and Anxiety Inventories. Behav. Res. Ther. 1995, 33, 335–343. [Google Scholar] [CrossRef]
- Lee, J.; Lee, E.-H.; Moon, S.H. Systematic Review of the Measurement Properties of the Depression Anxiety Stress Scales–21 by Applying Updated COSMIN Methodology. Qual. Life Res. 2019, 28, 2325–2339. [Google Scholar] [CrossRef]
- Hutchinson, A.D.; Thompson, E.; Loft, N.; Lewis, I.; Wilson, C.; Yong, A.S.M. Cognitive Late Effects Following Allogeneic Stem Cell Transplantation in Haematological Cancer Patients. Eur. J. Cancer Care 2021, 30, e13448. [Google Scholar] [CrossRef] [PubMed]
- Tabachnick, B.G.; Fidell, L.S.; Ullman, J.B. Using Multivariate Statistics, 7th ed.; Pearson: New York, NY, USA, 2019; ISBN 978-0-13-479054-1. [Google Scholar]
- Cohen, J. A Power Primer. Psychol. Bull. 1992, 112, 155. [Google Scholar] [CrossRef] [PubMed]
- Australian Government Weight and Body Mass Index. Available online: https://www.health.gov.au/resources/pregnancy-care-guidelines/part-d-clinical-assessments/weight-and-body-mass-index (accessed on 22 October 2021).
- Roberts, S.C.; Seav, S.M.; McDade, T.W.; Dominick, S.A.; Gorman, J.R.; Whitcomb, B.W.; Su, H.I. Self-Collected Dried Blood Spots as a Tool for Measuring Ovarian Reserve in Young Female Cancer Survivors. Hum. Reprod. 2016, 31, 1570–1578. [Google Scholar] [CrossRef] [PubMed] [Green Version]
- Solk, P.; Gavin, K.; Fanning, J.; Welch, W.; Lloyd, G.; Cottrell, A.; Nielsen, A.; Santa Maria, C.A.; Gradishar, W.; Khan, S.A. Feasibility and Acceptability of Intensive Longitudinal Data Collection of Activity and Patient-Reported Outcomes during Chemotherapy for Breast Cancer. Qual. Life Res. 2019, 28, 3333–3346. [Google Scholar] [CrossRef] [PubMed]
- Zuniga, K.E.; Mackenzie, M.J.; Roberts, S.A.; Raine, L.B.; Hillman, C.H.; Kramer, A.F.; McAuley, E. Relationship between Fruit and Vegetable Intake and Interference Control in Breast Cancer Survivors. Eur. J. Nutr. 2016, 55, 1555–1562. [Google Scholar] [CrossRef]
- Bansal, G.; Zahedi, F.M.; Gefen, D. Do Context and Personality Matter? Trust and Privacy Concerns in Disclosing Private Information Online. Inf. Manag. 2016, 53, 1–21. [Google Scholar] [CrossRef]
- Dunberger, G.; Lind, H.; Steineck, G.; Waldenström, A.-C.; Nyberg, T.; al-Abany, M.; Nyberg, U.; Åvall-Lundqvist, E. Self-Reported Symptoms of Faecal Incontinence among Long-Term Gynaecological Cancer Survivors and Population-Based Controls. Eur. J. Cancer 2010, 46, 606–615. [Google Scholar] [CrossRef] [PubMed]
- Leong, V.; Raheel, K.; Yi, S.J.; Kacker, K.; Karlaftis, V.M.; Vassiliu, C.; Annabel, S.H.; Robbins, T.W.; Sahakian, B.J.; Kourtzi, Z. A New Remote Guided Method for Supervised Web-Based Cognitive Testing to Ensure High Quality Data. PsyArXiv 2021, 1–60. [Google Scholar] [CrossRef]
- Australian Bureau of Statistics Census of Population and Housing: Reflecting Australia—Stories from the Census. 2016. Available online: https://www.abs.gov.au/ausstats/abs@.nsf/Lookup/by%20Subject/2071.0~2016~Main%20Features~Educational%20Qualifications%20Data%20Summary%20~65 (accessed on 21 May 2021).
- Hughes, S.; Egger, S.; Carle, C.; Smith, D.P.; Chambers, S.; Kahn, C.; Caperchione, C.M.; Moxey, A.; O’Connell, D.L. Factors Associated with the Use of Diet and the Use of Exercise for Prostate Cancer by Long-Term Survivors. PLoS ONE 2019, 14, e0223407. [Google Scholar] [CrossRef] [PubMed] [Green Version]
- Van de Rest, O.; Berendsen, A.A.; Haveman-Nies, A.; de Groot, L.C. Dietary Patterns, Cognitive Decline, and Dementia: A Systematic Review. Adv. Nutr. 2015, 6, 154–168. [Google Scholar] [CrossRef]
- Merra, G.; Noce, A.; Marrone, G.; Cintoni, M.; Tarsitano, M.G.; Capacci, A.; De Lorenzo, A. Influence of Mediterranean Diet on Human Gut Microbiota. Nutrients 2021, 13, 7. [Google Scholar] [CrossRef] [PubMed]
- La Torre, D.; Verbeke, K.; Dalile, B. Dietary Fibre and the Gut–Brain Axis: Microbiota-Dependent and Independent Mechanisms of Action. Gut Microbiome 2021, 2, e3. [Google Scholar] [CrossRef]
- Sandhu, K.V.; Sherwin, E.; Schellekens, H.; Stanton, C.; Dinan, T.G.; Cryan, J.F. Feeding the Microbiota-Gut-Brain Axis: Diet, Microbiome, and Neuropsychiatry. Transl. Res. 2017, 179, 223–244. [Google Scholar] [CrossRef] [PubMed]
- Jordan, K.R.; Loman, B.R.; Bailey, M.T.; Pyter, L.M. Gut Microbiota-Immune-Brain Interactions in Chemotherapy-Associated Behavioral Comorbidities. Cancer 2018, 124, 3990–3999. [Google Scholar] [CrossRef] [Green Version]
- Song, B.C.; Bai, J. Microbiome-Gut-Brain Axis in Cancer Treatment-Related Psychoneurological Toxicities and Symptoms: A Systematic Review. Support Care Cancer 2021, 29, 605–617. [Google Scholar] [CrossRef]
- Henneghan, A.M.; Stuifbergen, A.; Becker, H.; Kesler, S.; King, E. Modifiable Correlates of Perceived Cognitive Function in Breast Cancer Survivors up to 10 Years after Chemotherapy Completion. J. Cancer Surviv. 2018, 12, 224–233. [Google Scholar] [CrossRef]
- Ehlers, D.K.; Aguiñaga, S.; Cosman, J.; Severson, J.; Kramer, A.F.; McAuley, E. The Effects of Physical Activity and Fatigue on Cognitive Performance in Breast Cancer Survivors. Breast Cancer Res. Treat. 2017, 165, 699–707. [Google Scholar] [CrossRef] [PubMed]
- Huang, Z.; Zheng, Y.; Bao, P.; Cai, H.; Hong, Z.; Ding, D.; Jackson, J.; Shu, X.-O.; Dai, Q. Aging, Obesity, and Post-Therapy Cognitive Recovery in Breast Cancer Survivors. Oncotarget 2017, 8, 12364–12373. [Google Scholar] [CrossRef] [PubMed] [Green Version]
- Myers, J.S.; Wick, J.A.; Klemp, J. Potential Factors Associated with Perceived Cognitive Impairment in Breast Cancer Survivors. Support Care Cancer 2015, 23, 3219–3228. [Google Scholar] [CrossRef] [Green Version]
- Zhou, S.-P.; Fei, S.-D.; Han, H.-H.; Li, J.-J.; Yang, S.; Zhao, C.-Y. A Prediction Model for Cognitive Impairment Risk in Colorectal Cancer after Chemotherapy Treatment. BioMed Res. Int. 2021, 2021, 1–13. [Google Scholar] [CrossRef]
- Jiang, X.; Huang, J.; Song, D.; Deng, R.; Wei, J.; Zhang, Z. Increased Consumption of Fruit and Vegetables Is Related to a Reduced Risk of Cognitive Impairment and Dementia: Meta-Analysis. Front. Aging Neurosci. 2017, 9, 18. [Google Scholar] [CrossRef] [Green Version]
- Nooyens, A.C.J.; Bueno-de-Mesquita, H.B.; van Boxtel, M.P.J.; van Gelder, B.M.; Verhagen, H.; Verschuren, W.M.M. Fruit and Vegetable Intake and Cognitive Decline in Middle-Aged Men and Women: The Doetinchem Cohort Study. Br. J. Nutr. 2011, 106, 752–761. [Google Scholar] [CrossRef] [Green Version]
- Ammann, E.M.; Pottala, J.V.; Harris, W.S.; Espeland, M.A.; Wallace, R.; Denburg, N.L.; Carnahan, R.M.; Robinson, J.G. Omega-3 Fatty Acids and Domain-Specific Cognitive Aging: Secondary Analyses of Data from WHISCA. Neurology 2013, 81, 1484–1491. [Google Scholar] [CrossRef] [Green Version]
- Johnston, D.T.; Deuster, P.A.; Harris, W.S.; MacRae, H.; Dretsch, M.N. Red Blood Cell Omega-3 Fatty Acid Levels and Neurocognitive Performance in Deployed US Servicemembers. Nutr. Neurosci. 2013, 16, 30–38. [Google Scholar] [CrossRef] [PubMed]
- Befort, C.A.; Klemp, J.R.; Austin, H.L.; Perri, M.G.; Schmitz, K.H.; Sullivan, D.K.; Fabian, C.J. Outcomes of a Weight Loss Intervention among Rural Breast Cancer Survivors. Breast Cancer Res. Treat. 2012, 132, 631–639. [Google Scholar] [CrossRef] [Green Version]
- Kaiser, H.F. An Index of Factorial Simplicity. Psychometrika 1974, 39, 31–36. [Google Scholar] [CrossRef]
| Characteristics | n (M) | % (SD) |
|---|---|---|
| Age, years | (57.5) | (10.2) |
| Sex | ||
| Female | 72 | 94.7 |
| Ethnicity | ||
| Caucasian | 69 | 90.8 |
| Education | ||
| Did not complete high school | 2 | 2.6 |
| High school | 7 | 9.2 |
| Non-university qualification | 19 | 25.0 |
| University | 24 | 31.6 |
| Post-graduate | 24 | 31.6 |
| Employment | ||
| Full time | 16 | 21.1 |
| Part time | 24 | 31.6 |
| Retired | 21 | 27.6 |
| Other | 15 | 19.7 |
| Marital status | ||
| Single | 13 | 17.1 |
| Defacto | 9 | 11.8 |
| Married | 42 | 55.3 |
| Divorced | 8 | 10.5 |
| Other | 4 | 5.2 |
| BMI 1, kg/m2 | (27.6) | (5.6) |
| Underweight (<18.5) | 1 | 1.3 |
| Healthy (18.5–24.9) | 27 | 35.5 |
| Overweight (25.0–29.9) | 24 | 31.6 |
| Obese (≥30.0) | 24 | 31.6 |
| Smoker | 2 | 2.6 |
| Cancer type | ||
| Breast | 62 | 81.6 |
| Colorectal | 14 | 18.4 |
| Cancer Stage | ||
| Unknown | 10 | 13.2 |
| 0 | 4 | 5.3 |
| 1 | 19 | 25.0 |
| 2 | 16 | 21.1 |
| 3 | 21 | 27.6 |
| 4 | 6 | 7.9 |
| Months since diagnosis | (32.6) | (15.6) |
| Menstrual status | ||
| Not applicable | 5 | 6.6 |
| Pre-menopausal | 5 | 6.6 |
| Peri-menopausal | 10 | 13.2 |
| Post-menopausal | 56 | 73.7 |
| Current hormonal therapy | 38 | 50 |
| History of | ||
| Surgery for cancer | 74 | 97.4 |
| Radiotherapy | 49 | 64.5 |
| Chemotherapy | 53 | 69.7 |
| Immunotherapy | 2 | 2.6 |
| Treatment length, months | ||
| Radiotherapy (n = 48) | (1.4) | (0.6) |
| Chemotherapy (n = 53) | (5.1) | (2.3) |
| Immunotherapy (n = 2) | (13.5) | (14.8) |
| Feasibility Criterion | Description | Purpose | Target Goal | Target Result | Target Met? |
|---|---|---|---|---|---|
| Screening refusal rate | Percent not completing screening process | Identify perceived screening burden/inconvenience | Not pre-defined | 30% | Not applicable |
| Eligibility rate | Percent completing full screening who are eligible for study | Identify clarity of recruitment criteria in study promotion | ≥80% | 98.1% | Yes |
| Refusal rate | Percent eligible participants declining participation | Identify perceived study burden/inconvenience | ≤15% | 14.3% | Yes |
| Recruitment rate | Number of participants enrolled over time | Identify expected recruitment rate over time for future larger studies | Enrol 40 participants in 12 weeks | 49 participants (123%) | Yes |
| Enrol 100 participants in 26 weeks | 90 participants (90%) | No | |||
| Retention rate | Percent enrolled participants completing study | Identify study protocol burden and acceptability | ≥80% | 84.4% | Yes |
| Satisfaction rate | Participant satisfaction at exit survey | Identify whether participant burden is acceptable for this study design | ≥80% reporting positive/ acceptable overall experience | 98.7% | Yes |
| Blood sample return rate | Percent of complete dried blood spot results from completed participants | Identify feasibility of measure use for cost and participant burden | ≥90% | 100% | Yes |
| Outcome | M (Range) | SD |
|---|---|---|
| Dietary Outcomes | ||
| Fruit, serves/day (n = 76) | 2.42 (0.15–6.11) | 1.30 |
| Vegetables, serves/day (n = 76) | 4.95 (1.10–9.72) | 1.99 |
| Omega-3 Index, % total RBC equiv. (n = 74) | 6.37 (3.99–10.32) | 1.38 |
| Cognitive Outcomes | ||
| Perceived Cognitive Impairment (n = 76) (max. range: 0–72) | 53.22 (19–72) | 12.65 |
| SWMS raw score (n = 72) | 7.39 (2–12) | 2.80 |
| SWMBE468 raw score (n = 72) | 11.78 (0–30) | 8.62 |
| PALFAMS raw score (n = 72) | 12.78 (4–20) | 3.75 |
| PALTEA raw score (n = 72) | 13.29 (0–46) | 11.11 |
| DMSPCAD raw score (n = 72) | 86.53 (60–100) | 10.75 |
| DMSPEGE raw score (n = 72) | 0.05 (0.00–0.40) | 0.12 |
| OTSPSFC raw score (n = 72) | 10.97 (2–15) | 2.96 |
| RVPA raw score (n = 71) | 0.92 (0.78–0.99) | 0.05 |
| RVPPFA raw score (n = 71) | 0.01 (0.00–0.04) | 0.01 |
| SWM overall component z-score (n = 72) | 0.00 (−1.47–1.65) | 0.94 |
| PAL overall component z-score (n = 72) | 0.00 (−2.64–1.56) | 0.96 |
| DMS/OTS overall component z-score (n = 72) | 0.00 (−2.83–0.89) | 0.78 |
| RVP overall component z-score (n = 71) | 0.00 (−2.97–1.15) | 0.89 |
| Psychological Outcomes | ||
| Fatigue 1 (n = 76) (max. range: 0–52) | 36.74 (6–52) | 10.74 |
| Depression (n = 76) (max. range: 0–42) | 5.16 (0–26) | 5.72 |
| Anxiety (n = 76) (max. range: 0–42) | 3.39 (0–22) | 4.68 |
| Stress (n = 76) (max. range: 0–42) | 7.13 (0–22) | 6.07 |
| Outcome (n) | Factor | B | SE | β | p | R2 | ΔR2 | Sig. F Change |
|---|---|---|---|---|---|---|---|---|
| CogPCI (74) | ||||||||
| Model 1 * | 0.193 | 0.193 | 0.002 | |||||
| Age | 0.216 | 0.144 | 0.165 | 0.138 | ||||
| BMI * | −0.652 | 0.260 | −0.280 | 0.014 | ||||
| Cancer type (Breast ref) * | 10.707 | 3.644 | 0.321 | 0.004 | ||||
| Model 2 | 0.228 | 0.035 | 0.221 | |||||
| Age | 0.139 | 0.150 | 0.106 | 0.354 | ||||
| BMI | −0.540 | 0.268 | −0.232 | 0.048 | ||||
| Cancer type (Breast ref) | 9.498 | 3.691 | 0.285 | 0.012 | ||||
| Fatigue | 0.125 | 0.159 | 0.100 | 0.432 | ||||
| Stress | −0.294 | 0.254 | −0.141 | 0.250 | ||||
| Model 3 | 0.277 | 0.049 | 0.235 | |||||
| Age | 0.187 | 0.153 | 0.143 | 0.227 | ||||
| BMI | −0.577 | 0.267 | −0.248 | 0.035 | ||||
| Cancer type (Breast ref) | 9.257 | 3.656 | 0.277 | 0.014 | ||||
| Fatigue | 0.181 | 0.161 | 0.145 | 0.263 | ||||
| Stress | −0.297 | 0.260 | −0.142 | 0.258 | ||||
| Fruit | −1.717 | 1.115 | −0.175 | 0.129 | ||||
| Vegetables | −0.653 | 0.743 | −0.102 | 0.382 | ||||
| n-3 index | −0.247 | 1.022 | −0.027 | 0.810 | ||||
| SWM (70) | ||||||||
| Model 1 * | 0.274 | 0.274 | 0.000 | |||||
| Age * | −0.052 | 0.010 | −0.523 | 0.000 | ||||
| Model 2 | 0.287 | 0.014 | 0.264 | |||||
| Age | −0.050 | 0.010 | −0.502 | 0.000 | ||||
| Months of chemotherapy | 0.036 | 0.032 | 0.118 | 0.264 | ||||
| Model 3 | 0.338 | 0.050 | 0.193 | |||||
| Age | −0.043 | 0.011 | −0.438 | 0.000 | ||||
| Months of chemotherapy | 0.019 | 0.032 | 0.064 | 0.554 | ||||
| Fruit | −0.057 | 0.085 | −0.077 | 0.505 | ||||
| Vegetables | −0.093 | 0.055 | −0.195 | 0.095 | ||||
| n-3 index | −0.021 | 0.071 | −0.031 | 0.765 | ||||
| PAL (69) | ||||||||
| Model 1 | 0.055 | 0.055 | 0.052 | |||||
| Age | −0.024 | 0.012 | −0.235 | 0.052 | ||||
| Model 2* | 0.123 | 0.068 | 0.027 | |||||
| Age | −0.023 | 0.012 | −0.225 | 0.056 | ||||
| Months of radiotherapy * | 0.327 | 0.144 | 0.261 | 0.027 | ||||
| Model 3 | 0.165 | 0.042 | 0.376 | |||||
| Age | −0.016 | 0.012 | −0.158 | 0.198 | ||||
| Months of radiotherapy | 0.312 | 0.146 | 0.249 | 0.037 | ||||
| Fruit | −0.103 | 0.098 | −0.135 | 0.299 | ||||
| Vegetables | −0.053 | 0.064 | −0.107 | 0.410 | ||||
| n-3 index | −0.034 | 0.083 | −0.048 | 0.685 | ||||
| RVP (69) | ||||||||
| Model 1 | 0.049 | 0.049 | 0.068 | |||||
| Age | −0.022 | 0.012 | −0.221 | 0.068 | ||||
| Model 2 * | 0.129 | 0.080 | 0.017 | |||||
| Age | −0.016 | 0.012 | −0.159 | 0.181 | ||||
| Months of chemotherapy * | 0.084 | 0.034 | 0.289 | 0.017 | ||||
| Model 3 | 0.162 | 0.034 | 0.476 | |||||
| Age | −0.012 | 0.012 | −0.119 | 0.346 | ||||
| Months of chemotherapy | 0.078 | 0.036 | 0.269 | 0.033 | ||||
| Fruit | 0.057 | 0.093 | 0.081 | 0.538 | ||||
| Vegetables | −0.093 | 0.060 | −0.203 | 0.126 | ||||
| n-3 index | −0.029 | 0.079 | −0.044 | 0.715 | ||||
| DMS/OTS (70) | ||||||||
| Model 1 * | 0.111 | 0.111 | 0.005 | |||||
| Age * | −0.028 | 0.010 | −0.333 | 0.005 | ||||
| Model 2 | 0.130 | 0.019 | 0.226 | |||||
| Age | −0.026 | 0.010 | −0.307 | 0.010 | ||||
| Months of chemotherapy | 0.036 | 0.030 | 0.142 | 0.226 | ||||
| Model 3 | 0.156 | 0.026 | 0.586 | |||||
| Age | −0.024 | 0.010 | −0.280 | 0.025 | ||||
| Months of chemotherapy | 0.035 | 0.031 | 0.139 | 0.258 | ||||
| Fruit | 0.057 | 0.081 | 0.091 | 0.485 | ||||
| Vegetables | −0.059 | 0.053 | −0.146 | 0.266 | ||||
| n-3 index | −0.055 | 0.068 | −0.095 | 0.423 |
Publisher’s Note: MDPI stays neutral with regard to jurisdictional claims in published maps and institutional affiliations. |
© 2021 by the authors. Licensee MDPI, Basel, Switzerland. This article is an open access article distributed under the terms and conditions of the Creative Commons Attribution (CC BY) license (https://creativecommons.org/licenses/by/4.0/).
Share and Cite
Coro, D.G.; Hutchinson, A.D.; Dyer, K.A.; Banks, S.; Koczwara, B.; Corsini, N.; Vitry, A.; Coates, A.M. ‘Food for Thought’—The Relationship between Diet and Cognition in Breast and Colorectal Cancer Survivors: A Feasibility Study. Nutrients 2022, 14, 71. https://doi.org/10.3390/nu14010071
Coro DG, Hutchinson AD, Dyer KA, Banks S, Koczwara B, Corsini N, Vitry A, Coates AM. ‘Food for Thought’—The Relationship between Diet and Cognition in Breast and Colorectal Cancer Survivors: A Feasibility Study. Nutrients. 2022; 14(1):71. https://doi.org/10.3390/nu14010071
Chicago/Turabian StyleCoro, Daniel G., Amanda D. Hutchinson, Kathryn A. Dyer, Siobhan Banks, Bogda Koczwara, Nadia Corsini, Agnes Vitry, and Alison M. Coates. 2022. "‘Food for Thought’—The Relationship between Diet and Cognition in Breast and Colorectal Cancer Survivors: A Feasibility Study" Nutrients 14, no. 1: 71. https://doi.org/10.3390/nu14010071
APA StyleCoro, D. G., Hutchinson, A. D., Dyer, K. A., Banks, S., Koczwara, B., Corsini, N., Vitry, A., & Coates, A. M. (2022). ‘Food for Thought’—The Relationship between Diet and Cognition in Breast and Colorectal Cancer Survivors: A Feasibility Study. Nutrients, 14(1), 71. https://doi.org/10.3390/nu14010071