
A Cross-Sectional Reproducibility Study of a Standard Camera Sensor Using Artificial Intelligence to Assess Food Items: The FoodIntech Project

 ,
,  ,
,
Abstract
1. Introduction
2. Materials and Methods
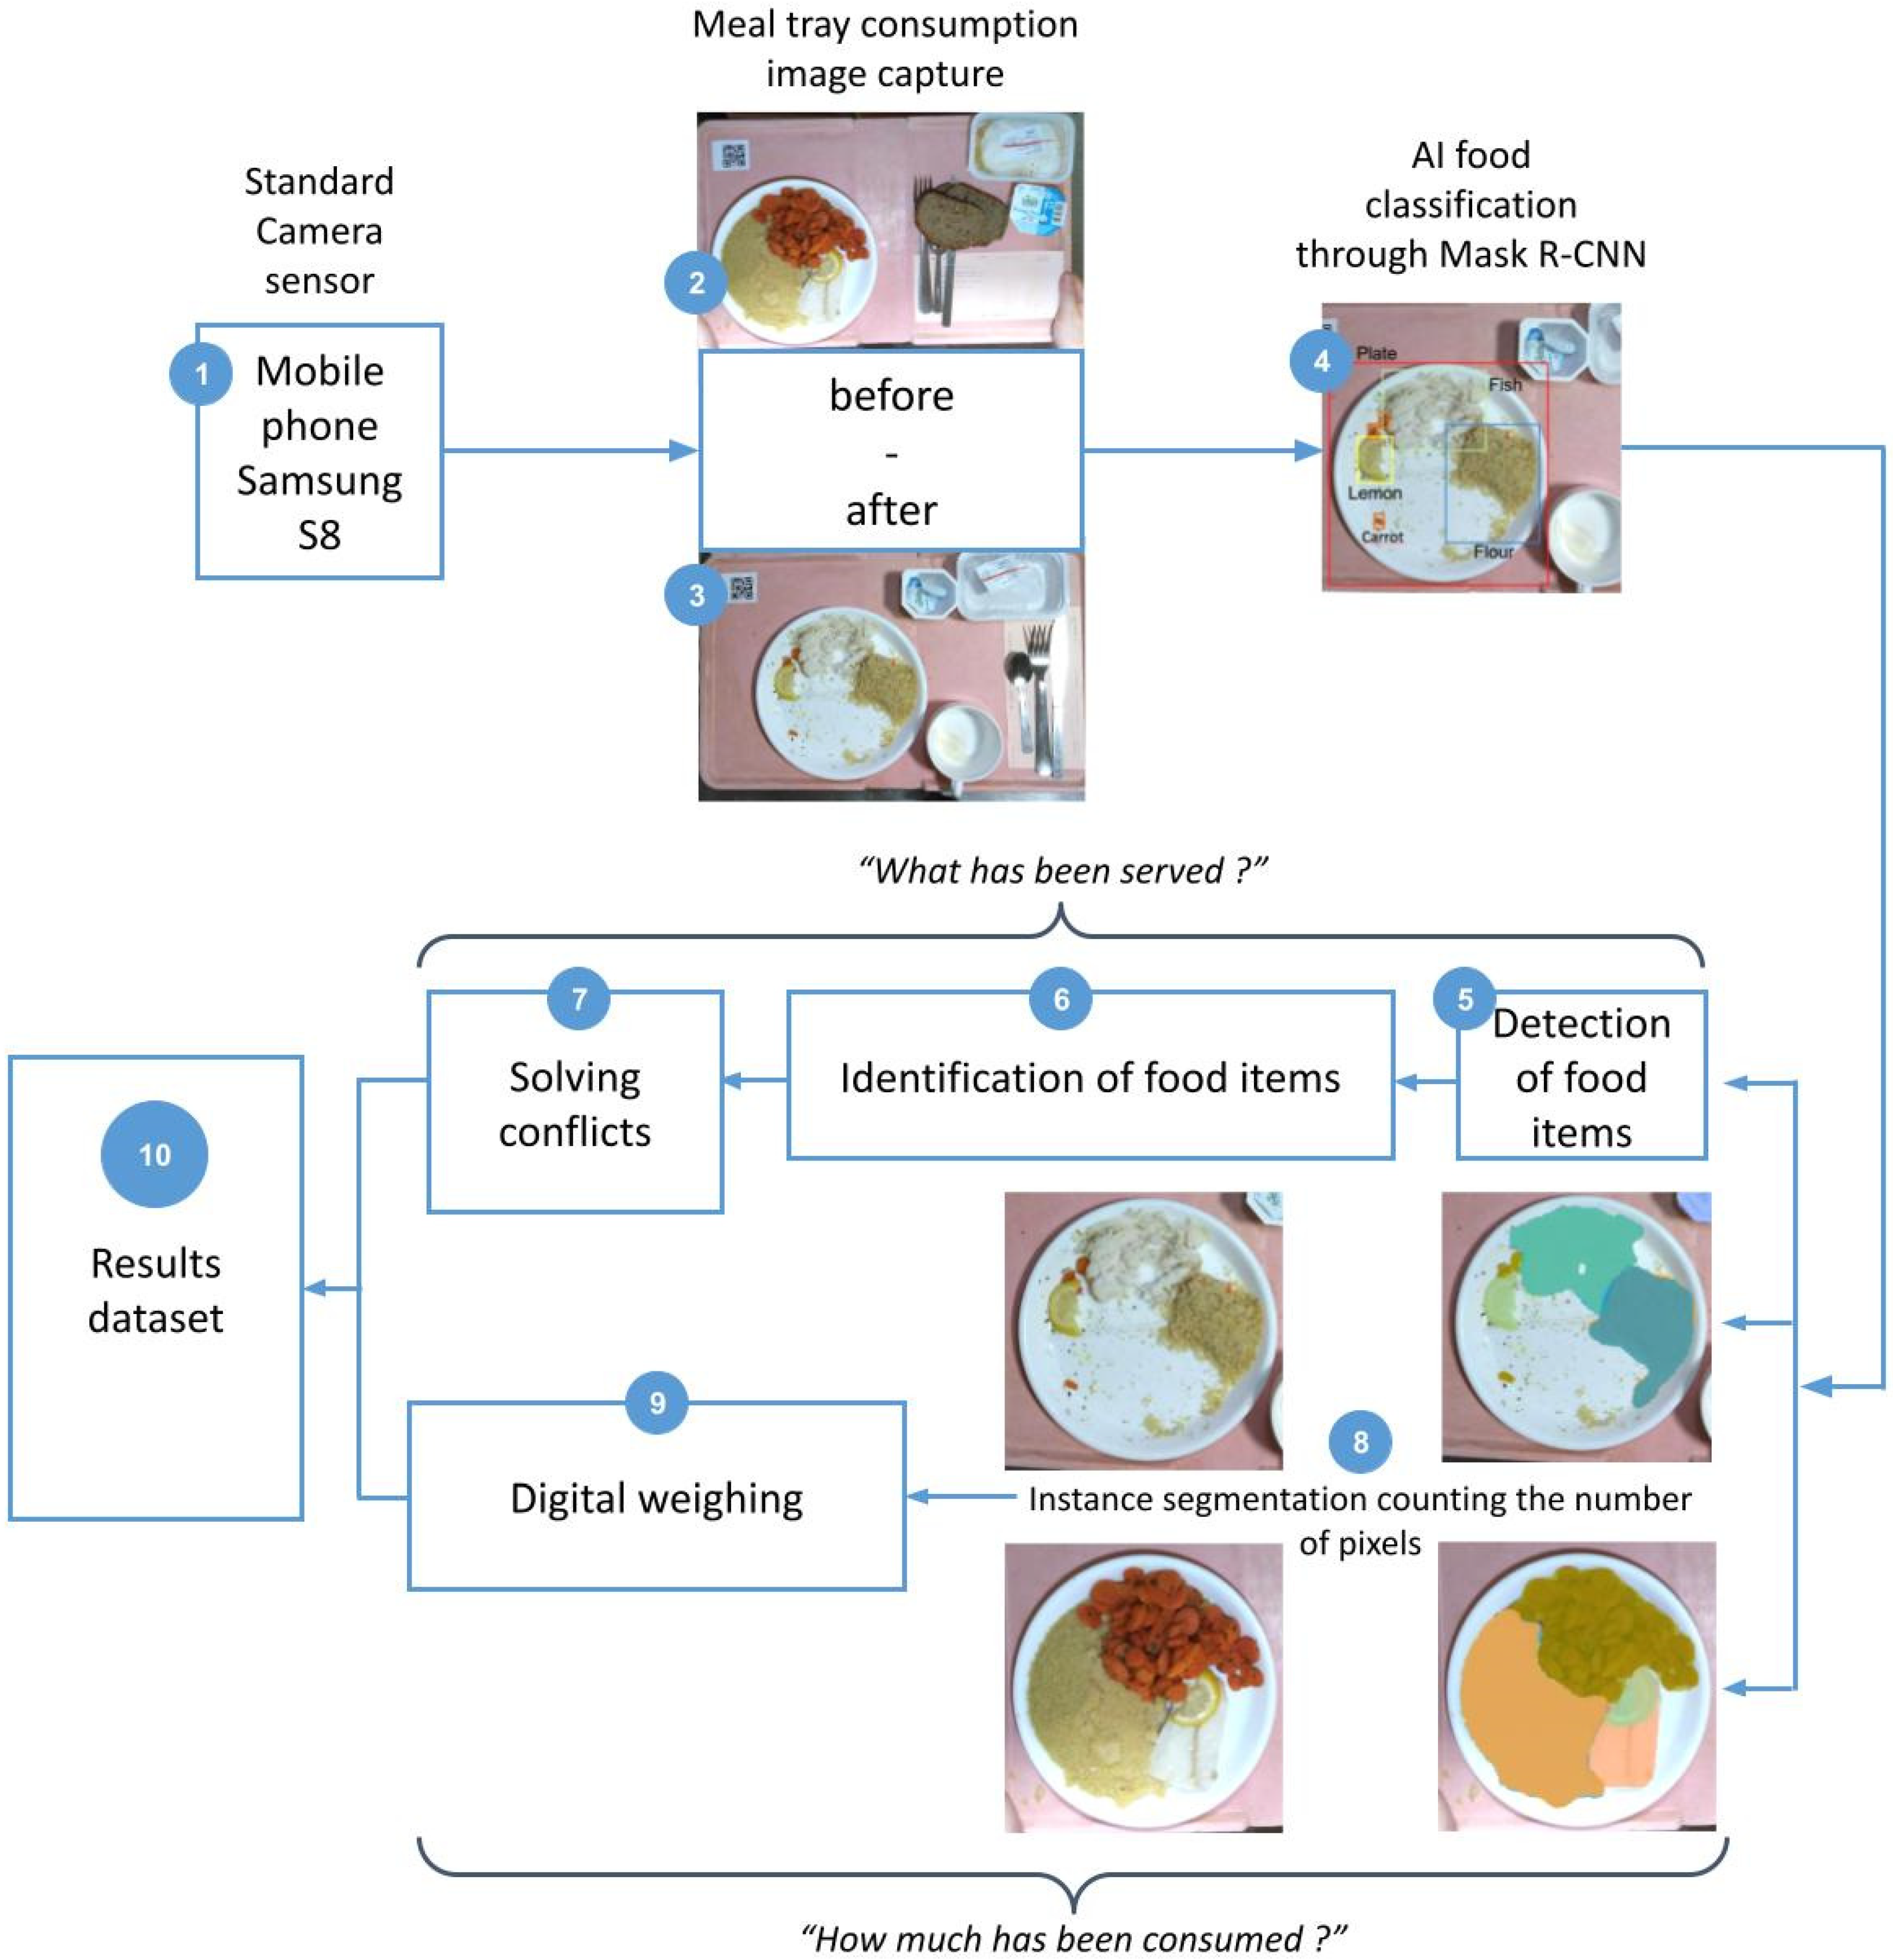
2.1. General Procedure
2.2. Algorithm Used for Deep Learning
2.3. Data Collection and Process or Procedure of Deep Learning View Synthesis Approach
2.4. Statistical Analysis
3. Results
4. Discussion
- -
- First of all, is the AI able to improve its results on the identified less detected food items and dishes? If we look precisely at the identified items that were the least reliable in the field of the study (for example yogurts or purées in containers) it appears that it was difficult to build a volumetric vision from a single sight view at 90°. It produces, with containers that are higher than wide, a drop shadow that leads to the difficult identification of height and volume. This issue could probably be improved by the use of new virtual 3D sensors embedded in recent market smartphones based on, for example, the Time of Flight (ToF) technology proposed by Samsung from the Galaxy S10 version. This technology calculates the speed of photons to access the surface of the target objects in order to construct a virtual depth vision of the objects in three dimensions. Additionally, some of the products might be transferred to glass or plastic containers in order to avoid the identified issues. Lo et al. [43] created an objective dietary assessment system based on a distinct neural network. They used a depth image, the whole 3D point cloud map and iterative closest point algorithms to improve dietary behavior management. They demonstrated that the proposed network architecture and point cloud completion algorithms can implicitly learn the 3D structures of various shapes and restore the occluded part of food items to allow better volume estimation.
- -
- Secondly, is the AI able to improve its results on the fruit with a peel? Inedible leftovers are currently interpreted as the fruit itself in most cases. However, we are confident that the AI can learn to recognize these leftovers from the flesh of the fruit with new learning. In addition, we can code some specific rules to the transcoding overlay to help with the reproducibility of correct identifications.
- -
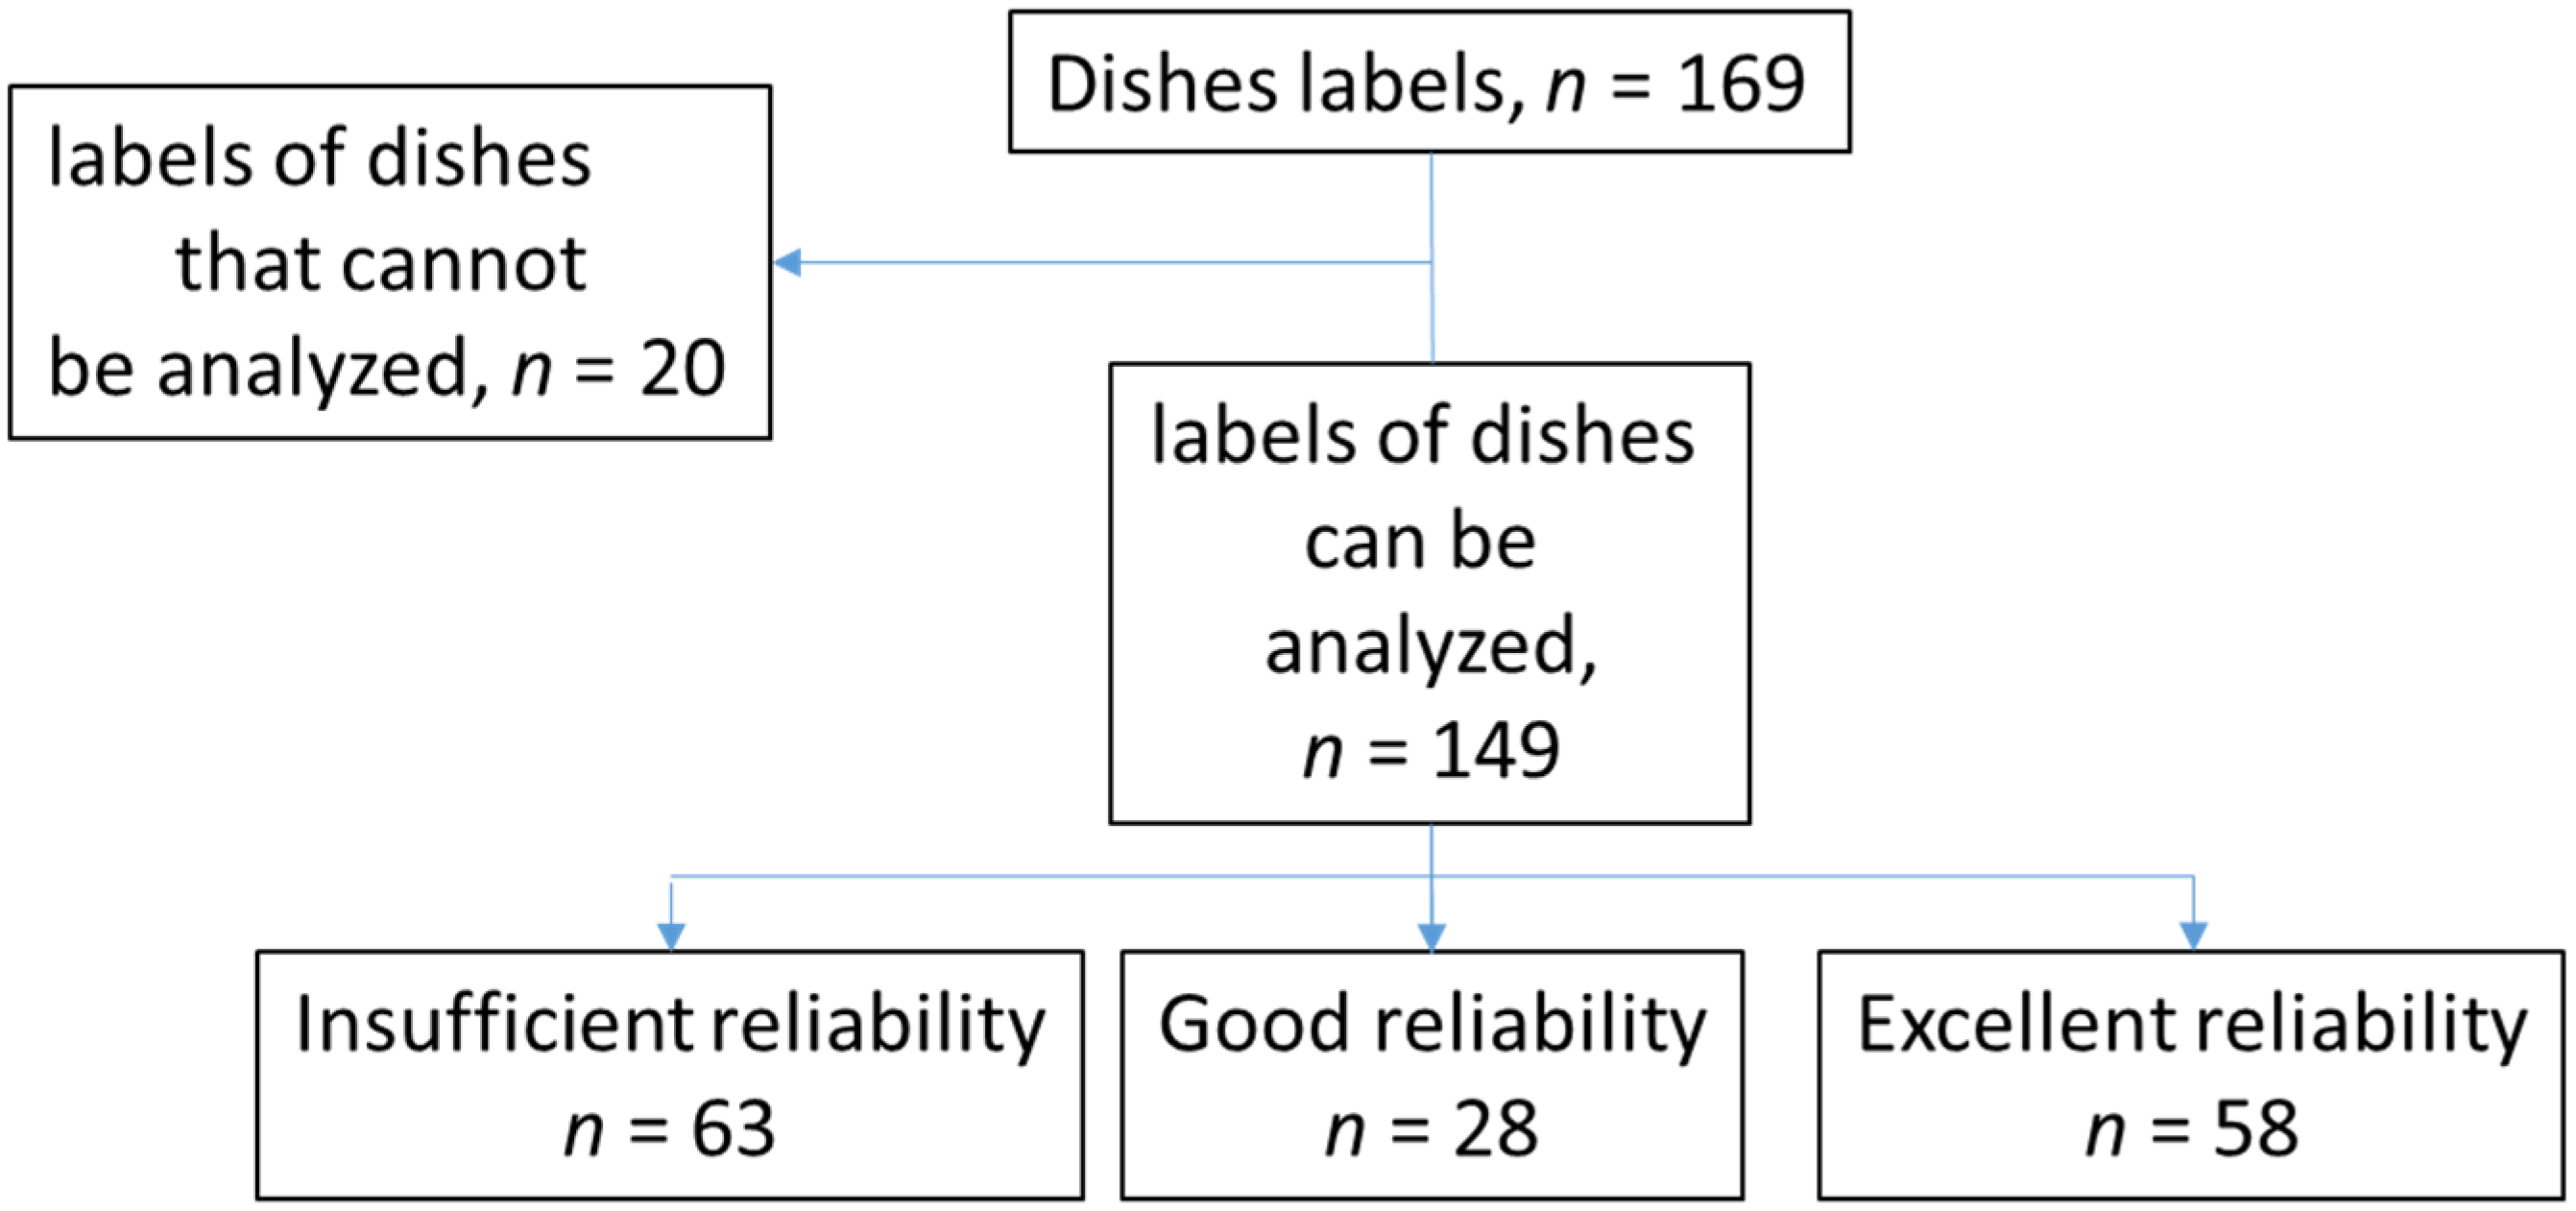
- Finally, is the size of the sample enough, especially when we consider that some food items with more than 200 pictures in records had insufficient reliability? Some dishes, as well as some food containers, are more difficult to recognize and segment than others due to their shape, colors or ingredients, with the mixture on the plate making them more difficult to identify. Like human vision, computer vision has limitations that will never achieve 100% performance. However, just like humans, AI can improve the recognition of certain dishes or situations through a wider learning process and thus increase the number of reference pictures and segmentations. The method validated in this study, in particular, can obtain high-performance results for complex food items, allowing us to extrapolate that significant improvements could be obtained for dishes that are still poorly recognized or poorly reliable. Examples of these complex items include the “Colombo of veal with mangoes”, which had an ICC of 0.897 with 201 photos, the “Nicoise salad”, which had an ICC of 0.899 with 199 photos, and the “gourmet mixed salad”, which had an ICC of 0.949 with 198 photos.
5. Conclusions
6. Future Work
Author Contributions
Funding
Institutional Review Board Statement
Informed Consent Statement
Data Availability Statement
Acknowledgments
Conflicts of Interest
Appendix A

| Labelled Dishes in English | Labelled Dishes in French | ICC (95%CI) | Number of Images | p Values |
|---|---|---|---|---|
| Apple turnover | Chausson aux pommes | 0.993 (0.985–0.998) | 200 | <0.001 |
| breaded fish | poisson pané | 0.991 (0.98–0.997) | 200 | <0.001 |
| parsley potatoes | pommes persillées | 0.985 (0.952–0.998) | 29 | <0.001 |
| Pear | poire | 0.981 (0.94–0.997) | 30 | <0.001 |
| chopped steak | steak haché | 0.977 (0.951–0.993) | 201 | <0.001 |
| Clamart rice | riz Clamart | 0.972 (0.94–0.991) | 199 | <0.001 |
| light cream baba | baba crème legère | 0.968 (0.927–0.992) | 201 | <0.001 |
| saithe fillet with saffron sauce | filet de lieu sauce safran | 0.968 (0.9–0.995) | 29 | <0.001 |
| potatoes | pommes de terre | 0.962 (0.92–0.988) | 197 | <0.001 |
| Ratatouille | ratatouille | 0.959 (0.914–0.987) | 200 | <0.001 |
| green beans salad | haricots verts salade | 0.958 (0.91–0.988) | 200 | <0.001 |
| Flemish apples | pommes flamande | 0.957 (0.908–0.988) | 200 | <0.001 |
| Gruyère Cream | Crème de gruyère | 0.952 (0.882–0.992) | 198 | <0.001 |
| Poultry Nuggets | nuggets de volaille | 0.95 (0.897–0.985) | 200 | <0.001 |
| Eastern pearl salad | salade mélangée gourmande | 0.949 (0.895–0.984) | 198 | <0.001 |
| Brussels sprouts | chou de Bruxelles | 0.945 (0.836–0.991) | 30 | <0.001 |
| Béchamel spinach | épinards béchamel | 0.943 (0.883–0.982) | 200 | <0.001 |
| Kiwi | kiwi | 0.942 (0.826–0.99) | 30 | <0.001 |
| quenelle with aurore sauce | quenelle sauce aurore | 0.94 (0.877–0.982) | 200 | <0.001 |
| veal fricassee | fricassé de veau | 0.939 (0.872–0.983) | 200 | <0.001 |
| couscous semolina | semoule couscous | 0.938 (0.876–0.979) | 225 | <0.001 |
| mortadelle | mortadelle | 0.938 (0.873–0.981) | 197 | <0.001 |
| Apple | pomme | 0.936 (0.803–0.99) | 26 | <0.001 |
| grated carrots | carottes râpées | 0.931 (0.855–0.98) | 201 | <0.001 |
| rustic lentils | lentilles paysanne | 0.926 (0.85–0.977) | 195 | <0.001 |
| rhubarb pie | tarte à la rhubarbe | 0.924 (0.83–0.984) | 201 | <0.001 |
| mashed broccoli | purée brocoli | 0.923 (0.844–0.976) | 201 | <0.001 |
| Hoki fillet sorrel sauce | filet de hoki sauce oseille | 0.921 (0.841–0.975) | 198 | <0.001 |
| troppezian pie | tropezienne | 0.921 (0.675–0.985) | 16 | <0.001 |
| parsley endive | endives persillées | 0.91 (0.821–0.972) | 199 | <0.001 |
| juice spinach | épinards au jus | 0.906 (0.814–0.97) | 201 | <0.001 |
| Nicoise salad | salade nià§oise | 0.899 (0.801–0.968) | 199 | <0.001 |
| Colombo of veal with mangoes | colombo de veau aux mangues | 0.897 (0.785–0.973) | 201 | <0.001 |
| Dijon Lentils | lentilles dijonnaise | 0.892 (0.704–0.982) | 30 | <0.001 |
| meal bread | pain repas | 0.892 (0.69–0.982) | 26 | <0.001 |
| Macedonia Mayonnaise | macédoine mayonnaise | 0.89 (0.773–0.971) | 201 | <0.001 |
| sautéed lamb | sauté d’agneau | 0.875 (0.747–0.967) | 201 | <0.001 |
| sautéed Ardéchoise | poêlée ardéchoise | 0.87 (0.409–0.98) | 13 | 0.0027 |
| parsley youth carrots | carottes jeunes persillées | 0.865 (0.743–0.956) | 200 | <0.001 |
| lemon fish | poisson citron | 0.865 (0.736–0.96) | 200 | <0.001 |
| paella trim | garniture paëlla | 0.864 (0.641–0.976) | 30 | <0.001 |
| Italian dumplings | boulettes à l’italienne | 0.862 (0.739–0.955) | 192 | <0.001 |
| peas with juice | petits pois au jus | 0.861 (0.75–0.948) | 231 | <0.001 |
| salted plain yogurt pie | tarte au fromage blanc salée | 0.86 (0.62–0.982) | 30 | <0.001 |
| pasta salad | salade de pâtes | 0.859 (0.738–0.954) | 365 | <0.001 |
| Parisian pudding pie | tarte au flan parisien | 0.854 (0.699–0.966) | 176 | <0.001 |
| Natural yogurt | Yaourt nature | 0.851 (0.623–0.964) | 29 | <0.001 |
| turkey fricassee | fricassée de dinde | 0.847 (0.603–0.973) | 29 | <0.001 |
| colored pasta | pâtes de couleur | 0.845 (0.711–0.949) | 199 | <0.001 |
| blood sausage with apples | boudin aux pommes | 0.835 (0.565–0.978) | 29 | <0.001 |
| devilled chicken | poulet à la diable | 0.829 (0.686–0.943) | 200 | <0.001 |
| Braised celery heart | coeur de céleri braisé | 0.829 (0.68–0.948) | 201 | <0.001 |
| braised fennel | fenouil braisé | 0.829 (0.68–0.948) | 201 | <0.001 |
| donuts | beignets | 0.825 (0.679–0.941) | 197 | <0.001 |
| parsley carrots duet | duo de carottes persillées | 0.822 (0.666–0.941) | 109 | <0.001 |
| Bavarian apricot | bavarois abricot | 0.82 (0.672–0.939) | 200 | <0.001 |
| beef carbonnade | carbonnade de boeuf | 0.81 (0.522–0.966) | 27 | <0.001 |
| fish with mushroom sauce | poisson sauce champignons | 0.805 (0.527–0.964) | 30 | <0.001 |
| Mayonnaise tuna | thon mayonnaise | 0.798 (0.639–0.931) | 182 | <0.001 |
| fennel with basil | fenouil au basilic | 0.798 (0.638–0.931) | 183 | <0.001 |
| Tagliatelle with vegetables | tagliatelles aux légumes | 0.791 (0.631–0.928) | 201 | <0.001 |
| Sautéed Veal Marengo | sauté de veau marengo | 0.789 (0.625–0.927) | 182 | <0.001 |
| Natural fesh cheese | Fromage frais nature | 0.788 (0.482–0.961) | 27 | <0.001 |
| apricot pie | tarte aux abricots | 0.784 (0.628–0.919) | 229 | <0.001 |
| black forest cake | forêt noire | 0.782 (0.155–0.965) | 13 | 0.012 |
| beef with 2 olives | boeuf aux 2 olives | 0.78 (0.596–0.937) | 201 | <0.001 |
| bread | pain | 0.775 (0.587–0.919) | 74 | <0.001 |
| pasta in shell | coquillettes | 0.761 (0.449–0.955) | 29 | <0.001 |
| flaky pastry with vanilla cream | feuilleté vanille | 0.76 (0.435–0.966) | 29 | <0.001 |
| Small grilled sausages | petites saucisses grillées | 0.758 (0.584–0.915) | 201 | <0.001 |
| chicken breast | escalope de poulet | 0.755 (0.444–0.954) | 30 | <0.001 |
| parsley ham | jambon persillé | 0.755 (0.444–0.954) | 30 | <0.001 |
| beef goulasch | goulasch de boeuf | 0.749 (0.0784–0.96) | 13 | 0.017 |
| parsley chard | bettes persillées | 0.748 (0.562–0.918) | 200 | <0.001 |
| Assorted green vegetables | légumes verts assortis | 0.746 (0.568–0.909) | 199 | <0.001 |
| southern vegetables flan | flan de légumes du soleil | 0.745 (0.534–0.935) | 175 | <0.001 |
| roast chicken | poulet rôti | 0.737 (0.566–0.899) | 225 | <0.001 |
| juice lentils | lentilles au jus | 0.736 (0.554–0.905) | 197 | <0.001 |
| Vegetable bouquette | bouquetière de légumes | 0.733 (0.551–0.904) | 201 | <0.001 |
| leeks Vinaigrette | poireaux vinaigrette | 0.716 (0.539–0.883) | 162 | <0.001 |
| bow-tie pasta | papillons | 0.715 (0.528–0.896) | 198 | <0.001 |
| Dijon chicken cutlet | escalope de poulet dijonnaise | 0.712 (0.492–0.906) | 83 | <0.001 |
| melting apples | pommes fondantes | 0.709 (0.521–0.893) | 201 | <0.001 |
| beef sirloin | faux filet de boeuf | 0.704 (0.515–0.891) | 200 | <0.001 |
| rustic mix | mélange champêtre | 0.701 (0.528–0.874) | 240 | <0.001 |
| Green salad mixed | salade verte mélangée | 0.701 (0.452–0.913) | 60 | <0.001 |
| stuffed tomatoes | tomates farcies | 0.693 (0.492–0.895) | 190 | <0.001 |
| Pudding English Cream | pudding crème anglaise | 0.682 (0.488–0.881) | 201 | <0.001 |
| parsley celery root | céleri rave persillé | 0.676 (0.481–0.878) | 200 | <0.001 |
| sautéed vegetables | poelée de légumes | 0.675 (0.33–0.934) | 30 | <0.001 |
| chocolate meringue | meringue chocolatée | 0.668 (0.471–0.874) | 199 | <0.001 |
| lemon cake | cake citron | 0.664 (0.458–0.882) | 200 | <0.001 |
| penne | penne | 0.663 (0.458–0.881) | 200 | <0.001 |
| Parsley salsifis | salsifis persillés | 0.66 (0.463–0.87) | 198 | <0.001 |
| Coleslaw | salade coleslaw | 0.652 (0.453–0.866) | 199 | <0.001 |
| apricot flaky pie | tarte feuilletée aux abricots | 0.652 (0.444–0.876) | 201 | <0.001 |
| Cider ham | jambon au cidre | 0.632 (0.431–0.856) | 196 | <0.001 |
| fish with cream sauce | poisson sauce crème | 0.601 (0.398–0.839) | 198 | <0.001 |
| parsley wax beans | haricots beurre persillés | 0.594 (0.383–0.848) | 200 | <0.001 |
| Green cabbage Vinaigrette | chou vert vinaigrette | 0.575 (0.38–0.812) | 229 | <0.001 |
| gingerbread chicken | poulet au pain d’épices | 0.571 (0.209–0.905) | 30 | <0.001 |
| chicken with supreme sauce | poulet sauce supreme | 0.562 (0.195–0.925) | 30 | <0.001 |
| natural omelette | omelette nature | 0.535 (0.327–0.802) | 160 | <0.001 |
| parsley cauliflower | chou fleur persillé | 0.534 (0.342–0.796) | 398 | <0.001 |
| orange | orange | 0.48 (0.3–0.734) | 283 | <0.001 |
| Cooked and dry sausage | saucisson cuit et sec | 0.479 (0.282–0.763) | 199 | <0.001 |
| sautéed deer | sauté de biche | 0.479 (0.282–0.763) | 199 | <0.001 |
| Fresh celery remould | céleri frais rémoulade | 0.478 (0.252–0.773) | 94 | <0.001 |
| bolognese trim | garniture bolognaise | 0.457 (0.244–0.756) | 113 | <0.001 |
| couscous vegetables | légumes couscous | 0.438 (0.23–0.774) | 163 | <0.001 |
| Comté slice | Comté portion | 0.433 (0.25–0.714) | 214 | <0.001 |
| papet from Jura | papet jurassien | 0.429 (0.24–0.726) | 201 | <0.001 |
| spaghetti | spaghetti | 0.426 (0.0793–0.852) | 30 | 0.0053 |
| hard boiled egg with Mornay sauce | oeuf dur sce mornay | 0.406 (0.211–0.714) | 139 | <0.001 |
| Cheese Pie | tarte au fromage | 0.386 (0.206–0.691) | 200 | <0.001 |
| Coffee mousse | Mousse café | 0.382 (0.203–0.688) | 200 | <0.001 |
| cauliflower flan | flan de chou fleur | 0.371 (0.19–0.699) | 196 | <0.001 |
| farmer pâté | pâté de campagne | 0.338 (0.176–0.63) | 213 | <0.001 |
| parsley green beans | haricots verts persillés | 0.337 (0.186–0.62) | 398 | <0.001 |
| raspberry pie | tarte aux framboises | 0.323 (0.157–0.655) | 201 | <0.001 |
| Fig pastry with vanilla cream | Figue | 0.318 (0.157–0.628) | 200 | <0.001 |
| Camembert slice | Camembert portion | 0.3 (0.0733–0.761) | 57 | 0.001 |
| cauliflower salad | chou fleur en salade | 0.29 (0.144–0.579) | 229 | <0.001 |
| Clementine | clémentine | 0.289 (0.0352–0.767) | 42 | 0.009 |
| Hedgehog | hérisson | 0.235 (0.102–0.536) | 201 | <0.001 |
| raspberry pastry | framboisier | 0.218 (0.0872–0.52) | 175 | <0.001 |
| cheese omelette | omelette au fromage | 0.213 (0.0785–0.519) | 149 | <0.001 |
| Strasbourg salad | salade strasbourgeoise | 0.198 (0.0515–0.519) | 104 | <0.001 |
| choux pastry with whipped cream | chou chantilly | 0.186 (0.0294–0.708) | 110 | 0.0038 |
| choux pastry with vanilla cream | chou vanille | 0.177 (0.0648–0.459) | 191 | <0.001 |
| Applesauce | Compote de pommes | 0.169 (0.0573–0.497) | 199 | <0.001 |
| salted cake | cake salé | 0.168 (0.061–0.444) | 200 | <0.001 |
| Liège coffee | Café liégeois | 0.131 (0.0401–0.386) | 200 | <0.001 |
| liver pâté | pâté de foie | 0.129 (−0.112–0.671) | 29 | 0.18 |
| Chocolate flan | Flan chocolat | 0.099 (0.0224–0.329) | 199 | 0.0014 |
| Flavored yogurt | Yaourt aromatisé | 0.0929 (0.0221–0.286) | 230 | 0.0013 |
| chocolate eclair | éclair chocolat | 0.0756 (−0.109–0.665) | 30 | 0.24 |
| milk chocolate mousse | Mousse chocolat lait | 0.0637 (0.00361–0.259) | 198 | 0.016 |
| clafoutis with cherries | clafoutis aux cerises + | 0.0527 (−0.17–0.779) | 21 | 0.33 |
| 20% fat plain yogurt | Fromage blanc 20% | 0.0521 (−0.00104–0.267) | 199 | 0.029 |
| Garlic and herbs cheese | fromage Ail et fines herbes | 0.0167 (−0.0173–0.192) | 200 | 0.21 |
| pear pie | tarte aux poires | 0.00198 (−0.0444–0.163) | 129 | 0.42 |
| endive with ham | endives au jambon | 0 | 11 | 1 |
| Hoki fillet Crustacean sauce | filet de hoki sauce crustacés | 0 | 4 | 1 |
| mackerel fillet | filets de maquereaux | 0 | 4 | 1 |
| Semolina Cake | Gâteau de semoule | 0 | 27 | 0.56 |
| Lemon mousse | Mousse citron | 0 | 29 | 0.55 |
Appendix B. Details of the Learning Parameters Using Mask-RCNN Deep Learning Algorithm
References
- Allison, S.; Stanga, Z. Basics in clinical nutrition: Organization and legal aspects of nutritional care. e-SPEN Eur. e-J. Clin. Nutr. Metab. 2009, 4, e14–e16. [Google Scholar] [CrossRef][Green Version]
- Williams, P.; Walton, K. Plate waste in hospitals and strategies for change. e-SPEN Eur. e-J. Clin. Nutr. Metab. 2011, 6, e235–e241. [Google Scholar] [CrossRef]
- Schindler, K.; Pernicka, E.; Laviano, A.; Howard, P.; Schütz, T.; Bauer, P.; Grecu, I.; Jonkers, C.; Kondrup, J.; Ljungqvist, O.; et al. How nutritional risk is assessed and managed in European hospitals: A survey of 21,007 patients findings from the 2007–2008 cross-sectional nutritionDay survey. Clin. Nutr. 2010, 29, 552–559. [Google Scholar] [CrossRef] [PubMed]
- Bjornsdottir, R.; Oskarsdottir, E.S.; Thordardottir, F.R.; Ramel, A.; Thorsdottir, I.; Gunnarsdottir, I. Validation of a plate diagram sheet for estimation of energy and protein intake in hospitalized patients. Clin. Nutr. 2013, 32, 746–751. [Google Scholar] [CrossRef] [PubMed]
- Kawasaki, Y.; Sakai, M.; Nishimura, K.; Fujiwara, K.; Fujisaki, K.; Shimpo, M.; Akamatsu, R. Criterion validity of the visual estimation method for determining patients’ meal intake in a community hospital. Clin. Nutr. 2016, 35, 1543–1549. [Google Scholar] [CrossRef]
- Amano, N.; Nakamura, T. Accuracy of the visual estimation method as a predictor of food intake in Alzheimer’s patients provided with different types of food. Clin. Nutr. ESPEN 2018, 23, 122–128. [Google Scholar] [CrossRef] [PubMed]
- Palmer, M.; Miller, K.; Noble, S. The accuracy of food intake charts completed by nursing staff as part of usual care when no additional training in completing intake tools is provided. Clin. Nutr. 2015, 34, 761–766. [Google Scholar] [CrossRef]
- Gibson, R.S. Principles of Nutritional Assessment; Oxford University Press: Oxford, UK, 2005; ISBN 978-0-19-517169-3. [Google Scholar]
- Lee, R.D.; Nieman, D.C. Nutritional Assessment; Mosby: St. Louis, MO, USA, 1996; ISBN 9780815153191.9. [Google Scholar]
- Martin, C.K.; Correa, J.; Han, H.; Allen, H.R.; Rood, J.C.; Champagne, C.M.; Gunturk, B.; Bray, G.A. Validity of the Remote Food Photography Method (RFPM) for Estimating Energy and Nutrient Intake in Near Real-Time. Obesity 2012, 20, 891–899. [Google Scholar] [CrossRef] [PubMed]
- Martin, C.K.; Han, H.; Coulon, S.M.; Allen, H.R.; Champagne, C.M.; Anton, S.D. A novel method to remotely measure food intake of free-living individuals in real time: The remote food photography method. Br. J. Nutr. 2009, 101, 446–456. [Google Scholar] [CrossRef]
- Martin, C.K.; Nicklas, T.; Gunturk, B.; Correa, J.; Allen, H.R.; Champagne, C. Measuring food intake with digital photography. J. Hum. Nutr. Diet. 2014, 27, 72–81. [Google Scholar] [CrossRef] [PubMed]
- McClung, H.L.; Champagne, C.M.; Allen, H.R.; McGraw, S.M.; Young, A.J.; Montain, S.J.; Crombie, A.P. Digital food photography technology improves efficiency and feasibility of dietary intake assessments in large populations eating ad libitum in collective dining facilities. Appetite 2017, 116, 389–394. [Google Scholar] [CrossRef] [PubMed]
- Hinton, E.C.; Brunstrom, J.M.; Fay, S.H.; Wilkinson, L.L.; Ferriday, D.; Rogers, P.J.; de Wijk, R. Using photography in ‘The Restaurant of the Future’. A useful way to assess portion selection and plate cleaning? Appetite 2013, 63, 31–35. [Google Scholar] [CrossRef]
- Swanson, M. Digital Photography as a Tool to Measure School Cafeteria Consumption. J. Sch. Health 2008, 78, 432–437. [Google Scholar] [CrossRef] [PubMed]
- Pouyet, V.; Cuvelier, G.; Benattar, L.; Giboreau, A. A photographic method to measure food item intake. Validation in geriatric institutions. Appetite 2015, 84, 11–19. [Google Scholar] [CrossRef]
- Sak, J.; Suchodolska, M. Artificial Intelligence in Nutrients Science Research: A Review. Nutrients 2021, 13, 322. [Google Scholar] [CrossRef] [PubMed]
- Lu, Y.; Stathopoulou, T.; Vasiloglou, M.F.; Pinault, L.F.; Kiley, C.; Spanakis, E.K.; Mougiakakou, S. goFOODTM: An Artificial Intelligence System for Dietary Assessment. Sensors 2020, 20, 4283. [Google Scholar] [CrossRef]
- Ronneberger, O.; Fischer, P.; Brox, T. U-Net: Convolutional Networks for Biomedical Image Segmentation; Springer: Cham, Switzerland, 2015; pp. 234–241. [Google Scholar]
- He, K.; Gkioxari, G.; Dollár, P.; Girshick, R. Mask R-CNN. arXiv 2018, arXiv:1703.06870. Available online: https://arxiv.org/pdf/1703.06870.pdf (accessed on 20 December 2021).
- Vuola, A.O.; Akram, S.U.; Kannala, J. Mask-RCNN and U-Net Ensembled for Nuclei Segmentation. In Proceedings of the 2019 IEEE 16th International Symposium on Biomedical Imaging, ISBI 2019, Venice, Italy, 8–11 April 2019; Computer Science: Venice, Italy, 2019; pp. 208–212. Available online: https://arxiv.org/pdf/1901.10170.pdf (accessed on 20 December 2021). [CrossRef]
- Welcome to the Model Garden for TensorFlow; Tensorflow. 2021. Available online: https://github.com/tensorflow/models/ (accessed on 17 December 2021).
- Szegedy, C.; Ioffe, S.; Vanhoucke, V.; Alemi, A.A. Inception-v4, Inception-ResNet and the Impact of Residual Connections on Learning. In Proceedings of the 31st AAAI Conference on Artificial Intelligence, AAAI 2017, San Francisco, CA, USA, 4–9 February 2017; pp. 4278–4284. Available online: http://www.cs.cmu.edu/~jeanoh/16-785/papers/szegedy-aaai2017-inception-v4.pdf (accessed on 20 December 2021).
- Walter, S.D.; Eliasziw, M.; Donner, A. Sample size and optimal designs for reliability studies. Stat. Med. 1998, 17, 101–110. [Google Scholar] [CrossRef]
- Shrout, P.E.; Fleiss, J.L. Intraclass correlations: Uses in assessing rater reliability. Psychol. Bull. 1979, 86, 420–428. [Google Scholar] [CrossRef]
- Koo, T.K.; Li, M.Y. A Guideline of Selecting and Reporting Intraclass Correlation Coefficients for Reliability Research. J. Chiropr. Med. 2016, 15, 155–163. [Google Scholar] [CrossRef]
- Lebreton, J.M.; Senter, J.L. Answers to 20 questions about interrater reliability and interrater agreement. Organ. Res. Methods 2008, 11, 815–852. [Google Scholar] [CrossRef]
- Rollo, M.E.; Ash, S.; Lyons-Wall, P.; Russell, A.W. Evaluation of a Mobile Phone Image-Based Dietary Assessment Method in Adults with Type 2 Diabetes. Nutrients 2015, 7, 4897–4910. [Google Scholar] [CrossRef]
- Sullivan, S.C.; Bopp, M.M.; Roberson, P.K.; Lensing, S.; Sullivan, D.H. Evaluation of an Innovative Method for Calculating Energy Intake of Hospitalized Patients. Nutrients 2016, 8, 557. [Google Scholar] [CrossRef]
- Monacelli, F.; Sartini, M.; Bassoli, V.; Becchetti, D.; Biagini, A.L.; Nencioni, A.; Cea, M.; Borghi, R.; Torre, F.; Odetti, P. Validation of the photography method for nutritional intake assessment in hospitalized elderly subjects. J. Nutr. Health Aging 2017, 21, 614–621. [Google Scholar] [CrossRef]
- Winzer, E.; Luger, M.; Schindler, K. Using digital photography in a clinical setting: A valid, accurate, and applicable method to assess food intake. Eur. J. Clin. Nutr. 2018, 72, 879–887. [Google Scholar] [CrossRef]
- Jia, W.; Chen, H.-C.; Yue, Y.; Li, Z.; Fernstrom, J.; Bai, Y.; Li, C.; Sun, M. Accuracy of food portion size estimation from digital pictures acquired by a chest-worn camera. Public Health Nutr. 2014, 17, 1671–1681. [Google Scholar] [CrossRef]
- Williamson, D.A.; Allen, H.R.; Martin, P.D.; Alfonso, A.J.; Gerald, B.; Hunt, A. Comparison of digital photography to weighed and visual estimation of portion sizes. J. Am. Diet. Assoc. 2003, 103, 1139–1145. [Google Scholar] [CrossRef]
- Casperson, S.L.; Sieling, J.; Moon, J.; Johnson, L.; Roemmich, J.N.; Whigham, L.; Yoder, A.B.; Hingle, M.; Bruening, M. A Mobile Phone Food Record App to Digitally Capture Dietary Intake for Adolescents in a Free-Living Environment: Usability Study. JMIR mHealth uHealth 2015, 3, e30. [Google Scholar] [CrossRef] [PubMed]
- Naaman, R.; Parrett, A.; Bashawri, D.; Campo, I.; Fleming, K.; Nichols, B.; Burleigh, E.; Murtagh, J.; Reid, J.; Gerasimidis, K. Assessment of Dietary Intake Using Food Photography and Video Recording in Free-Living Young Adults: A Comparative Study. J. Acad. Nutr. Diet. 2021, 121, 749–761.e1. [Google Scholar] [CrossRef]
- Boushey, C.J.; Spoden, M.; Zhu, F.; Delp, E.; Kerr, D.A. New mobile methods for dietary assessment: Review of image-assisted and image-based dietary assessment methods. In Proceedings of the Nutrition Society; Cambridge University Press: Cambridge, UK, 2017; Volume 76, pp. 283–294. [Google Scholar] [CrossRef]
- Saeki, K.; Otaki, N.; Kitagawa, M.; Tone, N.; Takachi, R.; Ishizuka, R.; Kurumatani, N.; Obayashi, K. Development and validation of nutrient estimates based on a food-photographic record in Japan. Nutr. J. 2020, 19, 1–13. [Google Scholar] [CrossRef] [PubMed]
- Ji, Y.; Plourde, H.; Bouzo, V.; Kilgour, R.D.; Cohen, T.R. Validity and Usability of a Smartphone Image-Based Dietary Assessment App Compared to 3-Day Food Diaries in Assessing Dietary Intake Among Canadian Adults: Randomized Controlled Trial. JMIR mHealth uHealth 2020, 8, e16953. [Google Scholar] [CrossRef] [PubMed]
- Fang, S.; Shao, Z.; Kerr, D.A.; Boushey, C.J.; Zhu, F. An End-to-End Image-Based Automatic Food Energy Estimation Technique Based on Learned Energy Distribution Images: Protocol and Methodology. Nutrients 2019, 11, 877. [Google Scholar] [CrossRef] [PubMed]
- Jia, W.; Li, Y.; Qu, R.; Baranowski, T.; E Burke, L.; Zhang, H.; Bai, Y.; Mancino, J.M.; Xu, G.; Mao, Z.-H.; et al. Automatic food detection in egocentric images using artificial intelligence technology. Public Health Nutr. 2018, 22, 1–12. [Google Scholar] [CrossRef] [PubMed]
- Lu, Y.; Stathopoulou, T.; Vasiloglou, M.F.; Christodoulidis, S.; Blum, B.; Walser, T.; Meier, V.; Stanga, Z.; Mougiakakou, S. An artificial intelligence-based system for nutrient intake assessment of hospitalised patients. Annu. Int. Conf. IEEE Eng. Med. Biol. Soc. 2019, 5696–5699. [Google Scholar] [CrossRef]
- Sudo, K.; Murasaki, K.; Kinebuchi, T.; Kimura, S.; Waki, K. Machine Learning–Based Screening of Healthy Meals from Image Analysis: System Development and Pilot Study. JMIR Form. Res. 2020, 4, e18507. [Google Scholar] [CrossRef] [PubMed]
- Lo, F.P.-W.; Sun, Y.; Qiu, J.; Lo, B. Food Volume Estimation Based on Deep Learning View Synthesis from a Single Depth Map. Nutrients 2018, 10, 2005. [Google Scholar] [CrossRef]


Publisher’s Note: MDPI stays neutral with regard to jurisdictional claims in published maps and institutional affiliations. |
© 2022 by the authors. Licensee MDPI, Basel, Switzerland. This article is an open access article distributed under the terms and conditions of the Creative Commons Attribution (CC BY) license (https://creativecommons.org/licenses/by/4.0/).
Share and Cite
Van Wymelbeke-Delannoy, V.; Juhel, C.; Bole, H.; Sow, A.-K.; Guyot, C.; Belbaghdadi, F.; Brousse, O.; Paindavoine, M. A Cross-Sectional Reproducibility Study of a Standard Camera Sensor Using Artificial Intelligence to Assess Food Items: The FoodIntech Project. Nutrients 2022, 14, 221. https://doi.org/10.3390/nu14010221
Van Wymelbeke-Delannoy V, Juhel C, Bole H, Sow A-K, Guyot C, Belbaghdadi F, Brousse O, Paindavoine M. A Cross-Sectional Reproducibility Study of a Standard Camera Sensor Using Artificial Intelligence to Assess Food Items: The FoodIntech Project. Nutrients. 2022; 14(1):221. https://doi.org/10.3390/nu14010221
Chicago/Turabian StyleVan Wymelbeke-Delannoy, Virginie, Charles Juhel, Hugo Bole, Amadou-Khalilou Sow, Charline Guyot, Farah Belbaghdadi, Olivier Brousse, and Michel Paindavoine. 2022. "A Cross-Sectional Reproducibility Study of a Standard Camera Sensor Using Artificial Intelligence to Assess Food Items: The FoodIntech Project" Nutrients 14, no. 1: 221. https://doi.org/10.3390/nu14010221
APA StyleVan Wymelbeke-Delannoy, V., Juhel, C., Bole, H., Sow, A.-K., Guyot, C., Belbaghdadi, F., Brousse, O., & Paindavoine, M. (2022). A Cross-Sectional Reproducibility Study of a Standard Camera Sensor Using Artificial Intelligence to Assess Food Items: The FoodIntech Project. Nutrients, 14(1), 221. https://doi.org/10.3390/nu14010221