Article

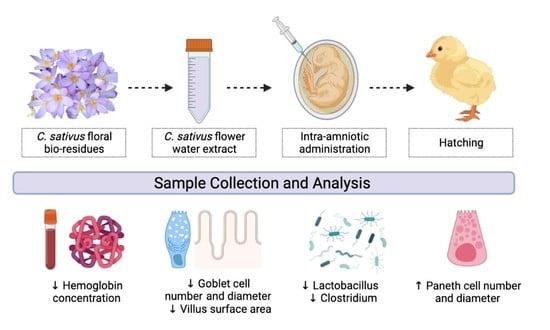
Saffron (Crocus sativus L.) Flower Water Extract Disrupts the Cecal Microbiome, Brush Border Membrane Functionality, and Morphology In Vivo (Gallus gallus)

Department of Food Science, Cornell University, Ithaca, NY 14850, USA
*
Author to whom correspondence should be addressed.
Nutrients 2022, 14(1), 220; https://doi.org/10.3390/nu14010220
Submission received: 14 December 2021 / Revised: 28 December 2021 / Accepted: 1 January 2022 / Published: 5 January 2022

Abstract

:
Saffron (Crocus sativus L.) is known as the most expensive spice. C. sativus dried red stigmas, called threads, are used for culinary, cosmetic, and medicinal purposes. The rest of the flower is often discarded, but is now being used in teas, as coloring agents, and fodder. Previous studies have attributed antioxidant, anti-inflammatory, hepatoprotective, neuroprotective, anti-depressant, and anticancer properties to C. sativus floral bio-residues. The aim of this study is to assess C. sativus flower water extract (CFWE) for its effects on hemoglobin, brush boarder membrane (BBM) functionality, morphology, intestinal gene expression, and cecal microbiome in vivo (Gallus gallus), a clinically validated model. For this, Gallus gallus eggs were divided into six treatment groups (non-injected, 18 Ω H2O, 1% CFWE, 2% CFWE, 5% CFWE, and 10% CFWE) with n~10 for each group. On day 17 of incubation, 1 mL of the extracts/control were administered in the amnion of the eggs. The amniotic fluid along with the administered extracts are orally consumed by the developing embryo over the course of the next few days. On day 21, the hatchlings were euthanized, the blood, duodenum, and cecum were harvested for assessment. The results showed a significant dose-dependent decrease in hemoglobin concentration, villus surface area, goblet cell number, and diameter. Furthermore, we observed a significant increase in Paneth cell number and Mucin 2 (MUC2) gene expression proportional to the increase in CFWE concentration. Additionally, the cecum microbiome analysis revealed C. sativus flower water extract altered the bacterial populations. There was a significant dose-dependent reduction in Lactobacillus and Clostridium sp., suggesting an antibacterial effect of the extract on the gut in the given model. These results suggest that the dietary consumption of C. sativus flower may have negative effects on BBM functionality, morphology, mineral absorption, microbial populations, and iron status.

Graphical Abstract

1. Introduction

Crocus sativus L. is a stemless perennial plant that belongs to the Iridaceae family. It is commonly cultivated in Iran, Spain, Morocco, Turkey, India, Greece, and Italy for its stigma [1,2]. The flowers comprise of six purple tepals (petal and sepals are fused), a white style surrounded by three yellow stamens and a red stigma divided into three threads [3,4]. Saffron is the dried stigma of the plant which is hand-picked and the rest of the flower (~95% by weight) is either thrown away, used as fodder, as food additive, or in beverages. The floral bio-residues have limited literature describing their health benefits.
Saffron (stigma), although, is reported to have numerous pharmacological benefits such as antioxidant [5], anti-inflammatory [6], hepatoprotective [7], neuroprotective [8], antidepressant [9], and anti-tumorigenic [8] activity among others. Most of these therapeutic effects are accredited to three major bioactive compounds: crocin (responsible for saffron’s color), picrocrocin (its bitter taste), and safranal (its aroma) [10]. These compounds can be found in the tepals as well [1,4,11,12,13]. Additionally, the floral bio-residues have numerous flavonoids including kaempferol (84% of total flavonols), quercetin, delphinidin, petunidin, and malvidin [4]. Anthocyanins are water-soluble plant pigments that have been reported to provide beneficial effects on intestinal health, specifically, improving intestinal microbiome, goblet cell number, villi surface area, and short chain fatty acid production [14]. Kaempferol, on its own, has been shown to improve intestinal barrier function, improve goblet cell function, and reduce the expression of inflammatory markers such as interleukin-8 (IL-8) [15,16]. As for the nutritional composition, floral bio-residues are found to have moisture (~10 g), ash (~8.5 g), proteins (~9.5 g), lipids (~2.8), and carbohydrates, including fiber, (~60 g per 100 g dry weight) providing approximately 300 kcal per 100 g dry weight [3]. The presence of saponins, terpenoids, tannins, and steroids have also been reported [17,18].
C. sativus floral bio-residues and its isolated bioactive compounds have been investigated previously via in-vitro, in-vivo, and human studies. In general, some evidence supports its effect as an antioxidant [11,19,20,21,22], anti-inflammatory agent [2,11,23,24,25], lipid lowering potential [22,26], hepatoprotective [20], and antidepressant activity [27,28,29]. With this study, we aim to investigate the effect of C. sativus flower water extract (CFWE) on intestinal brush border membrane functionality, morphology, iron status, intestinal gene expression, and cecal microbiome. To the best of our knowledge, CFWE has previously not been investigated on these parameters.
Natural products such as anthocyanins are not readily absorbed but are transformed by the gut microbiome [30]. Therefore, the consumption of these phytocompounds have the potential to alter the diversity and composition of the commensal bacterial species [31]. Recent literature has suggested the link between the microbiome and disease conditions—such as inflammatory bowel disease, type 2 diabetes, cardiovascular diseases, cancer, and obesity [32]. So far, the effect of C. sativus floral bio-residues have not been evaluated on the microbiome. With this study, we aim to get a cursory glance at the changes associated with the dietary consumption of CFWE at the genus level through 16s rDNA analysis.
For this study, we utilized Gallus gallus, in-vivo administration, a well-established and widely accepted model for the assessment of bioactive compounds [33,34,35,36,37,38,39,40,41,42,43,44]. It has been previously demonstrated that the Gallus gallus model is an effective tool in evaluating mineral deficiencies [33,37,45,46]. The amino acid sequence of transporter genes (Fe and Zn) is 85% homologous to humans. Furthermore, the cecal gut microbiome of Gallus gallus at the phylum level is very similar to that observed in the human gut. Thus, the changes observed here can potentially be used to predict the changes that would be expected clinically. Here, we administer 1 mL of water-soluble extracts of different concentrations in the amnion of the Gallus gallus egg. The embryo orally consumes the amniotic fluid before hatch. The physiological changes observed in the hatchlings give an indication of the effects CFWE may have. As most flavonoids (including anthocyanins) and crocin in C. sativus floral bio-residues are water soluble, we hypothesize based on existing literature that CFWE would have an overall beneficial effect on the parameters assessed on gut health.

2. Materials and Methods

2.1. Extract Preparation

Saffron flower bio-residues—i.e., C. sativus flower without its stigma—acquired from a New York State Farmer were utilized in this study. The extraction was performed as previously described [40,45]. Briefly, fresh flowers were frozen at −80 °C and powdered. The powder was dissolved in 50 g/L distilled water for 60 min at 60 °C. The particulate matter was removed by centrifugation at 3000× g for 25 min at 4 °C. The supernatant remaining was dialyzed exhaustively for 48 h against distilled water. The dialysate (MWCO 12–14 kDa) collected was lyophilized which resulted in a light purple powder.

2.2. Analysis of Polyphenols

2.2.1. Polyphenol Extraction

A solution of methanol: water (50:50 v/v) was prepared and 5 mL of this was added to 500 mg of saffron flower water extract (prepared in 2.1). The extract was vortexed for 1 min then sonicated at room temperature for 20 min. The extracts were vortexed again and placed at room temperature for 60 min on a compact digital Rocker (Labnet International, Inc., Edison, NJ, USA). After which they were centrifuged at 4000× g for 15 min. Supernatants were filtered using a 0.2 µm Teflon™ syringe filter. The extracts were stored until analysis at −20 °C.

2.2.2. Liquid Chromatography-Mass Spectroscopy (LC-MS)

The standards and extracts were analyzed as described earlier [39]. In short, UHPLC (Thermo Vanquish UHPLC C18 System, Waltham, MA, USA) coupled to an Advion expressionL® compact mass spectrometer (CMS; Advion Inc., Ithaca, NY, USA). Compound Discoverer™ software 3.1 (Thermo scientific, Waltham, MA, USA) was used to control the LC and CMS instrumentation and data acquisition. The m/z ratio and LC retention time was used to identify and confirm individual polyphenols against authentic standards. Polyphenol standard curves for flavonoids were derived from integrated areas under UV absorption peaks with five replicates.

2.3. Animals and Study Design

About 60 fertile Cornish-cross broiler eggs were purchased from a commercial hatchery (Moyer’s chicks, Quakertown, PA, USA). The eggs were incubated until hatch at the Cornell University Animal Science poultry farm. The protocol carrier out was approved by Cornell University Institutional Animal Care and Use committee. The protocols were carried out in accordance with the relevant regulations and guidelines. For the in vivo administration, 60 viable (fertile) eggs were weighed and randomly distributed into 6 groups (n = 10). On day 17 of incubation, candling was used to confirm fertilization and determine the injection spot. The spot alone was then sanitized followed by a 1 mL injected of the prepared water extracts and control (H2O). The six treatments were (1) no injection, (2) 18 Ω H2O, (3) 1% CFWE, (4) 2% CFWE, (5) 5% CFWE, and (6) 10% CFWE. After the intra-amniotic administrated, the injection spot was sealed with cellophane tape and the eggs were incubated treatment-wise until hatch (day 21) [33,42]. On the day of the hatch, the birds were euthanized in a CO2 chamber and the sample collection was carried out. The blood, duodenum, and cecum were removed and immediately placed in liquid nitrogen (except blood which was placed on ice) temporarily. The samples were then transferred to a −80 °C incubator until analysis.

2.4. Blood Analysis and Hb Measurements

The blood was collected from the heart and put in micro-hematocrit heparinized capillary tubes (Fisher Scientific, Waltham, MA, USA). The blood was shaken in the heparinized tubed to prevent coagulation. A spectrophotometer (QuantiChrom™ Hemoglobin Assay DIHB-250, BioAssay Systems, Hayward, CA, USA) was used to determine the blood Hb concentration on the same day of the hatch. The kit manufacturer’s instructions were followed.

2.5. Gene Expression Analysis

2.5.1. Isolation of Total RNA from the Duodenum

About 30 mg of duodenum (n = 5), that was cut near the duodenal loop, was weighed and the total RNA was extracted according to the manufacturer’s protocol using the Qiagen RNeasy Mini Kit (RNeasy Mini Kit, Qiagen Inc., Valencia, CA, USA). All steps were carried out in an RNase free environment [45,46]. In short, the duodenum tissues were homogenized in buffer RLT®, containing β-mercaptoethanol. The homogenate was centrifuged at 8000× g for 3 min and the supernatant was transferred to another tube containing 70% ethanol. Each sample (700 μL) was put in a RNeasy mini column, centrifuged at 8000× g for 15 s, the flow through was discarded. Then, the RNeasy columns were transferred to new 2 mL collections tubes. The RPE® buffer (500 μL) from the kit was pipetted into the RNeasy column and centrifuged at 8000× g for 2 min. The RNA eluted in 50 μL of RNase free water and quantified at absorbance A 260/280. RNA integrity of the 18S ribosomal region was verified by 1.5% agarose gel electrophoresis stained with ethidium bromide. Any DNA contamination was removed using TURBO DNase treatment and removal kit from AMBION (Austin, TX, USA).

2.5.2. Real Time Polymerase Chain Reaction (RT-PCR)

From the extracted RNA, cDNA was created by a 20 μL reverse transcriptase (RT) reaction using the BioRad C1000 touch thermocycler using the Improm-II Reverse Transcriptase Kit (Catalog #A1250; Promega, Madison, WI, USA). Firstly, 1 μg of total RNA template, 2 mM of oligo-dT primers, and 10 μM of random hexamer primers were added to the given vial. The optimum annealing temperature was 94 °C for 5 min, copying was 60 min at 42 °C followed by heat inactivation at 70 °C for 15 min. The cDNA obtained was analyzed by Nanodrop (Thermo Fisher Scientific, Waltham, MA, USA) or stored at −80 °C until analysis. The concentration of cDNA was determined by measuring the absorbance at 260 nm and 280 nm with an extinction coefficient of 33 (for single stranded DNA). The extent of genomic DNA contamination was estimated by a RT-PCR assay (real-time) for the reference genes samples.

2.5.3. Primer Design

The primers were designed using Real-Time Primer Design Tool software (IDT DNA, Coralvilla, IA, USA) based on 11 gene sequences from the Genebank database. The primer sequences (17-25-mer), amplicon length (restricted to 90–150 bp) and gene ID can be found summarized in Table 1. The GC content was between 41% and 55%. Primer specificity was verified by BLAST searches against the genomic National Center for Biotechnology Information (NCBI) database. The Gallus gallus primer 18S rRNA served as a reference gene.

2.5.4. RT-PCR Design

Performed as described [41]. cDNA (2 μL) was pipetted into a 96-well plate with 2× BioRad SSO Advanced Universal SYBR Green Supermix (8 μL) (Cat #1725274, Hercules, CA, USA); followed by buffer, dNTPs, Taq polymerase and dye. Both forward and reverse primers (as shown in Table 1), cDNA (or water as control) were added to each PCR reaction. Each run had duplicates of 7 standard curve points. A ‘no-template control’ was included with nuclear-free water to detect and exclude any possible DNA contamination. DNA amplification was carried out under the following conditions: initial denaturing at 95 °C for 30 s, 40 cycles of denaturing at 95 °C for 15 s, various annealing temperatures according to Integrated DNA Technologies (IDT) for 30 s and elongating at 60 °C for 30 s in Bio-Rad CFX96 Touch (Hercules, CA, USA). The gene expression data was obtained as the lowest cyclic product (Cp) values based on the automated method of ‘second derivative maximum’. The results were quantified against the standard curve which was diluted at 1:10 and the reaction for each gene were run in duplicates. A graph of Cq vs. log (10) concentrations was produced by the software and the efficiencies were calculated as 10 (1/slope). The specificity of the amplified real-time RT-PCR products was verified by melting curve analysis (60–95 °C) after 40 cycles, resulting in several different specific products, each with a specific melting temperature. Real-time RT-PCR efficiency (E) values for the 11 genes were as follows: DMT-1, 0.998; DcytB, 1.046; Ferroportin, 1.109; ZnT1, 0.954; ZIP1, 0.981; NK-βκ, 1.113; TNF-α, 0.913; IL8, 0.998; SGLT1, 0.994; SI, 1.032; MUC2, 1.022.

2.6. Morphological Examination

The intestinal morphology examination was conducted as previously described [37]. The duodenum samples (n = 5) collected (Section 2.4) were fixed in fresh 4% (v/v) formaldehyde solution (stabilized with phosphate buffer), dehydrated, cleaned, and embedded in paraffin. Four sections (5 µm) of each sample were taken and placed on a glass slide. Paraffin was dissolved using xylene, then rehydrated using a series of graded alcohol. This was then stained with Alcian blue/periodic acid-Schiff (PAS) and examined under a light microscope (BX3M series, Olympus Waltham, MA, USA) using the CellSens Standard Software. Paneth cells were stained light purple. The number and diameter of Paneth cells were recorded. Additionally, the villus height, villus width, goblet cell type, diameter and number (in epithelial villi and within circular crypts), and crypt depth were determined for each section. Ten villi per section (4 sections per biological repeat, 5 repeats per treatment group) were measured for statistical analysis.

2.7. Cecal Sample Collection and DNA Purification

The cecum samples (n = 5) were weighed (0.2 ± 0.02 g) and placed in a 15 mL tube with 9 mL PBS (pH 7.4) under aseptic conditions. Plastic beads (4 mm in diameter) are added to the tube and vortexed for 3 min. The tube was then centrifuged for 5 min at 1000× g. The supernatant was collected and centrifuged again at 4000 g for 10 min. After which, the buffer is discarded and the pallet is washed twice with 1 mL PBS. The samples were stored at −20 °C until DNA purification. For the purification, the pellet is treated with 50 mM EDTA (pH 8) and pre-prepared lysozyme (Sigma Aldrich CO., St. Louis, MO, USA) (10 mg/mL) at 37 °C. The DNA isolation was carried out using Wizard Genomic DNA purification kit following the manufacturer’s protocol (Promega Corp., Madison, WI, USA).

2.8. Primers Design and PCR Amplification of Bacterial 16S rDNA Analysis

Primers for genus Clostridium, Bifidobacterium, Lactobacillus, and species E. coli were designed as per previously published literature [47,48,49]. The primers used in this study are detailed in another study [50]. A universal primer was used to identify all known bacteria and total microflora populations. For the PCR amplification, 5 µL of the purified DNA (from 2.9) was added to 45 µL PCR premixture containing nuclease-free water, dNTPs, PCR buffer, Taq polymerase (Go-Taq; Promega Corporation, Madison, WI, USA), and 10 µg/mL of the primer (repeated for each primer). PCR conditions were set as previously optimized [50]. The PCR products were separated using gel electrophoresis on a 1.5% agarose gel. The gel was stained with light-sensitive ethidium bromide and quantified using Gel-Pro analyzer version 3.0 (Media Cybernetics LP, Rockville, MD, USA). To evaluate the relative portion of each bacterial populations, the products were measured in proportion to the universal primer.

2.9. Statistical Analysis

The data in this paper are depicted as their mean values and standard deviation. Experimental treatments and controls for intra-amniotic administration was assigned randomly after ensuring even weight distribution to all groups. ANOVA was used to analyze the results and p-values (p < 0.05) for significance were determined using post-hoc Duncan test. Software SPSS version 27 (IBM, Armonk, NY, USA) was used for statistical analysis.

3. Results

3.1. Polyphenol Profile

The relative percentage of the four polyphenols detected in C. sativus flower water extract (CFWE) is shown in Table 2 below. There is a high relative abundance of Kaempferol 3-O-sophoroside followed by Kaempferol-3-O-glucoside, Quercetin-3-O-gluside, and Malvidin 3,5-di-O-glucoside in the water extract.

3.2. Body Weight and Blood Hemoglobin Concentration

A steady decline in hemoglobin concentration was observed with increase in CFWE concentration with a statistically significant difference between 10% CFWE and the other groups. Although, no significant changes were observed in body weight of the hatchlings, as indicated in Table 3.

3.3. Duodenal Gene Expression

Figure 1 indicates the gene expression of proteins related to Zn and Fe metabolism, BBM functionality and immune/inflammatory response.

3.3.1. Fe-Related Protein Gene Expression

Duodenal cytochrome B (Dcytb), ferric reductase enzyme, that reduces Fe3+ to Fe2+ was upregulated at 2% CFWE (p < 0.05). Divalent metal transporter 1 (DMT1) is responsible for the transport of ferrous iron and other divalent mental ions out of the endosomal compartment and/or across the plasma membrane. DMT1 gene expression was significantly downregulated due to 10% CFWE administration. Whereas the gene expression of ferroportin, the protein that exports iron from the cells to the blood was upregulated at 10% CFWE and downregulated at 2% CFWE (p < 0.05) [51].

3.3.2. Zn-Related Protein Gene Expression

The gene expression of zinc transporter gene ZIP1 (transports zinc into the cytosol) was not different between the groups. ZnT7 (transports zinc out of the cytosol) expression was reduced (p < 0.05) with the intra-amniotic administration of 2% CFWE.

3.3.3. Inflammatory Cytokine Gene Expression

Interleukin 8 (IL8), nuclear factor (NF-κβ), and tumor necrosis factor (TNF-α) are pro-inflammatory genes. NF-κβ and TNF-α expression was downregulated (p < 0.05) in case of 2% CFWE treatment. IL8 expression was significantly downregulated with 10% CFWE administration versus controls.

3.3.4. BBM Functionality Related Protein Gene Expression

Mucin 2 (MUC2) are genes that code for mucin proteins that lubricate and protect the intestinal epithelial surface [51]. MUC2 gene expression steadily increased with increase in CFWE concentration (p < 0.05). Whereas sucrose isomaltase (SI) and SGLT1 expression were not found to be significantly different among the groups. SI enzyme aids in the hydrolysis of carbohydrate and SGLT1 transports sodium/glucose across the lumen into the enterocyte.

3.4. Duodenal Morphological Measurement

3.4.1. Gallus gallus Duodenum Cross-Section Images

Figure 2 are representative images showing a Paneth cell in a circular crypt and goblet cells (acidic and neutral) in a villus.

3.4.2. Goblet Cell Number and Type (Villi and Crypt)

Table 4 indicates that CFWE significantly reduced the goblet cell number in both villi and crypts in comparison to the controls. The decrease is directly proportional to the increase in the concentration of C. sativus flower water extract.

3.4.3. Paneth Cell Number, Diameter, and Crypt Depth

As seen in Table 5, the intra-amniotic administration of CFWE resulted in a significant (p < 0.05) increase in Paneth cell number and diameter (µM) with maximum values corresponding to the 10% CFWE treatment group. Additionally, it is observed that the crypt depth significantly altered with each treatment without trends.

3.4.4. Average Villi Surface Area and Goblet Cell Diameter

As depicted in Table 6 the villi surface area and goblet cell diameter decreased in the treatment groups when compared to the controls (no injection and H2O). A dose-dependent decrease was observed in the two parameters in both the crypt and villi.

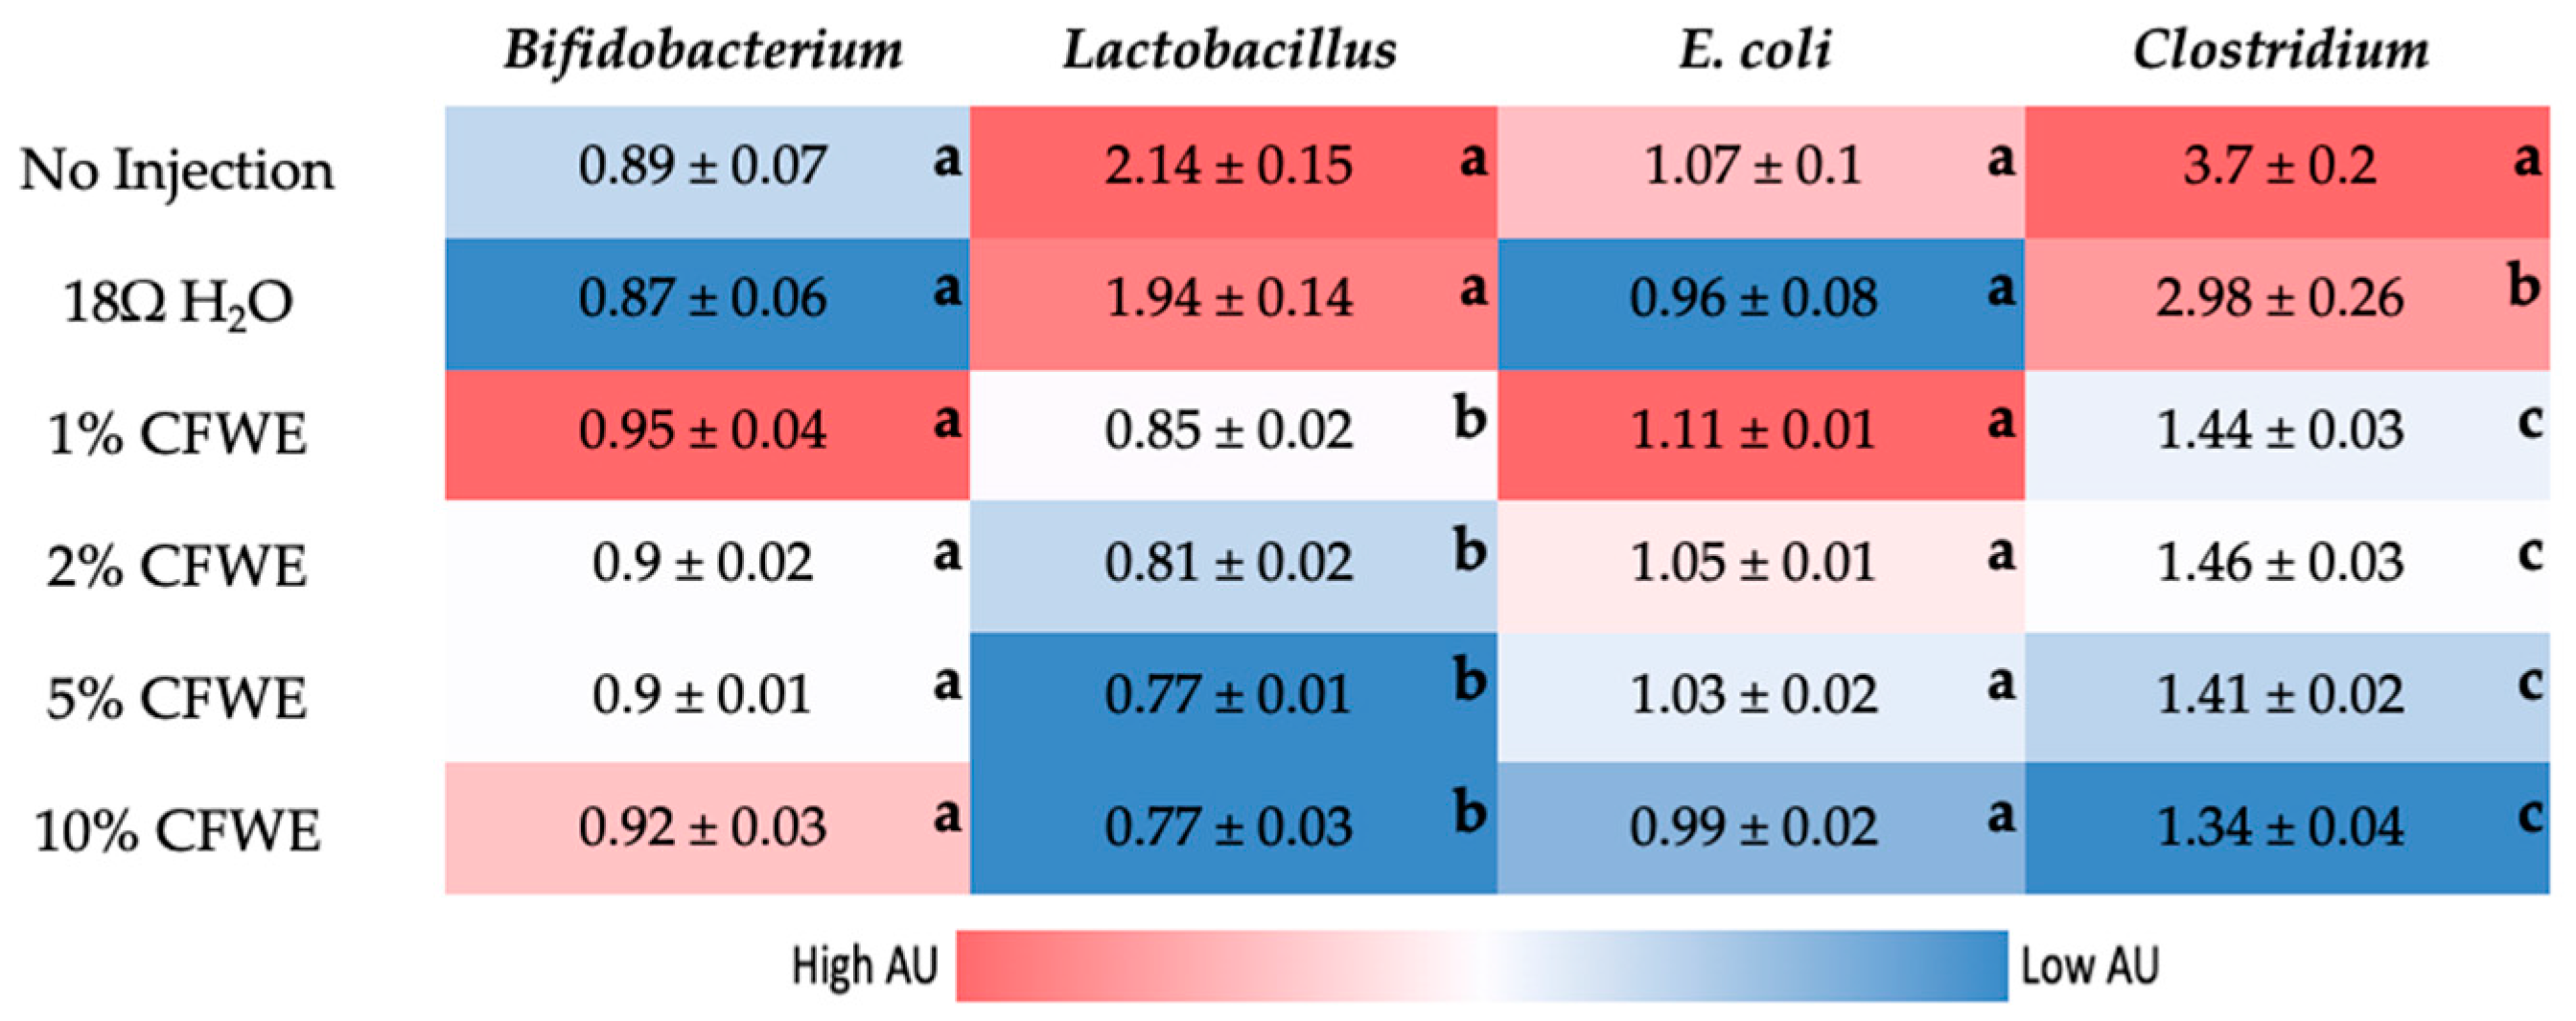
3.5. Gut Microbiome Analysis

The 16s rDNA analysis of cecal bacterial populations showed a significant reduction in relative abundance of genus Lactobacillus and Clostridium compared to the controls. Although, no statistically significant differences were observed in Bifidobacterium and E. coli numbers as seen in Figure 3.

4. Discussion

The existing literature provides pre-clinical evidence in support of the dietary consumption of C. sativus floral bio-residues. However, the data reported in this study demonstrates significant unfavorable changes to the brush border member morphology (BBM), functionality, and microbiome, even at the lowest dose of C. sativus water extract (1% CFWE). The cecal microbiome analysis revealed a significant reduction in Clostridium and probiotic Lactobacillus species. With a rise in dietary products of C. sativus flower in the market, it has become essential to assess the effects these foods may have on the intestine, especially in a naïve and developing organism. For the assessment, we utilized the well-established and widely accepted in vivo model (Gallus gallus).
From the results, it is seen that CFWE caused a steady dose-dependent decline in hemoglobin (Hb) concentration in the Cornish-cross hatchlings with a significant difference observed at 10% CFWE (p < 0.05). These results are in line with previous studies that have shown that certain polyphenols (like quercetin) affect iron absorption in the intestine and hence lower the levels of Hb in the blood [52,53,54,55,56,57]. Some polyphenols are said to chelate iron and hinder its absorption. The reduced Hb concentration (g/dL) result is further supported by the gene expression analysis (Figure 1). The expression of the divalent metal transporter (DMT1) gene was reduced, indicating that there were fewer ferrous iron cations available for absorption/transport. Similarly, the significant upregulation of iron transporter gene, ferroportin (at 10% CFWE), is correlated to the reduced Hb levels observed here. Previous studies have shown that the reduced expression of ferroportin is associated with iron sufficiency [35,58]. We hypothesize that kaempferols and quercetin found in CFWE have resulted in the poorer iron physiological status observed here. Kaempferols found in colored beans (Phaseolus vulgaris L.) have previously been shown (in vitro) to inhibit iron absorption [59]. A study by Babaei et al., found no differences in hematological parameter (including Hb) after a 14-day treatment with C. sativus petal in rats [60]. This could be as they injected these substances intraperitoneally as opposed to oral consumption hence the chelation of iron in the intestine does not come into question.
In case of the inflammatory biomarkers assessed in the duodenum, it is found that CFWE administration led to a concentration dependent downregulation of the pro-inflammatory gene Interleukin 8 or IL8 (Figure 1). An in vivo study on Wistar rats demonstrated saffron petal hydroalcoholic extract’s inhibitory effects on nuclear factor (NF-κB), C-reactive protein (CRP), and interleukin-6 (IL-6) after 8 weeks [24]. In the present study, however, the expression of NF-κβ and TNF-α genes did not significantly change at 5% and 10% CFWE. This is against our initial hypothesis that saffron floral bio-residue polyphenols would demonstrate an anti-inflammatory effect. Perhaps long-term consumption is required to see the anti-inflammatory effect. The anti-inflammatory properties must be confirmed by further analysis of other inflammation biomarkers and a long-term study.
The results of 16s rDNA analysis showed reduction in two out of the four bacterial populations assessed, indicating a selective antimicrobial effect of the water extract. The polyphenols present in the extract were analyzed and presented in Table 2. Results are in line with existing literature showing a high concentration of kaempferols and malvidin. Two independent studies showed that anthocyanins (from black raspberry) led to a decrease in Clostridium and Lactobacillus populations in C57BL mice and F-344 rats [61,62]. Several species of the genus Lactobacillus are considered probiotic as they can reduce inflammation, improve immune function, and restore homeostasis in many disease conditions [63]. The observed unfavorable changes to the cecal microbiome can be correlated to the changes in brush border membrane (BBM) morphology.
Upon morphometric assessment of the duodenum, there is a significant dose-dependent reduction observed in villi surface area (p < 0.05). This observation can be associated with the reduction in Hb levels i.e., reduced mineral absorption capacity of the BBM. Likewise, a significant decrease in villi goblet cell number from 1% CFWE to 10% CFWE is observed. Interestingly, the acidic goblet cell number also reduced drastically from ~33 goblet cells per villi in the (H2O control group) to ~23 goblet cells per villi (in 10% CFWE group). A reduction in acidic goblet cells indicates a reduced potential for an acidic BBM environment. A lower luminal pH supports the growth of health promoting bacteria [40,46]. This reduction in acidic goblet cells can be correlated to the reduction observed in the Lactobacillus populations (Figure 3). In addition, the diameter of the goblet cell was also found to be significantly reduced with increasing concentration of CFWE. This indicates a decreased mucin secreting capacity which is crucial for the protection of the intestinal barrier, the commensal microbiome, and overall BBM functionality. With the reduction in the goblet cells, it is up to the Paneth cells to regulate the immune function and protect the intestinal barrier. This is seen with the increase in Paneth cell number and diameter with concentration. We hypothesize that the reduction in mucin production due to lower goblet cell number and diameter led to an increase in Paneth cell number and diameter. Previously, an increase in Paneth cell number has been shown to be associated with toxicity and infection [64,65]. There is also a significant increase in MUC2 gene (p < 0.05) to compensate for the reduced goblet cell numbers with increasing CFWE concentrations. The expression of the MUC2 gene has been shown to increase with quercetin [66].

5. Conclusions

The present study demonstrates that the dietary consumption of C. sativus flower water extract leads to a reduction in villi surface area, decrease in goblet cell (number and diameter), reduced hemoglobin levels and unfavorable changes to the microbiome in-vivo (Gallus gallus). Based on these findings, it is not recommended for infants and individuals suffering from iron deficiency to consume products containing saffron flowers. Although further studies are required to support this interpretation. This is a preliminary study to get an impression of the potential effects the extract may have on intestinal health.

Author Contributions

Conceptualization, E.T.; Methodology, N.K., N.A. and E.T.; Investigation, N.A., Y.J., N.K. and E.T.; Resources, E.T.; Data curation, N.A.; Statistics, J.C.; Writing—original draft preparation, N.A.; Writing—review and editing, N.A., N.K., Y.J. and E.T.; Supervision, E.T.; Funding acquisition, E.T. All authors have read and agreed to the published version of the manuscript.

Funding

This research received no external funding.

Institutional Review Board Statement

The animal protocol used in this study was conducted according to the guidelines of the Declaration of Helsinki and approved by the Cornell University Institutional Animal Care and Use committee by the ethic approval code 2020-0077.

Conflicts of Interest

The authors declare no conflict of interest.

References

  1. Caser, M.; Demasi, S.; Stelluti, S.; Donno, D.; Scariot, V. Crocus sativus L. Cultivation in Alpine Environments: Stigmas and Tepals as Source of Bioactive Compounds. Agronomy 2020, 10, 1473. [Google Scholar] [CrossRef]
  2. Kianmehr, M.; Khazdair, M.R. Possible Therapeutic Effects of Crocus sativus Stigma and Its Petal Flavonoid, Kaempferol, on Respiratory Disorders. Pharm. Biol. 2020, 58, 1140–1149. [Google Scholar] [CrossRef]
  3. Serrano-Díaz, J.; Sánchez, A.M.; Martínez-Tomé, M.; Winterhalter, P.; Alonso, G.L. A Contribution to Nutritional Studies on Crocus Sativus Flowers and Their Value as Food. J. Food Compos. Anal. 2013, 31, 101–108. [Google Scholar] [CrossRef]
  4. Moratalla-López, N.; Bagur, M.J.; Lorenzo, C.; Martínez-Navarro, M.E.; Rosario Salinas, M.; Alonso, G.L. Bioactivity and Bioavailability of the Major Metabolites of Crocus sativus L. Flower. Molecules 2019, 24, 2827. [Google Scholar] [CrossRef] [Green Version]
  5. Rahaiee, S.; Moini, S.; Hashemi, M.; Shojaosadati, S.A. Evaluation of Antioxidant Activities of Bioactive Compounds and Various Extracts Obtained from Saffron (Crocus sativus L.): A Review. J. Food Sci. Technol. 2015, 52, 1881–1888. [Google Scholar] [CrossRef] [Green Version]
  6. Zeinali, M.; Zirak, M.R.; Rezaee, S.A.; Karimi, G.; Hosseinzadeh, H. Immunoregulatory and Anti-Inflammatory Properties of Crocus sativus (Saffron) and Its Main Active Constituents: A Review. Iran. J. Basic Med. Sci. 2019, 22, 334–344. [Google Scholar] [CrossRef]
  7. Saleem, N.; Ahmad, M.; Kamran, S.; Riaz, H.; Mehmood, Y.; Raza, S. Hepatoprotective Effect of Crocus Sativus on Amiodarone-Induced Liver Toxicity. Br. J. Pharm. Res. 2016, 12, 1–11. [Google Scholar] [CrossRef]
  8. Linardaki, Z.I.; Orkoula, M.G.; Kokkosis, A.G.; Lamari, F.N.; Margarity, M. Investigation of the Neuroprotective Action of Saffron (Crocus sativus L.) in Aluminum-Exposed Adult Mice through Behavioral and Neurobiochemical Assessment. Food Chem. Toxicol. 2013, 52, 163–170. [Google Scholar] [CrossRef]
  9. Siddiqui, M.; Saleh, M.M.; Basharuddin, S.B.B.; Zamri, S.B.; Mohd Najib, M.B.; Che Ibrahim, M.; Binti Mohd Noor, N.; Binti Mazha, H.; Mohd Hassan, N.; Khatib, A. Saffron (Crocus sativus L.): As an Antidepressant. J. Pharm. Bioallied Sci. 2018, 10, 173. [Google Scholar] [CrossRef] [PubMed]
  10. Mashmoul, M.; Azlan, A.; Khaza’Ai, H.; Yusof, B.N.M.; Noor, S.M. Saffron: A Natural Potent Antioxidant as a Promising Anti-Obesity Drug. Antioxidants 2013, 2, 293–308. [Google Scholar] [CrossRef] [Green Version]
  11. Zeka, K.; Ruparelia, K.C.; Continenza, M.A.; Stagos, D.; Vegliò, F.; Arroo, R.R.J. Petals of Crocus sativus L. as a Potential Source of the Antioxidants Crocin and Kaempferol. Fitoterapia 2015, 107, 128–134. [Google Scholar] [CrossRef]
  12. Serrano-Díaz, J.; Sánchez, A.M.; Maggi, L.; Martínez-Tomé, M.; García-Diz, L.; Murcia, M.A.; Alonso, G.L. Increasing the Applications of Crocus sativus Flowers as Natural Antioxidants. J. Food Sci. 2012, 77, C1162–C1168. [Google Scholar] [CrossRef] [PubMed]
  13. Stelluti, S.; Caser, M.; Demasi, S.; Scariot, V. Sustainable Processing of Floral Bio-Residues of Saffron (Crocus sativus L.) for Valuable Biorefinery Products. Plants 2021, 10, 523. [Google Scholar] [CrossRef]
  14. Verediano, T.A.; Stampini Duarte Martino, H.; Dias Paes, M.C.; Tako, E. Effects of Anthocyanin on Intestinal Health: A Systematic Review. Nutrients 2021, 13, 1331. [Google Scholar] [CrossRef] [PubMed]
  15. Park, M.Y.; Ji, G.E.; Sung, M.K. Dietary Kaempferol Suppresses Inflammation of Dextran Sulfate Sodium-Induced Colitis in Mice. Dig. Dis. Sci. 2012, 57, 355–363. [Google Scholar] [CrossRef]
  16. Bian, Y.; Dong, Y.; Sun, J.; Sun, M.; Hou, Q.; Lai, Y.; Zhang, B. Protective Effect of Kaempferol on LPS-Induced Inflammation and Barrier Dysfunction in a Coculture Model of Intestinal Epithelial Cells and Intestinal Microvascular Endothelial Cells. J. Agric. Food Chem. 2020, 68, 160–167. [Google Scholar] [CrossRef]
  17. Kumar, V.; Bhat, Z.A.; Kumar, D.; Shah, M.Y.; Chashoo, I.A.; Khan, N.A. Physicochemical and Preliminary Phytochemical Studies on Petals of Crocus sativus “Cashmerianus”. Pharmacogn. J. 2011, 3, 46–49. [Google Scholar] [CrossRef]
  18. Hosseini, A.; Razavi, B.M.; Hosseinzadeh, H. Saffron (Crocus sativus) Petal as a New Pharmacological Target: A Review. Iran. J. Basic Med. Sci. 2018, 21, 1091–1099. [Google Scholar]
  19. Zeka, K.; Marrazzo, P.; Micucci, M.; Ruparelia, K.C.; Arroo, R.R.J.; Macchiarelli, G.; Nottola, S.A.; Continenza, M.A.; Chiarini, A.; Angeloni, C.; et al. Activity of Antioxidants from Crocus sativus l. Petals: Potential Preventive Effects towards Cardiovascular System. Antioxidants 2020, 9, 1102. [Google Scholar] [CrossRef]
  20. Omidi, A.; Riahinia, N.; Bagher, M.; Torbati, M.; Behdani, M.-A. Hepatoprotective Effect of Crocus sativus (Saffron) Petals Extract against Acetaminophen Toxicity in Male Wistar Rats Protective Effects of Saffron Petals in Acetaminophen-Induced Liver Damages. Avicenna J. Phytomed. 2014, 4, 330–336. [Google Scholar]
  21. Montoro, P.; Maldini, M.; Luciani, L.; Tuberoso, C.I.G.; Congiu, F.; Pizza, C. Radical Scavenging Activity and LC-MS Metabolic Profiling of Petals, Stamens, and Flowers of Crocus sativus L. J. Food Sci. 2012, 77. [Google Scholar] [CrossRef]
  22. Mohaqiq, Z.; Moossavi, M.; Hemmati, M.; Kazemi, T.; Mehrpour, O. Antioxidant Properties of Saffron Stigma and Petals: A Potential Therapeutic Approach for Insulin Resistance through an Insulin-Sensitizing Adipocytokine in High-Calorie Diet Rats. Int. J. Prev. Med. 2020, 11, 184. [Google Scholar]
  23. He, Y.; Peng, H.; Zhang, H.; Liu, Y.; Sun, H. Structural Characteristics and Immunopotentiation Activity of Two Polysaccharides from the Petal of Crocus sativus. Int. J. Biol. Macromol. 2021, 180, 129–142. [Google Scholar] [CrossRef]
  24. Azizi, M.; Abbasi, N.; Mohamadpour, M.; Bakhtiyari, S.; Asadi, S.; Shirzadpour, E.; Aidy, A.; Mohamadpour, M.; Amraei, M. Investigating the Effect of Crocus sativus l. Petal Hydroalcoholic Extract on Inflammatory and Enzymatic Indices Resulting from Alcohol Use in Kidney and Liver of Male Rats. J. Inflamm. Res. 2019, 12, 269–283. [Google Scholar] [CrossRef] [PubMed] [Green Version]
  25. Abedimanesh, N.; Motlagh, B.; Abedimanesh, S.; Bathaie, S.Z.; Separham, A.; Ostadrahimi, A. Effects of Crocin and Saffron Aqueous Extract on Gene Expression of SIRT1, AMPK, LOX1, NF-ΚB, and MCP-1 in Patients with Coronary Artery Disease: A Randomized Placebo-Controlled Clinical Trial. Phytother. Res. 2020, 34, 1114–1122. [Google Scholar] [CrossRef]
  26. Alipour, F.; Vakili, A.; Mesgaran, M.D.; Ebrahimi, H. The Effect of Adding Ethanolic Saffron Petal Extract and Vitamin E on Growth Performance, Blood Metabolites and Antioxidant Status in Baluchi Male Lambs. Asian-Australas. J. Anim. Sci. 2019, 32, 1695–1704. [Google Scholar] [CrossRef] [PubMed]
  27. Mottaghipisheh, J.; Mahmoodi Sourestani, M.; Kiss, T.; Horváth, A.; Tóth, B.; Ayanmanesh, M.; Khamushi, A.; Csupor, D. Comprehensive Chemotaxonomic Analysis of Saffron Crocus Tepal and Stamen Samples, as Raw Materials with Potential Antidepressant Activity. J. Pharm. Biomed. Anal. 2020, 184, 113183. [Google Scholar] [CrossRef]
  28. Ghaderi, A.; Rasouli-Azad, M.; Vahed, N.; Banafshe, H.R.; Soleimani, A.; Omidi, A.; Ghoreishi, F.S.; Asemi, Z. Clinical and Metabolic Responses to Crocin in Patients under Methadone Maintenance Treatment: A Randomized Clinical Trial. Phytother. Res. 2019, 33, 2714–2725. [Google Scholar] [CrossRef]
  29. Khalatbari-Mohseni, A.; Banafshe, H.R.; Mirhosseini, N.; Asemi, Z.; Ghaderi, A.; Omidi, A. The Effects of Crocin on Psychological Parameters in Patients under Methadone Maintenance Treatment: A Randomized Clinical Trial. Subst. Abus. Treat. Prev. Policy 2019, 14, 9. [Google Scholar] [CrossRef] [PubMed]
  30. Ray, S.K.; Mukherjee, S. Evolving Interplay Between Dietary Polyphenols and Gut Microbiota—An Emerging Importance in Healthcare. Front. Nutr. 2021, 8, 195. [Google Scholar] [CrossRef] [PubMed]
  31. Hair, R.; Sakaki, J.R.; Chun, O.K. Anthocyanins, Microbiome and Health Benefits in Aging. Molecules 2021, 26, 537. [Google Scholar] [CrossRef]
  32. Singh, R.K.; Chang, H.W.; Yan, D.; Lee, K.M.; Ucmak, D.; Wong, K.; Abrouk, M.; Farahnik, B.; Nakamura, M.; Zhu, T.H.; et al. Influence of Diet on the Gut Microbiome and Implications for Human Health. J. Transl. Med. 2017, 15, 73. [Google Scholar] [CrossRef] [Green Version]
  33. Hou, T.; Tako, E. The in Ovo Feeding Administration (Gallus gallus)—An Emerging in Vivo Approach to Assess Bioactive Compounds with Potential Nutritional Benefits. Nutrients 2018, 10, 418. [Google Scholar] [CrossRef] [PubMed]
  34. Tako, E.; Rutzke, M.A.; Glahn, R.P. Using the Domestic Chicken (Gallus gallus) as an in Vivo Model for Iron Bioavailability. Poult. Sci. 2010, 89, 514–521. [Google Scholar] [CrossRef]
  35. Beasley, J.T.; Johnson, A.A.T.; Kolba, N.; Bonneau, J.P.; Glahn, R.P.; Ozeri, L.; Koren, O.; Tako, E. Nicotianamine-Chelated Iron Positively Affects Iron Status, Intestinal Morphology and Microbial Populations in Vivo (Gallus gallus). Sci. Rep. 2020, 10, 2297. [Google Scholar] [CrossRef] [Green Version]
  36. Reed, S.; Knez, M.; Uzan, A.; Stangoulis, J.C.R.; Glahn, R.P.; Koren, O.; Tako, E. Alterations in the Gut (Gallus gallus) Microbiota Following the Consumption of Zinc Biofortified Wheat (Triticum aestivum)-Based Diet. J. Agric. Food Chem. 2018, 66, 6291–6299. [Google Scholar] [CrossRef]
  37. Martino, H.S.D.; Kolba, N.; Tako, E. Yacon (Smallanthus sonchifolius) Flour Soluble Extract Improve Intestinal Bacterial Populations, Brush Border Membrane Functionality and Morphology in Vivo (Gallus gallus). Food Res. Int. 2020, 137. [Google Scholar] [CrossRef] [PubMed]
  38. Wang, X.; Kolba, N.; Liang, J.; Tako, E. Alterations in Gut Microflora Populations and Brush Border Functionality Following Intra-Amniotic Administration (Gallus gallus) of Wheat Bran Prebiotic Extracts. Food Funct. 2019, 10, 4834–4843. [Google Scholar] [CrossRef]
  39. Da Silva, B.P.; Kolba, N.; Martino, H.S.D.; Hart, J.; Tako, E. Soluble Extracts from Chia Seed (Salvia hispanica L.) Affect Brush Border Membrane Functionality, Morphology and Intestinal Bacterial Populations in Vivo (Gallus gallus). Nutrients 2019, 11, 2457. [Google Scholar] [CrossRef] [PubMed] [Green Version]
  40. Carboni, J.; Reed, S.; Kolba, N.; Eshel, A.; Koren, O.; Tako, E. Alterations in the Intestinal Morphology, Gut Microbiota, and Trace Mineral Status Following Intra-Amniotic Administration (Gallus gallus) of Teff (Eragrostis tef) Seed Extracts. Nutrients 2020, 12, 3020. [Google Scholar] [CrossRef]
  41. Dias, D.M.; Kolba, N.; Hart, J.J.; Ma, M.; Sha, S.T.; Lakshmanan, N.; Nutti, M.R.; Martino, H.S.D.; Glahn, R.P.; Tako, E. Soluble Extracts from Carioca Beans (Phaseolus vulgaris L.) Affect the Gut Microbiota and Iron Related Brush Border Membrane Protein Expression in Vivo (Gallus gallus). Food Res. Int. 2019, 123, 172–180. [Google Scholar] [CrossRef]
  42. Hou, T.; Kolba, N.; Glahn, R.P.; Tako, E. Intra-Amniotic Administration (Gallus gallus) of Cicer Arietinum and Lens Culinaris Prebiotics Extracts and Duck Egg White Peptides Affects Calcium Status and Intestinal Functionality. Nutrients 2017, 9, 785. [Google Scholar] [CrossRef] [Green Version]
  43. Tako, E.; Bar, H.; Glahn, R.P. The Combined Application of the Caco-2 Cell Bioassay Coupled with in Vivo (Gallus gallus) Feeding Trial Represents an Effective Approach to Predicting Fe Bioavailability in Humans. Nutrients 2016, 8, 732. [Google Scholar] [CrossRef]
  44. Warkentin, T.; Kolba, N.; Tako, E. Low Phytate Peas (Pisum sativum L.) Improve Iron Status, Gut Microbiome, and Brush Border Membrane Functionality in Vivo (Gallus gallus). Nutrients 2020, 12, 2563. [Google Scholar] [CrossRef]
  45. Tako, E.; Glahn, R.P.; Knez, M.; Stangoulis, J.C. The Effect of Wheat Prebiotics on the Gut Bacterial Population and Iron Status of Iron Deficient Broiler Chickens. Nutr. J. 2014, 13, 58. [Google Scholar] [CrossRef] [PubMed]
  46. Tako, E.; Beebe, S.E.; Reed, S.; Hart, J.J.; Glahn, R.P. Polyphenolic Compounds Appear to Limit the Nutritional Benefit of Biofortified Higher Iron Black Bean (Phaseolus vulgaris L.). Nutr. J. 2014, 13, 28. [Google Scholar] [CrossRef] [PubMed]
  47. Zhu, X.Y.; Zhong, T.; Pandya, Y.; Joerger, R.D. 16S RRNA-Based Analysis of Microbiota from the Cecum of Broiler Chickens. Appl. Environ. Microbiol. 2002, 68, 124–137. [Google Scholar] [CrossRef] [Green Version]
  48. Amit-Romach, E.; Sklan, D.; Uni, Z. Microflora Ecology of the Chicken Intestine Using 16S Ribosomal DNA Primers. Poult. Sci. 2004, 83, 1093–1098. [Google Scholar] [CrossRef]
  49. Langendijk, P.S.; Schut, F.; Jansen, G.J.; Raangs, G.C.; Kamphuis, G.R.; Wilkinson, M.H.F.; Welling, G.W. Quantitative Fluorescence in Situ Hybridization of Bifidobacterium Spp. with Genus-Specific 16S RRNA-Targeted Probes and Its Application in Fecal Samples. Appl. Environ. Microbiol. 1995, 61, 3069. [Google Scholar] [CrossRef] [Green Version]
  50. Tako, E.; Glahn, R.P.; Welch, R.M.; Lei, X.; Yasuda, K.; Miller, D.D. Dietary Inulin Affects the Expression of Intestinal Enterocyte Iron Transporters, Receptors and Storage Protein and Alters the Microbiota in the Pig Intestine. Br. J. Nutr. 2008, 99, 472–480. [Google Scholar] [CrossRef] [Green Version]
  51. Sharp, P.; Srai, S.K. Molecular Mechanisms Involved in Intestinal Iron Absorption. World J. Gastroenterol. 2007, 13, 4716–4724. [Google Scholar] [CrossRef] [PubMed]
  52. Lesjak, M.; Hoque, R.; Balesaria, S.; Skinner, V.; Debnam, E.S.; Srai, S.K.S.; Sharp, P.A. Quercetin Inhibits Intestinal Iron Absorption and Ferroportin Transporter Expression In Vivo and In Vitro. PLoS ONE 2014, 9, e102900. [Google Scholar] [CrossRef] [Green Version]
  53. Lesjak, M.; Balesaria, S.; Skinner, V.; Debnam, E.S.; Srai, S.K.S. Quercetin Inhibits Intestinal Non-Haem Iron Absorption by Regulating Iron Metabolism Genes in the Tissues. Eur. J. Nutr. 2018, 58, 743–753. [Google Scholar] [CrossRef] [PubMed] [Green Version]
  54. Petry, N.; Egli, I.; Zeder, C.; Walczyk, T.; Hurrell, R. Polyphenols and Phytic Acid Contribute to the Low Iron Bioavailability from Common Beans in Young Women. J. Nutr. 2010, 140, 1977–1982. [Google Scholar] [CrossRef]
  55. Ma, Q.; Kim, E.-Y.; Han, O. Bioactive Dietary Polyphenols Decrease Heme Iron Absorption by Decreasing Basolateral Iron Release in Human Intestinal Caco-2 Cells. J. Nutr. 2010, 140, 1117–1121. [Google Scholar] [CrossRef]
  56. Hurrell, R.F.; Reddy, M.; Cook, J.D. Inhibition of Non-Haem Iron Absorption in Man by Polyphenolic-Containing Beverages. Br. J. Nutr. 1999, 81, 289–295. [Google Scholar] [CrossRef] [PubMed]
  57. Layrisse, M.; García-Casal, M.N.; Solano, L.; Barón, M.A.; Arguello, F.; Llovera, D.; Ramírez, J.; Leets, I.; Tropper, E. Iron Bioavailability in Humans from Breakfasts Enriched with Iron Bis-Glycine Chelate, Phytates and Polyphenols. J. Nutr. 2000, 130, 2195–2199. [Google Scholar] [CrossRef]
  58. Gomes, M.J.C.; Kolba, N.; Agarwal, N.; Kim, D.; Eshel, A.; Koren, O.; Tako, E. Modifications in the Intestinal Functionality, Morphology and Microbiome Following Intra-Amniotic Administration (Gallus gallus) of Grape (Vitis vinifera) Stilbenes (Resveratrol and Pterostilbene). Nutrients 2021, 13, 3247. [Google Scholar] [CrossRef]
  59. Hu, Y.; Cheng, Z.; Heller, L.I.; Krasnoff, S.B.; Glahn, R.P.; Welch, R.M. Kaempferol Red Pinto Bean Seed (Phaseolus vulgaris L.) Coats Inhibits Iron Bioavailability Using an in Vitro Digestion/Human Caco-2 Cell Model. J. Agric. Food Chem. 2006, 54, 9254–9261. [Google Scholar] [CrossRef]
  60. Babaei, A.; Arshami, J.; Haghparast, A.; Mesgaran, M.D. Effects of Saffron (Crocus sativus) Petal Ethanolic Extract on Hematology, Antibody Response, and Spleen Histology in Rats. Avicenna J. Phytomedicine 2014, 4, 103. [Google Scholar]
  61. Pan, P.; Lam, V.; Salzman, N.; Huang, Y.W.; Yu, J.; Zhang, J.; Wang, L.S. Black Raspberries and Their Anthocyanin and Fiber Fractions Alter the Composition and Diversity of Gut Microbiota in F-344 Rats. Nutr. Cancer 2017, 69, 943. [Google Scholar] [CrossRef] [PubMed]
  62. Gu, J.; Thomas-Ahner, J.M.; Riedl, K.M.; Bailey, M.T.; Vodovotz, Y.; Schwartz, S.J.; Clinton, S.K. Dietary Black Raspberries Impact the Colonic Microbiome and Phytochemical Metabolites in Mice. Mol. Nutr. Food Res. 2019, 63, 1800636. [Google Scholar] [CrossRef]
  63. Azad, M.A.K.; Sarker, M.; Li, T.; Yin, J. Probiotic Species in the Modulation of Gut Microbiota: An Overview. BioMed Res. Int. 2018, 2018, 9478630. [Google Scholar] [CrossRef] [PubMed] [Green Version]
  64. Martinez Rodriguez, N.R.; Eloi, M.D.; Huynh, A.; Dominguez, T.; Lam, A.H.C.; Carcamo-Molina, D. Expansion of Paneth Cell Population in Response to Enteric Salmonella Enterica Serovar Typhimurium Infection. Infect. Immun. 2012, 80, 266–275. [Google Scholar] [CrossRef] [Green Version]
  65. Gassler, N. Paneth Cells in Intestinal Physiology and Pathophysiology. World J. Gastrointest. Pathophysiol. 2017, 8, 150. [Google Scholar] [CrossRef]
  66. Damiano, S.; Sasso, A.; de Felice, B.; di Gregorio, I.; la Rosa, G.; Lupoli, G.A.; Belfiore, A.; Mondola, P.; Santillo, M. Quercetin Increases MUC2 and MUC5AC Gene Expression and Secretion in Intestinal Goblet Cell-Like LS174T via PLC/PKCα/ERK1-2 Pathway. Front. Physiol. 2018, 9, 357. [Google Scholar] [CrossRef] [Green Version]
Figure 1. Effect of the intra-amniotic administration of increasing concentration of CFWE and controls on duodenal gene expression. Values are the means (AU: arbitrary units) ± SEM, n = 6. a, b, c genes (column wise) not indicated by the same letter are significantly different (p < 0.05). Dcytb, duodenal cytochrome b; DMT1, divalent metal transporter 1; ZIP1, Zrt-, Irt-like proteins; ZnT1, zinc transporter 1; NF-κβ, nuclear factor kappa beta; TNF-α, tumor necrosis factor; IL8, interleukin 8; SGLT1, sodium-glucose cotransporter 1; SI, sucrose isomaltase; MUC2, mucin 2.
Nutrients 14 00220 g001
Figure 2. Cross-section of the duodenum (Gallus gallus). (A) Points out a Paneth cell that is stained light purple. (B) Represents a neutral goblet cell, stained light purple. (C) Points to an acidic goblet cell, stained bright blue. Stain used: AB/PAS.
Nutrients 14 00220 g002
Figure 3. Heatmap showing the effect of different concentrations of dietary CFWE supplementation compared with controls on the populations of Lactobacillus, Clostridium, Escherichia coli, and Bifidobacterium in Gallus gallus cecum. The relative abundance is expressed in arbitrary units (AU). Values are the means ± SEM, n = 5. a–c groups not indicated by the same letter are significantly different (p < 0.05).
Nutrients 14 00220 g003
Table 1. DNA sequences of primers used.
AnalyteForward Primer (5′→3′)Reverse Primer (5′→3′)Base PairGI Identifier
Iron Metabolism
DcytBCATGTGCATTCTCTTCCAAAGTCCTCCTTGGTGACCGCATTAT10320,380,692
DMT1TTGATTCAGAGCCTCCCATTAGGCGAGGAGTAGGCTTGTATTT101206,597,489
FerroportinCTCAGCAATCACTGGCATCAACTGGGCAACTCCAGAAATAAG9861,098,365
Zinc Metabolism
ZIP1TGCCTCAGTTTCCCTCACGGCTCTTAAGGGCACTTCT144107,055,139
ZnT1GGTAACAGAGCTGCCTTAACTGGTAACAGAGCTGCCTTAACT10554,109,718
Inflammatory Response
NF-κβCACAGCTGGAGGGAAGTAAATTTGAGTAAGGAAGTGAGGTTGAG1002,130,627
TNF-αGACAGCCTATGCCAACAAGTATTACAGGAAGGGCAACTCATC10953,854,909
IL8TCATCCATCCCAAGTTCATTCAGACACACTTCTCTGCCATCTT105395,872
BBM functionality
SGLT1GCATCCTTACTCTGTGGTACTGTATCCGCACATCACACATCC1068,346,783
SICCAGCAATGCCAGCATATTGCGGTTTCTCCTTACCACTTCTT952,246,388
MUC2CCTGCTGCAAGGAAGTAGAAGGAAGATCAGAGTGGTGCATAG155423,101
Dcytb, duodenal cytochrome b; DMT1, divalent metal transporter 1; ZIP1, Zrt-, Irt-like proteins; ZnT1, zinc transporter 1; NF- κβ, nuclear factor kappa beta; TNF-α, tumor necrosis factor; IL8, interleukin 8; SGLT1, sodium-glucose cotransporter 1; SI, sucrose isomaltase; MUC2, mucin 2.
Table 2. Concentration of polyphenols in the CFWE prepared.
Polyphenolic Compounds % *
Malvidin 3,5-di-O-glucoside0.03
Kaempferol-3-O-glucoside7.90
Quercetin-3-O-gluside 0.37
Kaempferol-3-O-sophoroside 91.70
* Table shows % polyphenols from total assessed.
Table 3. Average hemoglobin and body weight in all groups.
Treatment GroupAverage Hemoglobin (g/dL)Average Body Weight (g)
No Injection12.52 ± 0.91 a42.06 ± 1.35 a
18 Ω H2O10.13 ± 0.71 a,b42.16 ± 1.28 a
1% CFWE12.26 ± 0.72 a42.96 ± 0.91 a
2% CFWE11.15 ± 0.56 a42.13 ± 0.68 a
5% CFWE10.24 ± 0.73 a42.89 ± 0.77 a
10% CFWE9.62 ± 1.21 b42.88 ± 0.96 a
Values are means ± SEM, n = 10. a, b Treatment groups not indicated by the same letter are significantly different (p < 0.05).
Table 4. Effect of intra-amniotic administration of investigated concentration of CFWE and controls on goblet cell type and total number of goblet cells in duodenal villi and crypts.
Treatment GroupAverage Goblet Cell Number Per VilliTotal Villi Goblet
Number
Total Crypt Goblet
Number
AcidicNeutralMixture
No Injection36.76 ± 0.85 a0.02 ± 0.01 a0.3 ± 0.06 a37.08 ± 0.86 a8.33 ± 0.25 a
18 Ω H2O32.92 ± 0.68 b0 ± 0 a0.05 ± 0.03 b32.97 ± 0.68 b7.44 ± 0.22 b
1% CFWE29.28 ± 0.86 c0.03 ± 0.02 a0.04 ± 0.02 a29.34 ± 0.87 c6.73 ± 0.22 c
10% CFWE22.49 ± 0.5 d0.01 ± 0.01 a0.01 ± 0.01 b22.51 ± 0.5 d6.68 ± 0.22 c
Values are the means ± SEM, n = 5. a–d Treatment groups not indicated by the same letter are significantly different (p < 0.05).
Table 5. Effect of intra-amniotic administration of different concentration of CFWE on Paneth cell number and diameter.
Treatment Group Paneth Cell NumberPaneth Cell Diameter
(µM)
Crypt Depth
(µM)
No Injection2.24 ± 0.08 b1.56 ± 0.03 c45.77 ± 1.32 b
18 Ω H2O1.89 ± 0.07 c1.89 ± 0.05 b50.73 ± 1.1 a
1% CFWE1.93 ± 0.07 c1.67 ± 0.03 c32.81 ± 0.73 d
10% CFWE2.56 ± 0.08 a2.47 ± 0.06 a37.75 ± 0.8 c
Values are the means ± SEM, n = 5. a–d Treatment groups not indicated by the same letter are significantly different (p < 0.05).
Table 6. Effect of intra-amniotic administration of treatments and controls on villi surface area and goblet cell diameter in duodenal villi and crypts.
Treatment Group Average Surface Area (mm2)Villi Goblet Cell Diameter (µM)Crypt Goblet Cell Diameter (µM)
No Injection168.19 ± 3.72 a4.65 ± 0.06 b2.98 ± 0.06 c
18 Ω H2O171.45 ± 4.2 a5.13 ± 0.06 a3.32 ± 0.07 a
1% CFWE137.91 ± 3.4 b4.18 ± 0.06 c3.11 ± 0.06 b,c
10% CFWE116.41 ± 2.71 c3.95 ± 0.06 d3.17 ± 0.06 a,b
Values are the means ± SEM, n = 5. a–d groups not indicated by the same letter are significantly different (p < 0.05).
Publisher’s Note: MDPI stays neutral with regard to jurisdictional claims in published maps and institutional affiliations.

