
Absorption Kinetics of Berberine and Dihydroberberine and Their Impact on Glycemia: A Randomized, Controlled, Crossover Pilot Trial

 ,
, 
Abstract
1. Introduction
2. Methods
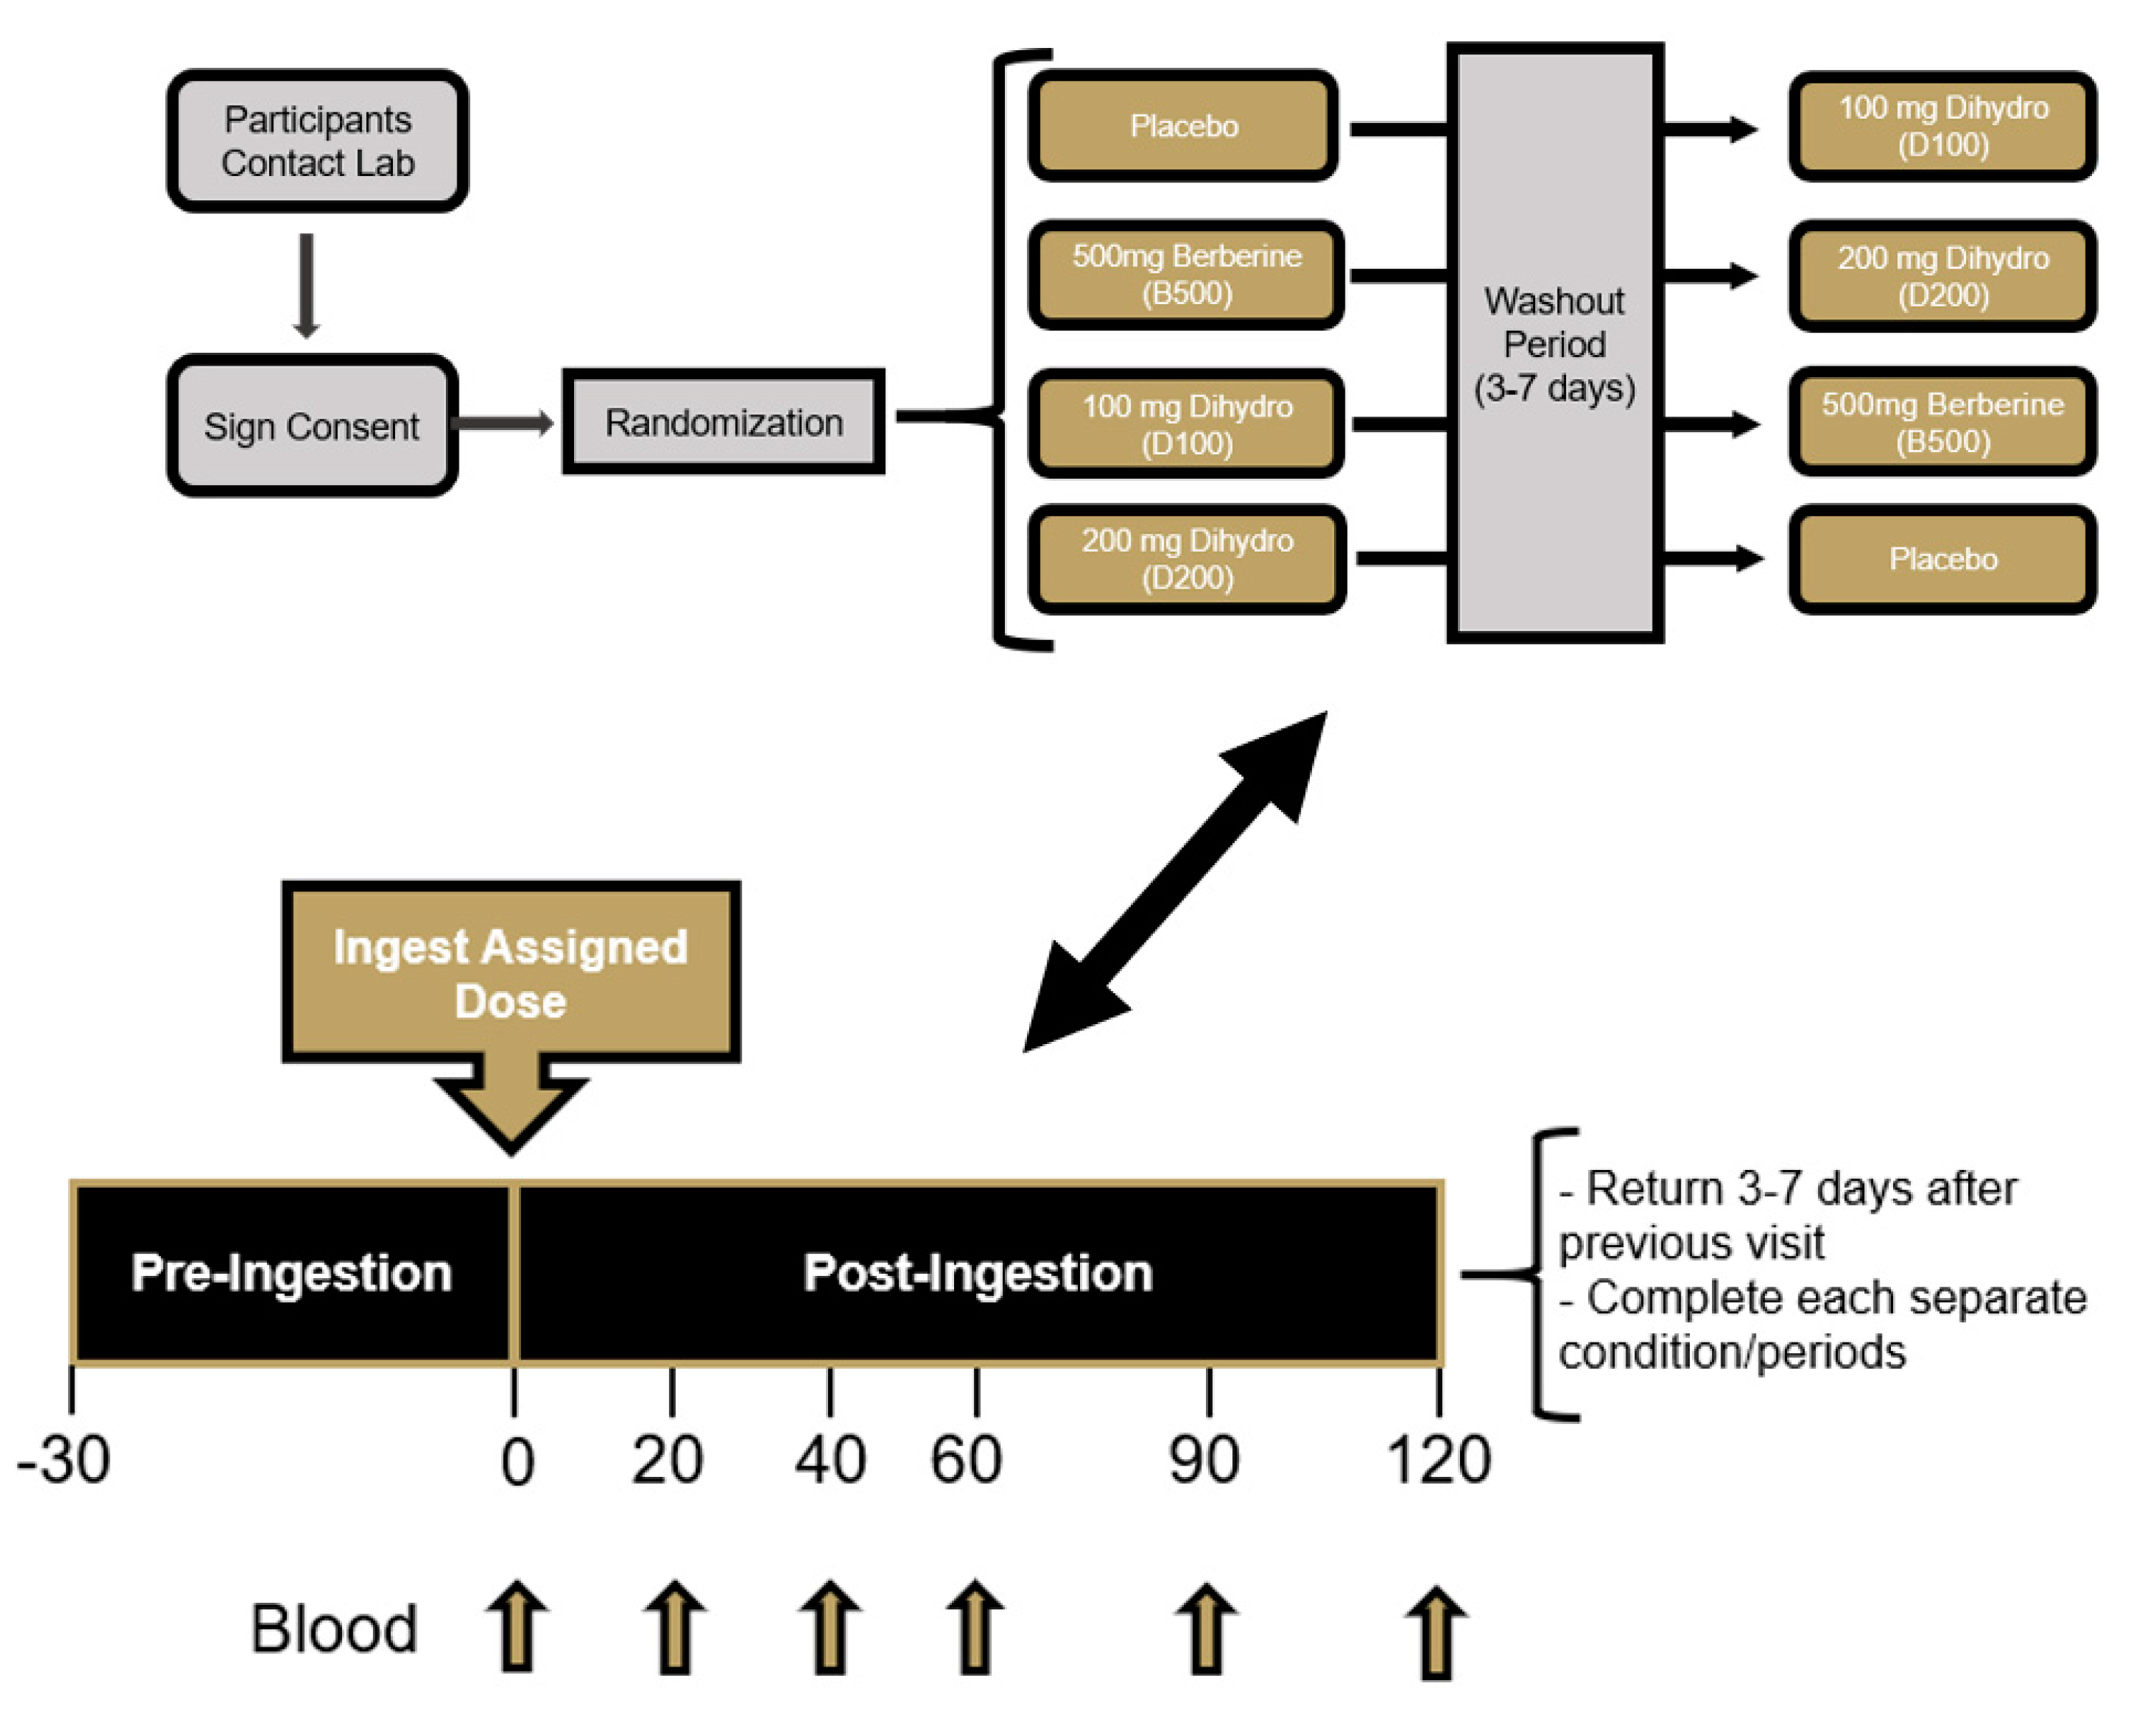
2.1. Overview of Research Design
2.2. Study Participants
2.3. Supplementation Protocol
2.4. Procedures
2.4.1. Baseline Demographics and Hemodynamics
2.4.2. Dietary Monitoring
2.4.3. Venous Blood Collection and Processing
2.4.4. Complete Blood Count
2.4.5. Comprehensive Metabolic Panel
2.4.6. Glucose and Insulin Determination
2.4.7. Plasma Berberine Determination
2.5. Statistical Analysis
3. Results
3.1. Pre-Supplementation Status
3.2. Protocol Compliance
3.3. Adverse Events
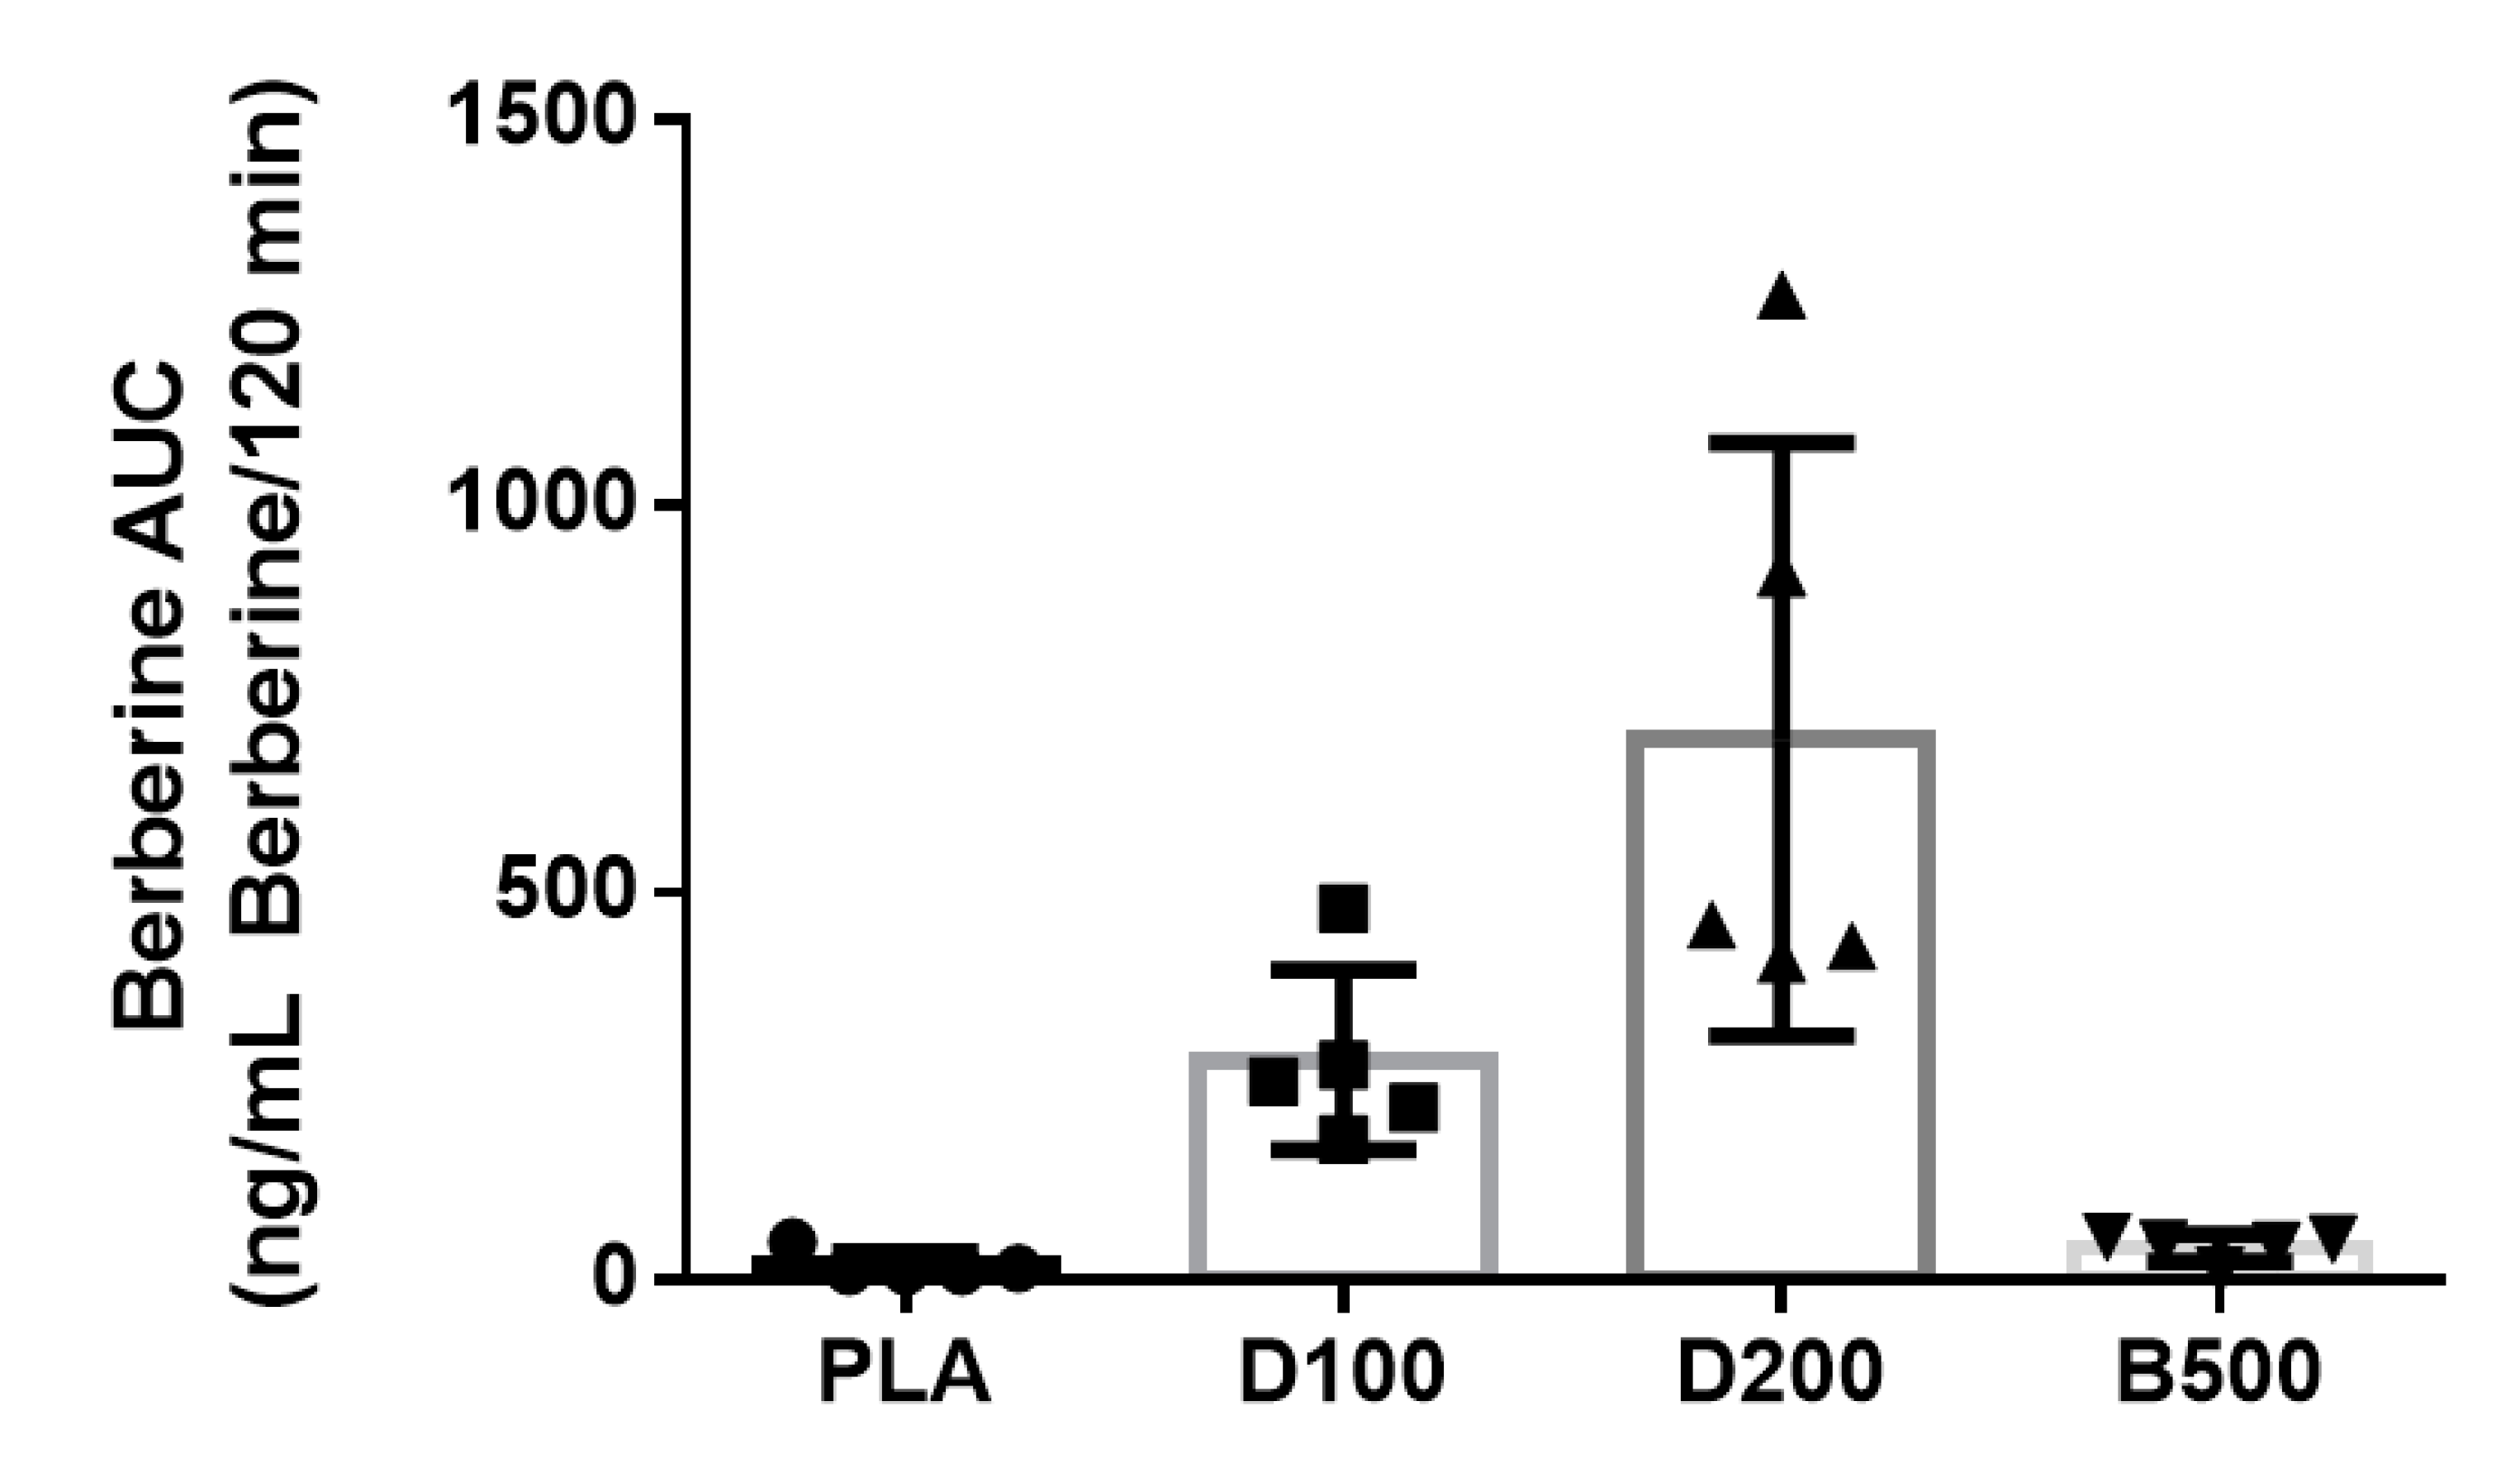
3.4. Berberine
3.5. Glucose
3.6. Insulin
3.7. Whole Blood and Serum Markers
4. Discussion
5. Conclusions
Author Contributions
Funding
Institutional Review Board Statement
Informed Consent Statement
Data Availability Statement
Acknowledgments
Conflicts of Interest
References
- Liu, C.S.; Zheng, Y.R.; Zhang, Y.F.; Long, X.Y. Research progress on berberine with a special focus on its oral bioavailability. Fitoterapia 2016, 109, 274–282. [Google Scholar] [CrossRef]
- Imenshahidi, M.; Hosseinzadeh, H. Berberine and barberry (Berberis vulgaris): A clinical review. Phytother. Res. 2019, 33, 504–523. [Google Scholar] [CrossRef] [PubMed]
- Lee, Y.S.; Kim, W.S.; Kim, K.H.; Yoon, M.J.; Cho, H.J.; Shen, Y.; Ye, J.M.; Lee, C.H.; Oh, W.K.; Kim, C.T.; et al. Berberine, a natural plant product, activates AMP-activated protein kinase with beneficial metabolic effects in diabetic and insulin-resistant states. Diabetes 2006, 55, 2256–2264. [Google Scholar] [CrossRef] [PubMed]
- Li, X.Y.; Zhao, Z.X.; Huang, M.; Feng, R.; He, C.Y.; Ma, C.; Luo, S.H.; Fu, J.; Wen, B.Y.; Ren, L.; et al. Effect of Berberine on promoting the excretion of cholesterol in high-fat diet-induced hyperlipidemic hamsters. J. Transl. Med. 2015, 13, 278. [Google Scholar] [CrossRef] [PubMed]
- Kim, W.S.; Lee, Y.S.; Cha, S.H.; Jeong, H.W.; Choe, S.S.; Lee, M.R.; Oh, G.T.; Park, H.S.; Lee, K.U.; Lane, M.D.; et al. Berberine improves lipid dysregulation in obesity by controlling central and peripheral AMPK activity. Am. J. Physiol. Endocrinol. Metab. 2009, 296, E812–E819. [Google Scholar] [CrossRef] [PubMed]
- Yin, J.; Xing, H.; Ye, J. Efficacy of berberine in patients with type 2 diabetes mellitus. Metab. Clin. Exp. 2008, 57, 712–717. [Google Scholar] [CrossRef] [PubMed]
- Perez-Rubio, K.G.; Gonzalez-Ortiz, M.; Martinez-Abundis, E.; Robles-Cervantes, J.A.; Espinel-Bermudez, M.C. Effect of berberine administration on metabolic syndrome, insulin sensitivity, and insulin secretion. Metab. Syndr. Relat. Disord. 2013, 11, 366–369. [Google Scholar] [CrossRef] [PubMed]
- Rao, A. Efficacy of berberine hydrochloride on biochemical parameters in Indian type 2 diabetes patients. Endocr. Pract. 2017, 23, 18A. [Google Scholar]
- Chen, W.; Miao, Y.Q.; Fan, D.J.; Yang, S.S.; Lin, X.; Meng, L.K.; Tang, X. Bioavailability study of berberine and the enhancing effects of TPGS on intestinal absorption in rats. AAPS PharmSciTech 2011, 12, 705–711. [Google Scholar] [CrossRef] [PubMed]
- Liu, Y.T.; Hao, H.P.; Xie, H.G.; Lai, L.; Wang, Q.; Liu, C.X.; Wang, G.J. Extensive intestinal first-pass elimination and predominant hepatic distribution of berberine explain its low plasma levels in rats. Drug Metab. Dispos. 2010, 38, 1779–1784. [Google Scholar] [CrossRef] [PubMed]
- Zhou, Y.; Liu, S.; Ming, J.; Li, Y.; Deng, M.; He, B. Sustained release effects of berberine-loaded chitosan microspheres on in vitro chondrocyte culture. Drug Dev. Ind. Pharm. 2017, 43, 1703–1714. [Google Scholar] [CrossRef] [PubMed]
- Yu, F.; Ao, M.; Zheng, X.; Li, N.; Xia, J.; Li, Y.; Li, D.; Hou, Z.; Qi, Z.; Chen, X.D. PEG-lipid-PLGA hybrid nanoparticles loaded with berberine-phospholipid complex to facilitate the oral delivery efficiency. Drug Deliv. 2017, 24, 825–833. [Google Scholar] [CrossRef] [PubMed]
- Di Pierro, F.; Putignano, P.; Villanova, N.; Montesi, L.; Moscatiello, S.; Marchesini, G. Preliminary study about the possible glycemic clinical advantage in using a fixed combination of Berberis aristata and Silybum marianum standardized extracts versus only Berberis aristata in patients with type 2 diabetes. Clin. Pharmacol. 2013, 5, 167–174. [Google Scholar] [CrossRef]
- Godugu, C.; Patel, A.R.; Doddapaneni, R.; Somagoni, J.; Singh, M. Approaches to improve the oral bioavailability and effects of novel anticancer drugs berberine and betulinic acid. PLoS ONE 2014, 9, e89919. [Google Scholar] [CrossRef] [PubMed]
- Tan, L.; Wang, Y.; Ai, G.; Luo, C.; Chen, H.; Li, C.; Zeng, H.; Xie, J.; Chen, J.; Su, Z. Dihydroberberine, a hydrogenated derivative of berberine firstly identified in Phellodendri Chinese Cortex, exerts anti-inflammatory effect via dual modulation of NF-κB and MAPK signaling pathways. Int. Immunopharmacol. 2019, 75, 105802. [Google Scholar] [CrossRef] [PubMed]
- Buchanan, B.; Meng, Q.; Poulin, M.M.; Zuccolo, J.; Azike, C.G.; Gabriele, J.; Baranowski, D.C. Comparative pharmacokinetics and safety assessment of transdermal berberine and dihydroberberine. PLoS ONE 2018, 13, e0194979. [Google Scholar] [CrossRef] [PubMed]
- Zhang, Y.; Li, X.; Zou, D.; Liu, W.; Yang, J.; Zhu, N.; Huo, L.; Wang, M.; Hong, J.; Wu, P.; et al. Treatment of type 2 diabetes and dyslipidemia with the natural plant alkaloid berberine. J. Clin. Endocrinol. Metab. 2008, 93, 2559–2565. [Google Scholar] [CrossRef] [PubMed]


| Mean | SD | Minimum | Maximum | |
|---|---|---|---|---|
| Age | 26.0 | 2.6 | 23 | 30 |
| Height (cm) | 184.2 | 11.6 | 171 | 202 |
| Weight (kg) | 91.8 | 10.1 | 82.4 | 108.5 |
| Body mass index (kg/m2) | 27.1 | 3.9 | 22.6 | 33.1 |
| % fat | 17.1 | 3.5 | 12.5 | 20.9 |
| Heart rate (beats/minute) | 61.0 | 12.0 | 41 | 70 |
| Systolic blood pressure (mm Hg) | 122.3 | 11.4 | 111 | 138 |
| Diastolic blood pressure (mm Hg) | 72.4 | 8.8 | 64 | 70 |
| Energy intake (kcals/day) | 2433 | 810 | 1503 | 3695 |
| Carbohydrate intake (grams/day) | 217 | 62 | 144 | 312 |
| Protein intake (grams/day) | 121 | 34 | 66 | 153 |
| Fat intake (grams/day) | 112 | 45 | 75 | 186 |
| Raw Data | Group | Pre | p-Value |
|---|---|---|---|
| Body Mass (kg) | PLA | 90.6 ± 10.1 ‡ | 0.043 |
| D100 | 91.6 ± 10.3 | ||
| D200 | 91.4 ± 9.7 | ||
| B500 | 90.8 ± 10.0 | ||
| Resting Heart Rate (beats/minute) | PLA | 64 ± 10 | 0.21 |
| D100 | 62 ± 6 | ||
| D200 | 60 ± 5 | ||
| B500 | 57 ± 9 | ||
| Systolic Blood Pressure (mm Hg) | PLA | 120 ± 8 | 0.07 |
| D100 | 115 ± 10 | ||
| D200 | 118 ± 11 | ||
| B500 | 124 ± 10 | ||
| Diastolic Blood Pressure (mm Hg) | PLA | 72 ± 5 | 0.87 |
| D100 | 70 ± 5 | ||
| D200 | 70 ± 10 | ||
| B500 | 72 ± 7 | ||
| Glucose (mg/dL) | PLA | 91.8 ± 7.6 | 0.59 |
| D100 | 92.0 ± 8.5 | ||
| D200 | 90.6 ± 3.4 | ||
| B500 | 89.8 ± 1.8 | ||
| Berberine (ng/mL) | PLA | 0.14 ± 0.09 †,‡ | 0.006 |
| D100 | 2.60 ± 1.06 | ||
| D200 | 4.54 ± 2.24 | ||
| B500 | 0.30 ± 0.12 †,‡ | ||
| Insulin (μIU/mL) | PLA | 15.4 ± 5.4 | 0.20 |
| D100 | 16.7 ± 9.1 | ||
| D200 | 14.8 ± 4.4 | ||
| B500 | 18.4 ± 6.3 |
| PLA | D100 | D200 | B500 | |
|---|---|---|---|---|
| n | 5 | 5 | 5 | 5 |
| # of AE’s Reported | ||||
| Mild | 3 | 5 | 1 | 1 |
| Moderate | 0 | 1 | 0 | 0 |
| Severe | 0 | 0 | 0 | 0 |
| Adverse Events Breakdown | ||||
| Gastrointestinal | ||||
| Diarrhea | 0 | 0 | 0 | 0 |
| Nausea | 0 | 2 | 0 | 0 |
| Upset stomach | 0 | 0 | 1 | 0 |
| Stomach cramping | 2 | 0 | 0 | 0 |
| Pain | ||||
| Headache | 0 | 2 | 0 | 1 |
| Cardiovascular | ||||
| Abnormal heart rhythm | 1 | 0 | 0 | 0 |
| Dizziness | 0 | 2 | 0 | 0 |
| Constitutional Symptoms | ||||
| Nervousness | 0 | 0 | 0 | 0 |
| Blurred vision | 0 | 0 | 0 | 0 |
| Summary | ||||
| Total Adverse Events | 3 | 6 | 1 | 1 |
| # of Subjects Reporting AE | 2 | 2 | 1 | 1 |
| % of Subjects Reporting AE | 40% | 40% | 20% | 20% |
| Berberine (ng/mL) | 0 min | 20 min | 40 min | 60 min | 90 min | 120 min | p | |
|---|---|---|---|---|---|---|---|---|
| PLA | 0.14 ± 0.09 | 0.18 ± 0.18 | 0.20 ± 0.14 | 0.16 ± 0.13 | 0.16 ± 0.13 | 0.16 ± 0.13 | Group | 0.002 |
| B500 | 0.30 ± 0.12 | 0.32 ± 0.20 | 0.36 ± 0.15 | 0.38 ± 0.16 | 0.39 ± 0.16 | 0.32 ± 0.13 | Time | 0.18 |
| D100 | 2.6 ± 1.1 †,‡ | 3.0 ± 1.9 †,‡ | 2.3 ± 1.3 †,‡ | 2.5 ± 1.0 | 2.1 ± 0.8 | 1.9 ± 0.9 | G x T | 0.050 |
| D200 | 4.5 ± 2.2 †,‡ | 6.1 ± 2.5 †,‡,* | 6.9 ± 4.9 †,‡,* | 11.4 ± 10.7 | 7.8 ± 6.5 | 7.2 ± 6.5 | ||
| Glucose (mg/dL) | 0 min | 20 min | 40 min | 60 min | 90 min | 120 min | p | |
| PLA | 91.8 ± 7.6 | 120.4 ± 25.4 | 129.6 ± 33.0 | 102.8 ± 27.6 | 92.0 ± 23.9 | 63.4 ± 9.3 | Group | 0.92 |
| B500 | 89.8 ± 1.8 | 116.4 ± 30.1 | 125.6 ± 35.7 | 101.8 ± 30.9 | 84.0 ± 25.1 | 73.0 ± 13.7 | Time | <0.001 |
| D100 | 92.0 ± 8.5 | 121.8 ± 20.9 | 126.8 ± 24.5 | 106.4 ± 14.9 | 81.2 ± 10.1 | 69.4 ± 7.9 | G x T | 0.97 |
| D200 | 90.6 ± 3.4 | 119.2 ± 11.8 | 135.0 ± 23.3 | 110.8 ± 25.2 | 84.4 ± 13.4 | 72.6 ± 21.6 | ||
| Insulin (μIU/mL) | 0 min | 20 min | 40 min | 60 min | 90 min | 120 min | p | |
| PLA | 15.4 ± 5.4 | 47.9 ± 31.3 | 106.9 ± 26.8 | 85.0 ± 21.0 | 78.5 ± 23.5 | 35.4 ± 19.2 | Group | 0.43 |
| B500 | 18.4 ± 6.3 | 38.4 ± 26.9 | 87.1 ± 24.5 | 78.1 ± 23.0 | 58.0 ± 23.5 | 58.0 ± 23.5 | Time | <0.001 |
| D100 | 16.7 ± 9.1 | 47.2 ± 17.6 | 93.0 ± 35.2 | 84.5 ± 33.2 | 60.9 ± 23.1 | 34.6 ± 14.8 | G x T | 0.10 |
| D200 | 14.8 ± 4.4 | 69.6 ± 28.6 | 85.0 ± 9.0 | 83.9 ± 27.4 | 78.9 ± 12.6 | 53.3 ± 29.6 |
| Berberine | AUC (ng/mL × 120 min) | CMax (ng/mL) |
|---|---|---|
| PLA | 20.2 ± 16.2 | 0.22 ± 0.18 |
| B500 | 42.3 ± 17.6 | 0.40 ± 0.17 |
| D100 | 284.2 ± 115.9 | 3.8 ± 1.4 |
| D200 | 929 ± 694 | 12.0 ± 10.1 |
| p | 0.045 | 0.06 |
| Insulin | AUC (μIU/mL × 120 min) | CMax (μIU/mL) |
| PLA | 8260 ± 420 | 110.6 ± 24.3 |
| B500 | 7429 ± 1519 | 99.1 ± 6.6 |
| D100 | 8502 ± 717 | 107.2 ± 21.4 |
| D200 | 7242 ± 1263 | 98.1 ± 3.4 |
| p | 0.22 | 0.36 |
| Glucose | AUC (mg/dL × 120 min) | CMax (mg/dL) |
| PLA | 12,199 ± 1602 | 146.2 ± 13.9 |
| B500 | 12,029 ± 194 | 139.4 ± 32.8 |
| D100 | 12,381 ± 1128 | 140.8 ± 8.8 |
| D200 | 11,898 ± 2058 | 139.0 ± 16.6 |
| p | 0.92 | 0.77 |
| Variable Name | Group | Pre | Post | Group (G) (p) | Time (T) (p) | G x T (p) |
|---|---|---|---|---|---|---|
| White Blood Cell Count (103 × cells/μL) | PLA | 5.6 ± 1.0 | 5.7 ± 1.3 | 0.74 | 0.45 | 0.20 |
| D100 | 5.7 ± 1.1 | 5.9 ± 1.3 | ||||
| D200 | 6.6 ± 2.4 | 6.2 ± 2.1 | ||||
| B500 | 5.8 ± 1.2 | 5.3 ± 1.2 | ||||
| Red Blood Cell Count (103 × cells/μL) | PLA | 4.8 ± 0.2 | 4.8 ± 0.1 | 0.10 | 0.54 | 0.30 |
| D100 | 4.7 ±0.3 | 4.7 ± 0.3 | ||||
| D200 | 4.7 ± 0.3 | 4.7 ± 0.2 | ||||
| B500 | 5.0 ± 0.3 | 4.8 ± 0.4 | ||||
| Hemoglobin (g/dL) | PLA | 14.8 ± 0.5 | 14.8 ± 0.7 | 0.15 | 0.47 | 0.20 |
| D100 | 14.3 ± 0.4 | 14.5 ± 0.5 | ||||
| D200 | 14.3 ± 0.6 | 14.2 ± 0.4 | ||||
| B500 | 15.2 ± 1.0 | 14.8 ± 0.8 | ||||
| Hematocrit (%) | PLA | 43.2 ± 0.8 | 43.4 ± 1.4 | 0.20 | 0.73 | 0.19 |
| D100 | 42.2 ± 0.7 | 42.6 ± 1.4 | ||||
| D200 | 42.1 ± 1.3 | 42.0 ± 0.4 | ||||
| B500 | 44.6 ± 2.8 | 43.7 ± 3.0 | ||||
| Mean Corpuscular Volume | PLA | 89.4 ± 3.5 | 90.2 ± 3.8 | 0.87 | 0.44 | 0.71 |
| D100 | 90.1 ±4.7 | 90.0 ± 4.3 | ||||
| D200 | 90.4 ± 3.2 | 90.4 ± 3.8 | ||||
| B500 | 90.2 ± 2.8 | 90.5 ± 3.7 | ||||
| Mean Corpuscular Hemoglobin | PLA | 30.6 ± 1.6 | 30.7 ± 1.5 | 0.86 | 0.88 | 0.81 |
| D100 | 30.6 ± 1.6 | 30.5 ± 1.6 | ||||
| D200 | 30.7 ± 1.3 | 30.6 ± 1.6 | ||||
| B500 | 30.6 ± 1.6 | 30.7 ± 1.4 | ||||
| Mean Corpuscular Hemoglobin Content | PLA | 34.2 ± 0.6 | 34.1 ± 0.8 | 0.91 | 0.43 | 0.93 |
| D100 | 34.0 ± 0.6 | 34.0 ± 0.5 | ||||
| D200 | 34.0 ± 0.8 | 33.8 ± 0.7 | ||||
| B500 | 34.0 ± 0.9 | 33.9 ± 0.7 | ||||
| Red Cell Distribution Width (%) | PLA | 12.1 ± 0.4 | 12.0 ± 0.5 | 0.93 | 0.08 | 0.55 |
| D100 | 12.1 ± 0.4 | 12.0 ± 0.5 | ||||
| D200 | 12.1 ±0.4 | 12.1 ± 0.4 | ||||
| B500 | 12.0 ± 0.4 | 12.0 ± 0.4 | ||||
| Platelet Count | PLA | 242.2 ± 32.6 | 239.0 ± 37.3 | 0.85 | 0.91 | 0.55 |
| D100 | 243.4 ± 26.7 | 250.2 ± 26.5 | ||||
| D200 | 242.8 ± 23.9 | 242.0 ± 19.1 | ||||
| B500 | 247.4 ± 36.1 | 245.8 ± 30.9 | ||||
| Abs Neutrophils (cells/uL) | PLA | 2790 ± 1318 | 3046 ± 1295 | 0.45 | 0.88 | 0.38 |
| D100 | 2902 ± 719 | 2962 ± 949 | ||||
| D200 | 3926 ± 2324 | 3723 ± 2020 | ||||
| B500 | 2743 ± 737 | 2675 ± 702 | ||||
| Abs Lymphocytes (cells/uL) | PLA | 1893 ± 435 | 1805 ± 297 | 0.01 | 0.31 | 0.28 |
| D100 | 2068 ± 719 | 2173 ± 253 | ||||
| D200 | 1852 ± 528 | 1721 ± 149 | ||||
| B500 | 2268 ± 524 | 1899 ± 423 | ||||
| Abs Monocytes (cells/μL) | PLA | 477 ± 134 | 549 ± 168 | 0.92 | 0.04 | 0.007 |
| D100 | 494 ± 159 | 597 ± 225 | ||||
| D200 | 549 ± 152 | 504 ± 96 | ||||
| B500 | 545 ± 178 | 530 ± 205 | ||||
| Abs Eosinophils (cells/μL) | PLA | 218 ± 162 | 214 ± 162 | 0.17 | 0.09 | 0.62 |
| D100 | 179 ± 116 | 165 ± 96 | ||||
| D200 | 225 ± 148 | 188 ± 106 | ||||
| B500 | 183 ± 119 | 179 ± 161 | ||||
| Abs Basophils (cells/μL) | PLA | 42.8 ± 12.4 | 45.6 ± 10.9 | 0.47 | 0.94 | 0.67 |
| D100 | 38.4 ± 7.6 | 43.8 ± 12.2 | ||||
| D200 | 49.0 ± 18.5 | 44.6 ± 9.3 | ||||
| B500 | 41.2 ± 20.7 | 36.8 ± 11.6 | ||||
| Neutrophils (%) | PLA | 52.1 ± 13.2 | 52.2 ± 11.7 | 0.24 | 0.42 | 0.29 |
| D100 | 50.7 ± 7.3 | 49.1 ± 6.7 | ||||
| D200 | 56.7 ±14.4 | 57.3 ± 12.0 | ||||
| B500 | 47.5 ± 7.9 | 50.4 ± 7.8 | ||||
| Lymphocytes (%) | PLA | 34.7 ± 9.9 | 33.1 ± 7.8 | 0.17 | 0.26 | 0.32 |
| D100 | 36.7 ± 6.2 | 37.4 ± 5.2 | ||||
| D200 | 30.0 ± 9.5 | 29.8 ± 7.6 | ||||
| B500 | 39.5 ± 7.1 | 36.0 ± 4.7 | ||||
| Monocytes (%) | PLA | 8.5 ± 2.1 | 10.0 ± 3.1 | 0.12 | 0.15 | 0.60 |
| D100 | 9.0 ± 1.1 | 10.0 ± 2.9 | ||||
| D200 | 8.9 ± 2.7 | 8.8 ± 2.7 | ||||
| B500 | 9.3 ± 1.8 | 9.8 ± 2.4 | ||||
| Eosinophils (%) | PLA | 4.0 ± 3.0 | 3.9 ± 3.1 | 0.30 | 0.25 | 0.72 |
| D100 | 3.0 ± 1.4 | 2.7 ± 1.3 | ||||
| D200 | 3.6 ± 2.8 | 3.3 ± 2.5 | ||||
| B500 | 3.0 ± 1.5 | 3.1 ± 2.3 | ||||
| Basophils (%) | PLA | 0.8 ± 0.3 | 0.8 ± 0.3 | 0.37 | 0.43 | 0.95 |
| D100 | 0.7 ± 0.1 | 0.8 ± 0.3 | ||||
| D200 | 0.8 ± 0.3 | 0.8 ± 0.3 | ||||
| B500 | 0.7 ± 0.2 | 0.7 ± 0.2 |
| Variable Name | Group | Pre | Post | Group (G) (p) | Time (T) (p) | G x T (p) |
|---|---|---|---|---|---|---|
| Glucose (mg/dL) | PLA | 90.6 ± 5.3 | 65.6 ± 11.0 | 0.66 | 0.02 | 0.17 |
| D100 | 92.0 ± 5.7 | 68.8 ± 10.0 | ||||
| D200 | 81.2 ± 13.6 | 73.2 ± 20.1 | ||||
| B500 | 89.2 ± 4.2 | 73.8 ± 15.4 | ||||
| Blood Urea Nitrogen (g/dL) | PLA | 16.2 ± 2.3 | 15.6 ± 2.3 | 0.14 | 0.11 | 0.46 |
| D100 | 13.8 ± 1.5 | 13.8 ± 1.3 | ||||
| D200 | 15.4 ± 1.9 | 14.8 ± 2.2 | ||||
| B500 | 15.8 ± 2.2 | 15.2 ± 2.5 | ||||
| Creatinine (mg/dL) | PLA | 1.0 ± 0.1 | 1.0 ± 0.1 | 0.04 | 0.55 | 0.008 |
| D100 | 0.9 ± 0.1 | 1.0 ± 0.1 | ||||
| D200 | 1.0 ± 0.1 | 0.9 ± 0.1 | ||||
| B500 | 1.0 ± 0.1 | 0.9 ± 0.1 | ||||
| Glomerular Filtrate Rate | PLA | 107.2 ± 12.0 | 102.2 ± 12.8 | 0.03 | 0.30 | 0.02 |
| D100 | 115.6 ± 8.4 | 109.4 ± 8.8 | ||||
| D200 | 106.2 ± 13.0 | 111.0 ± 11.9 | ||||
| B500 | 106.6 ± 13.3 | 109.2 ±12.8 | ||||
| Sodium (mM) | PLA | 137 ± 1 | 139 ± 2 | 0.20 | <0.001 | 0.82 |
| D100 | 136 ± 2 | 139 ± 2 | ||||
| D200 | 135 ± 2 | 137 ± 2 | ||||
| B500 | 136 ± 2 | 138 ± 3 | ||||
| Potassium (mM) | PLA | 4.3 ± 0.2 | 4.0 ± 0.1 | 0.36 | 0.007 | 0.90 |
| D100 | 4.2 ± 0.2 | 3.9 ± 0.2 | ||||
| D200 | 4.3 ± 0.2 | 4.0 ± 0.2 | ||||
| B500 | 4.2 ± 0.3 | 3.9 ± 0.2 | ||||
| Chloride (mM) | PLA | 102 ± 2 | 102 ± 1 | 0.45 | 0.02 | 0.18 |
| D100 | 103 ± 2 | 103 ± 2 | ||||
| D200 | 101 ± 2 | 103 ± 2 | ||||
| B500 | 101 ± 3 | 103 ± 2 | ||||
| Carbon Dioxide (mM) | PLA | 25 ± 2 | 26 ± 3 | 0.62 | 0.16 | 0.78 |
| D100 | 25 ± 1 | 26 ± 1 | ||||
| D200 | 26 ± 1 | 27 ± 2 | ||||
| B500 | 25 ± 1 | 26 ± 3 | ||||
| Calcium (mg/dL) | PLA | 9.3 ± 0.4 | 9.7 ± 0.2 | 0.26 | 0.12 | 0.049 |
| D100 | 9.4 ± 0.2 | 9.5 ± 0.3 | ||||
| D200 | 9.3 ± 0.5 | 9.4 ± 0.3 | ||||
| B500 | 9.5 ± 0.3 | 9.5 ± 0.3 | ||||
| Total Protein (g/dL) | PLA | 6.8 ± 0.4 | 6.9 ± 0.3 | 0.94 | 0.74 | 0.22 |
| D100 | 6.8 ± 0.3 | 6.9 ± 0.3 | ||||
| D200 | 6.8 ± 0.6 | 6.8 ± 0.4 | ||||
| B500 | 7.0 ± 0.5 | 6.8 ± 0.5 | ||||
| Albumin (g/dL) | PLA | 4.6 ± 0.2 | 4.5 ± 0.1 | 0.42 | 0.38 | 0.80 |
| D100 | 4.5 ± 0.1 | 4.4 ± 0.2 | ||||
| D200 | 4.5 ± 0.2 | 4.4 ± 0.0 | ||||
| B500 | 4.6 ± 0.1 | 4.5 ± 0.1 | ||||
| Globulin (g/dL) | PLA | 2.2 ± 0.3 | 2.3 ± 0.3 | 0.62 | 0.26 | 0.17 |
| D100 | 2.3 ± 0.3 | 2.4 ± 0.3 | ||||
| D200 | 2.4 ± 0.4 | 2.4 ± 0.3 | ||||
| B500 | 2.4 ± 0.4 | 2.3 ± 0.5 | ||||
| Alb/Glob Ratio | PLA | 2.1 ± 0.2 | 2.0 ± 0.2 | 0.37 | 0.11 | 0.28 |
| D100 | 2.0 ± 0.3 | 1.8 ± 0.3 | ||||
| D200 | 1.9 ± 0.3 | 1.9 ± 0.3 | ||||
| B500 | 1.9 ± 0.3 | 2.0 ± 0.4 | ||||
| Total Bilirubin (mg/dL) | PLA | 0.9 ± 0.3 | 0.8 ± 0.3 | 0.52 | 0.14 | 0.37 |
| D100 | 0.8 ± 0.3 | 0.8 ± 0.3 | ||||
| D200 | 0.9 ± 0.4 | 0.8 ± 0.3 | ||||
| B500 | 1.0 ± 0.4 | 0.9 ± 0.4 | ||||
| Alkaline Phosphatase (U/L) | PLA | 53 ± 10 | 51 ± 10 | 0.13 | 0.16 | 0.45 |
| D100 | 51 ± 11 | 52 ± 10 | ||||
| D200 | 51 ± 13 | 50 ± 10 | ||||
| B500 | 54 ± 12 | 53 ± 13 | ||||
| AST (U/L) | PLA | 22 ± 5 | 22 ± 5 | 0.22 | 0.18 | 0.55 |
| D100 | 24 ± 7 | 24 ± 7 | ||||
| D200 | 24 ± 6 | 23 ± 5 | ||||
| B500 | 20 ± 3 | 20 ± 3 | ||||
| ALT (U/L) | PLA | 19 ± 6 | 19 ± 5 | 0.93 | 1.00 | 0.60 |
| D100 | 19 ± 7 | 20 ± 7 | ||||
| D200 | 19 ± 4 | 18 ± 3 | ||||
| B500 | 18 ± 6 | 18 ± 5 |
Publisher’s Note: MDPI stays neutral with regard to jurisdictional claims in published maps and institutional affiliations. |
© 2021 by the authors. Licensee MDPI, Basel, Switzerland. This article is an open access article distributed under the terms and conditions of the Creative Commons Attribution (CC BY) license (https://creativecommons.org/licenses/by/4.0/).
Share and Cite
Moon, J.M.; Ratliff, K.M.; Hagele, A.M.; Stecker, R.A.; Mumford, P.W.; Kerksick, C.M. Absorption Kinetics of Berberine and Dihydroberberine and Their Impact on Glycemia: A Randomized, Controlled, Crossover Pilot Trial. Nutrients 2022, 14, 124. https://doi.org/10.3390/nu14010124
Moon JM, Ratliff KM, Hagele AM, Stecker RA, Mumford PW, Kerksick CM. Absorption Kinetics of Berberine and Dihydroberberine and Their Impact on Glycemia: A Randomized, Controlled, Crossover Pilot Trial. Nutrients. 2022; 14(1):124. https://doi.org/10.3390/nu14010124
Chicago/Turabian StyleMoon, Jessica M., Kayla M. Ratliff, Anthony M. Hagele, Richard A. Stecker, Petey W. Mumford, and Chad M. Kerksick. 2022. "Absorption Kinetics of Berberine and Dihydroberberine and Their Impact on Glycemia: A Randomized, Controlled, Crossover Pilot Trial" Nutrients 14, no. 1: 124. https://doi.org/10.3390/nu14010124
APA StyleMoon, J. M., Ratliff, K. M., Hagele, A. M., Stecker, R. A., Mumford, P. W., & Kerksick, C. M. (2022). Absorption Kinetics of Berberine and Dihydroberberine and Their Impact on Glycemia: A Randomized, Controlled, Crossover Pilot Trial. Nutrients, 14(1), 124. https://doi.org/10.3390/nu14010124