
Dietary Pattern Accompanied with a High Food Variety Score Is Negatively Associated with Frailty in Older Adults


Abstract
:1. Introduction
2. Materials and Methods
2.1. Data Collection
2.2. Subjects
2.3. Frailty Classification
2.4. Dietary Assessment
2.5. Assessment of Other Variables
2.6. Statistical Analysis
3. Results
3.1. General Characteristics of Study Subjects
3.2. Dietary Patterns in the Study Population
3.3. Comparison of General Characteristics by Tertiles of Dietary Pattern Scores
3.4. FVS and Nutrient Intakes across Tertiles of Dietary Pattern Scores
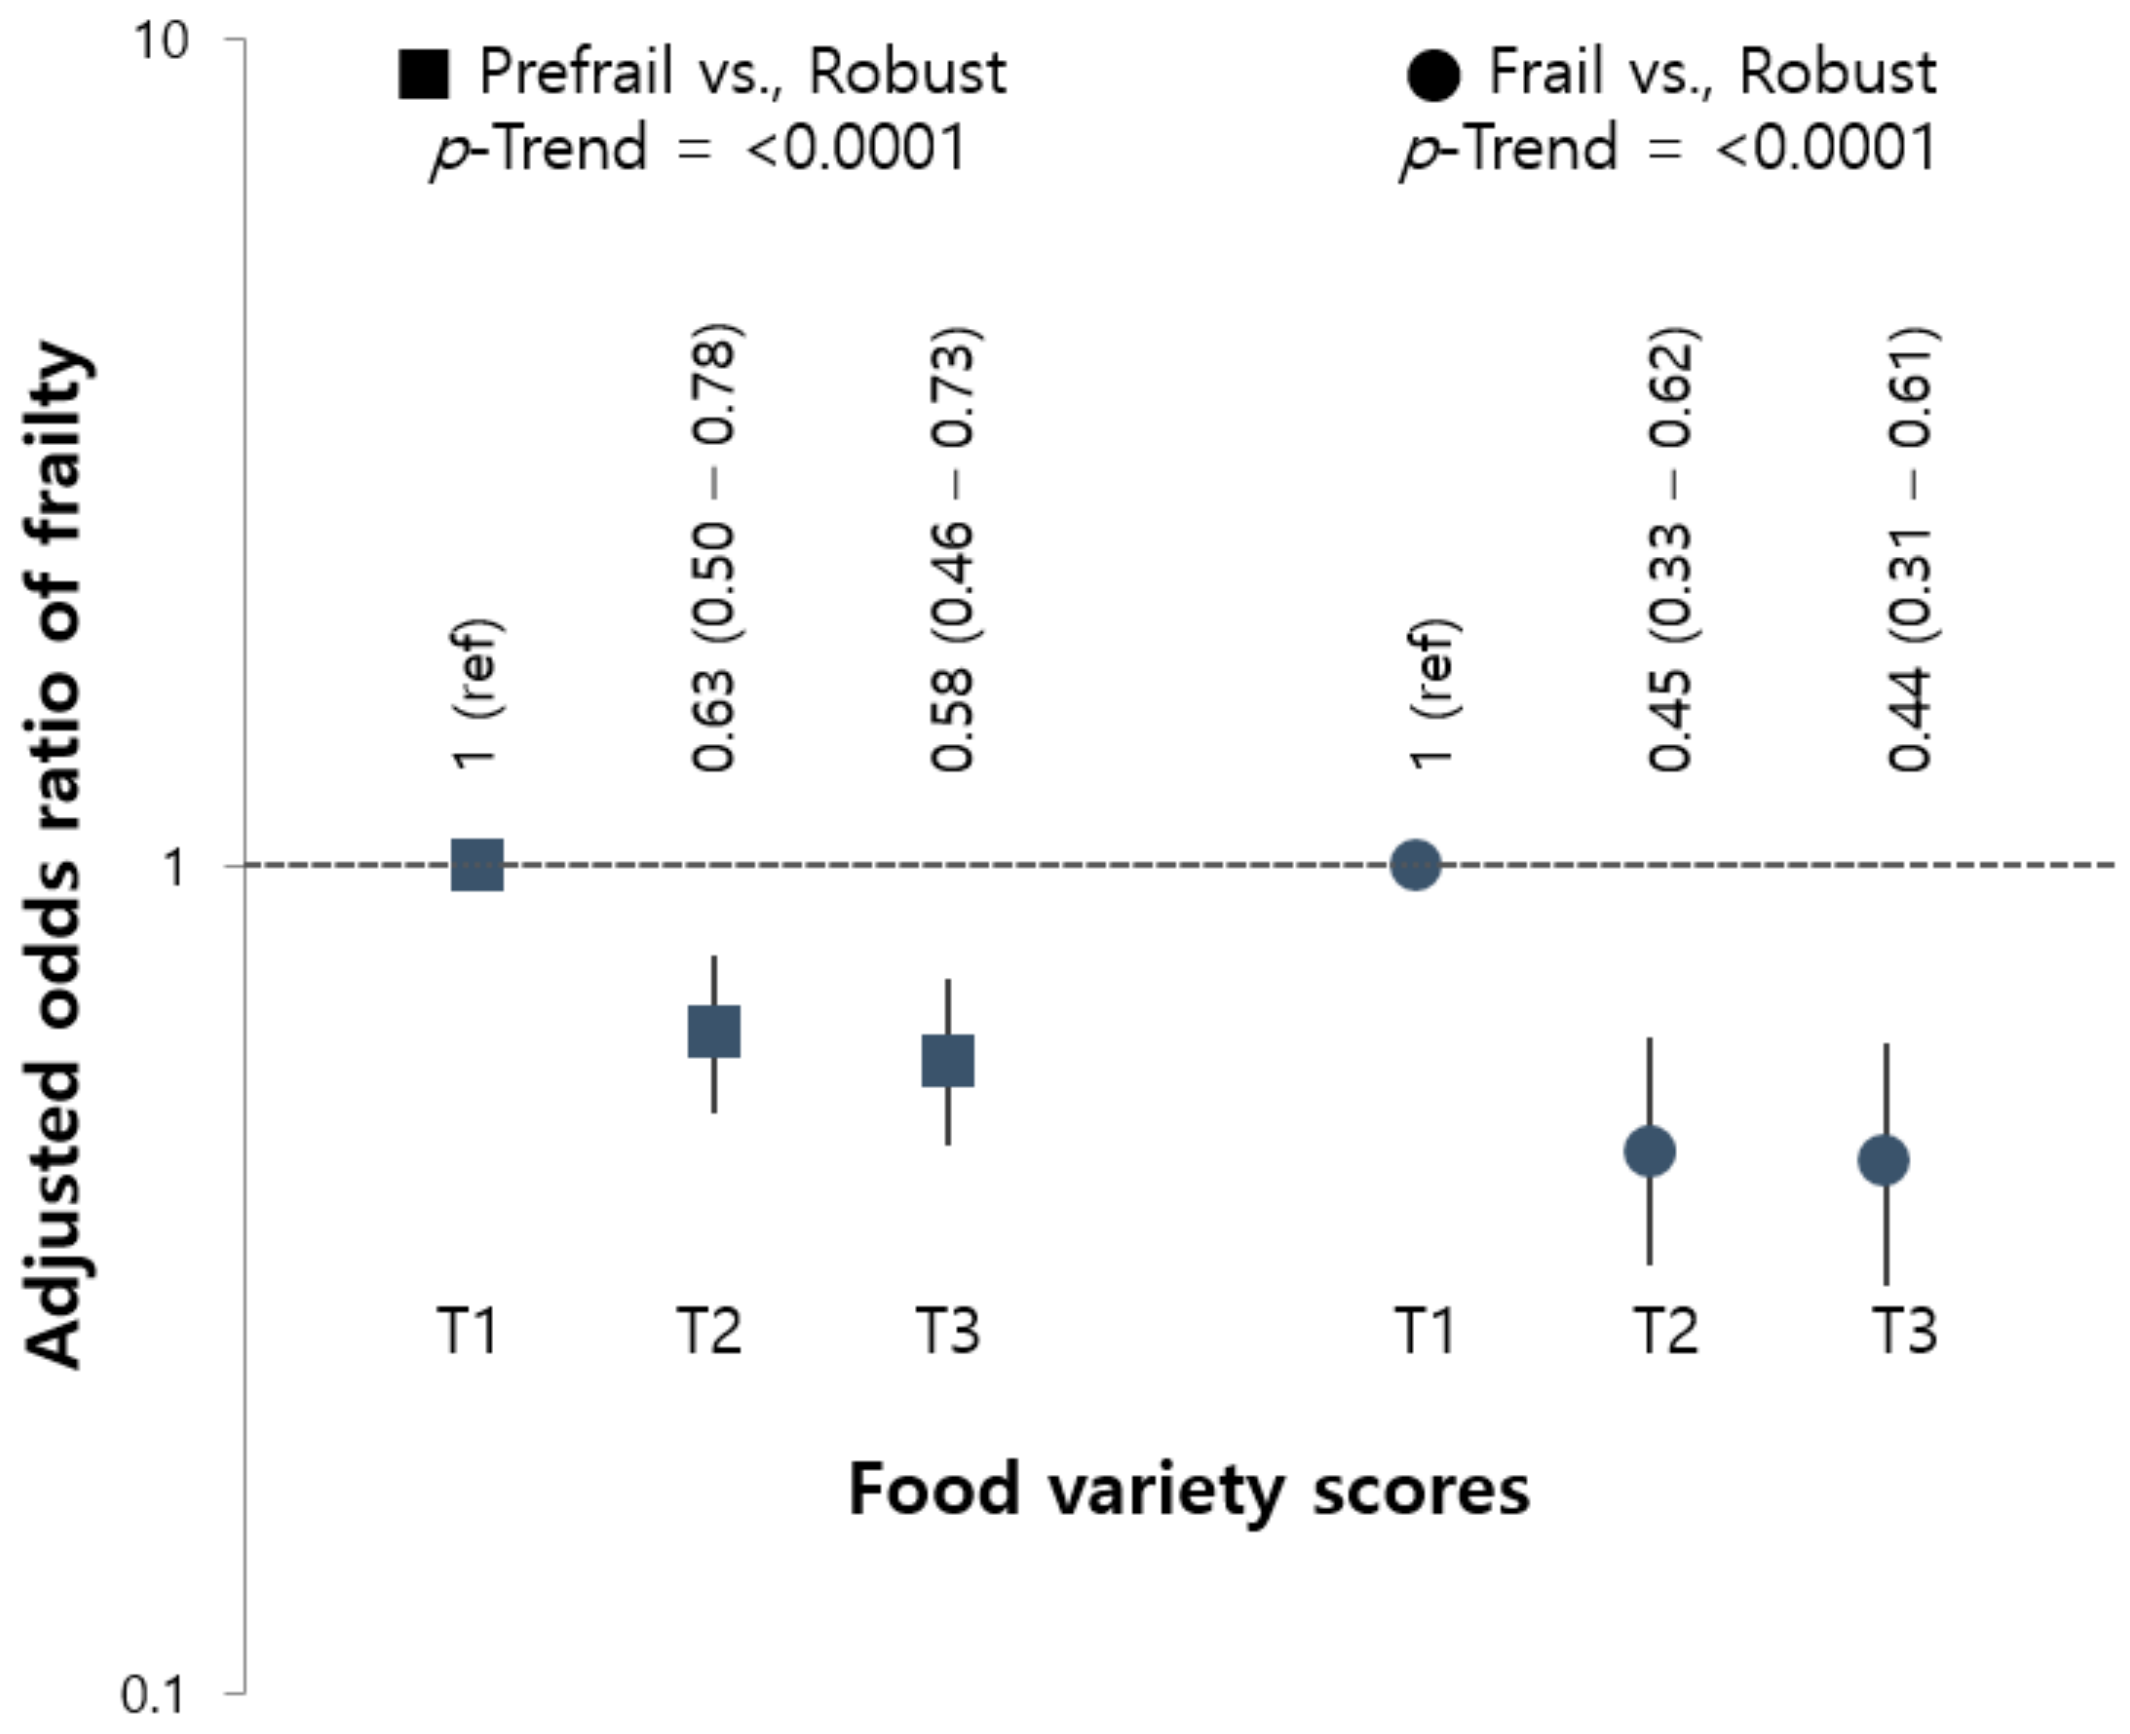
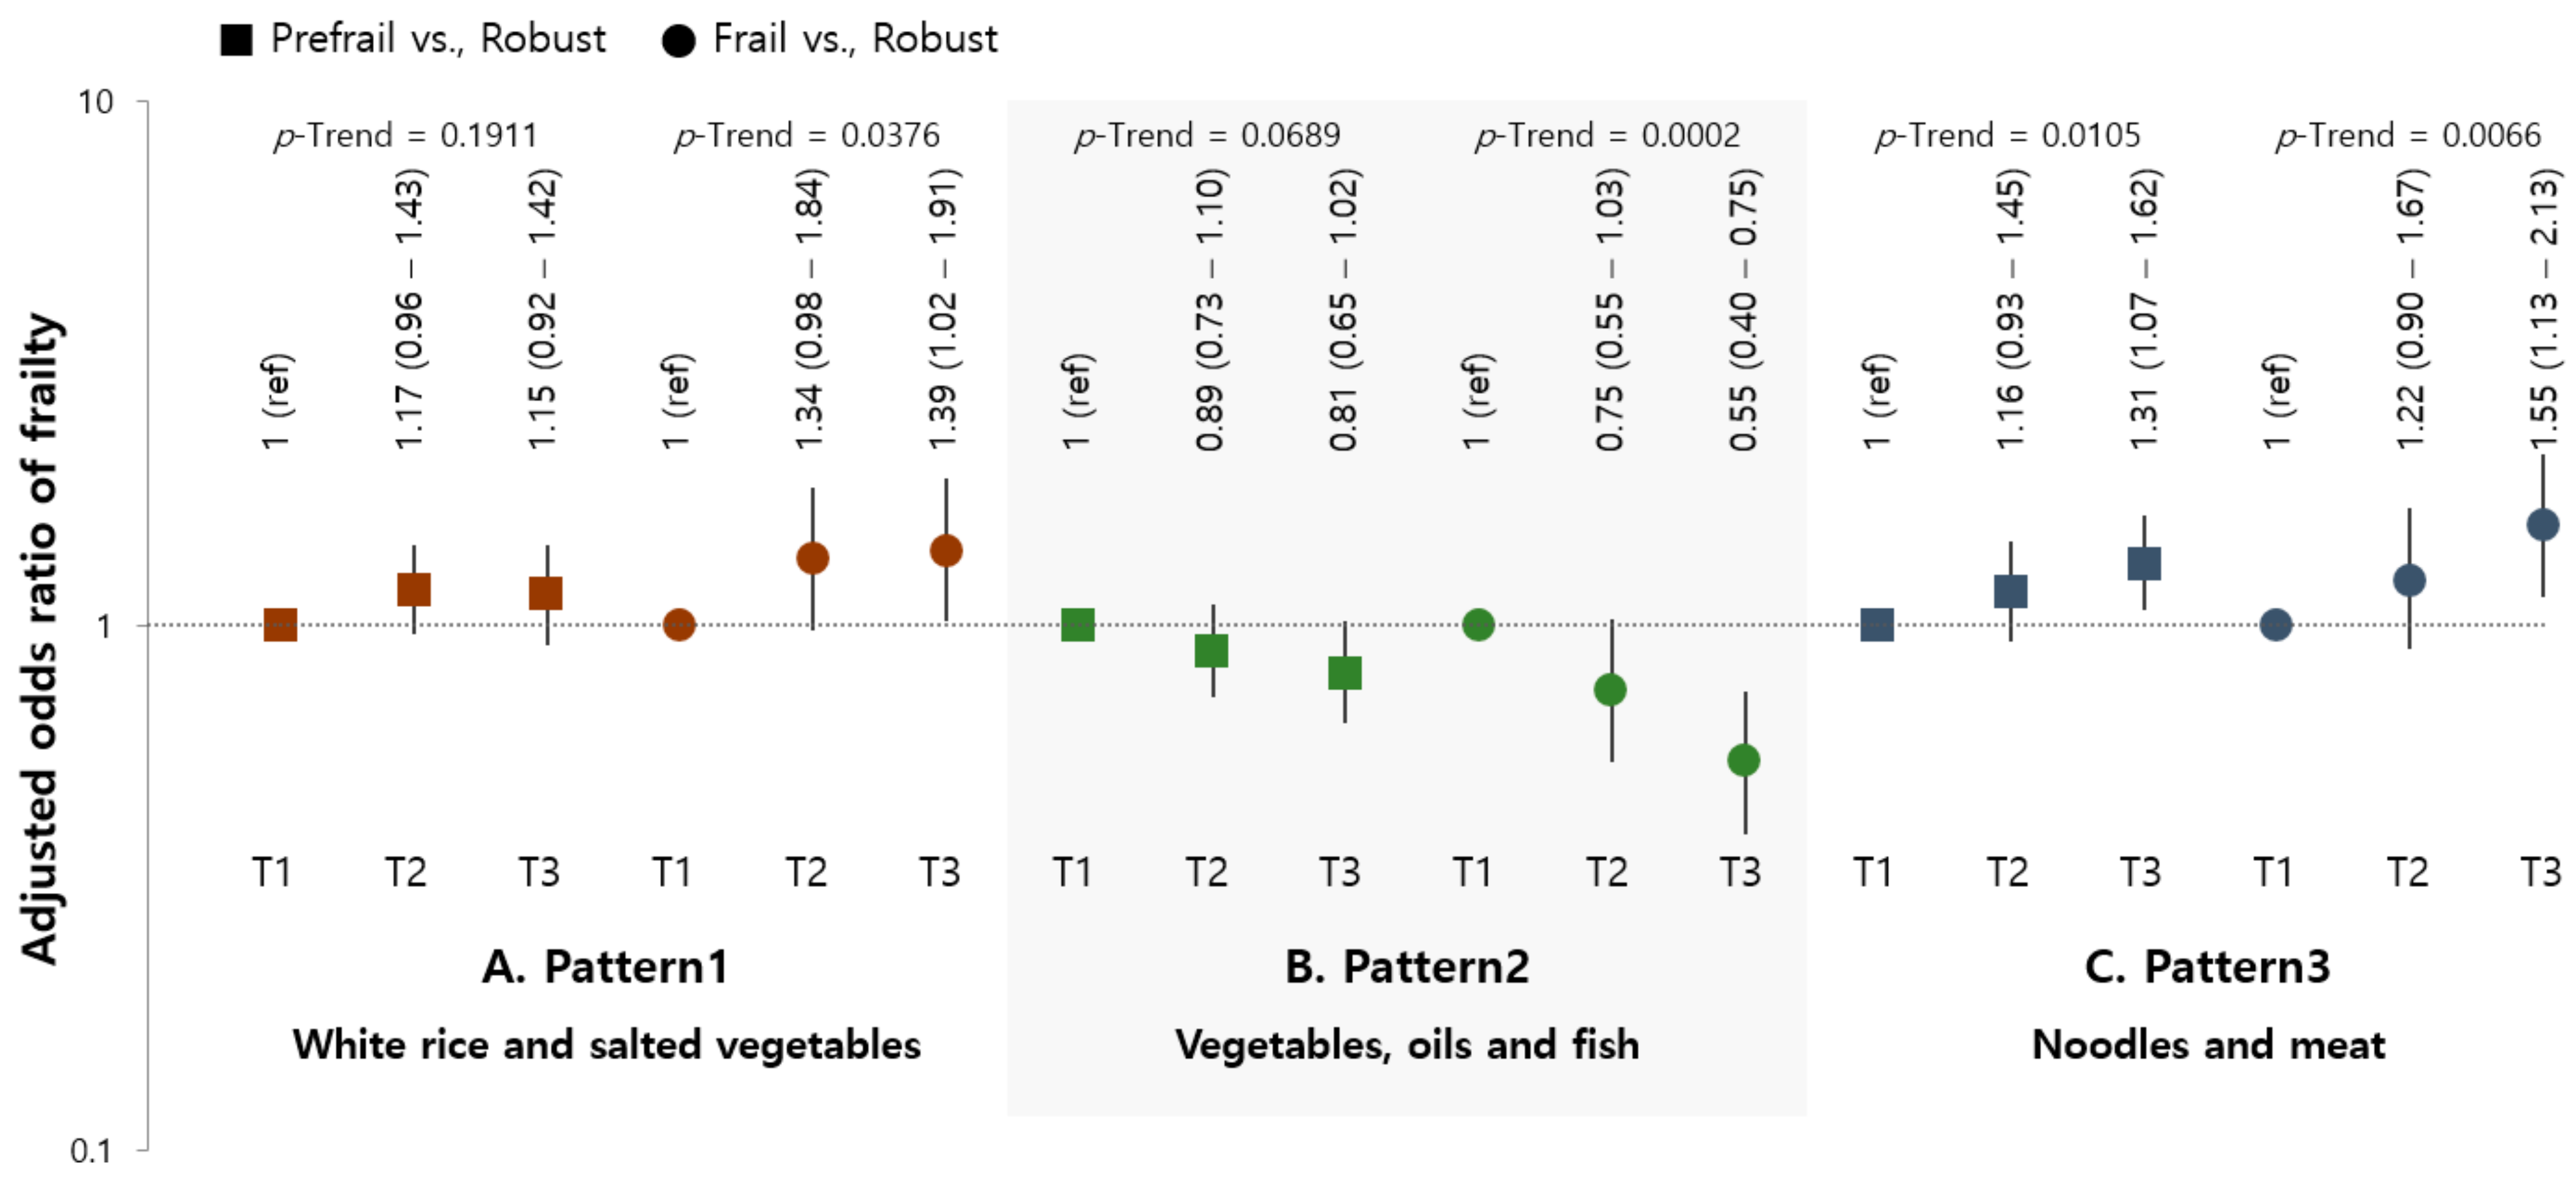
3.5. Association of Frailty with Dietary Pattern Scores Considering FVS
4. Discussion
5. Conclusions
Author Contributions
Funding
Institutional Review Board Statement
Informed Consent Statement
Data Availability Statement
Conflicts of Interest
References
- Morley, J.E.; Haren, M.T.; Rolland, Y.; Kim, M.J. Frailty. Med. Clin. 2006, 90, 837–847. [Google Scholar] [CrossRef]
- Sieber, C.C. Frailty–from concept to clinical practice. Exp. Gerontol. 2017, 87, 160–167. [Google Scholar] [CrossRef]
- Lacas, A.; Rockwood, K. Frailty in primary care: A review of its conceptualization and implications for practice. BMC Med. 2012, 10, 4. [Google Scholar] [CrossRef] [Green Version]
- Veronese, N.; Stubbs, B.; Noale, M.; Solmi, M.; Rizzoli, R.; Vaona, A.; Demurtas, J.; Crepaldi, G.; Maggi, S. Adherence to a Mediterranean diet is associated with lower incidence of frailty: A longitudinal cohort study. Clin. Nutr. 2018, 37, 1492–1497. [Google Scholar] [CrossRef] [PubMed]
- Rahi, B.; Ajana, S.; Tabue-Teguo, M.; Dartigues, J.-F.; Peres, K.; Feart, C. High adherence to a Mediterranean diet and lower risk of frailty among French older adults community-dwellers: Results from the Three-City-Bordeaux Study. Clin. Nutr. 2018, 37, 1293–1298. [Google Scholar] [CrossRef]
- León-Muñoz, L.M.; García-Esquinas, E.; López-García, E.; Banegas, J.R.; Rodríguez-Artalejo, F. Major dietary patterns and risk of frailty in older adults: A prospective cohort study. BMC Med. 2015, 13, 11. [Google Scholar] [CrossRef] [Green Version]
- Chan, R.; Leung, J.; Woo, J. Dietary Patterns and Risk of Frailty in Chinese Community-Dwelling Older People in Hong Kong: A Prospective Cohort Study. Nutrients 2015, 7, 7070–7084. [Google Scholar] [CrossRef] [PubMed] [Green Version]
- Foote, J.A.; Murphy, S.P.; Wilkens, L.R.; Basiotis, P.P.; Carlson, A. Dietary Variety Increases the Probability of Nutrient Adequacy among Adults. J. Nutr. 2004, 134, 1779–1785. [Google Scholar] [CrossRef] [PubMed] [Green Version]
- Motokawa, K.; Watanabe, Y.; Edahiro, A.; Shirobe, M.; Murakami, M.; Kera, T.; Kawai, H.; Obuchi, S.; Fujiwara, Y.; Ihara, K. Frailty severity and dietary variety in Japanese older persons: A Cross-sectional study. J. Nutr. Health Aging 2018, 22, 451–456. [Google Scholar] [CrossRef]
- Soysal, P.; Isik, A.T.; Carvalho, A.F.; Fernandes, B.S.; Solmi, M.; Schofield, P.; Veronese, N.; Stubbs, B. Oxidative stress and frailty: A systematic review and synthesis of the best evidence. Maturitas 2017, 99, 66–72. [Google Scholar] [CrossRef] [PubMed] [Green Version]
- De Martinis, M.; Franceschi, C.; Monti, D.; Ginaldi, L. Inflammation markers predicting frailty and mortality in the elderly. Exp. Mol. Pathol. 2006, 80, 219–227. [Google Scholar] [CrossRef]
- Bollwein, J.; Diekmann, R.; Kaiser, M.J.; Bauer, J.M.; Uter, W.; Sieber, C.C.; Volkert, D. Dietary quality is related to frailty in community-dwelling older adults. J. Gerontol. Ser. A Biomed. Sci. Med. Sci. 2012, 68, 483–489. [Google Scholar] [CrossRef] [PubMed] [Green Version]
- García-Esquinas, E.; Rahi, B.; Peres, K.; Colpo, M.; Dartigues, J.-F.; Bandinelli, S.; Feart, C.; Rodríguez-Artalejo, F. Consumption of fruit and vegetables and risk of frailty: A dose-response analysis of 3 prospective cohorts of community-dwelling older adults. Am. J. Clin. Nutr. 2016, 104, 132–142. [Google Scholar] [CrossRef]
- Balboa-Castillo, T.; Struijk, E.A.; Lopez-Garcia, E.; Banegas, J.R.; Rodríguez-Artalejo, F.; Guallar-Castillon, P. Low vitamin intake is associated with risk of frailty in older adults. Age Ageing 2018, 47, 872–879. [Google Scholar] [CrossRef] [Green Version]
- Kim, J.; Lee, Y.; Won, C.; Kim, M.; Kye, S.; Shim, J.-S.; Ki, S.; Yun, J.-H. Dietary Patterns and Frailty in Older Korean Adults: Results from the Korean Frailty and Aging Cohort Study. Nutrients 2021, 13, 601. [Google Scholar] [CrossRef] [PubMed]
- Kweon, S.; Kim, Y.; Jang, M.-J.; Kim, Y.; Kim, K.; Choi, S.; Chun, C.; Khang, Y.-H.; Oh, K. Data Resource Profile: The Korea National Health and Nutrition Examination Survey (KNHANES). Int. J. Epidemiol. 2014, 43, 69–77. [Google Scholar] [CrossRef] [Green Version]
- Fried, L.P.; Tangen, C.M.; Walston, J.; Newman, A.B.; Hirsch, C.; Gottdiener, J.; Seeman, T.; Tracy, R.; Kop, W.J.; Burke, G.; et al. Frailty in Older Adults: Evidence for a Phenotype. J. Gerontol. Ser. A Biol. Sci. Med. Sci. 2001, 56, M146–M157. [Google Scholar] [CrossRef]
- Jönsson, A.; Lindgren, I.; Norrving, B.; Lindgren, A. Weight loss after stroke: A population-based study from the Lund Stroke Register. Stroke 2008, 39, 918–923. [Google Scholar] [CrossRef] [PubMed] [Green Version]
- Grossi, G.; Perski, A.; Osika, W.; Savic, I. Stress-related exhaustion disorder–clinical manifestation of burnout? A review of as-sessment methods, sleep impairments, cognitive disturbances, and neuro-biological and physiological changes in clinical burnout. Scand. J. Psychol. 2015, 56, 626–636. [Google Scholar] [CrossRef]
- Chen, L.-K.; Liu, L.-K.; Woo, J.; Assantachai, P.; Auyeung, T.-W.; Bahyah, K.S.; Chou, M.-Y.; Chen, L.-Y.; Hsu, P.-S.; Krairit, O.; et al. Sarcopenia in Asia: Consensus Report of the Asian Working Group for Sarcopenia. J. Am. Med. Dir. Assoc. 2014, 15, 95–101. [Google Scholar] [CrossRef]
- Kim, S.-H.; Ahn, J.; Ock, M.; Shin, S.; Park, J.; Luo, N.; Jo, M.-W. The EQ-5D-5L valuation study in Korea. Qual. Life Res. 2016, 25, 1845–1852. [Google Scholar] [CrossRef] [PubMed]
- Savela, S.L.; Koistinen, P.; Stenholm, S.; Tilvis, R.S.; Strandberg, A.Y.; Pitkälä, K.H.; Salomaa, V.V.; Strandberg, T.E. Leisure-time physical activity in midlife is related to old age frailty. J. Gerontol. Ser. A Biomed. Sci. Med. Sci. 2013, 68, 1433–1438. [Google Scholar] [CrossRef] [PubMed] [Green Version]
- Krebs-Smith, S.M.; Smiciklas-Wright, H.; Guthrie, H.A.; Krebs-Smith, J. The effects of variety in food choices on dietary quality. J. Am. Diet. Assoc. 1987, 87, 897–903. [Google Scholar] [CrossRef]
- Lo, Y.; Hsieh, Y.; Hsu, L.; Chuang, S.; Chang, H.; Hsu, C.; Chen, C.; Pan, W. Dietary pattern associated with frailty: Results from nutrition and health survey in Taiwan. J. Am. Geriatr. Soc. 2017, 65, 2009–2015. [Google Scholar] [CrossRef]
- Chai, W.; Morimoto, Y.; Cooney, R.V.; Franke, A.A.; Shvetsov, Y.B.; Le Marchand, L.; Haiman, C.A.; Kolonel, L.N.; Goodman, M.T.; Maskarinec, G. Dietary Red and Processed Meat Intake and Markers of Adiposity and Inflammation: The Multiethnic Cohort Study. J. Am. Coll. Nutr. 2017, 36, 378–385. [Google Scholar] [CrossRef] [PubMed]
- Tan, B.L.; Norhaizan, M.E.; Liew, W.-P.-P. Nutrients and Oxidative Stress: Friend or Foe? Oxidative Med. Cell. Longev. 2018, 2018, 9719584. [Google Scholar] [CrossRef]
- Kim, S.H.; Kim, J.Y.; Ryu, K.A.; Sohn, C.M. Evaluation of the dietary diversity and nutrient intakes in obese adults. Korean J. Community Nutr. 2007, 12, 583. [Google Scholar]
- Bernstein, M.A.; Tucker, K.L.; Ryan, N.D.; O’Neill, E.F.; Clements, K.M.; Nelson, M.E.; Evans, W.J.; Singh, M.A.F. Higher dietary variety is associated with better nutritional status in frail elderly people. J. Am. Diet. Assoc. 2002, 102, 1096–1104. [Google Scholar] [CrossRef]
- Ferrucci, L.; Penninx, B.W.; Volpato, S.; Harris, T.B.; Bandeen-Roche, K.; Balfour, J.; Leveille, S.G.; Fried, L.P.; Md, J.M.G. Change in muscle strength explains accelerated decline of physical function in older women with high interleukin-6 serum levels. J. Am. Geriatr. Soc. 2002, 50, 1947–1954. [Google Scholar] [CrossRef] [Green Version]
- Walston, J.; McBurnie, M.A.; Newman, A.; Tracy, R.P.; Kop, W.J.; Hirsch, C.H.; Gottdiener, J.; Fried, L.P. Frailty and activation of the in-flammation and coagulation systems with and without clinical comorbidities: Results from the Cardiovascular Health Study. Arch. Intern. Med. 2002, 162, 2333–2341. [Google Scholar] [CrossRef]
- Bartali, B.; Frongillo, E.A.; Bandinelli, S.; Lauretani, F.; Semba, R.D.; Fried, L.P.; Ferrucci, L. Low nutrient intake is an essential compo-nent of frailty in older persons. J. Gerontol. Ser. A Biol. Sci. Med. Sci. 2006, 61, 589–593. [Google Scholar] [CrossRef] [PubMed]
- Kobayashi, S.; Asakura, K.; Suga, H.; Sasaki, S. High protein intake is associated with low prevalence of frailty among old Japa-nese women: A multicenter cross-sectional study. Nutr. J. 2013, 12, 164. [Google Scholar] [CrossRef] [PubMed] [Green Version]
- Schoufour, J.D.; Franco, O.H.; Kiefte-de Jong, J.C.; Trajanoska, K.; Stricker, B.; Brusselle, G.; Rivadeneira, F.; LaHousse, L.; Voortman, T. The association between dietary protein intake, energy intake and physical frailty: Results from the Rotterdam Study. Br. J. Nutr. 2019, 121, 393–401. [Google Scholar] [CrossRef] [PubMed] [Green Version]
- Shikany, J.M.; Barrett-Connor, E.; Ensrud, K.E.; Cawthon, P.M.; Lewis, C.E.; Dam, T.L.; Shannon, J.; Redden, D.T.; Osteoporotic Fractures in Men (MrOS) Research Group. Macronutrients, diet quality, and frailty in older men. J. Gerontol. Ser. A Biomed. Sci. Med. Sci. 2013, 69, 695–701. [Google Scholar] [CrossRef]
- Korea Health Industry Development Institute. National Food & Nutrition Statistics: Based on 2009 Korea National Health and Nutrition Examination Survey; Korea Health Industry Development Institute: Osong, Korea, 2011. [Google Scholar]

| Variables | Total (n = 4632) |
|---|---|
| Age (years, mean ± SE) | 72.5 ± 0.1 |
| Age range | |
| 65–69 | 1538 (33.6) |
| 70–79 | 2411 (51.9) |
| ≥80 | 683 (14.5) |
| Gender | |
| Male | 2184 (48.8) |
| Female | 2448 (51.2) |
| Living status | |
| Living alone | 990 (17.5) |
| Living with others | 3642 (82.5) |
| Residence | |
| Rural | 1300 (21.6) |
| Urban | 3332 (78.4) |
| Education | |
| ≤Elementary school | 2708 (56.2 |
| ≥Middle school | 1924 (43.8) |
| Family income | |
| ≤The lowest quartile | 2164 (44.9) |
| ≥Middle–low | 2468 (55.1) |
| Current smoking status | |
| Current smoker | 439 (9.6) |
| Non-current smoker | 4193 (90.4) |
| High-risk alcohol consumption | |
| Yes | 187 (4.1) |
| No | 4444 (95.9) |
| Body mass index (kg/m2, mean ± SE) | 24.0 ± 0.1 |
| Body mass index range | |
| <18.5 | 120 (2.6) |
| 18.5–24.9 | 2833 (61.7) |
| ≥25.0 | 1679 (35.7) |
| Comorbidity | |
| Yes | 925 (19.7) |
| No | 3707 (80.3) |
| Food Group | Pattern 1 | Pattern 2 | Pattern 3 |
|---|---|---|---|
| White Rice and Kimchi | Vegetables, Oils, and Fish | Noodles and Meat | |
| White rice | 0.83902 | −0.27383 | |
| Grains | |||
| Noodles and dumplings | −0.2601 | 0.54391 | |
| Flour, bread, and rice cakes | −0.41547 | ||
| Hamburgers, pizza, and snacks | |||
| Potatoes | −0.30472 | ||
| Sweets | |||
| Beans | |||
| Nuts | −0.3071 | −0.33496 | |
| Non-salted vegetables | 0.61885 | ||
| Kimchi and salted vegetables | 0.32283 | ||
| Mushrooms | |||
| Fruits | −0.40244 | −0.34568 | |
| Meats | 0.42253 | ||
| Processed meats | |||
| Eggs | −0.32273 | ||
| Fish and shellfish | 0.47125 | ||
| Seaweed | |||
| Milk and dairy products | −0.38096 | ||
| Oils | 0.51915 | ||
| Alcohol | 0.27234 | 0.38311 | |
| Coffee and tea | 0.37365 | ||
| Sugar-sweetened beverages | |||
| Seasonings | 0.53593 | ||
| Variance explained (%) | 8.15% | 5.85% | 5.53% |
| Variables | Dietary Pattern Score | |||||||||||
|---|---|---|---|---|---|---|---|---|---|---|---|---|
| Pattern 1 White Rice and Salted Vegetables | Pattern 2 Vegetables, Oils, and Fish | Pattern 3 Noodles and Meat | ||||||||||
| Tertile 1 (Lowest) (n = 1544) | Tertile 2 (Middle) (n = 1544) | Tertile 3 (Highest) (n = 1544) | p-Value | Tertile 1 (Lowest) (n = 1544) | Tertile 2 (Middle) (n = 1544) | Tertile 3 (Highest) (n = 1544) | p-Value | Tertile 1 (Lowest) (n = 1544) | Tertile 2 (Middle) (n = 1544) | Tertile 3 (Highest) (n = 1544) | p-Value | |
| Age (years, mean ± SE) | 71.6 ± 0.2 | 72.5 ± 0.2 | 73.6 ± 0.1 | <0.0001 | 73.1 ± 0.1 | 72.7 ± 0.2 | 71.8 ± 0.2 | <0.0001 | 72.2 ± 0.2 | 72.9 ± 0.1 | 72.5 ± 0.2 | 0.0037 |
| Age range (years) | ||||||||||||
| 65–69 | 622 (41.3) | 518 (33.6) | 398 (25.6) | <0.0001 | 415 (27.9) | 516 (32.7) | 607 (39.9) | <0.0001 | 548 (36.3) | 487 (30.8) | 503 (33.7) | 0.0448 |
| 70–79 | 745 (47.1) | 811 (53.1) | 855 (55.7) | 850 (55.4) | 807 (52.3) | 754 (48.2) | 796 (51.0) | 809 (53.8) | 806 (50.9) | |||
| 80≤ | 177 (11.5) | 215 (13.3) | 291 (18.7) | 279 (16.7) | 221 (15.0) | 183 (11.9) | 200 (12.7) | 248 (15.4) | 235 (15.4) | |||
| Gender (male, %) | 612 (41.2) | 782 (52.5) | 790 (52.8) | <0.0001 | 630 (41.0) | 736 (50.4) | 818 (54.7) | <0.0001 | 581 (39.6) | 710 (47.5) | 893 (59.2) | <0.0001 |
| Living status (living alone, %) | 317 (17.3) | 314 (16.7) | 359 (18.5) | 0.4475 | 414 (21.9) | 276 (14.8) | 300 (16.1) | <0.0001 | 343 (18.0) | 326 (17.3) | 321 (17.3) | 0.8580 |
| Residence (rural, %) | 302 (15.0) | 442 (21.4) | 556 (28.7) | <0.0001 | 495 (24.2) | 419 (21.7) | 386 (19.2) | 0.0147 | 393 (19.8) | 453 (22.4) | 454 (22.7) | 0.1996 |
| Education (≤elementary school, %) | 707 (43.5) | 910 (56.5) | 1091 (68.9) | <0.0001 | 1042 (64.9) | 896 (57.1) | 770 (46.8) | <0.0001 | 895 (54.4) | 951 (60.3) | 862 (53.7) | 0.0031 |
| Family income level (≤low, %) | 549 (34.9) | 715 (44.9) | 900 (55.3) | <0.0001 | 851 (52.0) | 695 (43.1) | 618 (39.9) | <0.0001 | 721 (44.0) | 750 (47.5) | 693 (43.2) | 0.0974 |
| Current smoker (%) | 102 (2.3) | 145 (9.8) | 192 (12.3) | <0.0001 | 135 (9.0) | 138 (8.8) | 166 (11.0) | 0.1539 | 94 (6.0) | 127 (8.8) | 218 (14.0) | <0.0001 |
| High-risk alcohol consumption (%) | 42 (2.6) | 61 (3.8) | 84 (5.7) | 0.0002 | 38 (2.4) | 47 (3.1) | 102 (6.6) | <0.0001 | 38 (2.3) | 43 (2.8) | 106 (7.0) | <0.0001 |
| Body mass index (kg/m2, mean ± SE) | 24.2 ± 0.1 | 24.1 ± 0.1 | 23.9 ± 0.1 | 0.1164 | 24.0 ± 0.1 | 24.0 ± 0.1 | 24.1 ± 0.1 | 0.5946 | 24.0 ± 0.1 | 24.0 ± 0.1 | 24.1 ± 0.1 | 0.6819 |
| Body mass index range (kg/m2) | ||||||||||||
| <18.5 | 28 (1.8) | 35 (2.2) | 57 (3.9) | 0.0157 | 53 (3.8) | 37 (2.4) | 30 (1.7) | 0.0222 | 35 (2.1) | 43 (3.1) | 42 (2.7) | 0.5585 |
| 18.5–24.9 | 934 (60.9) | 949 (61.9) | 950 (62.2) | 923 (59.7) | 963 (63.2) | 947 (62.1) | 963 (63.1) | 930 (60.7) | 940 (61.3) | |||
| ≥25.0 | 582 (37.3) | 560 (35.8) | 537 (33.9) | 568 (36.5) | 544 (34.4) | 567 (36.2) | 546 (34.8) | 571 (36.2) | 562 (36.0) | |||
| Comorbidity (%) | 334 (21.2) | 307 (20.1) | 284 (17.6) | 0.0692 | 324 (20.6) | 328 (21.4) | 273 (17.1) | 0.0192 | 340 (21.2) | 296 (18.9) | 289 (19.0) | 0.2871 |
| Dietary Pattern Score | ||||||||||||
|---|---|---|---|---|---|---|---|---|---|---|---|---|
| Pattern 1 White Rice and Salted Vegetables | Pattern 2 Vegetables, Oils, and Fish | Pattern 3 Noodles and Meat | ||||||||||
| Tertile 1 | Tertile 2 | Tertile 3 | p-Trend | Tertile 1 | Tertile 2 | Tertile 3 | p-Trend | Tertile 1 | Tertile 2 | Tertile 3 | p-Trend | |
| Food variety score | 34.7 ± 0.4 | 32.9 ± 0.4 | 25.5 ± 0.4 | <0.0001 | 24.4 ± 0.4 | 32.7 ± 0.4 | 36.0 ± 0.5 | <0.0001 | 29.9 ± 0.4 | 31.4 ± 0.4 | 32.0 ± 0.4 | 0.0077 |
| Total energy (kcal) | 1803.4 ± 21.0 | 1722.2 ± 18.4 | 1548.4 ± 19.3 | <0.0001 | 1655.0 ± 19.7 | 1701.7 ± 19.2 | 1719.9 ± 20.1 | <0.0001 | 1659.0 ± 21.5 | 1648.4 ± 17.8 | 1771.2 ± 20.9 | <0.0001 |
| percentage from energy | ||||||||||||
| Carbohydrates (%) | 68.7 ± 0.3 | 71.1 ± 0.3 | 74.8 ± 0.3 | <0.0001 | 76.3 ± 0.3 | 72.2 ± 0.3 | 66.1 ± 0.3 | <0.0001 | 74.5 ± 0.3 | 73.4 ± 0.3 | 66.6 ± 0.3 | <0.0001 |
| Protein (%) | 13.4 ± 0.1 | 13.2 ± 0.1 | 12.1 ± 0.1 | <0.0001 | 11.2 ± 0.1 | 13.1 ± 0.1 | 14.4 ± 0.1 | <0.0001 | 13.1 ± 0.1 | 12.7 ± 0.1 | 13.0 ± 0.1 | 0.7579 |
| Fat (%) | 17.3 ± 0.2 | 13.4 ± 0.2 | 8.8 ± 0.2 | <0.0001 | 10.6 ± 0.2 | 12.9 ± 0.2 | 16.0 ± 0.3 | <0.0001 | 12.2 ± 0.2 | 11.8 ± 0.2 | 15.6 ± 0.2 | <0.0001 |
| Fiber (g) | 29.7 ± 0.5 | 25.8 ± 0.4 | 21.0 ± 0.4 | <0.0001 | 22.3 ± 0.5 | 26.2 ± 0.5 | 28.1 ± 0.5 | <0.0001 | 31.2 ± 0.5 | 23.6 ± 0.4 | 21.9 ± 0.4 | <0.0001 |
| Calcium (mg) | 507.7 ± 9.7 | 444.7 ± 9.3 | 365.4 ± 8.9 | <0.0001 | 364.0 ± 6.8 | 433.1 ± 8.1 | 520.8 ± 11.7 | <0.0001 | 515.4 ± 12.3 | 416.8 ± 7.7 | 387.6 ± 6.7 | <0.0001 |
| Phosphorus (mg) | 1003.6 ± 13.1 | 934.9 ± 11.7 | 779.2 ± 11.8 | <0.0001 | 780.2 ± 10.7 | 916.9 ± 11.7 | 1020.6 ± 14.1 | <0.0001 | 985.4 ± 14.8 | 877.7 ± 10.9 | 857.9 ± 11.6 | <0.0001 |
| Iron (mg) | 13.3 ± 0.3 | 13.7 ± 0.3 | 11.9 ± 0.2 | 0.2458 | 11.4 ± 0.2 | 13.0 ± 0.3 | 14.6 ± 0.3 | <0.0001 | 14.6 ± 0.3 | 12.7 ± 0.2 | 11.7 ± 0.2 | <0.0001 |
| Sodium (mg) | 3179.9 ± 61.9 | 3097.1 ± 60.8 | 2725.9 ± 59.1 | 0.4835 | 2465.6 ± 51.9 | 2913.5 ± 55.1 | 3615.2 ± 71.7 | <0.0001 | 2782.3 ± 62.9 | 2818.5 ± 51.9 | 3413.0 ± 64.5 | <0.0001 |
| Potassium | 3069.1 ± 47.7 | 2715.1 ± 34.8 | 2197.7 ± 34.8 | <0.0001 | 2302.9 ± 37.6 | 2680.9 ± 38.5 | 3001.7 ± 46.8 | <0.0001 | 3028.9 ± 49.3 | 2555.7 ± 36.4 | 2409.7 ± 37.2 | <0.0001 |
| Vitamin A (μg RAE) | 341.0 ± 9.9 | 318.3 ± 10.8 | 293.2 ± 22.8 | 0.9197 | 204.6 ± 11.1 | 294.7 ± 8.7 | 450.8 ± 20.6 | <0.0001 | 391.5 ± 21.7 | 292.6 ± 9.4 | 269.0 ± 10.6 | <0.0001 |
| Thiamin (mg) | 1.3 ± 0.0 | 1.5 ± 0.0 | 1.3 ± 0.0 | <0.0001 | 1.2 ± 0.0 | 1.4 ± 0.0 | 1.5 ± 0.0 | <0.0001 | 1.4 ± 0.0 | 1.4 ± 0.0 | 1.3 ± 0.0 | <0.0001 |
| Riboflavin (mg) | 1.4 ± 0.0 | 1.1 ± 0.0 | 0.8 ± 0.0 | <0.0001 | 0.9 ± 0.0 | 1.1 ± 0.0 | 1.3 ± 0.0 | <0.0001 | 1.2 ± 0.0 | 1.0 ± 0.0 | 1.1 ± 0.0 | <0.0001 |
| Niacin (mg) | 11.9 ± 0.1 | 11.8 ± 0.2 | 10.1 ± 0.2 | 0.6320 | 9.6 ± 0.2 | 11.8 ± 0.2 | 13.0 ± 0.2 | <0.0001 | 11.9 ± 0.2 | 10.8 ± 0.2 | 11.2 ± 0.2 | <0.0001 |
| Vitamin C (mg) | 91.4 ± 3.4 | 75.9 ± 3.6 | 48.7 ± 1.8 | <0.0001 | 63.2 ± 3.9 | 68.9 ± 2.3 | 84.3 ± 2.7 | <0.0001 | 97.0 ± 4.1 | 64.0 ± 2.0 | 55.6 ± 2.3 | <0.0001 |
| ω-3 PUFA (g) | 1.8 ± 0.1 | 1.5 ± 0.0 | 1.1 ± 0.1 | <0.0001 | 0.8 ± 0.0 | 1.4 ± 0.0 | 2.2 ± 0.1 | <0.0001 | 1.8 ± 0.1 | 1.4 ± 0.1 | 1.3 ± 0.0 | <0.0001 |
| ω-6 PUFA (g) | 8.6 ± 0.2 | 6.2 ± 0.1 | 3.9 ± 0.1 | <0.0001 | 4.4 ± 0.1 | 6.0 ± 0.1 | 8.3 ± 0.2 | <0.0001 | 6.5 ± 0.2 | 5.4 ± 0.1 | 6.9 ± 0.2 | 0.8982 |
| Flavonoids (mg) | 102.3 ± 2.6 | 91.2 ± 2.3 | 75.9 ± 2.3 | <0.0001 | 79.6 ± 2.6 | 91.6 ± 2.4 | 98.4 ± 2.7 | <0.0001 | 114.9 ± 3.0 | 82.0 ± 2.0 | 73.0 ± 2.1 | <0.0001 |
| Carotenoids (mg) | 11.6 ± 0.4 | 9.4 ± 0.2 | 6.8 ± 0.2 | <0.0001 | 7.3 ± 0.3 | 98.4 ± 2.7 | 11.5 ± 0.4 | <0.0001 | 11.8 ± 0.4 | 6.9 ± 0.2 | 7.0 ± 0.2 | <0.0001 |
Publisher’s Note: MDPI stays neutral with regard to jurisdictional claims in published maps and institutional affiliations. |
© 2021 by the authors. Licensee MDPI, Basel, Switzerland. This article is an open access article distributed under the terms and conditions of the Creative Commons Attribution (CC BY) license (https://creativecommons.org/licenses/by/4.0/).
Share and Cite
Jang, W.; Shin, Y.; Kim, Y. Dietary Pattern Accompanied with a High Food Variety Score Is Negatively Associated with Frailty in Older Adults. Nutrients 2021, 13, 3164. https://doi.org/10.3390/nu13093164
Jang W, Shin Y, Kim Y. Dietary Pattern Accompanied with a High Food Variety Score Is Negatively Associated with Frailty in Older Adults. Nutrients. 2021; 13(9):3164. https://doi.org/10.3390/nu13093164
Chicago/Turabian StyleJang, Won, Yoonjin Shin, and Yangha Kim. 2021. "Dietary Pattern Accompanied with a High Food Variety Score Is Negatively Associated with Frailty in Older Adults" Nutrients 13, no. 9: 3164. https://doi.org/10.3390/nu13093164
APA StyleJang, W., Shin, Y., & Kim, Y. (2021). Dietary Pattern Accompanied with a High Food Variety Score Is Negatively Associated with Frailty in Older Adults. Nutrients, 13(9), 3164. https://doi.org/10.3390/nu13093164