
Acute Metabolic Response in Adults to Toddler Milk Formulas with Alternating Higher and Lower Protein and Fat Contents, a Randomized Cross-Over Trial

 , , and
Abstract
:1. Introduction
2. Materials and Methods
2.1. Subjects
2.2. Test Meals and Interventions
2.3. Laboratory Measurements
2.4. Sample Size, Statistics and Data Analysis
3. Results
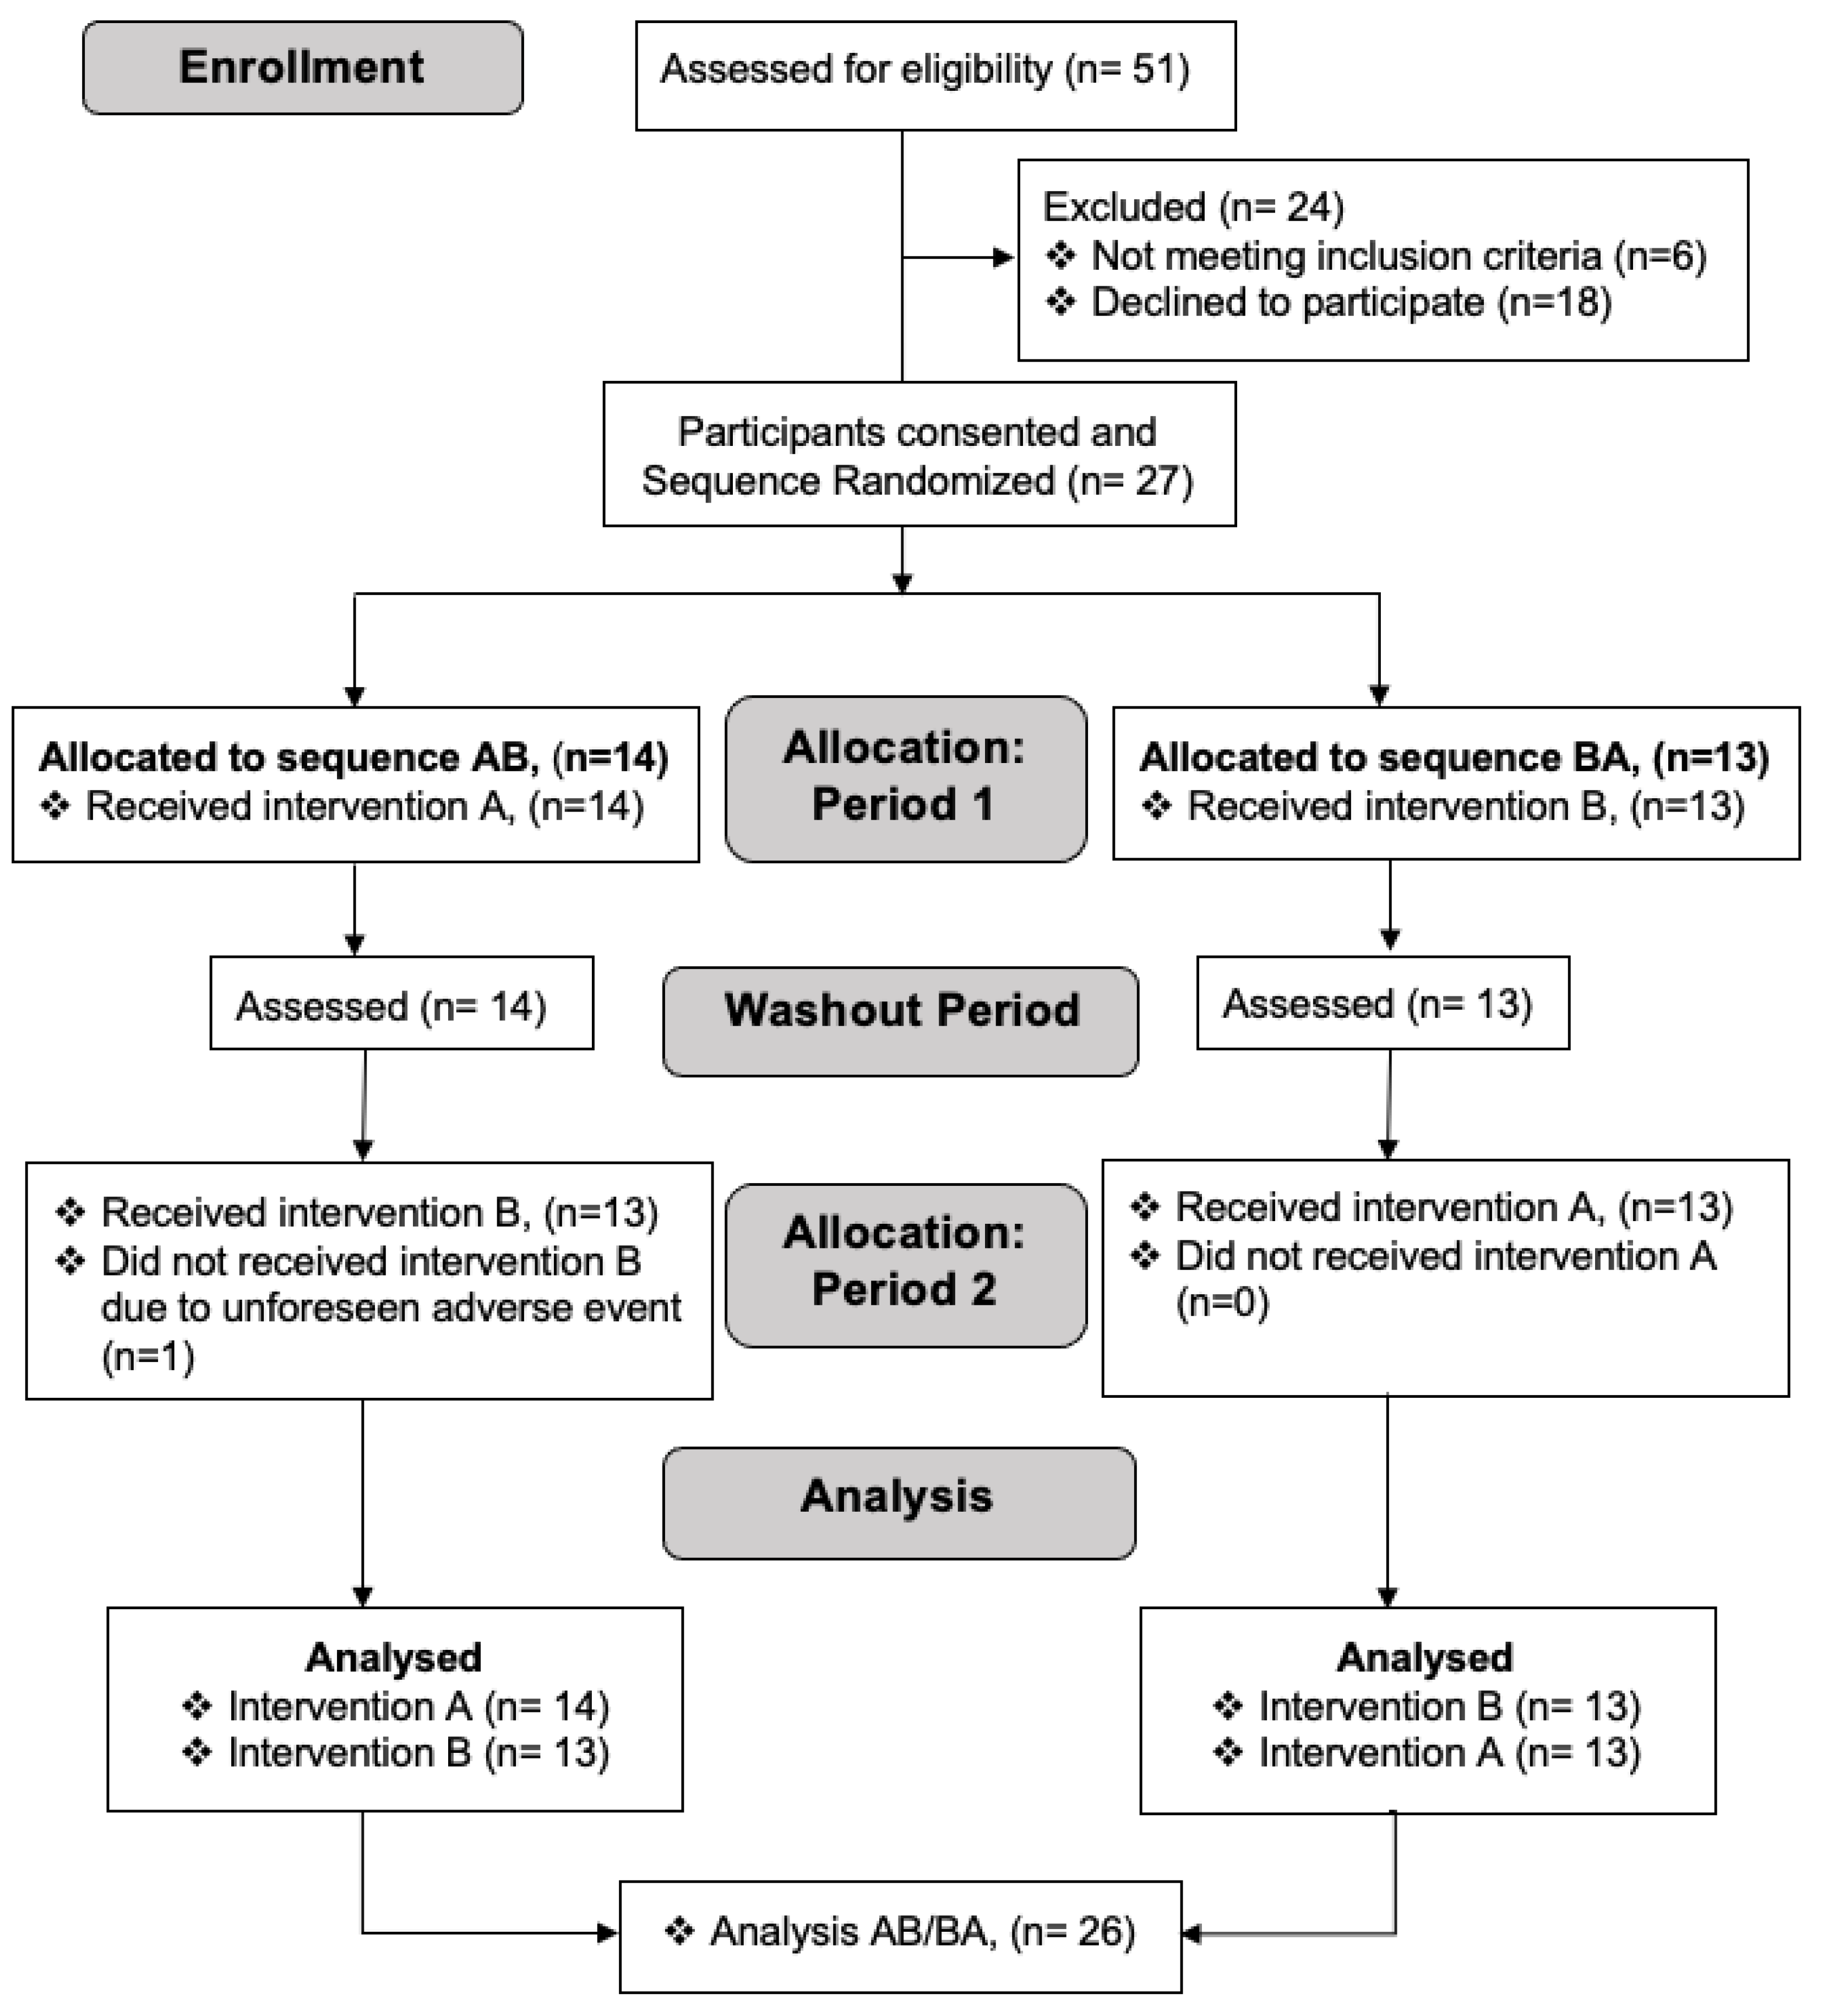
3.1. Participants
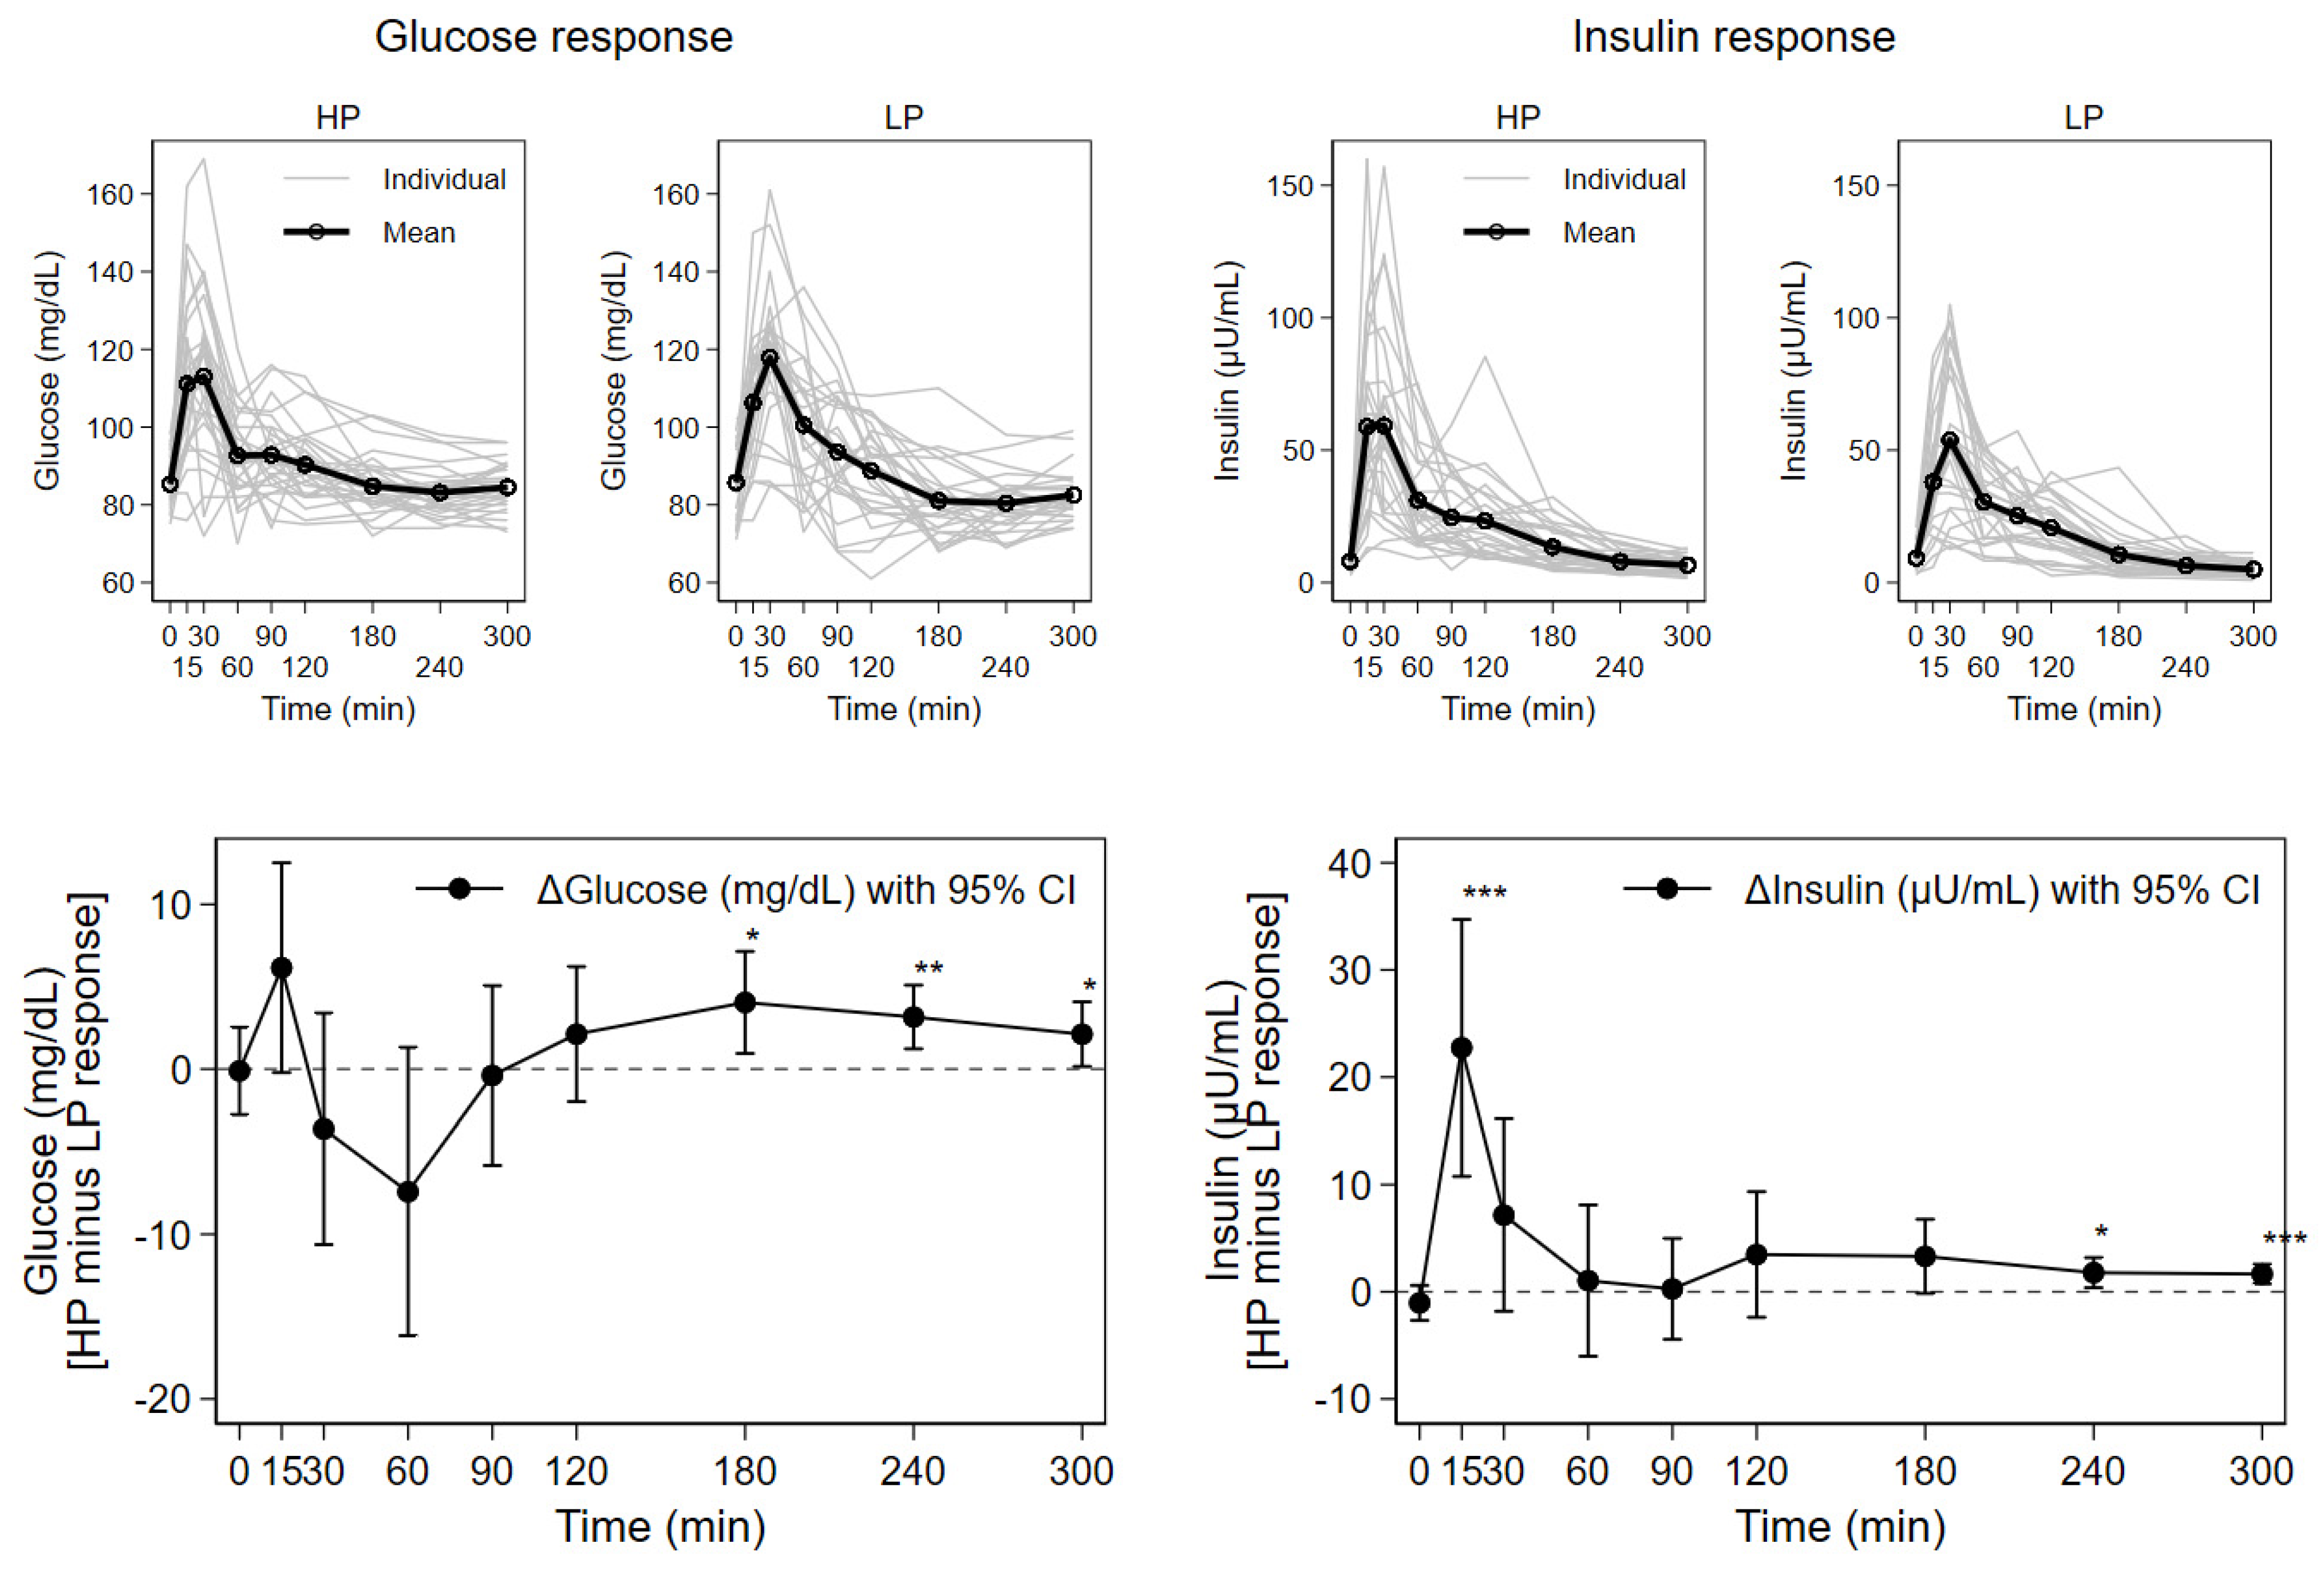
3.2. Blood Glucose, Insulin, Urea, and Triglyceride Responses
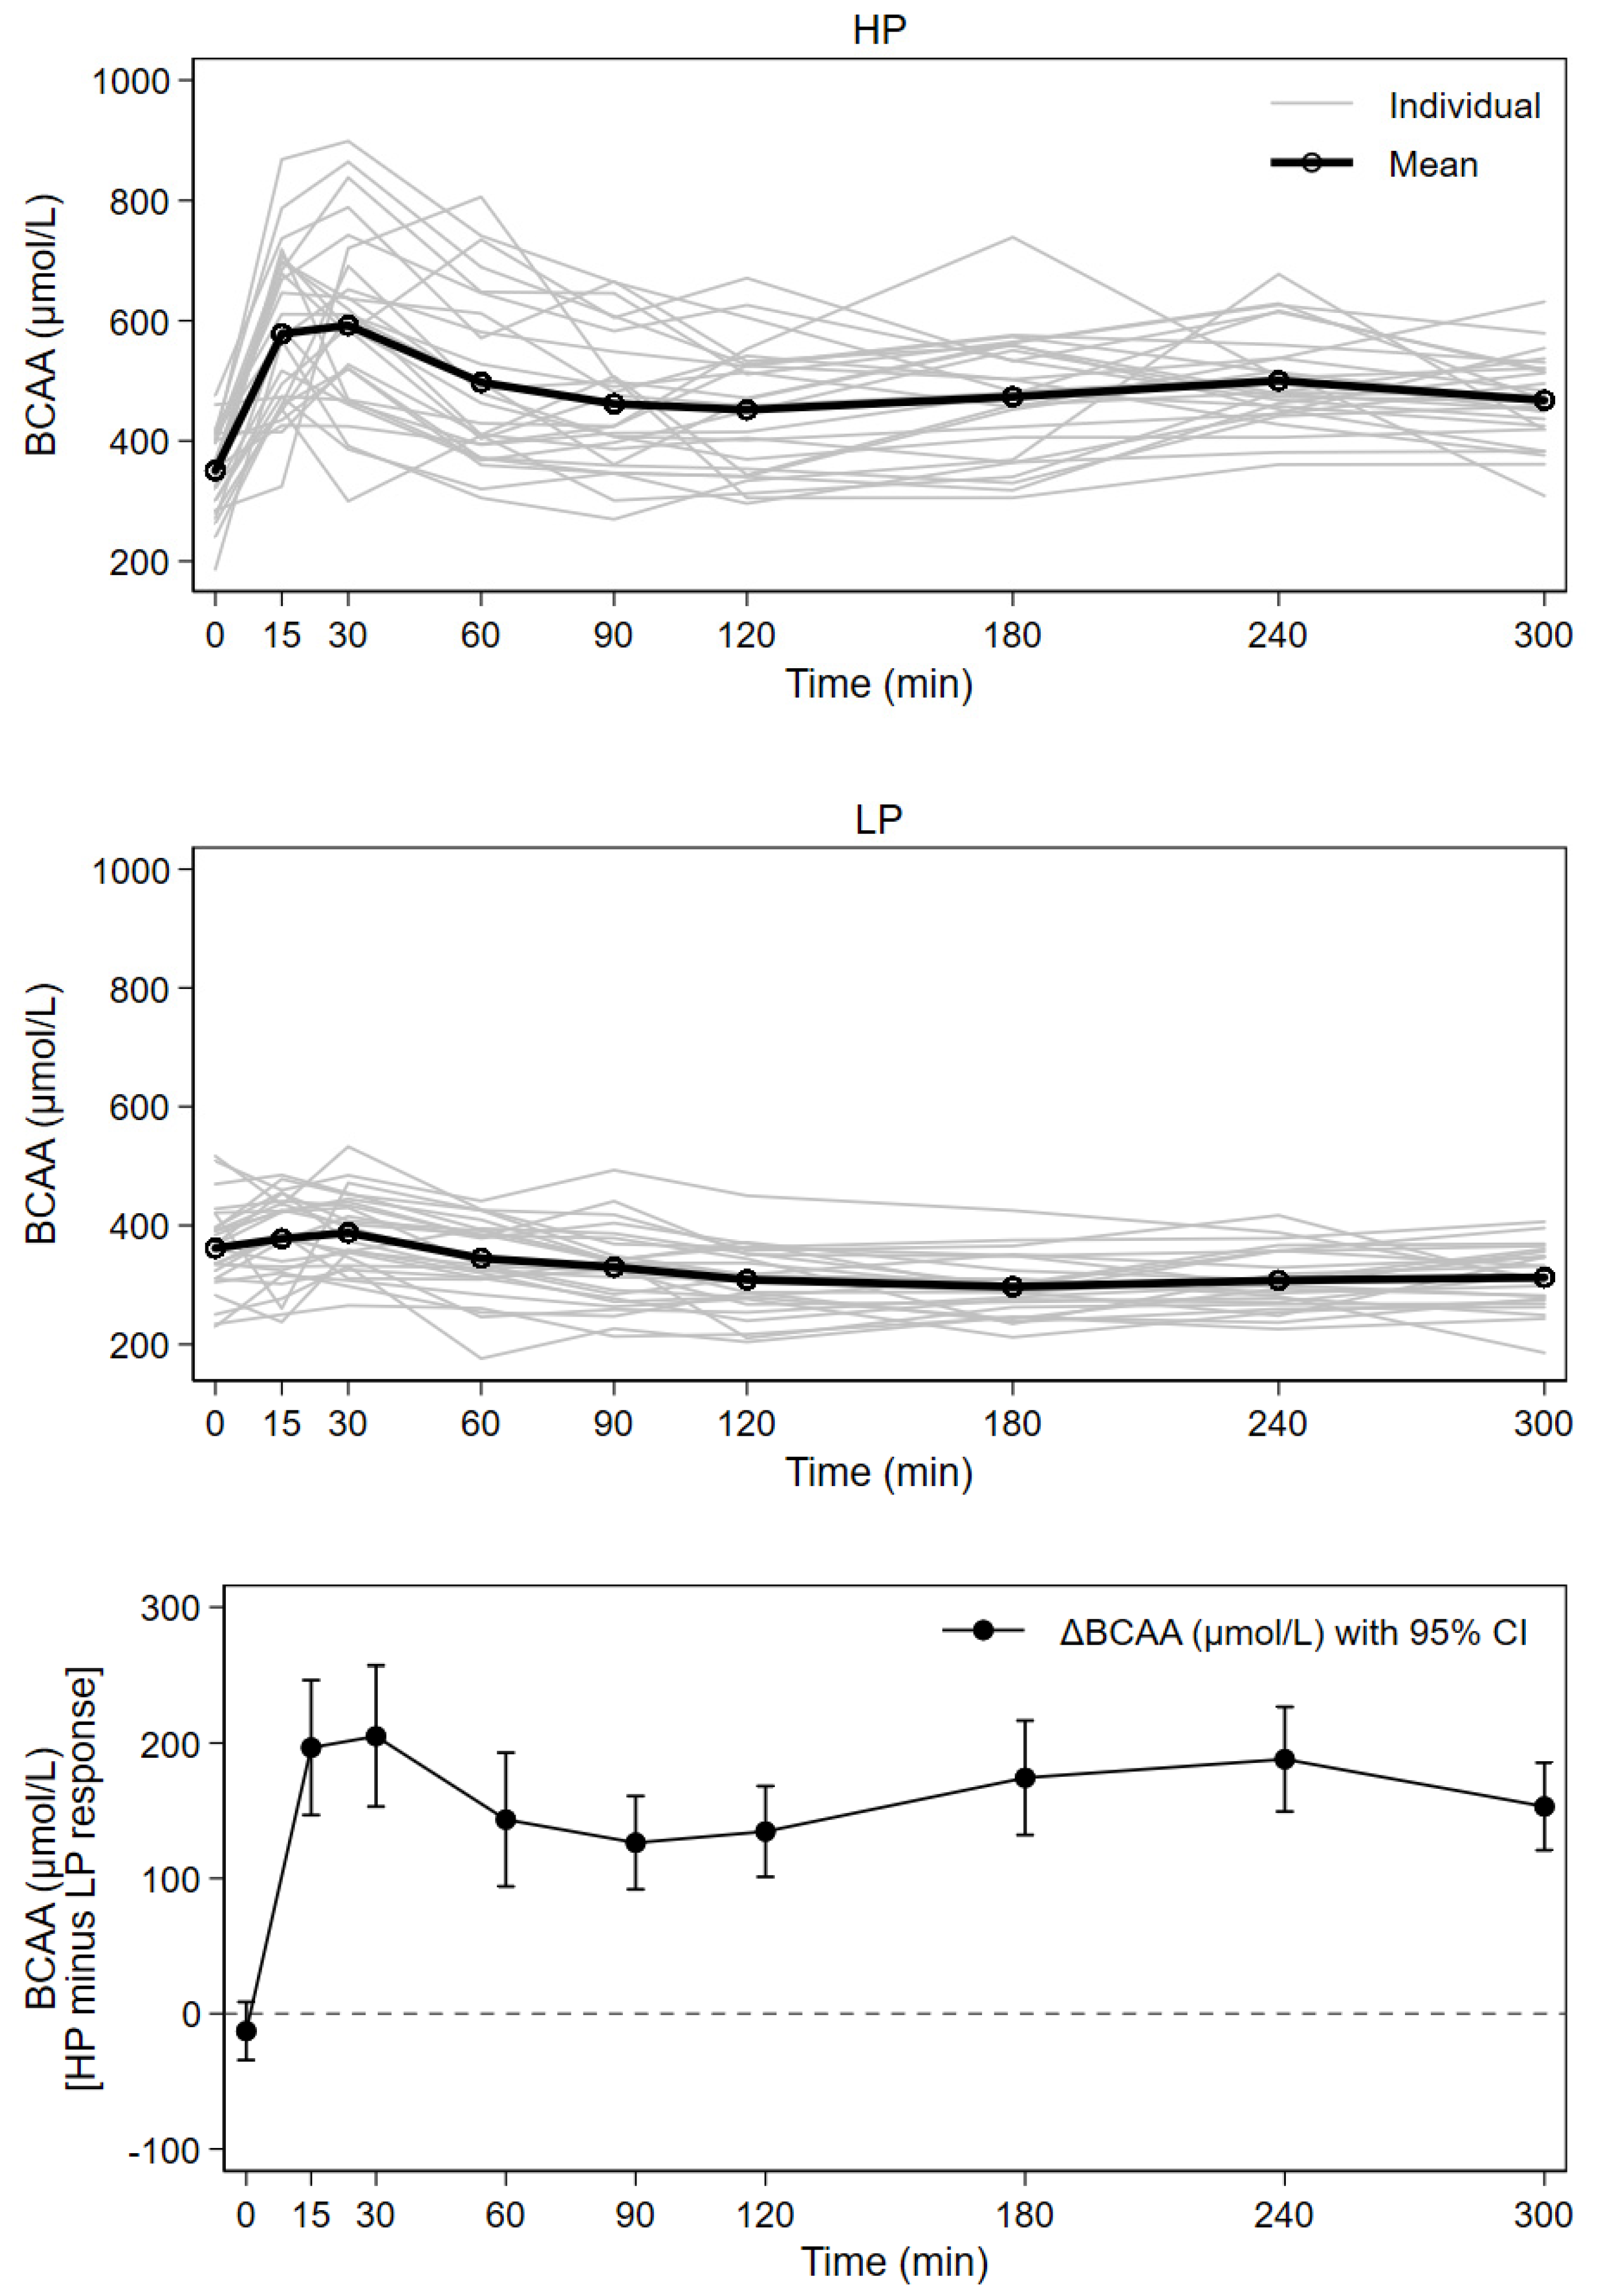
3.3. Postprandial Plasma Branched-Chain Amino Acids
3.4. Effects of Age, Gender and Anthropometry on Metabolic Response
4. Discussion
Strengths and Limitations
5. Conclusions
Author Contributions
Funding
Institutional Review Board Statement
Informed Consent Statement
Data Availability Statement
Acknowledgments
Conflicts of Interest
Abbreviations
References
- Heinig, M.J.; Nommsen, L.A.; Peerson, J.M.; Lonnerdal, B.; Dewey, K.G. Energy and protein intakes of breast-fed and formula-fed infants during the first year of life and their association with growth velocity: The DARLING Study. Am. J. Clin. Nutr. 1993, 58, 152–161. [Google Scholar] [CrossRef] [Green Version]
- Gunther, A.L.; Remer, T.; Kroke, A.; Buyken, A.E. Early protein intake and later obesity risk: Which protein sources at which time points throughout infancy and childhood are important for body mass index and body fat percentage at 7 y of age? Am. J. Clin. Nutr. 2007, 86, 1765–1772. [Google Scholar] [CrossRef]
- Scaglioni, S.; Agostoni, C.; De Notaris, R.; Radaelli, G.; Radice, N.; Valenti, M.; Giovannini, M.; Riva, E. Early macronutrient intake and overweight at five years of age. Int. J. Obes. 2000, 24, 777–781. [Google Scholar] [CrossRef] [Green Version]
- Koletzko, B.; Von Kries, R.; Monasterolo, R.C.; Subías, J.E.; Scaglioni, S.; Giovannini, M.; Beyer, J.; Demmelmair, H.; Anton, B.; Gruszfeld, D.; et al. Can infant feeding choices modulate later obesity risk? Am. J. Clin. Nutr. 2009, 89, 1502S–1508S. [Google Scholar] [CrossRef] [Green Version]
- European Childhood Obesity Trial Study Group; Koletzko, B.; Von Kries, R.; Closa, R.; Escribano, J.; Scaglioni, S.; Giovannini, M.; Beyer, J.; Demmelmair, H.; Gruszfeld, D.; et al. Lower protein in infant formula is associated with lower weight up to age 2 y: A randomized clinical trial. Am. J. Clin. Nutr. 2009, 89, 1836–1845. [Google Scholar] [CrossRef] [PubMed] [Green Version]
- Weber, M.; Grote, V.; Closa-Monasterolo, R.; Escribano, J.; Langhendries, J.-P.; Dain, E.; Giovannini, M.; Verduci, E.; Gruszfeld, D.; Socha, P.; et al. Lower protein content in infant formula reduces BMI and obesity risk at school age: Follow-up of a randomized trial. Am. J. Clin. Nutr. 2014, 99, 1041–1051. [Google Scholar] [CrossRef] [PubMed]
- Weber, M.; Luque, V.; Escribano, J.; Closa-Monasterolo, R.; Verduci, E.; ReDionigi, A.; Hoyos, J.; Langhendries, J.-P.; Gruszfeld, D.; Socha, P.; et al. Effect of Lower versus Higher Protein Content in Infant Formula through the First Year on Body Composition from 1 to 6 Years: Follow-Up of a Randomized Clinical Trial. Obesity 2018, 26, 1203–1210. [Google Scholar] [CrossRef]
- Alexy, U.; Kersting, M.; Sichert-Hellert, W.; Manz, F.; Schöch, G. Macronutrient intake of 3- to 36-month-old German infants and children: Results of the DONALD Study. Dortmund Nutritional and Anthropometric Longitudinally Designed Study. Ann. Nutr. Metab. 1999, 43, 14–22. [Google Scholar] [CrossRef]
- Koletzko, B. Epigenetics, Nutrition and Growth. World Rev. Nutr. Diet. 2019, 120, 48–60. [Google Scholar]
- Mao, Z.; Zhang, W. Role of mTOR in Glucose and Lipid Metabolism. Int. J. Mol. Sci. 2018, 19, 2043. [Google Scholar] [CrossRef] [Green Version]
- Ferré, N.; Luque, V.; Closa-Monasterolo, R.; Zaragoza-Jordana, M.; Gispert-Llauradó, M.; Grote, V.; Koletzko, B.; Escribano, J. Association of Protein Intake during the Second Year of Life with Weight Gain-Related Outcomes in Childhood: A Systematic Review. Nutrients 2021, 13, 583. [Google Scholar] [CrossRef]
- Harder, U.; Koletzko, B.; Peissner, W. Quantification of 22 plasma amino acids combining derivatization and ion-pair LC–MS/MS. J. Chromatogr. B 2011, 879, 495–504. [Google Scholar] [CrossRef]
- Hirsch, S.; Barrera, G.; Leiva, L.; de la Maza, M.P.; Bunout, D. Variability of glycemic and insulin response to a standard meal, within and between healthy subjects. Nutr. Hosp. 2013, 28, 541–544. [Google Scholar]
- Nilsson, M.; Stenberg, M.; Frid, A.H.; Holst, J.J.; Björck, I.M.E. Glycemia and insulinemia in healthy subjects after lactose-equivalent meals of milk and other food proteins: The role of plasma amino acids and incretins. Am. J. Clin. Nutr. 2004, 80, 1246–1253. [Google Scholar] [CrossRef]
- Östman, E.M.; Elmståhl, H.G.L.; Björck, I.M. Inconsistency between glycemic and insulinemic responses to regular and fermented milk products. Am. J. Clin. Nutr. 2001, 74, 96–100. [Google Scholar] [CrossRef]
- Schmid, R.; Schusdziarra, V.; Schulte-Frohlinde, E.; Maier, V.; Classen, M. Role of Amino Acids in Stimulation of Postprandial Insulin, Glucagon, and Pancreatic Polypeptide in Humans. Pancreas 1989, 4, 305–314. [Google Scholar] [CrossRef]
- Monteiro, P.O.A.; Victora, C. Rapid growth in infancy and childhood and obesity in later life—A systematic review. Obes. Rev. 2005, 6, 143–154. [Google Scholar] [CrossRef] [PubMed]
- Adair, L.S. Child and adolescent obesity: Epidemiology and developmental perspectives. Physiol. Behav. 2008, 94, 8–16. [Google Scholar] [CrossRef] [PubMed]
- European Childhood Obesity Trial Study Group; Socha, P.; Grote, V.; Gruszfeld, D.; Janas, R.; Demmelmair, H.; Closa-Monasterolo, R.; Subías, J.E.; Scaglioni, S.; Verduci, E.; et al. Milk protein intake, the metabolic-endocrine response, and growth in infancy: Data from a randomized clinical trial. Am. J. Clin. Nutr. 2011, 94, 1776S–1784S. [Google Scholar] [CrossRef] [PubMed] [Green Version]
- Kirchberg, F.F.; Harder, U.; Weber, M.; Grote, V.; Demmelmair, H.; Peissner, W.; Rzehak, P.; Xhonneux, A.; Carlier, C.; Ferré, N.; et al. Dietary Protein Intake Affects Amino Acid and Acylcarnitine Metabolism in Infants Aged 6 Months. J. Clin. Endocrinol. Metab. 2015, 100, 149–158. [Google Scholar] [CrossRef] [Green Version]
- Koletzko, B.; Broekaert, I.; Demmelmair, H.; Franke, J.; Hannibal, I.; Oberle, D.; Schiess, S.; Baumann, B.T.; Verwied-Jorky, S. Protein intake in the first year of life: A risk factor for later obesity? The E.U. childhood obesity project. Adv. Exp. Med. Biol. 2005, 569, 69–79. [Google Scholar] [PubMed]
- Jarvenpaa, A.L.; Raiha, N.C.; Rassin, D.K.; Gaull, G.E. Milk protein quantity and quality in the term infant. I. Metabolic responses and effects on growth. Pediatrics 1982, 70, 214–220. [Google Scholar] [PubMed]
- Janas, L.M.; Picciano, M.F.; Hatch, T.F. Indices of protein metabolism in term infants fed human milk, whey-predominant formula, or cow’s milk formula. Pediatrics 1985, 75, 775–784. [Google Scholar] [PubMed]
- Lönnerdal, B.; Chen, C.-L. Effects of Formula Protein Level and Ratio on Infant Growth, Plasma Amino Acids and Serum Trace Elements II. Follow-up Formula. Acta Paediatr. 1990, 79, 266–273. [Google Scholar] [CrossRef]
- Axelsson, I.E.; Jakobsson, I.; Räihä, N.C.R.; Räihä, N.C.R. Formula with Reduced Protein Content: Effects on Growth and Protein Metabolism during Weaning. Pediatr. Res. 1988, 24, 297–301. [Google Scholar] [CrossRef] [Green Version]
- Åkeson, P.M.K.; Axelsson, I.E.; Raiha, N.C. Protein and amino acid metabolism in three- to twelve-month-old infants fed human milk or formulas with varying protein concentrations. J. Pediatr. Gastroenterol. Nutr. 1998, 26, 297–304. [Google Scholar] [CrossRef] [PubMed]
- Panahi, S.; El Khoury, D.; Kubant, R.; Akhavan, T.; Luhovyy, B.L.; Goff, H.D.; Anderson, G.H. Mechanism of action of whole milk and its components on glycemic control in healthy young men. J. Nutr. Biochem. 2014, 25, 1124–1131. [Google Scholar] [CrossRef]
- Nilsson, M.; Holst, J.J.; Björck, I.M. Metabolic effects of amino acid mixtures and whey protein in healthy subjects: Studies using glucose-equivalent drinks. Am. J. Clin. Nutr. 2007, 85, 996–1004. [Google Scholar] [CrossRef] [Green Version]
- Shahkhalili, Y.; Monnard, C.; Grathwohl, D.; Sauser, J.; Beaumont, M.; Zufferey, C.A.; Macé, K. Comparison of the acute metabolic effect of different infant formulas and human milk in healthy adults: A randomized trial. Nutr. Diabetes 2021, 11, 13. [Google Scholar] [CrossRef]
- Krebs, M.; Brehm, A.; Krssak, M.; Anderwald, C.H.; Bernroider, E.; Nowotny, P.; Roth, E.; Chandramouli, V.; Landau, B.R.; Roden, M. Direct and indirect effects of amino acids on hepatic glucose metabolism in humans. Diabetologia 2003, 46, 917–925. [Google Scholar] [CrossRef]
- Melnik, B.C. Excessive Leucine-mTORC1-Signalling of Cow Milk-Based Infant Formula: The Missing Link to Understand Early Childhood Obesity. J. Obes. 2012, 2012, 197653. [Google Scholar] [CrossRef] [PubMed] [Green Version]
- Lynch, C.J. Role of Leucine in the Regulation of mTOR by Amino Acids: Revelations from Structure—Activity Studies. J. Nutr. 2001, 131, 861S–865S. [Google Scholar] [CrossRef]
- Layman, D.K. The Role of Leucine in Weight Loss Diets and Glucose Homeostasis. J. Nutr. 2003, 133, 261S–267S. [Google Scholar] [CrossRef] [PubMed]
- Rafiq, S.; Huma, N.; Pasha, I.; Sameen, A.; Mukhtar, O.; Khan, M.I. Chemical Composition, Nitrogen Fractions and Amino Acids Profile of Milk from Different Animal Species. Asian-Australas. J. Anim. Sci. 2016, 29, 1022–1028. [Google Scholar] [CrossRef] [PubMed]
- Melnik, B.C.; Schmitz, G.; John, S.M.; Carrera-Bastos, P.; Lindeberg, S.; Cordain, L. Metabolic effects of milk protein intake strongly depend on pre-existing metabolic and exercise status. Nutr. Metab. 2013, 10, 60. [Google Scholar] [CrossRef] [Green Version]
- Runchey, S.S.; Pollak, M.N.; Valsta, L.M.; Coronado, G.D.; Schwarz, Y.; Breymeyer, K.L.; Wang, C.; Lampe, J.W.; Neuhouser, M.L. Glycemic load effect on fasting and post-prandial serum glucose, insulin, IGF-1 and IGFBP-3 in a randomized, controlled feeding study. Eur. J. Clin. Nutr. 2012, 66, 1146–1152. [Google Scholar] [CrossRef]
- Brand-Miller, J.C.; Liu, V.; Petocz, P.; Baxter, R.C. The glycemic index of foods influences postprandial insulin-like growth factor-binding protein responses in lean young subjects. Am. J. Clin. Nutr. 2005, 82, 350–354. [Google Scholar] [CrossRef] [PubMed]
- Krezowski, P.A.; Nuttall, F.Q.; Gannon, M.C.; Bartosh, N.H. The effect of protein ingestion on the metabolic response to oral glucose in normal individuals. Am. J. Clin. Nutr. 1986, 44, 847–856. [Google Scholar] [CrossRef] [Green Version]
- Weiner, I.D.; Mitch, W.E.; Sands, J.M. Urea and Ammonia Metabolism and the Control of Renal Nitrogen Excretion. Clin. J. Am. Soc. Nephrol. 2014, 10, 1444–1458. [Google Scholar] [CrossRef] [Green Version]
- Günther, A.L.B.; Buyken, A.E.; Kroke, A. The influence of habitual protein intake in early childhood on BMI and age at adiposity rebound: Results from the DONALD Study. Int. J. Obes. 2006, 30, 1072–1079. [Google Scholar] [CrossRef] [Green Version]
- Rolland-Cachera, M.F.; Deheeger, M.; Akrout, M.; Bellisle, F. Influence of macronutrients on adiposity development: A follow up study of nutrition and growth from 10 months to 8 years of age. Int. J. Obes. Relat. Metab. Disord. J. Int. Assoc. Study Obes. 1995, 19, 573–578. [Google Scholar]
- Garden, F.L.; Marks, G.; Almqvist, C.; Simpson, J.M.; Webb, K.L. Infant and early childhood dietary predictors of overweight at age 8 years in the CAPS population. Eur. J. Clin. Nutr. 2011, 65, 454–462. [Google Scholar] [CrossRef] [PubMed] [Green Version]
- Voortman, T.; van den Hooven, E.H.; Tielemans, M.J.; Hofman, A.; Kiefte-de Jong, J.C.; Jaddoe, V.W.; Franco, O.H. Protein intake in early childhood and cardiometabolic health at school age: The Generation R Study. Eur. J. Nutr. 2015, 55, 2117–2127. [Google Scholar] [CrossRef] [PubMed] [Green Version]
- Switkowski, K.M.; Jacques, P.F.; Must, A.; Fleisch, A.; Oken, E. Associations of protein intake in early childhood with body composition, height, and insulin-like growth factor I in mid-childhood and early adolescence. Am. J. Clin. Nutr. 2019, 109, 1154–1163. [Google Scholar] [CrossRef] [PubMed]
- Harris, C.; Buyken, A.; Von Berg, A.; Berdel, D.; Lehmann, I.; Hoffmann, B.; Koletzko, S.; Koletzko, B.; Heinrich, J.; Standl, M. Prospective associations of meat consumption during childhood with measures of body composition during adolescence: Results from the GINIplus and LISAplus birth cohorts. Nutr. J. 2016, 15, 101. [Google Scholar] [CrossRef] [Green Version]


| Baseline Variable | Mean ± SD |
|---|---|
| Age (years) | 26.4 ± 5.0 |
| Weight (kg) | 68.3 ± 12.4 |
| Height (cm) | 173.9 ± 10.2 |
| BMI (kg/m2) | 22.2 ± 2.5 |
| Waist circumference (cm) | 80.7 ± 7.0 |
| Metabolite | Higher Protein | Lower Protein | p-Value * |
|---|---|---|---|
| Glucose (mg/dL) | |||
| Baseline | 86 ± 6 | 86 ± 9 | 0.929 |
| Cmax | 119 ± 19 | 119 ± 18 | 0.866 |
| Tmax | 37 ± 29 | 45 ± 38 | 0.251 |
| AUC | 27,301 ± 1868 | 26,826 ± 2165 | 0.132 |
| Insulin (µU/mL) | |||
| Baseline | 8 ± 4 | 9 ± 5 | 0.202 |
| Cmax | 71 ± 37 | 55 ± 28 | <0.001 |
| Tmax | 24 ± 11 | 27 ± 10 | 0.247 |
| AUC | 6674 ± 3013 | 5600 ± 2423 | 0.005 |
| Urea (mg/dL) | |||
| Baseline | 25 ± 9 | 27 ± 8 | 0.287 |
| Cmax | 28 ± 8 | 27 ± 8 | 0.512 |
| Tmax | 235 ± 90 | 23 ± 27 | <0.001 |
| AUC | 7873 ± 2459 | 7259 ± 2254 | 0.110 |
| Triglycerides (mg/dL) | |||
| Baseline | 85 ± 46 | 80 ± 49 | 0.458 |
| Cmax | 110 ± 50 | 110 ± 53 | 0.961 |
| Tmax | 246 ± 96 | 201 ± 111 | 0.132 |
| AUC | 27,945 ± 14338 | 26,619 ± 12,862 | 0.455 |
| Amino Acid | Higher Protein | Lower Protein | p-Value * |
|---|---|---|---|
| Total BCAA | |||
| Baseline | 349 ± 71 | 362 ± 74 | 0.229 |
| Cmax | 656 ± 120 | 407 ± 66 | <0.001 |
| Tmax | 101 ± 106 | 34 ± 57 | 0.024 |
| AUC | 144,765 ± 21,221 | 97,089 ± 14,650 | <0.001 |
| Valine | |||
| Baseline | 174 ± 37 | 183 ± 38 | 0.204 |
| Cmax | 284 ± 63 | 207 ± 39 | <0.001 |
| Tmax | 118 ± 112 | 43 ± 60 | 0.009 |
| AUC | 67,465 ± 11,871 | 50,385 ± 7944 | <0.001 |
| Leucine | |||
| Baseline | 114 ± 26 | 115 ± 25 | 0.828 |
| Cmax | 242 ± 40 | 133 ± 21 | <0.001 |
| Tmax | 77 ± 96 | 35 ± 59 | 0.136 |
| AUC | 49,611 ± 7220 | 30,419 ± 4970 | <0.001 |
| Isoleucine | |||
| Baseline | 61 ± 15 | 64 ± 21 | 0.391 |
| Cmax | 141 ± 30 | 75 ± 18 | <0.001 |
| Tmax | 64 ± 87 | 35 ± 59 | 0.277 |
| AUC | 27,689 ± 4632 | 16,285 ± 3314 | <0.001 |
Publisher’s Note: MDPI stays neutral with regard to jurisdictional claims in published maps and institutional affiliations. |
© 2021 by the authors. Licensee MDPI, Basel, Switzerland. This article is an open access article distributed under the terms and conditions of the Creative Commons Attribution (CC BY) license (https://creativecommons.org/licenses/by/4.0/).
Share and Cite
Newton-Tanzer, E.; Demmelmair, H.; Horak, J.; Holdt, L.; Koletzko, B.; Grote, V. Acute Metabolic Response in Adults to Toddler Milk Formulas with Alternating Higher and Lower Protein and Fat Contents, a Randomized Cross-Over Trial. Nutrients 2021, 13, 3022. https://doi.org/10.3390/nu13093022
Newton-Tanzer E, Demmelmair H, Horak J, Holdt L, Koletzko B, Grote V. Acute Metabolic Response in Adults to Toddler Milk Formulas with Alternating Higher and Lower Protein and Fat Contents, a Randomized Cross-Over Trial. Nutrients. 2021; 13(9):3022. https://doi.org/10.3390/nu13093022
Chicago/Turabian StyleNewton-Tanzer, Emily, Hans Demmelmair, Jeannie Horak, Lesca Holdt, Berthold Koletzko, and Veit Grote. 2021. "Acute Metabolic Response in Adults to Toddler Milk Formulas with Alternating Higher and Lower Protein and Fat Contents, a Randomized Cross-Over Trial" Nutrients 13, no. 9: 3022. https://doi.org/10.3390/nu13093022
APA StyleNewton-Tanzer, E., Demmelmair, H., Horak, J., Holdt, L., Koletzko, B., & Grote, V. (2021). Acute Metabolic Response in Adults to Toddler Milk Formulas with Alternating Higher and Lower Protein and Fat Contents, a Randomized Cross-Over Trial. Nutrients, 13(9), 3022. https://doi.org/10.3390/nu13093022