
The Beverage Hydration Index: Influence of Electrolytes, Carbohydrate and Protein

Abstract
:1. Introduction
2. Materials and Methods
2.1. Study Population
2.2. Study Design
2.3. Test Beverages
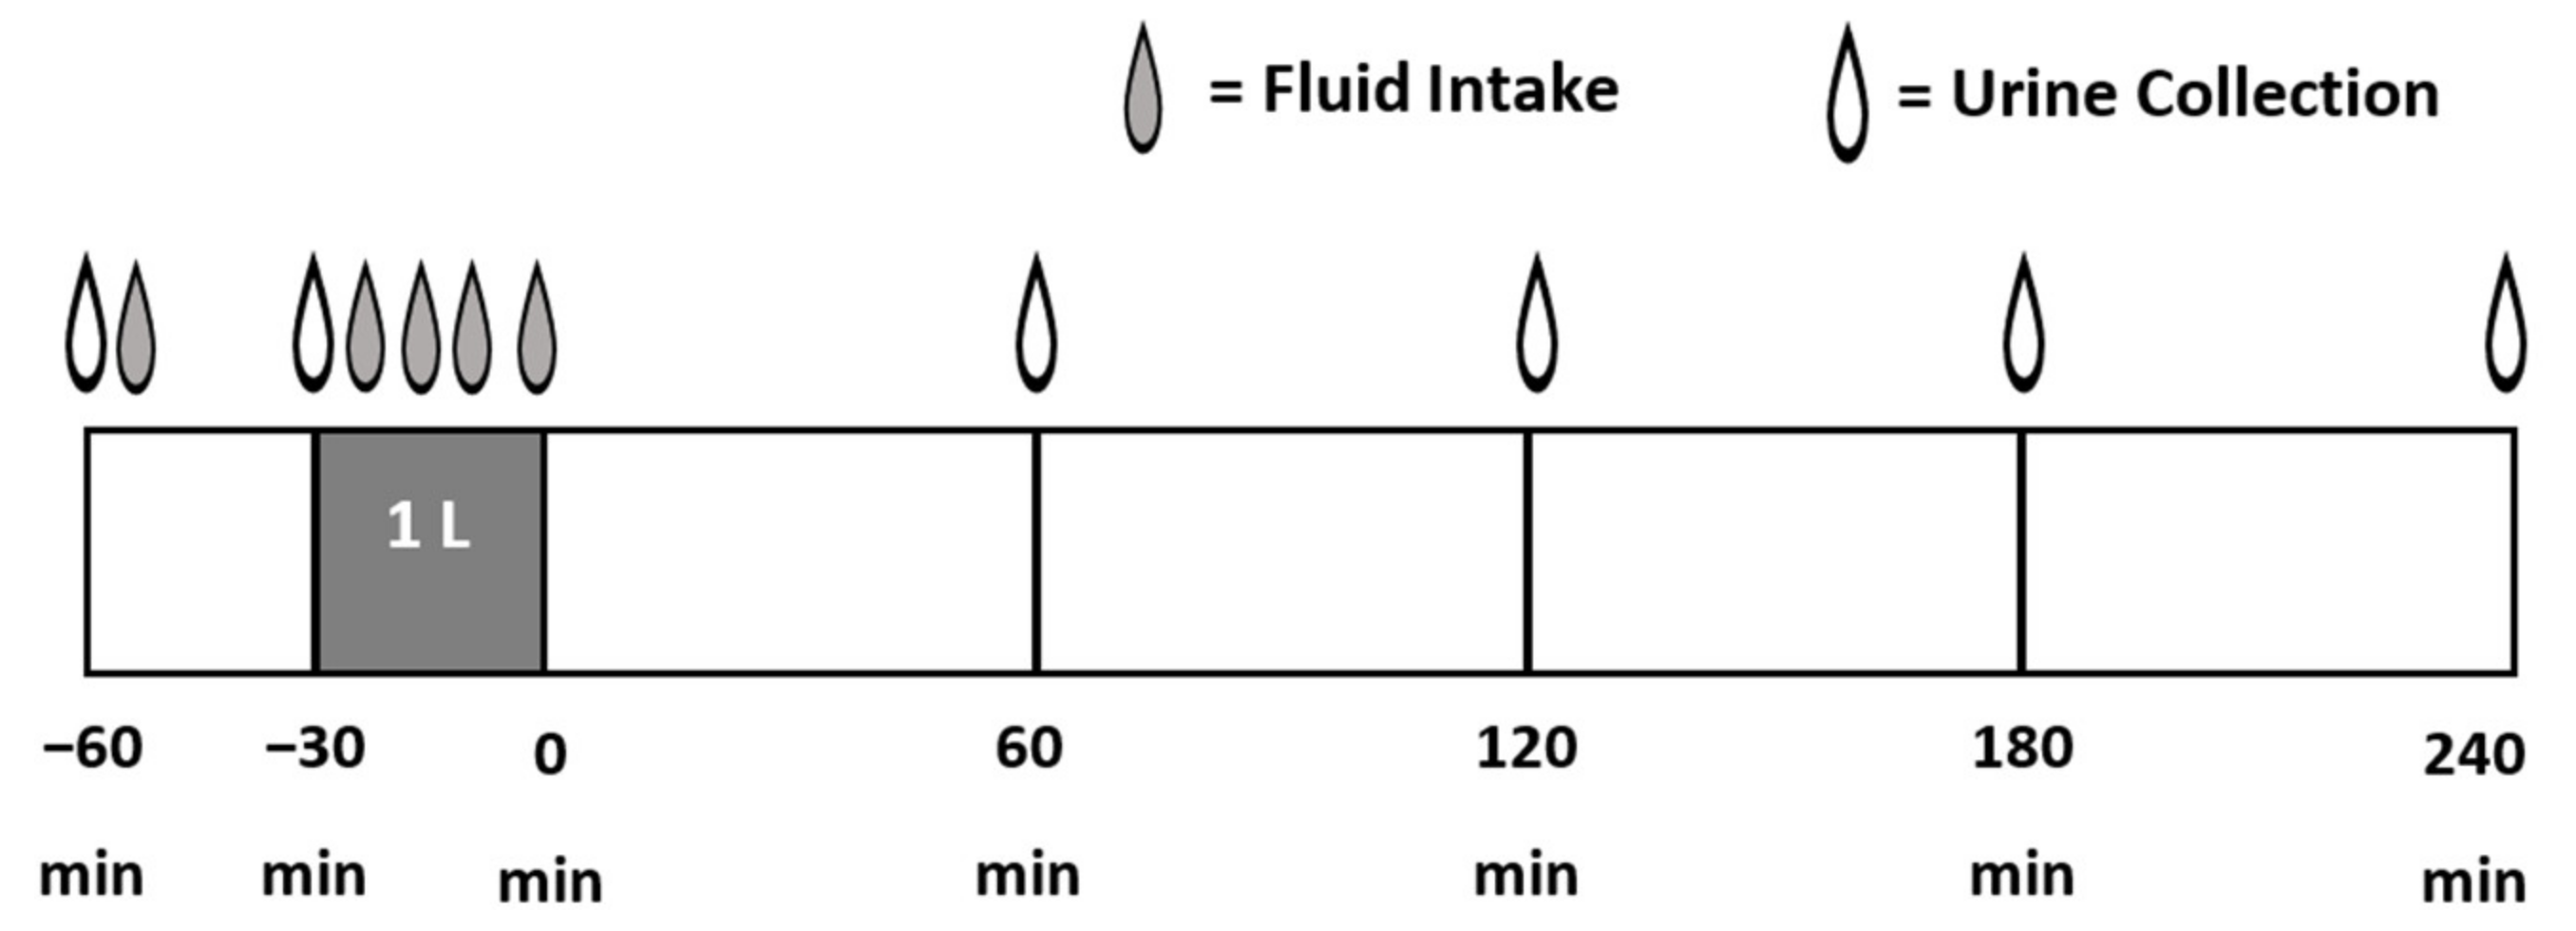
2.4. Test Protocol
2.5. Statistical Analysis
3. Results
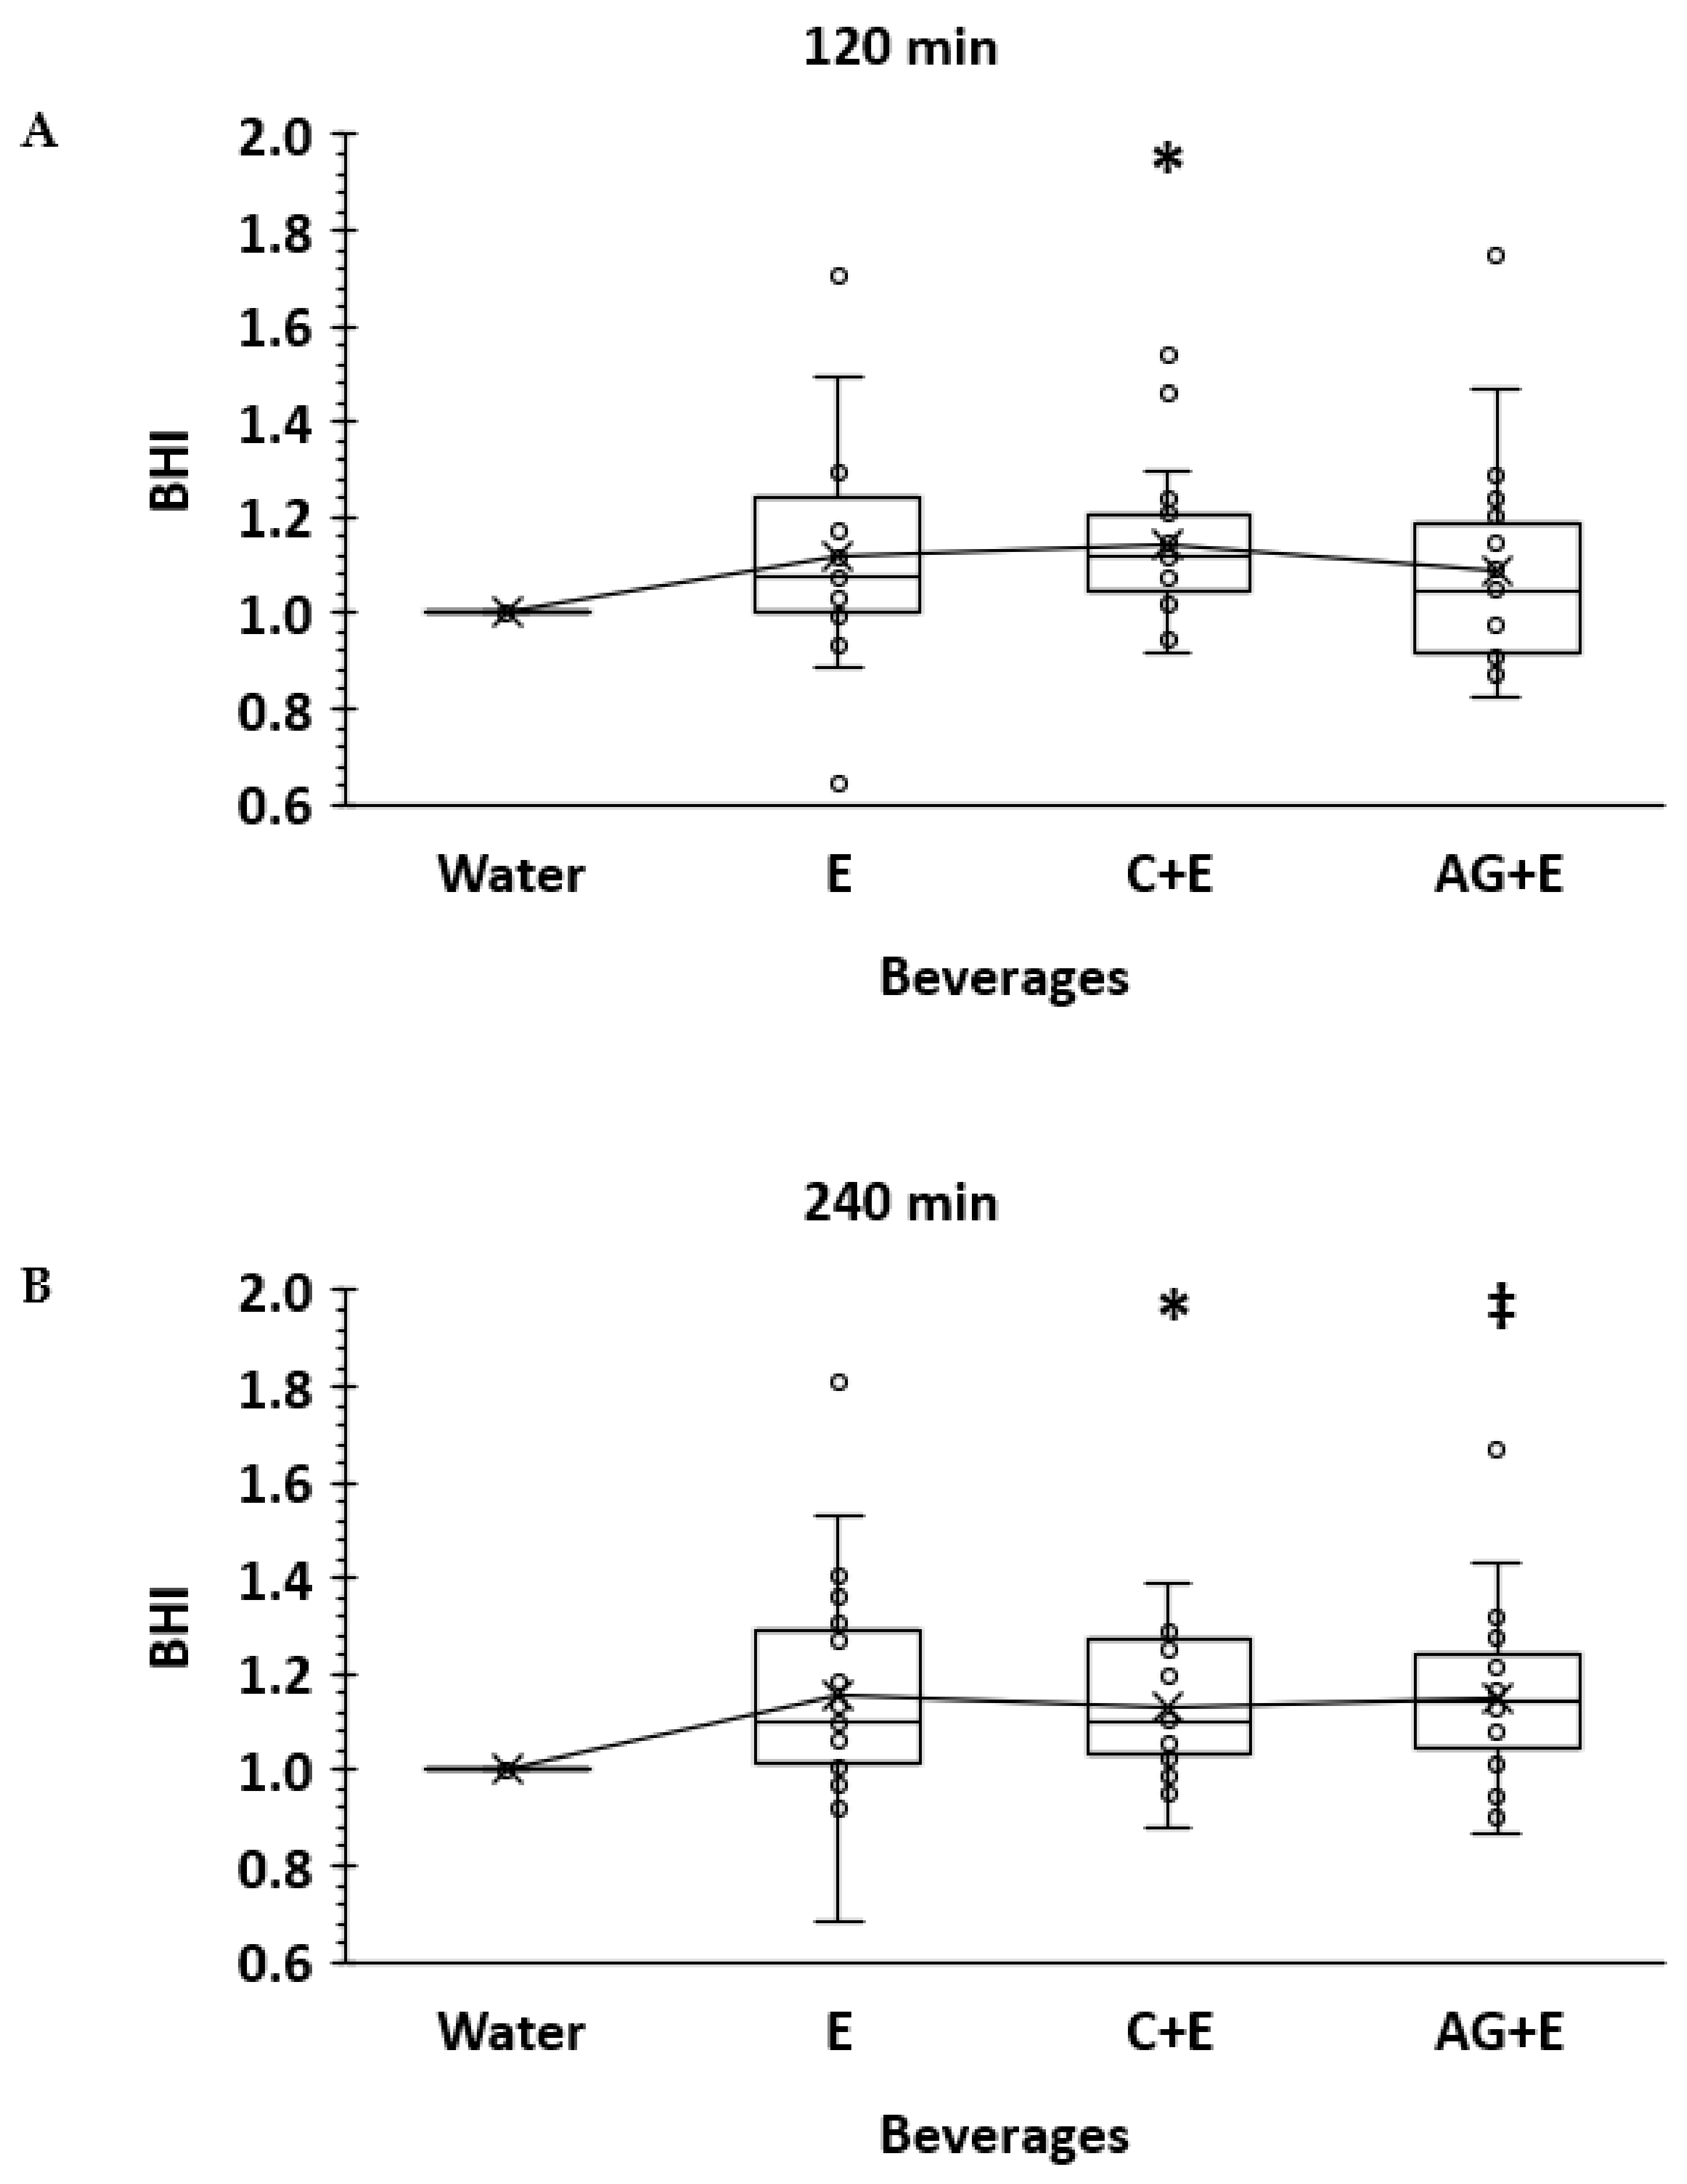
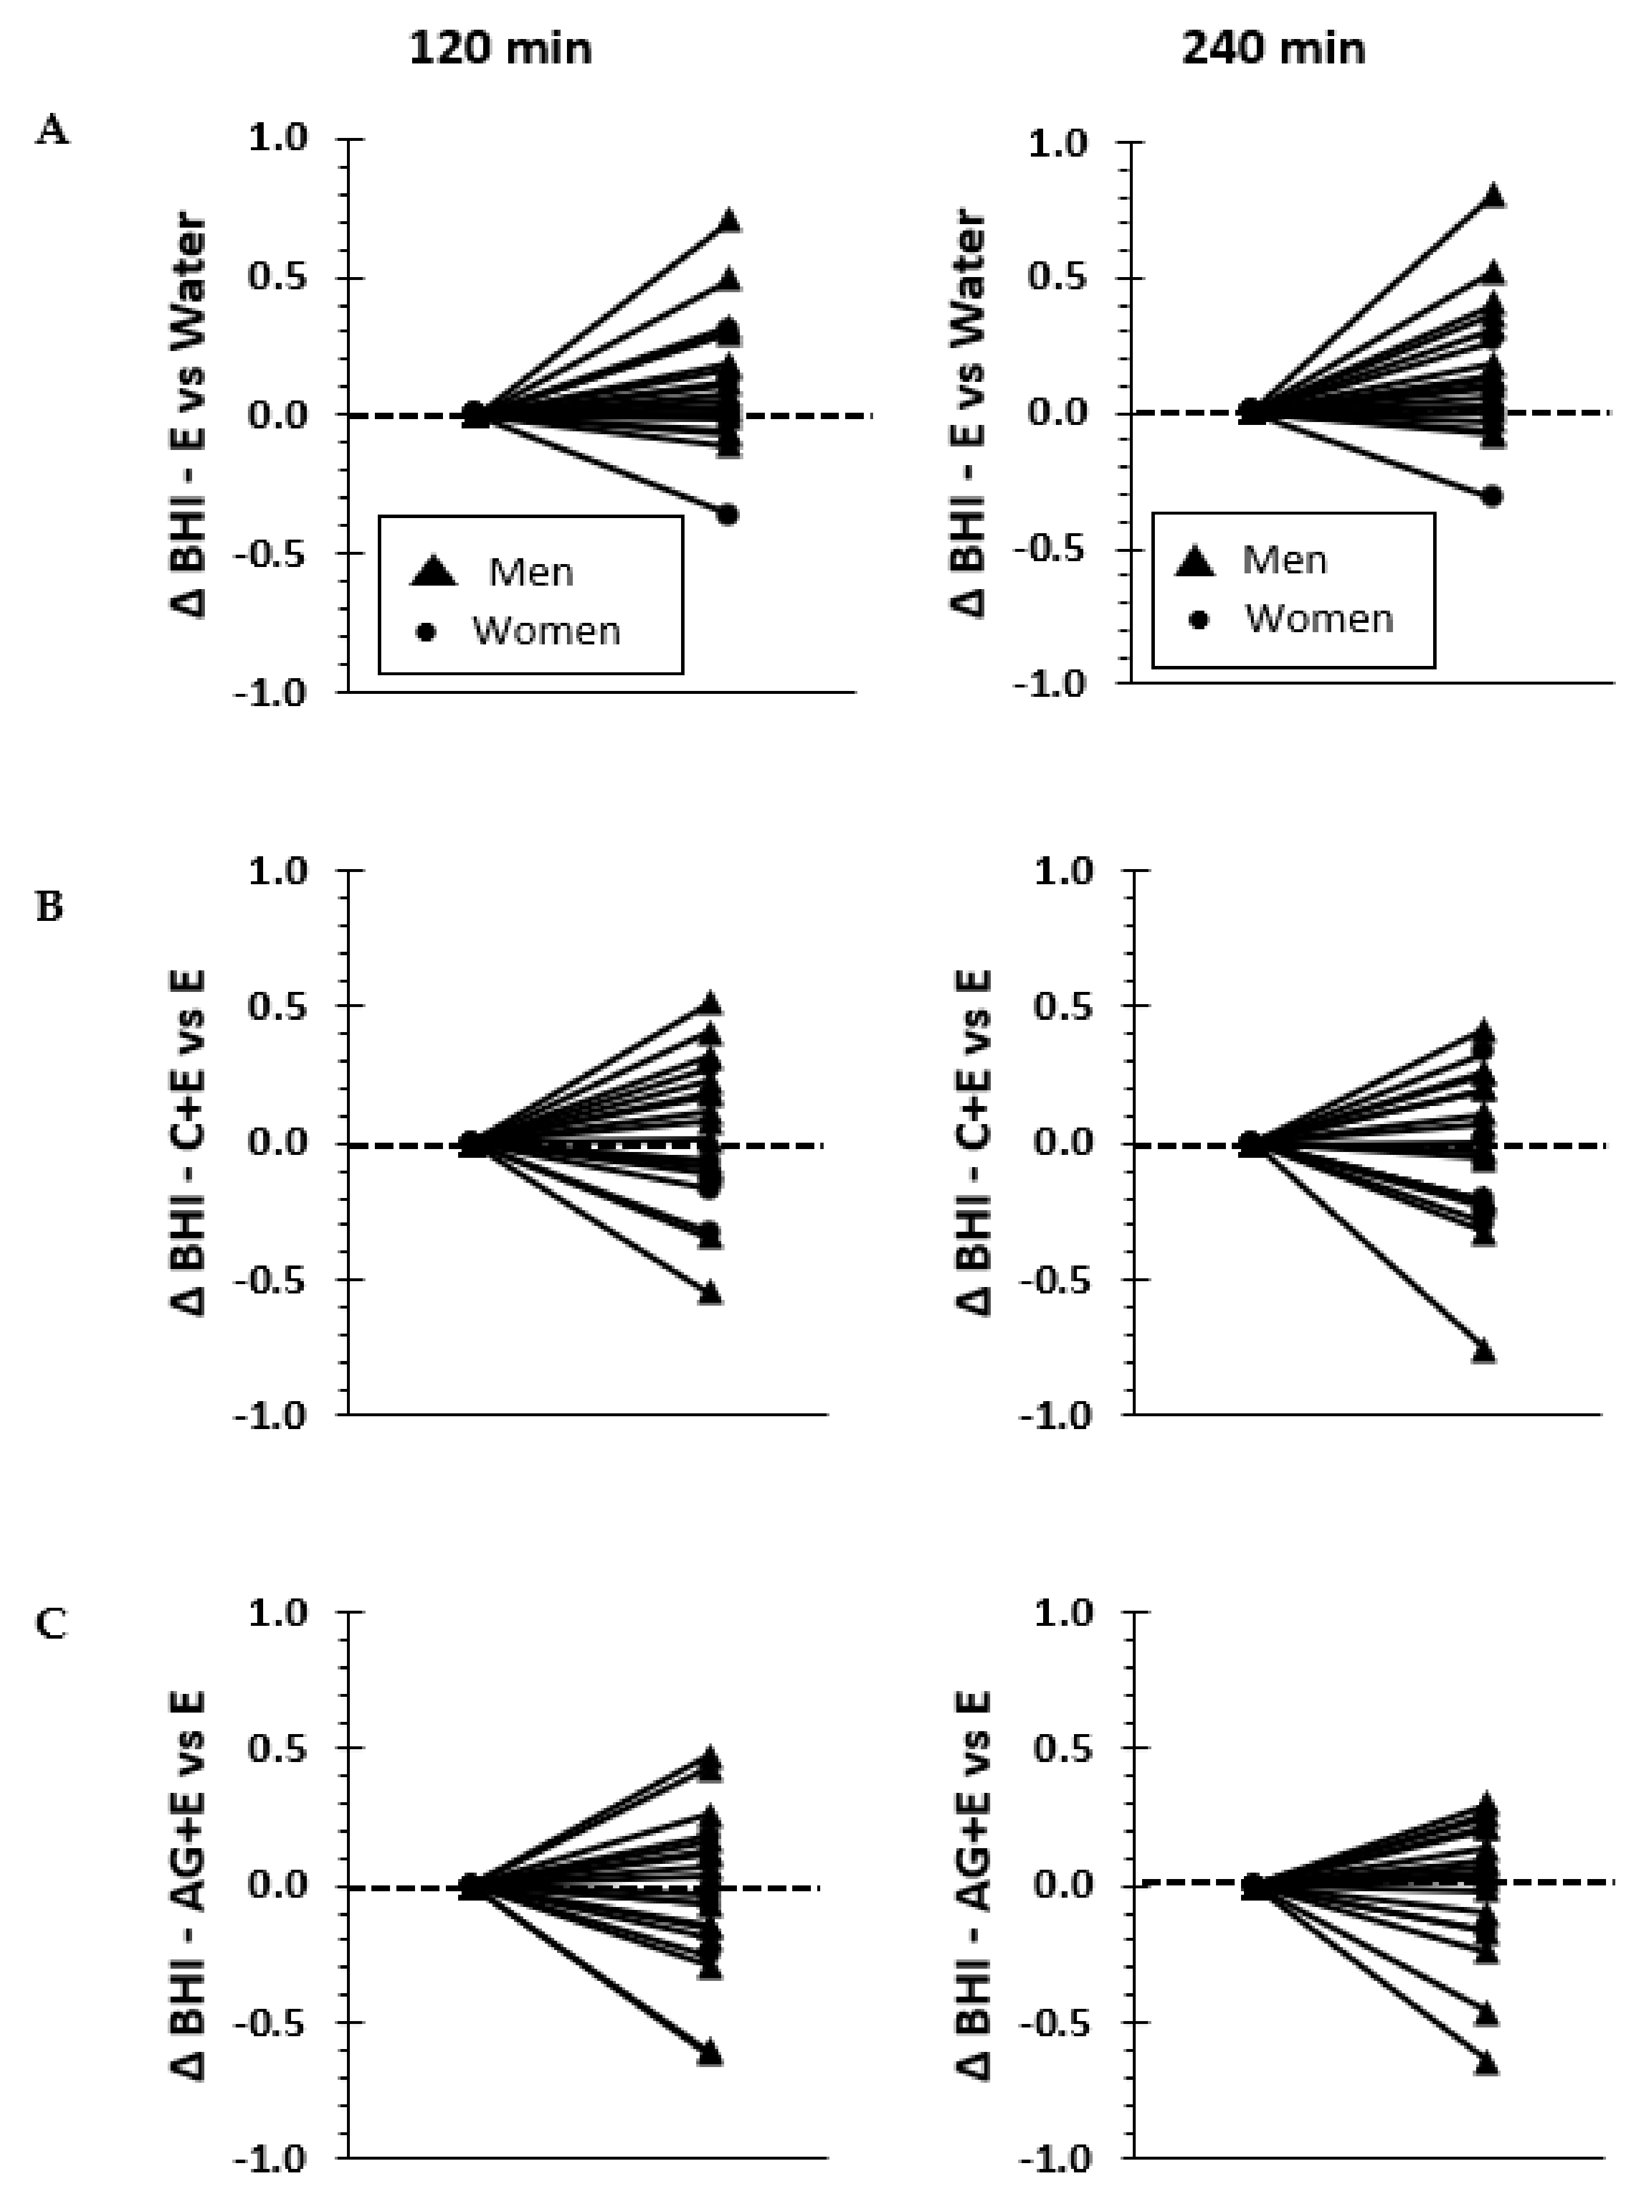
3.1. Beverage Hydration Index
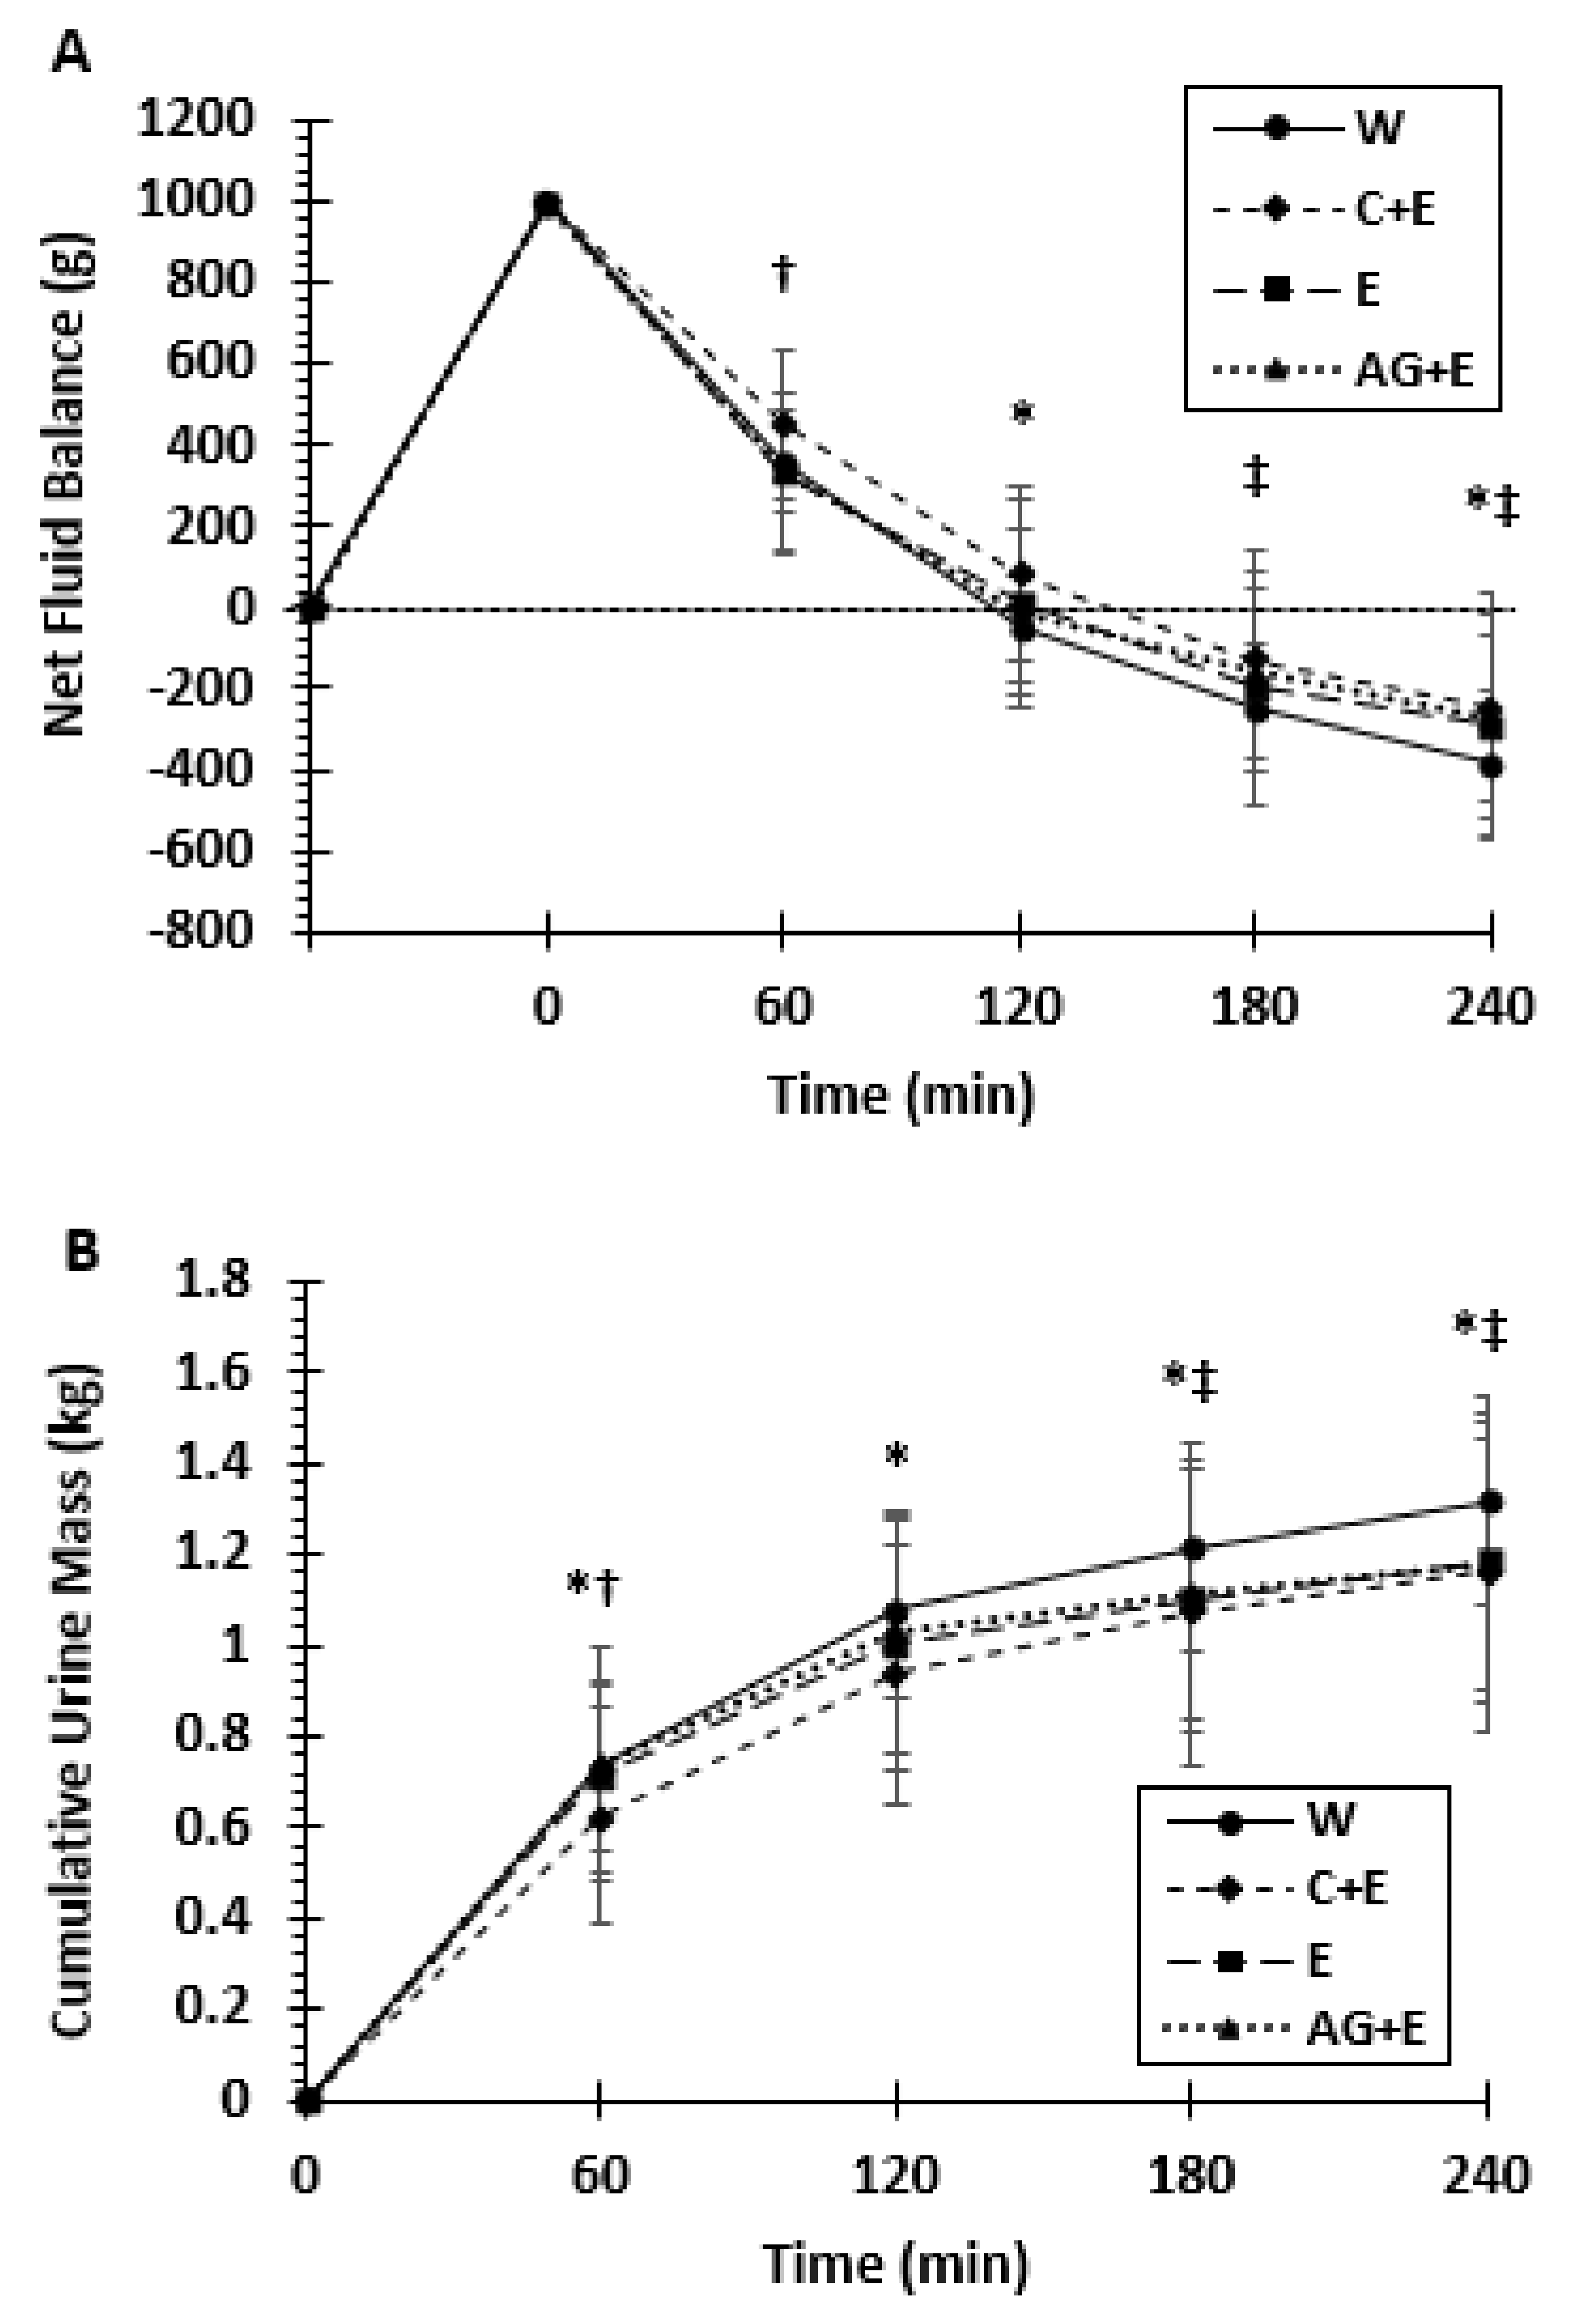
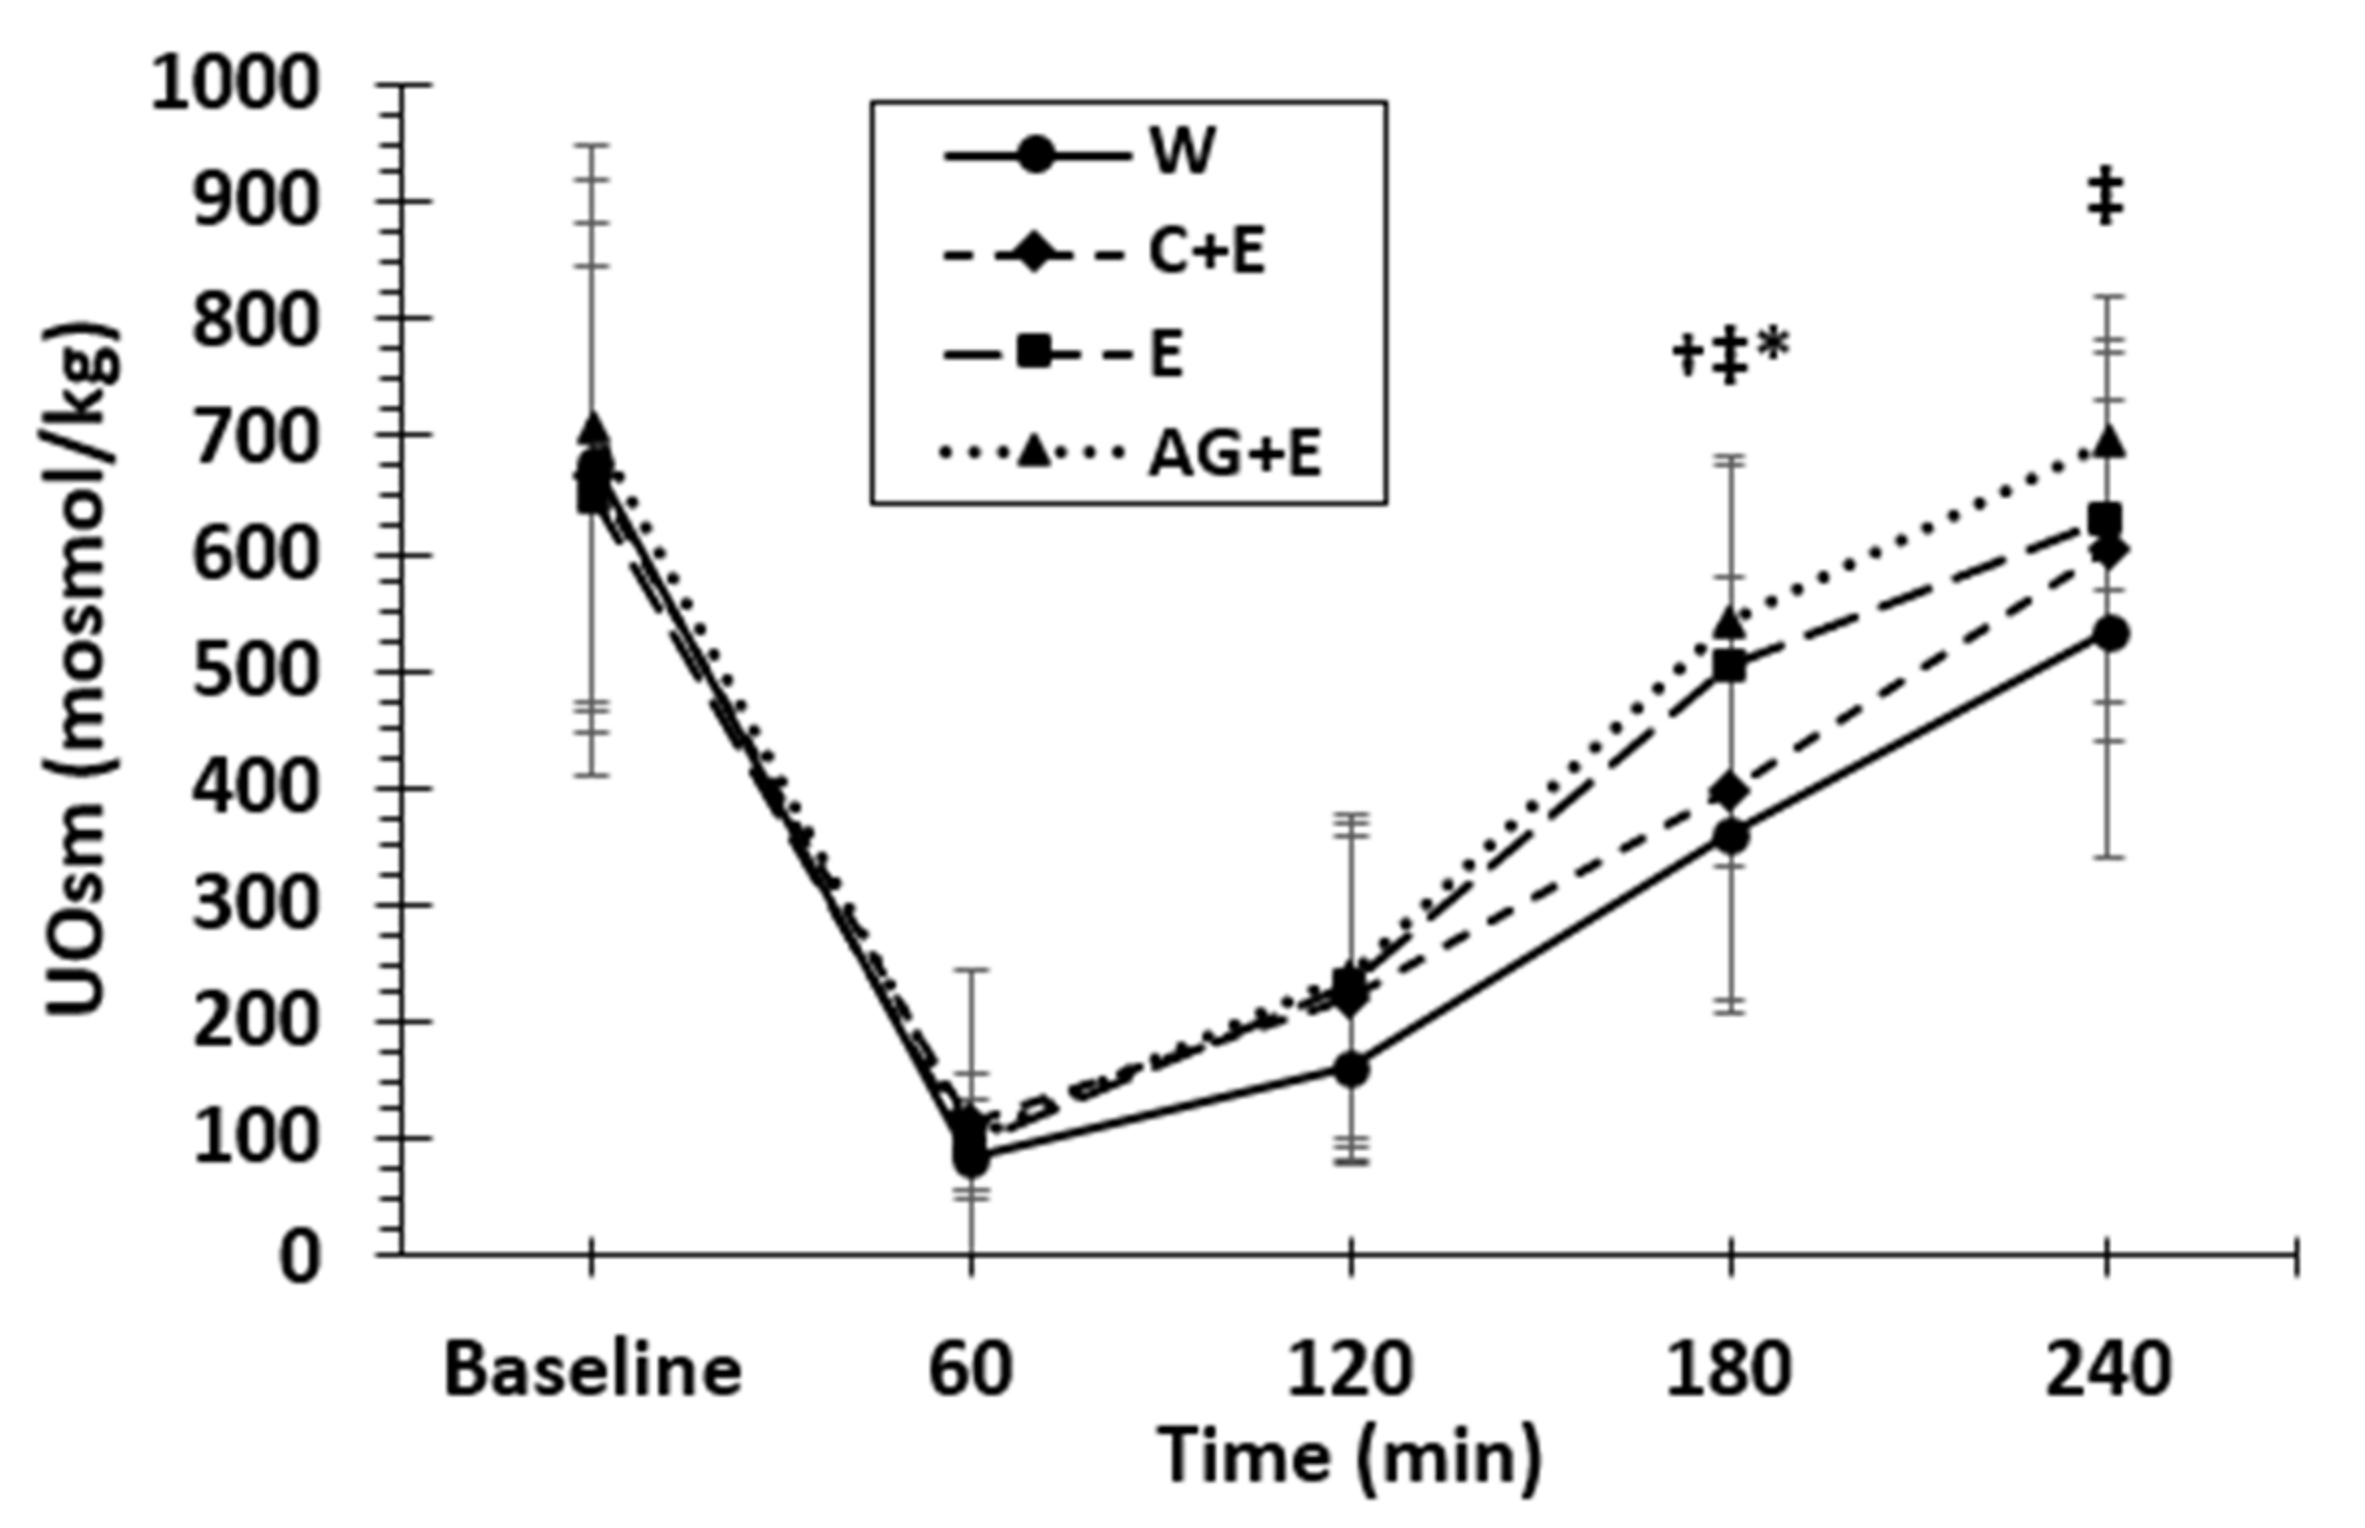
3.2. Net Fluid Balance, Urine Mass, and Osmolality
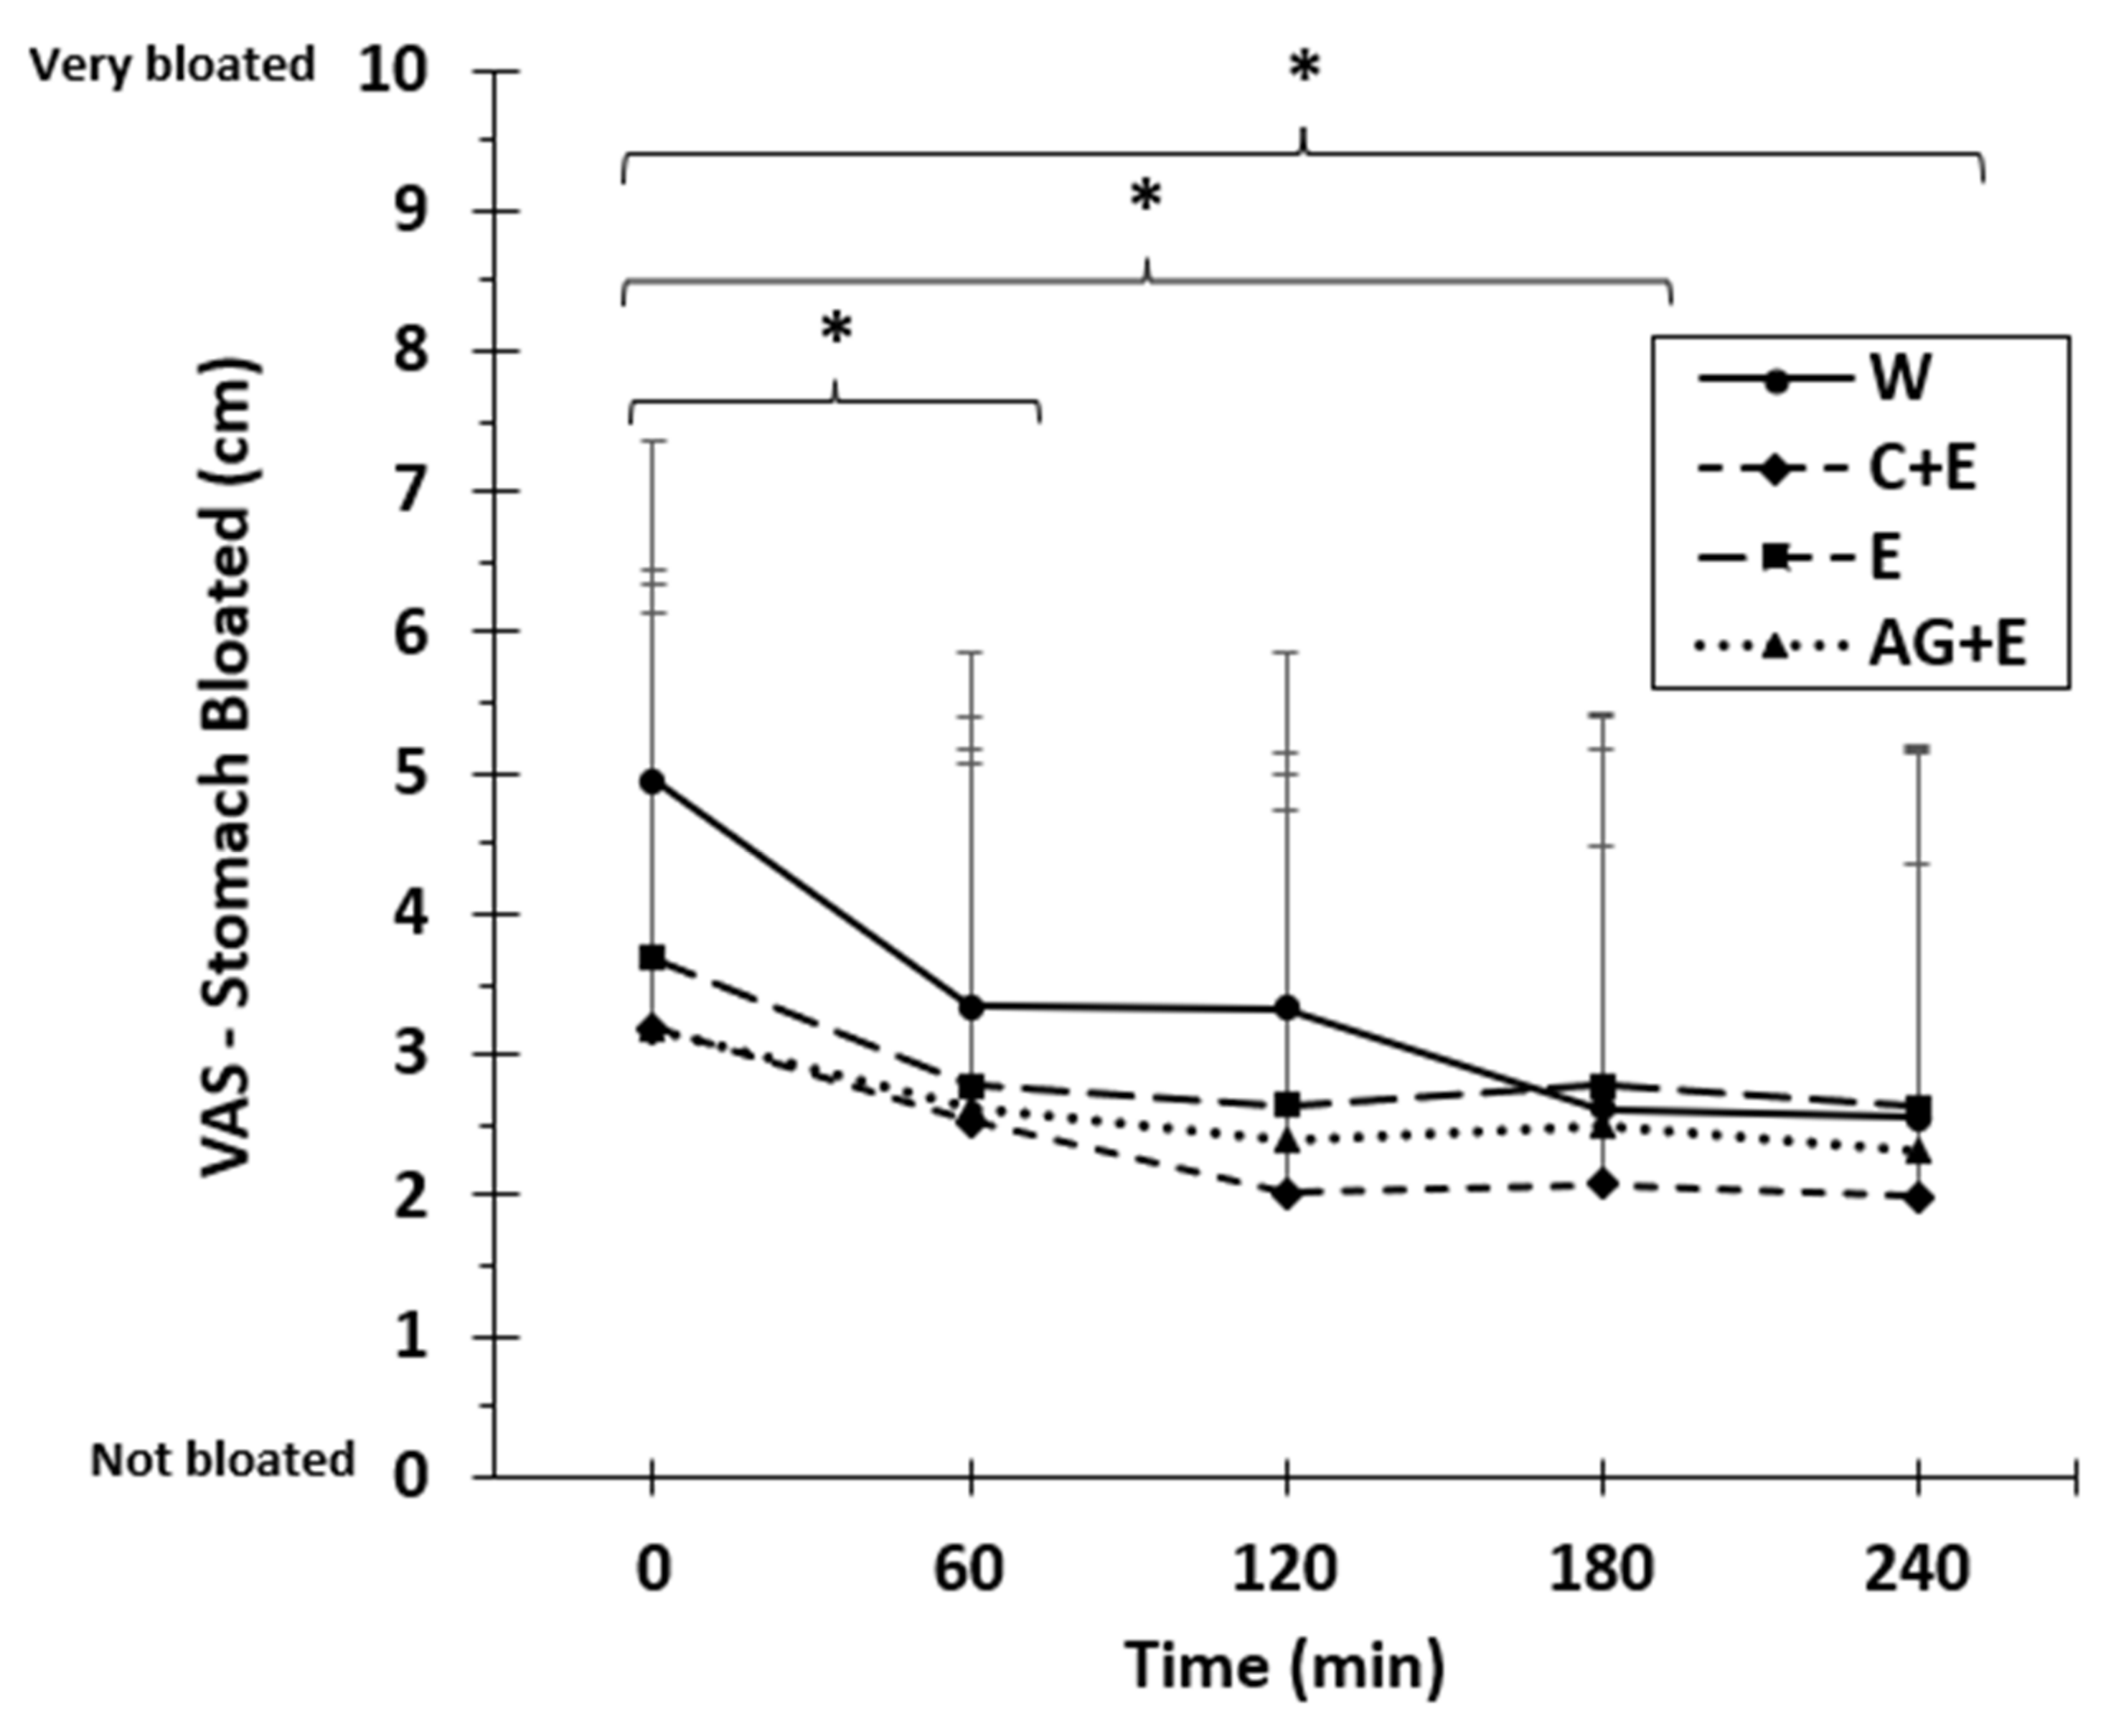
3.3. Beverage Ratings, Tolerance, and Acceptability
4. Discussion
Limitations
5. Conclusions
Author Contributions
Funding
Institutional Review Board
Informed Consent Statement
Acknowledgments
Conflicts of Interest
References
- Institute of Medicine. Dietary Reference Intakes for Water, Potassium, Sodium, Chloride, and Sulfate; The National Academies Press: Washington, DC, USA, 2005; p. 638. [Google Scholar]
- Sharp, R.L. Role of Whole Foods in Promoting Hydration after Exercise in Humans. J. Am. Coll. Nutr. 2007, 26, 592S–596S. [Google Scholar] [CrossRef]
- Maughan, R.J.; Leiper, J.B.; Shirreffs, S.M. Factors influencing the restoration of fluid and electrolyte balance after exercise in the heat. Br. J. Sports Med. 1997, 31, 175–182. [Google Scholar] [CrossRef]
- Ray, M.L.; Bryan, M.W.; Ruden, T.M.; Baier, S.M.; Sharp, R.L.; King, D.S. Effect of sodium in a rehydration beverage when consumed as a fluid or meal. J. Appl. Physiol. 1998, 85, 1329–1336. [Google Scholar] [CrossRef] [Green Version]
- Shirreffs, S.M.; Taylor, A.J.; Leiper, J.B.; Maughan, R.J. Post-exercise rehydration in man: Effects of volume consumed and drink sodium content. Med. Sci. Sports Exerc. 1996, 28, 1260–1271. [Google Scholar] [CrossRef] [PubMed]
- Amano, T.; Sugiyama, Y.; Okumura, J.; Fujii, N.; Kenny, G.P.; Nishiyasu, T.; Inoue, Y.; Kondo, N.; Sasagawa, K.; Enoki, Y.; et al. Effects of isomaltulose ingestion on postexercise hydration state and heat loss responses in young men. Exp. Physiol. 2019, 104, 1494–1504. [Google Scholar] [CrossRef] [PubMed]
- Osterberg, K.L.; Pallardy, S.E.; Johnson, R.J.; Horswill, C.A. Carbohydrate exerts a mild influence on fluid retention following exercise-induced dehydration. J. Appl. Physiol. 2010, 108, 245–250. [Google Scholar] [CrossRef] [PubMed] [Green Version]
- Shirreffs, S.M.; Watson, P.; Maughan, R.J. Milk as an effective post-exercise rehydration drink. Br. J. Nutr. 2007, 98, 173–180. [Google Scholar] [CrossRef] [PubMed] [Green Version]
- Evans, G.H.; James, L.J.; Shirreffs, S.M.; Maughan, R.J. Optimizing the restoration and maintenance of fluid balance after exercise-induced dehydration. J. Appl. Physiol. 2017, 122, 945–951. [Google Scholar] [CrossRef] [PubMed]
- Heaton, L.E.; Davis, J.K.; Rawson, E.S.; Nuccio, R.P.; Witard, O.C.; Stein, K.W.; Baar, K.; Carter, J.M.; Baker, L.B. Selected In-Season Nutritional Strategies to Enhance Recovery for Team Sport Athletes: A Practical Overview. Sports Med. 2017, 47, 2201–2218. [Google Scholar] [CrossRef]
- Leiper, J.B. Fate of ingested fluids: Factors affecting gastric emptying and intestinal absorption of beverages in humans. Nutr. Rev. 2015, 73, 57–72. [Google Scholar] [CrossRef] [Green Version]
- Orrù, S.; Imperlini, E.; Nigro, E.; Alfieri, A.; Cevenini, A.; Polito, R.; Daniele, A.; Buono, P.; Mancini, A. Role of Functional Beverages on Sport Performance and Recovery. Nutrients 2018, 10, 1470. [Google Scholar] [CrossRef] [PubMed] [Green Version]
- Maughan, R.J.; Watson, P.; Cordery, P.A.; Walsh, N.P.; Oliver, S.J.; Dolci, A.; Rodriguez-Sanchez, N.; Galloway, S.D. Sucrose and Sodium but not Caffeine Content Influence the Retention of Beverages in Humans Under Euhydrated Conditions. Int. J. Sport Nutr. Exerc. Metab. 2019, 29, 51–60. [Google Scholar] [CrossRef] [PubMed] [Green Version]
- Wolf, S.T.; Stanhewicz, A.; Clarke, M.M.; Cheuvront, S.N.; Kenefick, R.W.; Kenney, W.L. Age-related differences in water and sodium handling after commercial hydration beverage ingestion. J. Appl. Physiol. 2019, 126, 1042–1048. [Google Scholar] [CrossRef] [PubMed]
- Maughan, R.J.; Watson, P.; Cordery, P.A.; Walsh, N.P.; Oliver, S.J.; Dolci, A.; Rodriguez-Sanchez, N.; Galloway, S.D. A randomized trial to assess the potential of different beverages to affect hydration status: Development of a beverage hydration index. Am. J. Clin. Nutr. 2015, 103, 717–723. [Google Scholar] [CrossRef] [Green Version]
- Berry, C.W.; Wolf, S.T.; Murray, B.; Kenney, W.L. Hydration Efficacy of a Milk Permeate-Based Oral Hydration Solution. Nutrients 2020, 12, 1502. [Google Scholar] [CrossRef] [PubMed]
- Clarke, M.M.; Stanhewicz, A.; Wolf, S.T.; Cheuvront, S.N.; Kenefick, R.W.; Kenney, W.L. A randomized trial to assess beverage hydration index in healthy older adults. Am. J. Clin. Nutr. 2019, 109, 1640–1647. [Google Scholar] [CrossRef]
- Pence, J.; Bloomer, R.J. Impact of Nuun Electrolyte Tablets on Fluid Balance in Active Men and Women. Nutrients 2020, 12, 3030. [Google Scholar] [CrossRef] [PubMed]
- Sollanek, K.J.; Tsurumoto, M.; Vidyasagar, S.; Kenefick, R.W.; Cheuvront, S.N. Neither body mass nor sex influences beverage hydration index outcomes during randomized trial when comparing 3 commercial beverages. Am. J. Clin. Nutr. 2018, 107, 544–549. [Google Scholar] [CrossRef]
- World Health Organization. Reduced Osmolarity: Oral Rehydration Salts (ORS) Formulation: A Report from a Meeting of Experts Jointly Organised by UNICEF and WHO; WHO: Geneva, Switzerland, 2002. [Google Scholar]
- Lima, A.A.; Carvalho, G.; Figueiredo, A.A.; Gifoni, Â.R.; Soares, A.M.; Silva, E.A.; Guerrant, R.L. Effects of an alanyl-glutamine—based oral rehydration and nutrition therapy solution on electrolyte and water absorption in a rat model of secretory diarrhea induced by cholera toxin. Nutrients 2002, 18, 458–462. [Google Scholar] [CrossRef]
- Van Loon, F.P.; Banik, A.K.; Nath, S.K.; Patra, F.C.; Wahed, M.A.; Darmaun, D.; Desjeux, J.F.; Mahalanabis, D. The effect of L-glutamine on salt and water absorption: A jejunal perfusion study in cholera in humans. Eur. J. Gastroenterol. Hepatol 1996, 8, 443–448. [Google Scholar]
- Hoffman, J.R.; Ratamess, N.A.; Kang, J.; Rashti, S.L.; Kelly, N.; Gonzalez, A.M.; Stec, M.; Anderson, S.; Bailey, B.L.; Yamamoto, L.M.; et al. Examination of the efficacy of acute L-alanyl-L-glutamine ingestion during hydration stress in endurance exercise. J. Int. Soc. Sports Nutr. 2010, 7, 8. [Google Scholar] [CrossRef] [Green Version]
- Jackson, A.S.; Pollock, M.L. Generalized equations for predicting body density of men. Br. J. Nutr. 1978, 40, 497–504. [Google Scholar] [CrossRef] [Green Version]
- Jackson, A.S.; Pollock, M.L.; Ward, A. Generalized equations for predicting body density of women. Med. Sci. Sports Exerc. 1980, 12, 175–181. [Google Scholar] [CrossRef] [Green Version]
- Wang, Z.; Deurenberg, P.; Wang, W.; Pietrobelli, A.; Baumgartner, R.N.; Heymsfield, S.B. Hydration of fat-free body mass: Review and critique of a classic body-composition constant. Am. J. Clin. Nutr. 1999, 69, 833–841. [Google Scholar] [CrossRef] [PubMed]
- Jeukendrup, A.E.; Currell, K.; Clarke, J.; Cole, J.; Blannin, A.K. Effect of beverage glucose and sodium content on fluid delivery. Nutr. Metab. 2009, 6, 9. [Google Scholar] [CrossRef] [PubMed] [Green Version]
- Jeukendrup, A. A Step Towards Personalized Sports Nutrition: Carbohydrate Intake During Exercise. Sports Med. 2014, 44, 25–33. [Google Scholar] [CrossRef] [PubMed] [Green Version]
- Péronnet, F.; Mignault, D.; du Souich, P.; Vergne, S.; le Bellego, L.; Jimenez, L.; Rabasa-Lhoret, R. Pharmacokinetic analysis of absorption, distribution and disappearance of ingested water labeled with D2O in humans. Graefe’s Arch. Clin. Exp. Ophthalmol. 2012, 112, 2213–2222. [Google Scholar] [CrossRef] [PubMed] [Green Version]
- McDonough, A.A.; Youn, J.H. Potassium Homeostasis: The Knowns, the Unknowns, and the Health Benefits. Physiology 2017, 32, 100–111. [Google Scholar] [CrossRef]
- James, L.J.; Clayton, D.; Evans, G.H. Effect of milk protein addition to a carbohydrate–electrolyte rehydration solution ingested after exercise in the heat. Br. J. Nutr. 2010, 105, 393–399. [Google Scholar] [CrossRef]
- King, M.A.; Rollo, I.; Baker, L.B. Nutritional considerations to counteract gastrointestinal permeability during exertional heat stress. J. Appl. Physiol. 2021, 130, 1754–1765. [Google Scholar] [CrossRef]
- Bröer, S.; Fairweather, S.J. Amino Acid Transport Across the Mammalian Intestine. Compr. Physiol. 2018, 9, 343–373. [Google Scholar] [CrossRef] [PubMed]
- Harris, R.C.; Hoffman, J.R.; Allsopp, A.; Routledge, N.B. L-glutamine absorption is enhanced after ingestion of L-alanylglutamine compared with the free amino acid or wheat protein. Nutr. Res. 2012, 32, 272–277. [Google Scholar] [CrossRef] [PubMed]
- Kim, M.-H.; Kim, H. The Roles of Glutamine in the Intestine and Its Implication in Intestinal Diseases. Int. J. Mol. Sci. 2017, 18, 1051. [Google Scholar] [CrossRef] [Green Version]
- Hoffman, J.R.; Williams, D.R.; Emerson, N.S.; Hoffman, M.W.; Wells, A.J.; McVeigh, D.M.; McCormack, W.P.; Mangine, G.T.; Gonzalez, A.M.; Fragala, M.S. L-alanyl-L-glutamine ingestion maintains performance during a competitive basketball game. J. Int. Soc. Sports Nutr. 2012, 9, 4. [Google Scholar] [CrossRef] [PubMed] [Green Version]


| Men (n = 15) | Women (n = 4) | Total (n = 19) | |
|---|---|---|---|
| Age (years) | 25.3 ± 6.1 | 22.8 ± 2.1 | 24.7 ± 5.6 |
| Height (cm) | 180.0 ± 7.2 | 169.5 ± 5.7 | 177.8 ± 8.1 |
| Weight (kg) | 79.1 ± 9.5 | 67.2 ± 13.4 | 76.6 ± 11.2 |
| % Body Fat—Skinfold | 12.5 ± 4.9 | 24.9 ± 7.0 | 15.1 ± 7.4 |
| Body Mass Index | 24.4 ± 2.5 | 23.6 ± 5.3 | 24.3 ± 2.9 |
| Fat Free Mass (kg)—Skinfold | 69.3 ± 8.5 | 49.7 ± 6.0 | 65.2 ± 11.4 |
| Total Body Water (kg)—Skinfold | 52.3 ± 6.3 | 38.1 ± 6.1 | 49.9 ± 8.2 |
| Total Body Water (kg)—InBody | 48.7 ± 5.8 | 33.8 ± 2.1 | 46.2 ± 7.8 |
| Beverage | Osmolality (mOsm/kg) | Sodium (mmol) | Potassium (mmol) | Energy (kcal/L) |
|---|---|---|---|---|
| Water | 2.2 ± 1.9 | 0.3 ± 0.1 | 0.5 ± 0.3 | 0 |
| C + E | 441.8 ± 0.8 | 21.3 ± 0.7 | 2.9 ± 0.1 | 232 |
| E | 87.6 ± 0.5 | 21.7 ± 0.0 | 3.1 ± 0.0 | 0 |
| AG + E | 94.8 ± 1.6 | 22.9 ± 0.4 | 3.3 ± 0.0 | 8 |
| WATER | C + E | E | AG + E | |
|---|---|---|---|---|
| Water (g) | 2487 ± 1290 | 2785 ± 1254 | 2616 ± 1452 | 2815 ± 1118 |
| Energy (kcal) | 2166 ± 691 | 1943 ± 713 | 1906 ± 536 | 2057 ± 582 |
| Sodium (mg) | 3375 ± 1423 | 3082 ± 1814 | 2948 ± 1448 | 2801 ± 1067 |
| Protein (g) | 116 ± 54 | 86 ± 43 | 109 ± 62 | 116 ± 61 |
| Carbohydrate (g) | 232 ± 80 | 231 ± 99 | 215 ± 80 | 222 ± 82 |
| Water | C + E | E | AG + E | |
|---|---|---|---|---|
| Bitter | 0.9 ± 1.7 | 1.2 ± 1.4 | 1.6 ± 1.6 | 1.7 ± 2.0 |
| Sweet | 1.0 ± 1.7 | 6.6 ± 1.6 * | 7.2 ± 1.4 * | 6.8 ± 1.8 * |
| Sour | 0.9 ± 1.7 | 2.2 ± 2.2 | 1.9 ± 2.1 | 2.0 ± 2.2 |
| Salty | 0.9 ± 1.7 | 2.1 ± 2.2 * | 2.2 ± 2.3 * | 2.2 ± 1.6 * |
| Taste | 4.4 ± 1.4 | 7.1 ± 1.7 * | 6.4 ± 1.3 * | 6.8 ± 1.7 * |
| Thirst Quenching | 6.5 ± 1.8 | 7.2 ± 1.1 | 7.0 ± 1.7 | 7.1 ± 1.5 |
| Upset Stomach | 2.9 ± 2.8 | 1.7 ± 2.3 | 2.3 ± 2.6 | 2.2 ± 2.7 |
| Stomach Bloating | 4.9 ± 2.4 | 3.2 ± 2.9 * | 3.7 ± 2.8 | 3.2 ± 3.2 * |
| Nausea | 1.5 ± 2.0 | 1.0 ± 1.8 | 0.8 ± 1.2 | 1.2 ± 1.8 |
| Drink Again | 7.1 ± 3.0 | 7.2 ± 2.6 | 6.0 ± 2.4 | 6.1 ± 2.9 |
| Makes Me Feel Good | 4.6 ± 1.5 | 5.9 ± 2.1 | 5.5 ± 1.2 | 5.8 ± 2.0 |
Publisher’s Note: MDPI stays neutral with regard to jurisdictional claims in published maps and institutional affiliations. |
© 2021 by the authors. Licensee MDPI, Basel, Switzerland. This article is an open access article distributed under the terms and conditions of the Creative Commons Attribution (CC BY) license (https://creativecommons.org/licenses/by/4.0/).
Share and Cite
Millard-Stafford, M.; Snow, T.K.; Jones, M.L.; Suh, H. The Beverage Hydration Index: Influence of Electrolytes, Carbohydrate and Protein. Nutrients 2021, 13, 2933. https://doi.org/10.3390/nu13092933
Millard-Stafford M, Snow TK, Jones ML, Suh H. The Beverage Hydration Index: Influence of Electrolytes, Carbohydrate and Protein. Nutrients. 2021; 13(9):2933. https://doi.org/10.3390/nu13092933
Chicago/Turabian StyleMillard-Stafford, Mindy, Teresa K. Snow, Michael L. Jones, and HyunGyu Suh. 2021. "The Beverage Hydration Index: Influence of Electrolytes, Carbohydrate and Protein" Nutrients 13, no. 9: 2933. https://doi.org/10.3390/nu13092933
APA StyleMillard-Stafford, M., Snow, T. K., Jones, M. L., & Suh, H. (2021). The Beverage Hydration Index: Influence of Electrolytes, Carbohydrate and Protein. Nutrients, 13(9), 2933. https://doi.org/10.3390/nu13092933