
The Impact of Lifestyle, Diet and Physical Activity on Epigenetic Changes in the Offspring—A Systematic Review

 and
and
Abstract
:1. Introduction
2. Materials and Methods
Data Extraction and Quality Assessment
3. Results
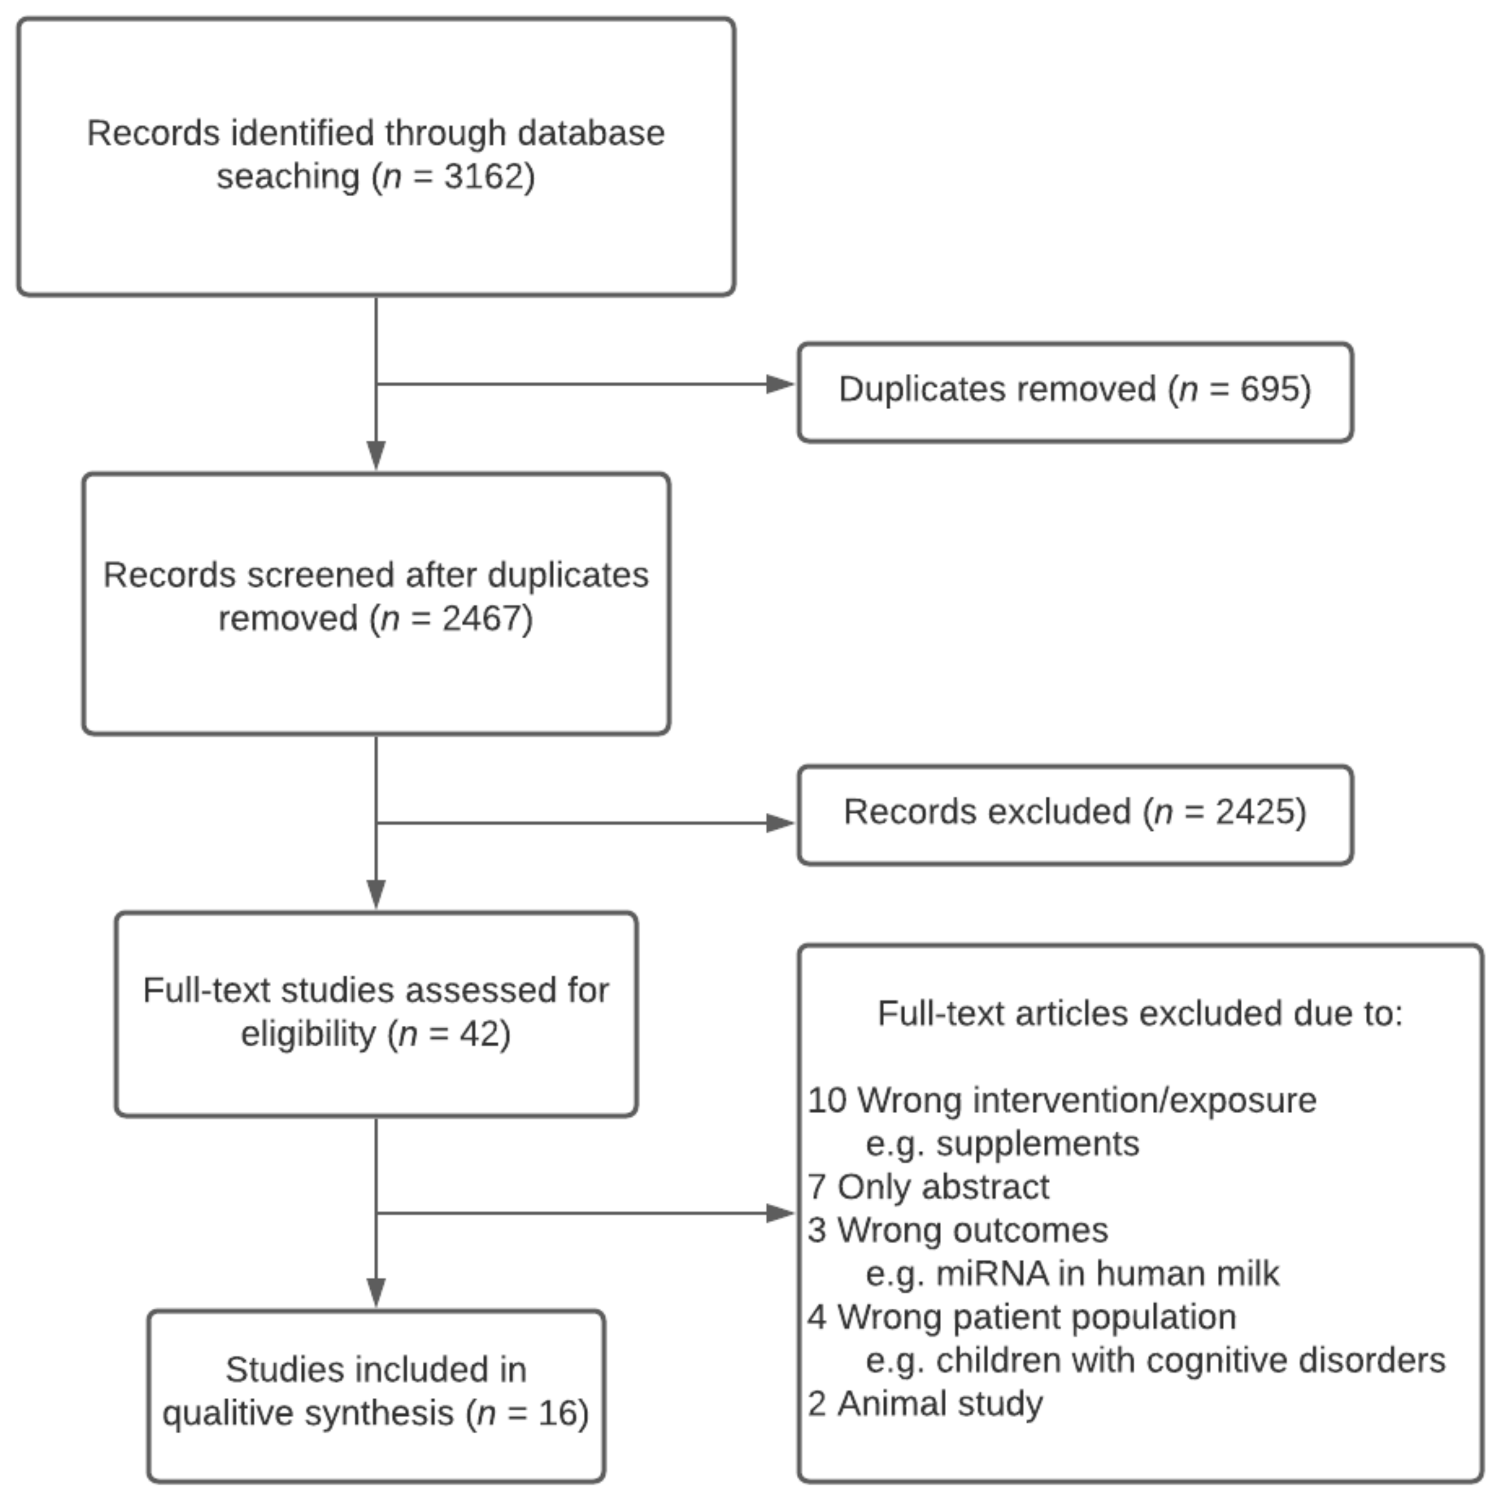
3.1. Search Results
3.2. Summary of Study Characteristics
3.3. Study Quality
3.4. Specific Gene Approach
3.5. Genome-Wide Approach
4. Discussion
4.1. Specific Gene Approach
4.2. Genome-Wide Approach
4.3. Strengths and Limitations
5. Conclusions
Author Contributions
Funding
Conflicts of Interest
Abbreviations
| ADD2 | Adducin 2 |
| BMI | Body mass index |
| DII | Dietary inflammatory index |
| DMR | Differentially methylated region |
| CASP | Critical Appraisal Skills Program |
| CpG | Cytosine-phosphate-guanine |
| FDR | False discovery rate |
| GA | Gestational age |
| GDM | Gestational diabetes mellitus |
| GWG | Gestational weight gain |
| GR | Glucocorticoid receptor |
| HA | High active |
| HSD2 | 11β-hydroxysteroid dehydrogenase type 2 |
| IGF-2 | Insulin-like growth factor 2 |
| LA | Low active |
| LGA | Large for gestational age |
| LINE | Long interspersed nuclear elements |
| LTPA | Leisure-time physical activity |
| MEG3 | Maternally expressed 3 |
| MEST | Mesoderm-specific transcript |
| miRNA | MicroRNA |
| NNAT | Neuronatin |
| OGTT | Oral glucose tolerance test |
| PEG | Polyethylen glycol |
| PLAG1 | Pleomorphic adenoma gene 1 |
| RCT | Randomized Controlled Trial |
| RoB | Revised Cochrane risk-of-bias tool |
| RXRs | Retinoid X receptors |
| SGCE | Sarcoglycan epsilon |
| SNP | Single-nucleotide polymorphism |
| SST | Somastostetin |
| SSTR4 | Somatostatin receptor 4 |
| TNDM | Transient neonatal diabetes mellitus |
| UC | Umbilical cord |
| UK | United Kingdom |
| USA | United States of America |
| 5′ UTR | 5′ Untranslated region |
Appendix A. Literature Search
- #1
- (pregnancy OR neonatal OR infant OR maternal OR maternit* OR paternit* OR paternal OR preconception OR periconception OR offspring):ti,ab,kw (Word variations have been searched): 120,264
- #2
- MeSH descriptor: [Pregnancy] explode all trees: 22,290
- #3
- MeSH descriptor: [Mothers] explode all trees: 1853
- #4
- MeSH descriptor: [Infant] explode all trees: 32,413
- #5
- MeSH descriptor: [Paternalism] explode all trees: 8
- #6
- #1 OR #2 OR #3 OR #4 OR #5: 120,760
- #7
- (epigenom* OR microRNA* OR DNA methylation):ti,ab,kw: 1952
- #8
- MeSH descriptor: [Epigenomics] explode all trees: 8
- #9
- MeSH descriptor: [Epigenomics] explode all trees: 8
- #10
- MeSH descriptor: [MicroRNAs] explode all trees: 173
- #11
- MeSH descriptor: [DNA Methylation] explode all trees: 236
- #12
- #7 OR #8 OR #9 OR #10 OR #11: 1952
- #13
- (food OR nutrient* OR nutrition* OR diet* OR exercise OR physical activity):ti,ab,kw: 234,523
- #14
- MeSH descriptor: [Food] explode all trees: 34,794
- #15
- MeSH descriptor: [Diet] explode all trees: 18,618
- #16
- MeSH descriptor: [Nutrients] explode all trees: 5254
- #17
- MeSH descriptor: [Exercise] explode all trees: 25,067
- #18
- #13 OR #14 OR #15 OR #16 OR #17: 244,447
- #19
- #6 AND #12 AND #18: 94
- #20
- MeSH descriptor: [Animals] explode all trees: 599,446
- #21
- MeSH descriptor: [Humans] explode all trees: 599,386
- #22
- #20 NOT #21: 60
- #23
- #19 NOT #22: 94
Appendix B. Example of a Search Block (PubMed)

| BLOCK 1 | AND | BLOCK 2 | AND | BLOCK 3 | NOT | BLOCK 4 |
| Pregnancy | Food | Epigenome | Animals | |||
| Mothers | Diet | Epigenomics | ||||
| Infant | Nutrients | MicroRNAs | ||||
| Paternity | Exercise | DNA methylation | ||||
| neonatal | Nutrient | Epigenom* | ||||
| maternal | Nutrition | microRNA* | ||||
| maternit* | diet | |||||
| paternit* | Physical activity | |||||
| paternal* | ||||||
| preconception | ||||||
| Periconception | ||||||
| offspring |
Appendix C. Template to Extract Relevant Study Data
| Study/Data | Antoun et al., 2020 | Daniels et al., 2020 | …. |
| Basic | |||
| Publication year | |||
| Country/Location | |||
| Study design | |||
| Participants | |||
| Number of participants (n) | |||
| Sociodemographic data | |||
| Health status/diseases | |||
| Ethnic groups | |||
| Age of offspring/child | |||
| Gender of infant | |||
| Intervention/Exposures | |||
| Dietary pattern | |||
| Dietary intake | |||
| Physical activity level | |||
| Control group/comparison | |||
| Outcome methodology/tool | |||
| The methodology used to assess DNA methylation | |||
| The methodology used to assess changes in Noncoding RNA, including microRNA | |||
| Tissue | |||
| Confounding variables | |||
| Results | |||
| DNA methylation levels | |||
| Reported global/gene-specific methylation | |||
| Changes in DNA methylation between groups (hypo- or hyper-methylation) | |||
| Log fold changes used in comparison between groups | |||
| Changes in microRNA | |||
| Main results | |||
| Statistical analyses employed in the study | |||
| Conclusion |
References
- Marciniak, A.; Patro-Małysza, J.; Kimber-Trojnar, Z.; Marciniak, B.; Oleszczuk, J.; Leszczyńska-Gorzelak, B. Fetal programming of the metabolic syndrome. Taiwan. J. Obstet. Gynecol. 2017, 56, 133–138. [Google Scholar] [CrossRef]
- Dunford, A.R.; Sangster, J.M. Maternal and paternal periconceptional nutrition as an indicator of offspring metabolic syndrome risk in later life through epigenetic imprinting: A systematic review. Diabetes Metab. Syndr. Clin. Res. Rev. 2017, 11, S655–S662. [Google Scholar] [CrossRef]
- McCullough, L.E.; Miller, E.E.; Calderwood, L.E.; Shivappa, N.; Steck, S.E.; Forman, M.R.; Mendez, M.A.; Maguire, R.; Fuemmeler, B.F.; Kollins, S.H.; et al. Maternal inflammatory diet and adverse pregnancy outcomes: Circulating cytokines and ge-nomic imprinting as potential regulators? Epigenetics 2017, 12, 688–697. [Google Scholar] [CrossRef]
- Marshall, M.R.; Paneth, N.; Gerlach, J.A.; Mudd, L.M.; Biery, L.; Ferguson, D.; Pivarnik, J.M. Differential methylation of insulin-like growth factor 2 in offspring of physically active pregnant women. J. Dev. Orig. Health Dis. 2018, 9, 299–306. [Google Scholar] [CrossRef]
- Hjort, L.; Novakovic, B.; Grunnet, L.G.; Maple-Brown, L.; Damm, P.; Desoye, G.; Saffery, G. Diabetes in pregnancy and epigenetic mechanisms-how the first 9 months from conception might affect the child’s epigenome and later risk of disease. Lancet Diab. Endocrinol. 2019, 7, 796–806. [Google Scholar] [CrossRef]
- McCullough, L.E.; Mendez, H.A.; Miller, E.E.; Murtha, P.A.; Murphy, S.K.; Hoyo, C. Associations between prenatal physical activity, birth weight, and DNA methylation at genomi-cally imprinted domains in a multiethnic newborn cohort. Epigenetics 2015, 10, 597–606. [Google Scholar] [CrossRef] [Green Version]
- Opsahl, J.O.; Moen, G.-H.; Qvigstad, E.; Bottcher, Y.; Birkeland, K.I.; Sommer, C. Epigenetic signatures associated with maternal body mass index or gestational weight gain: A system-atic review. J. Dev. Orig. Health Dis. 2021, 12, 373–383. [Google Scholar] [CrossRef]
- Page, M.J.; McKenzie, J.E.; Bossuyt, P.M.; Boutron, I.; Hoffmann, T.C.; Mulrow, C.D.; Shamseer, L.; Tetzlaff, J.M.; Akl, E.A.; Brennan, S.E.; et al. The PRISMA 2020 statement: An updated guideline for reporting systematic reviews. BMJ 2021, 372, n71. [Google Scholar] [CrossRef]
- Covidence. Covidence—Better Systematic Review Management. 2019. Available online: https://www.covidence.org/ (accessed on 14 March 2021).
- Cochrane Collaboration. RoB 2: A Revised Cochrane Risk-Of-Bias Tool for Randomized Trials. Available online: https://methods.cochrane.org/bias/resources/rob-2-revised-cochrane-risk-bias-tool-randomized-trials (accessed on 4 April 2021).
- CRITICAL APPRAISAL SKILLS PROGRAMME (CASP). CASP Checklists 2021. Available online: https://casp-uk.net/casp-tools-checklists/ (accessed on 4 April 2021).
- Daniels, T.E.; Sadovnikoff, A.I.; Ridout, K.K.; Lesseur, C.; Marsit, C.J.; Tyrka, A.R. Associations of maternal diet and placenta leptin methylation. Mol. Cell. Endocrinol. 2020, 505, 110739. [Google Scholar] [CrossRef]
- Drake, A.J.; McPherson, R.C.; Godfrey, K.M.; Cooper, C.; Lillycrop, K.A.; Hnason, M.A.; Meehan, R.R.; Seckl, J.R.; Reynolds, R.M. An unbalanced maternal diet in pregnancy associates with offspring epigenetic changes in genes con-trolling glucocorticoid action and foetal growth. Clin. Endocrinol. 2012, 77, 808–815. [Google Scholar] [CrossRef] [PubMed]
- Godfrey, K.M.; Sheppard, A.; Gluckman, P.D.; Lollycrop, K.A.; Burdge, G.A.; McLean, C.; Rodfoard, E.; Slater-Jefferies, S.; Garratt, E.; Crozier, S.R.; et al. Epigenetic gene promoter methylation at birth is associated with child’s later adiposity. Diabetes 2011, 60, 1528–1534. [Google Scholar] [CrossRef] [PubMed] [Green Version]
- González, C.R.; González, B. Exploring the Stress Impact in the Paternal Germ Cells Epigenome: Can Catecholamines Induce Epigenetic Reprogramming? Front. Endocrinol. 2020, 11, 630948. [Google Scholar] [CrossRef] [PubMed]
- Miyaso, H.; Sakurai, K.; Takase, S.; Eguchi, A.; Watanabe, M.; Fukuoka, H.; Mori, C. The methylation levels of the H19 differentially methylated region in human umbilical cords reflect newborn parameters and changes by maternal environmental factors during early pregnancy. Environ. Res. 2017, 157, 1–8. [Google Scholar] [CrossRef]
- Antoun, E.; Kitaba, N.T.; Titcombe, P.; Dalrymple, K.V.; Garratt, E.S.; Barton, S.J.; Murray, R.; Seed, P.T.; Holbrook, J.D.; Kobor, M.S.; et al. Maternal dysglycaemia, changes in the infant’s epigenome modified with a diet and physical activity intervention in pregnancy: Secondary analysis of a randomised control trial. PLoS Med. 2020, 17, e1003229. [Google Scholar] [CrossRef] [PubMed]
- Geraghty, A.A.; Sexton-Oates, A.; O’Brien, E.C.; Saffery, R.; McAuliffe, F.M. Epigenetic Patterns in Five-Year-Old Children Exposed to a Low Glycemic Index Dietary Intervention during Pregnancy: Results from the ROLO Kids Study. Nutrition 2020, 12, 3602. [Google Scholar] [CrossRef]
- Geraghty, A.A.; Saxton-Oates, A.; O’Brien, E.C.; Alberdi, G.; Frasquet, P.; Saffery, R.; McAuliffe, F.F. A low glycaemic index diet in pregnancy induces DNA methylation variation in blood of new-borns: Results from the ROLO randomised controlled trial. Nutrients 2018, 10, 455. [Google Scholar] [CrossRef] [Green Version]
- Gomez Ribot, D.; Diaz, G.; Fazion, M.V.; Gomez, H.L.; Fornes, D.; Macchi, S.B.; Gresta, C.A.; Capobianco, E.; Jawerbaun, A. An extra virgin olive oil-enriched diet improves maternal, placental, and cord blood parameters in GDM pregnancies. Diabetes Metabol. Res. Rev. 2020, 36, 10. [Google Scholar] [CrossRef]
- Jönsson, J.; Renault, K.M.; García-Calzón, S.; Perfilyev, A.; Estampador, A.C.; Nørgaard, K.; Lind, M.V.; Vaag, A.; Hjort, L.; Michaelsen, K.F.; et al. Lifestyle Intervention in Pregnant Women with Obesity Impacts Cord Blood DNA Methylation, Which Associates with Body Composition in the Offspring. Diabetes 2021, 70, 854–866. [Google Scholar] [CrossRef]
- Thakali, K.M.; Zhong, Y.; Cleves, M.; Andres, A.; Shankar, K. Associations between maternal body mass index and diet composition with placental DNA methyla-tion at term. Placenta 2020, 93, 74–82. [Google Scholar] [CrossRef]
- Trumpff, C.; Sturm, G.; Picard, M.; Foss, S.; Lee, S.; Feng, T.; Cardenas, A.; McCormack, C.; Champagne, F.A.; Monk, C. Added sugar intake during pregnancy: Fetal behavior, birth outcomes, and placental DNA methylation. Dev. Psychobiol. 2021, 63, 12. [Google Scholar] [CrossRef]
- Yan, W.; Zhang, Y.; Wang, L.; Yang, W.; Li, C.; Gu, P.; Xia, Y.; Yan, J.; Shen, Y.; Zhao, Q.; et al. Maternal dietary glycaemic change during gestation influences insulin-related gene methylation in the placental tissue: A genome-wide methylation analysis. Genes Nutr. 2019, 14, 17. [Google Scholar] [CrossRef]
- Gonzalez-Nahm, S.; Mendez, M.; Robinson, W.; Murphy, S.K.; Hoyo, C.; Hogan, V.; Rowley, D. Low maternal adherence to a Mediterranean diet is associated with increase in methylation at the MEG3-IG differentially methylated region in female infants. Environ. Epigenetics 2017, 3, dvx007. [Google Scholar] [CrossRef] [PubMed]
- Antoun, E.; Kitaba, P.; Titcombe, P.; Dalrymple, K.; Seed, P.T.; White, S.L.; Burdge, G.C.; Poston, L.; Godfrey, K.M.; Lillycrop, K.A. Maternal gestational diabetes is associated with changes in the infant methylome. Diabet. Med. 2019, 36, 65–66. [Google Scholar]
- Godfrey, K.M.; Inskip, H.M.; Hanson, M.A. The Long-Term Effects of Prenatal Development on Growth and Metabolism. Semin. Reprod. Med. 2011, 29, 257–265. [Google Scholar] [CrossRef] [Green Version]
- Mackay, D.J.; Temple, I.K. Transient neonatal diabetes mellitus type 1. Am. J. Med. Genet. Part C Semin. Med. Genet. 2010, 154C, 335–342. [Google Scholar] [CrossRef] [PubMed]
- Bao, D.; Yuan, R.X.; Zhang, Y. Effects of lncRNA MEG3 on proliferation and apoptosis of gallbladder cancer cells through regulating NF-κB signaling pathway. Eur. Rev. Med. Pharmacol. Sci. 2020, 24, 6632–6638. [Google Scholar] [PubMed]
- Chang, W.-W.; Zhang, L.; Yao, X.-M.; Chen, Y.; Zhu, L.-J.; Fang, Z.-M.; Zhao, Y.; Yao, Y.-S.; Jin, Y.-L. Upregulation of long non-coding RNA MEG3 in type 2 diabetes mellitus complicated with vascular disease: A case–control study. Mol. Cell. Biochem. 2020, 473, 93–99. [Google Scholar] [CrossRef]
- Buccarelli, M.; Lulli, V.; Giuliani, A.; Signore, M.; Martini, M.; D’Alessandris, Q.G.; Giannetti, S.; Novelli, A.; Ilari, R.; Giurato, G.; et al. Deregulated expression of the imprinted DLK1-DIO3 region in glioblastoma stemlike cells: Tumor suppressor role of lncRNA MEG3. Neuro Oncol. 2020, 22, 1771–1784. [Google Scholar] [CrossRef]
- Alipoor, B.; Parvar, S.N.; Sabati, Z.; Ghaedi, H.; Ghasemi, H. An updated review of the H19 lncRNA in human cancer: Molecular mechanism and diagnostic and therapeutic importance. Mol. Biol. Rep. 2020, 47, 6357–6374. [Google Scholar] [CrossRef]
- Yaghootkar, H.; Zhang, Y.; Spracklen, C.N.; Karaderi, T.; Huang, L.O.; Bradfield, J.; Schurmann, C.; Fine, R.S.; Preuss, M.H.; Kutalik, Z.; et al. Genetic Studies of Leptin Concentrations Implicate Leptin in the Regulation of Early Adiposity. Diabetes 2020, 69, 2806–2818. [Google Scholar] [CrossRef]
- Li, J.; Gao, Y.; Yu, T.; Lange, J.K.; LeBoff, M.S.; Gorska, A.; Luu, S.; Zhou, S.; Glowacki, J. Obesity and leptin influence vitamin D metabolism and action in human marrow stromal cells. J. Steroid Biochem. Mol. Biol. 2019, 198, 105564. [Google Scholar] [CrossRef]
- Chen, L.; Wu, L.; Zhu, L.; Zhao, Y. Overview of the structure-based non-genomic effects of the nuclear receptor RXRα. Cell. Mol. Biol. Lett. 2018, 23, 36. [Google Scholar] [CrossRef]
- Chen, Y.; Ma, G.; Hu, Y.; Yang, Q.; Deavila, J.M.; Zhu, M.-J.; Du, M. Effects of Maternal Exercise During Pregnancy on Perinatal Growth and Childhood Obesity Outcomes: A Meta-analysis and Meta-regression. Sports Med. 2021, 1–19. [Google Scholar] [CrossRef]
- Patel, Y.C. Somatostatin and Its Receptor Family. Front. Neuroendocr. 1999, 20, 157–198. [Google Scholar] [CrossRef] [PubMed]
- Mansell, T.; Barwon Infant Study Investigator Team; Ponsonby, A.-L.; Collier, F.; Burgner, D.; Vuillermin, P.; Lange, K.; Ryan, J.; Saffery, R. Genetic variation, intrauterine growth, and adverse pregnancy conditions predict leptin gene DNA methylation in blood at birth and 12 months of age. Int. J. Obes. 2019, 44, 45–56. [Google Scholar] [CrossRef] [PubMed]
| Gene-Specific Approach | |||||||
|---|---|---|---|---|---|---|---|
| Study | Design | Participants | Location | Confounding Variables | Tissue | Tool | Comparison |
| Daniels et al., 2020 [12] | Cohort | 135 Mother–offspring pairs. Mainly white mothers (72.5%) | USA | Maternal age, rs2167270 genotype, pre-pregnancy obesity and gestational diabetes | Placenta | Pyrosequencing, Pyromark MD (Qiagen) | Association between maternal intake of carbohydrates and added sugar intake and DNA methylation |
| Drake et al., 2012 [13] | Cohort | 34 Mother–offspring pairs (40 years old) | Scotland | Neonatal anthropometry: Gestational age at delivery, parity, sex and maternal antenatal BMI Adult anthropometry: blood pressure | Peripheral blood | Pyrosequencing | Association of maternal adherence to dietary advice of increased protein and reduced carbohydrate intake during pregnancy and DNA methylation |
| Godfrey et al., 2011 [14] | 2 × Cohort 1 | 78/239 Mother–offspring pairs. In the explorative cohort (PAH), the included mothers were primarily white | UK | Sex, maternal age, adiposity and smoking during pregnancy | Cord blood | Sequenom MassARRAY | Association between maternal intake of carbohydrate, fat and protein and DNA methylation |
| Gonzalez-Nahm et al., 2017 [15] | Cohort | 390 Mother–offspring pairs | USA | Maternal pre-pregnancy BMI, maternal age, maternal smoking during pregnancy and maternal education | Cord blood | Pyrosequencing | Association between maternal adherence to a Mediterranean diet and DNA methylation. Participants were grouped to either low adherence, medium or high adherence |
| Marshall et al., 2018 [4] | Cohort | 42 Mother–offspring pairs | USA | NA 2 | Infant blood spots | Pyrosequencing | Association between maternal physical activity and DNA methylation. Participants were grouped according to leisure-time physical activity. ‘High active’ group: average 637.5 min per week versus ‘low active’ group: average 59.5 min per week |
| McCullough et al., 2015 [6] | Cohort | 484 Mother–offspring pairs. 7% mothers with (gestational diabetes) GDM. 46% Black, 69% White, 29% Hispanic | USA | Race/ethnicity and preterm birth | Cord blood | Pyrosequencing (Pyromark Q96 MD pyrosequencer (Qigen)) | Association between maternal sedentary time and DNA methylation. Participants were grouped according to physical activity level (non-sedentary time) in quartiles |
| McCullough et al., 2017 [3] | Cohort | 1057 Mother–offspring pairs. 43% Black, 34% White and 23% Hispanic | USA | Maternal race/ethnicity, BMI at last menstrual period and maternal smoking | Cord blood | Pyrosequencing | Association between maternal intake of a pro-inflammatory diet and DNA methylation. Participants were grouped in dietary inflammatory index (DII) quartiles |
| Miyaso et al., 2017 [16] | Cohort | 91 Mother–offspring pairs. Majority Asian | Japan | Maternal BMI, maternal socioeconomic status (education and income), newborn sex and head circumference | Umbilical cord tissue | MS-HRM analysis | Association between maternal calorie and carbohydrate intake and DNA methylation |
| Genome-wide approach | |||||||
| Study | Design | Participants | Location | Confounding Variables | Tissue | Tool | Comparison |
| Antoun et al., 2020 [17] | RCT | 294 Mother–offspring pairs. Pre-pregnancy BMI ≥ 30 kg/m2–72.3% White, 5.2% Asian, 17.7% Black, 4.8% others | UK | Maternal age, predicted values for white blood cells and nucleated red blood cells composition, smoking, ethnicity, parity and neonate sex | Cord blood | Illumina Human Methylation EPIC Beadchip (850 K) | Effect of a low glycemic index diet, reduced saturated fat intake and increased physical activity intervention during pregnancy compared with standard antenatal care on DNA methylation |
| Geraghty et al., 2020 [18] | RCT | 60 Mother–offspring pairs (5 years old). Inclusion criteria: mothers who had previously given birth to a macrosomic infant. 96.8% White mothers | Ireland | Offspring sex | Saliva | Illumina Human Methylation EPIC Beadchip (850 K) | Effect of a low glycemic index diet intervention during pregnancy (received dietary education session with a research dietitian with dietary advice regarding healthy eating in general and specifically about a low glycemic index diet) compared to antenatal care and no specific dietary advice on DNA methylation |
| Geraghty et al., 2018 [19] | RCT | 60 Mother–offspring pairs Included mothers who had previously given birth to a macrosomic infant. Mean BMI in early pregnancy: 25.75. 96.8% white | Ireland | Offspring sex and gestational age | Cord blood serum | Illumina Human Methylation EPIC Beadchip (850 K) | Effect of a low glycemic index diet intervention during pregnancy (received dietary education session with a research dietitian with dietary advice regarding healthy eating in general and specifically about a low glycemic index diet) compared to antenatal care and no specific dietary advice on DNA methylation |
| Gomez Ribot et al., 2020 [20] | 45 Mother–offspring pairs. 30 Mothers had GDM 3 | Argentina | NA 4 | Placenta | TaqMan detection system | Effect of an intervention with olive oil on miRNA in women with GDM (15 received three tablespoons of olive oil and 15 received only none to one tablespoon a day) and compared to healthy controls (n = 15). All were advised on healthy eating | |
| Jönsson et al., 2021 [21] | RCT | 208 Mothers with obesity and their offspring. Mean pre-pregnancy BMI (SD): Intervention: 34.19 (4.00) kg/m2; control: 34.36 (3.98) kg/m2 | Denmark | Maternal age, pre-pregnancy BMI, GWG, GA and offspring sex | Cord blood | Illumina Infinium HumanMethylation450 BeadChips | Effect of a physical activity assessed with pedometer and dietary advice (PA + D), or only physical activity (PA) compared to a control group receiving standard of care on DNA methylation |
| Thakali et al., 2020 [22] | Cohort | 150 Mother–offspring pairs; 72 mothers with normal weight and 78 mothers with overweight/obesity | USA | Maternal age at delivery, infant sex and delivery mode | Placenta | Reduced representation bisulfite sequencing (RRBS) | Association between maternal intake of carbohydrate, protein and fat and DNA methylation |
| Trumpff et al., 2021 [23] | Cohort | 73 Mother–offspring pairs. 2% of mothers had diabetes mellitus. 68% Hispanic, 32% Not Hispanic | USA | Birthweight, sex, pregnancy complications, maternal age, average maternal calorie intake and maternal pre-pregnancy weight | Placenta | Illumina Human Methylation 450 K Beadchip | Association between maternal intake of sugar (in teaspoons equivalents) and DNA methylation |
| Yan et al., 2019 [24] | Cohort | 24/153 5 Mothers with overweight 33.3% had GDM in case group, 16.7% had GDM in control group | China | Maternal age, BMI, Homeostatic Model Assessment for Insulin Resistance (HOMA-IR), dietary GI at baseline, GDM, gestational age at delivery and gestational weight gain | Placenta | Illumina Human Methylation 450 K Beadchip | Association between changes in maternal glycemic index intake and DNA methylation |
| Study | Outcome Measures | Main Findings |
|---|---|---|
| Physical activity | ||
| Antoun et al., 2020 [17] | Genome-wide DNA methylation changes in cord blood of offspring born to mothers with GDM who participated in a RCT of impact of low glycemic diet, reduced saturated fat and increased physical activity intervention during pregnancy. | No overall association between intervention and differential methylation in the cord blood. However, a total of 87% of the GDM and 77% of the 1 h glucose-associated differentially methylated CpGs had smaller effect sizes in the intervention group compared to the standard care arm. |
| Jönsson et al., 2021 [21] | Genome-wide DNA methylation in cord blood of offspring born to mothers participating in a RCT of impact of physical activity ± dietary intervention (low-fat and low-energy Mediterranean-style diet) in pregnancy. Also, association between intervention, methylation changes and offspring body composition. | DNA methylation was altered at 379 sites annotated to 370 genes in the intervention group versus control group (false discovery rate (FDR) < 0.05). These 370 genes are overrepresented in gene ontology terms, including response to fatty acids and adipose tissue development. Methylation of 17 sites was found to partially mediate the effect of lifestyle intervention on lean body mass in the offspring (FDR < 0.05). |
| Marshall et al., 2018 [4] | Association between maternal physical activity level during pregnancy and global DNA methylation as well as methylation at candidate gene level in blood from newborn. The mothers were divided into ‘high active’ (HA) and a ‘low active’ (LA). | No effect of physical activity on global DNA methylation. There were no differences between HA and LA mothers for LINE-1. However, the P2 promoter within the IGF2 gene was significantly higher in the LA group compared with HA (p = 0.045) |
| McCullough et al., 2015 [6] | Association between maternal non-sedentary time during pregnancy and DNA methylation at four DMRs in cord blood from offspring. | Non-sedentary time decreased methylation at the PLAG1 DMR and was found to, in part, account for an association between maternal physical activity and offspring birthweight. |
| Carbohydrate intake | ||
| Daniels et al., 2020 [12] | Association between DNA methylation changes at CPGs localized in the promotor region of the placenta leptin gene and maternal intake of calorie, carbohydrates, fat, protein and added sugar during pregnancy. | Lower levels of leptin methylation were associated with greater intake of carbohydrates after controlling for leptin SNP genotype (p < 0.05). Total caloric intake was also associated with placenta leptin methylation (p < 0.05), however after controlling for relevant covariates, significance diminished to trend-level. There were no associations of methylation and intake of protein (p > 0.05) or fat (p > 0.05). |
| Godfrey et al., 2011 [14] | Association between DNA methylation at CPGs of selected candidate genes in cord blood and maternal carbohydrate, fat and protein intake during pregnancy. | Higher methylation of RXRA chr9:136355885 was associated with lower maternal carbohydrate intake. Fat and protein intake were not associated with DNA methylation changes. Maternal intake of fat and protein were not associated with DNA methylation level. |
| Miyaso et al., 2017 [16] | Any association between methylation level at the H19 DMR in umbilical cord tissue and maternal diet. | Calorie intake of less than 1000 kcal/day was related to lower methylation levels at the H19 DMR (p = 0.013). The study did not find any significant effect of carbohydrate intake (OR = 1.28, p = 0.067). |
| Thakali et al., 2020 [22] | Association between genome-wide DNA methylation changes in placenta and maternal fat, carbohydrate, protein and saturated fat intake during pregnancy. | Maternal saturated fat intake was significantly associated with placental methylation at 302 of approximately 300,000 CpGs. Maternal carbohydrate, protein and total fat intake were significantly associated with methylation of 12, 14 and 28 CpGs, respectively. However, no maternal diet predictor variable was significantly associated with placental DNA methylation after adjusting for multiple testing. |
| Glycemic index | ||
| Antoun et al., 2020 [17] | See above | See above |
| Geraghty et al., 2018 [19] | Genome-wide DNA methylation changes in cord blood of offspring born to mothers who participated in a RCT with a low glycemic diet intervention in pregnancy. | Low glycemic intervention during pregnancy induced widespread DNA methylation changes. However, none strong enough to pass multiple testing. |
| Geraghty et al., 2020 [18] | Genome-wide DNA methylation changes at age 5 in offspring born to mothers who participated in a RCT with a low glycemic diet intervention in pregnancy. DNA was derived from saliva from both offspring exposed to the intervention and unexposed controls. In addition, DNA methylation and body composition at age 5 were studied. | No association was found between offspring DNA methylation and the dietary intervention in pregnancy (adjusted p < 0.05). However, applying an un-adjusted p < 0.05 identified 22,181 CPGs. The Top 1000 highest-ranking CPGs were selected for gene pathway analysis (most of them, corresponding to 60%, were hypermethylated). The gene pathway analysis showed enrichment with regards to insulin functioning. |
| Yan et al., 2019 [24] | Association between genome-wide DNA methylation changes in the placenta and maternal glycemic index changes during pregnancy. | Methylation levels of cg17586860 and cg18197392 in the 5ÚTR region of SSTR4 were negatively correlated with changes in carbohydrate intake and glycemic load across gestation. |
| Sugar intake | ||
| Daniels et al., 2020 [12] | See above | See above |
| Trumpff et al., 2021 [23] | Association between genome-wide DNA methylation changes in the placenta and maternal added sugar intake during pregnancy. | No individual CpGs achieved significance for altered methylation as a function of added sugar intake at each trimester or across pregnancy. A secondary analysis revealed that added sugar intake in the third trimester was associated with increased DNA methylation of a cluster of 8 CpGs within the ADD2 gene. |
| Mediterranean diet | ||
| Gonzalez-Nahm et al. [25] | Association between DNA methylation changes in infant cord blood leukocytes at the following DMRs: MEG3-IG, MEG3, IGF2, H19, PLAGL1, MEST, NNAT, PEG3 and SGCE/PEG10, and maternal adherence to a Mediterranean diet. | Female infants of mothers with a low adherence to a Mediterranean diet had higher odds of hypo-methylation at the MEG3-IG DMR. |
| Jönsson et al. [21] | See above | Se above |
| Fat intake | ||
| Antoun et al., 2020 [17] | See above | See above |
| Daniels et al., 2020 [12] | See above | See above |
| Godfrey et al., 2011 [14] | See above | See above |
| Thakali et al., 2020 [22] | See above | See above |
| Other exposures | ||
| Drake et al. [13] | Association between DNA methylation at CPGs localized in the GR, HSD2 and IGF2 in blood from adult offspring (40 years of age) and maternal intake of ‘an unbalanced diet’ consisting of a high meat intake and a low carbohydrate intake during pregnancy. | Offspring whose mothers reported a high meat/fish and vegetable intake combined with a low bread/potato intake had higher mean methylation at GR exon 1F. Methylation was also increased at a specific CpG site in H2D2 region 2 if the mothers had an increased meat (p = 0.03) and fish intake (p = 0.04). |
| Gomez Ribot et al. [20] | The relative expression of microRNA, miR-130a and miR-518d, in placenta of offspring born to mothers with GDM who participated in a RCT of the impact of three tablespoons of olive oil as a supplement to their regular diet during pregnancy. | No changes were found in the expression of miR-130a, but 518d expression was found to be increased in the placenta of GDM mothers but reduced in those GDM mothers receiving the intervention (p = 0.009). |
| McCullough et al., 2017 [3] | Association between methylation changes at the following DMRs: IGF2, H19, MEG3, PEG3, MEST, SGCE/PEG10, NNAT and PLAGL1 in cord blood in offspring and maternal intake of a pro-inflammatory diet during pregnancy. | No association between maternal intake of a pro-inflammatory diet and methylation of the DMRs was found. |
| Study | Did the Study Address a Clearly Focused Issue? | Was the Cohort Recruited in an Acceptable Way? | Was the Exposure Accurately Measured to Minimize Bias? | Was the Outcome Accurately Measured to Minimize Bias? | Have the Authors Identified All Important Confounding Factors? | Have They Accounted for the Confounding Factors in the Design and/or Analysis? | Was the Follow-up of Subjects Complete Enough? | Was the Follow-up of Subjects Long Enough? | Are the Results Precise? | Do You Believe the Results? | Can the Results Be Applied to the Local Population? | Do the Results of This Study Fit with Other Available Evidence? | Are there Implications of This Study for Practice? |
|---|---|---|---|---|---|---|---|---|---|---|---|---|---|
| Daniels et al., 2020 [12] | Yes | Can’t tell | Yes | Yes | Yes | Yes | Can’t tell | Can’t tell | Yes | Yes | Can’t tell | Yes | Can’t tell |
| Drake et al., 2021 [13] | Yes | Yes | No | Yes | Yes | Yes | Yes | Yes | Yes | Yes | Yes | Yes | Yes |
| Godfrey et al. [14] | Yes | Yes | No | Yes | Yes | Yes | Yes | Yes | Yes | Yes | Yes | Yes | Yes |
| Gonzalez-Nahm et al., 2017 [25] | Yes | Yes | No | Yes | Yes | Yes | Yes | Yes | Yes | Yes | Yes | Yes | Yes |
| Marshall et al., 2018 [4] | Yes | Yes | Yes | Yes | Can’t tell | Yes | Can’t tell | Yes | Can’t tell | No | No | No | No |
| McCullough et al., 2015 [6] | Yes | Yes | Yes | Yes | No | Yes | Can’t tell | Yes | Yes | Yes | Yes | Yes | Yes |
| McCullough et al., 2017 [3] | Yes | Yes | Yes | Yes | No | Yes | Can’t tell | Yes | Yes | Yes | Yes | Yes | Yes |
| Miyaso et al., 2017 [16] | Yes | Can’t tell | Can’t tell | Yes | No | Yes | Can’t tell | Yes | No | Yes | Yes | Yes | Yes |
| Thakali et al., 2020 [22] | Yes | Yes | Yes | Yes | No | Yes | Can’t tell | Yes | Yes | Yes | Yes | Yes | Yes |
| Trumpff et al., 2021 [23] | Yes | Yes | No | Yes | Yes | Yes | Yes | Yes | Yes | Yes | Yes | Yes | Yes |
| Yan et al., 2019 [24] | Yes | Yes | No | Yes | No | Yes | Yes | Yes | Yes | Yes | Yes | Yes | Yes |
| Study | Risk of Bias Arising from Randomization Process | Risk of Bias Due to Deviations from Intended Interventions | Risk of Bias due to Missing Outcome Data | Risk of Bias in the Measurement of the Outcome | Risk of Bias in the Selection the Reported Result | Overall Risk of Bias |
|---|---|---|---|---|---|---|
| Geraghty et al., 2020 [18] | Low | Some concerns | Low | Low | Some concerns | Some concerns |
| Geraghty et al., 2018 [19] | Low | Some concerns | Low | Low | Some concerns | Some concerns |
| Gomez Ribot et al., 2020 [20] | Some concerns | Low | Low | Low | Low | Low |
| Jönsson et al., 2021 [21] | Some concerns | Some concerns | Low | Low | Low | Low |
| Antoun et al., 2020 [17] | Low | Low | Low | Low | Some concerns | Low |
Publisher’s Note: MDPI stays neutral with regard to jurisdictional claims in published maps and institutional affiliations. |
© 2021 by the authors. Licensee MDPI, Basel, Switzerland. This article is an open access article distributed under the terms and conditions of the Creative Commons Attribution (CC BY) license (https://creativecommons.org/licenses/by/4.0/).
Share and Cite
Rasmussen, L.; Knorr, S.; Antoniussen, C.S.; Bruun, J.M.; Ovesen, P.G.; Fuglsang, J.; Kampmann, U. The Impact of Lifestyle, Diet and Physical Activity on Epigenetic Changes in the Offspring—A Systematic Review. Nutrients 2021, 13, 2821. https://doi.org/10.3390/nu13082821
Rasmussen L, Knorr S, Antoniussen CS, Bruun JM, Ovesen PG, Fuglsang J, Kampmann U. The Impact of Lifestyle, Diet and Physical Activity on Epigenetic Changes in the Offspring—A Systematic Review. Nutrients. 2021; 13(8):2821. https://doi.org/10.3390/nu13082821
Chicago/Turabian StyleRasmussen, Louise, Sine Knorr, Christian Skødt Antoniussen, Jens Meldgaard Bruun, Per Glud Ovesen, Jens Fuglsang, and Ulla Kampmann. 2021. "The Impact of Lifestyle, Diet and Physical Activity on Epigenetic Changes in the Offspring—A Systematic Review" Nutrients 13, no. 8: 2821. https://doi.org/10.3390/nu13082821
APA StyleRasmussen, L., Knorr, S., Antoniussen, C. S., Bruun, J. M., Ovesen, P. G., Fuglsang, J., & Kampmann, U. (2021). The Impact of Lifestyle, Diet and Physical Activity on Epigenetic Changes in the Offspring—A Systematic Review. Nutrients, 13(8), 2821. https://doi.org/10.3390/nu13082821