Abstract
Past research using hepatic rat microsomes showed that soy protein suppressed delta-6 desaturase activity (D6D) compared to casein (a dairy protein). The effects of soy and dairy on desaturase pathway activity in humans remain poorly investigated. The objective of this analysis was to investigate the association between soy and dairy consumption with plasma fatty acids and estimate the desaturase pathway activity in a multiethnic Canadian population of young adults. We analyzed data from men (n = 319) and women (n = 764) previously collected for the Toronto Nutrigenomics and Health Study. Food frequency questionnaires and plasma fatty acids were assessed. Relationships between soy and dairy beverages and food consumption with estimated desaturase activities were assessed by regression models and by grouping participants according to beverage and food intake data. Weak inverse associations (p ≤ 0.05) were found between soy consumption and the overall desaturation pathway activity, specifically D6D activity. When participants were grouped based on soy and dairy consumption habits, omega-6 LC-PUFAs, as well as various estimates of the desaturase pathway activity, were significantly lower in individuals consuming soy (with or without dairy) compared to individuals consuming only fluid milk and dairy products. In conclusion, soy consumption, not dairy consumption, appears to suppress desaturase pathway activity.
Keywords:
humans; fluid milk; dairy; soy beverage; plant-based beverage; LC-PUFA; delta-6 desaturase 1. Introduction
Bovine milk is a rich source of nutrients such as protein, fat, vitamins and minerals [1]. Despite this, fluid milk intake has declined among North Americans over the past decade, while the consumption of dairy foods (e.g., cheese and yogurt) has grown [2,3]. This can be due, in part, to the wide availability and popularity of plant-based alternatives to fluid milk, such as soy beverage [2,4]. Additionally, changes in consumer preferences are often attributed to general concerns about the saturated fatty acid content of milk and the association between these fats and cardiovascular risk, among others [2,5]. However, recent meta-analyses reported a neutral association between fluid milk consumption and clinical outcomes such as stroke, coronary heart disease and type 2 diabetes [6,7,8]. Moreover, soy protein intake is reported to improve overall lipid profiles through different pathways [9]. While the hypocholesterolemic and hypotriglyceridemic effects of increased soy consumption are well documented, evidence suggests that soy protein may inhibit delta-6 desaturase (D6D) activity, a key enzyme involved in long-chain polyunsaturated fatty acid (LC-PUFA) endogenous synthesis.
LC-PUFA are bioactive molecules that constitute cell membrane phospholipids, serve as important signalling molecules, and are precursors for the production of bioactive lipid mediators [10]. LC-PUFA are obtained from dietary sources or synthesized endogenously in the human body from essential fatty acids (e.g., linoleic acid, LA; α-linolenic acid, ALA). However, this conversion occurs to a limited extent, with tracer studies indicating that <8% and <1% of ALA is converted to eicosapentaenoic acid (EPA) and docosahexaenoic acid (DHA), respectively [11,12]. This conversion pathway involves the desaturation and elongation of essential fatty acids by specific enzymes. Specifically, D6D and the delta-5 desaturase (D5D) insert double bonds at specific positions in a fatty acid chain, while the elongation of the very-long-chain fatty acids protein 2 (ELOVL2) and 5 (ELOVL5) extend a fatty acid chain by 2 carbons (as reviewed in [13]). These enzymes are influenced by numerous dietary factors, such as macronutrients, micronutrients and polyphenols [13], as well as by non-dietary factors including sex, BMI, age, smoking and alcohol consumption [14].
Past studies in rats showed that soy protein consumption impaired D6D activity compared to casein [15,16]. Specifically, it was shown that D6D activity, assessed by the conversion of radiolabeled LA into γ-linolenic acid (GLA), was reduced in hepatic microsomes isolated from rats consuming a soy-supplemented diet compared to a casein-supplemented diet. While intriguing, the translatability of these in vitro results to humans is unclear due to the fact that microsomes are cellular artifacts enriched in endoplasmic reticulum proteins, but absent of cytoplasmic proteins [17].
The primary objective of this analysis was to determine if the consumption of soy beverage and fluid milk was associated with plasma omega-6 and omega-3 PUFA levels and the estimated desaturase activities in a cohort of young healthy adults. As a secondary objective, we conducted a broader analysis to evaluate if the intake of dairy foods in the presence or absence of soy foods was associated with omega-6 and omega-3 PUFA levels, and estimated desaturase activities.
2. Materials and Methods
2.1. Study Population
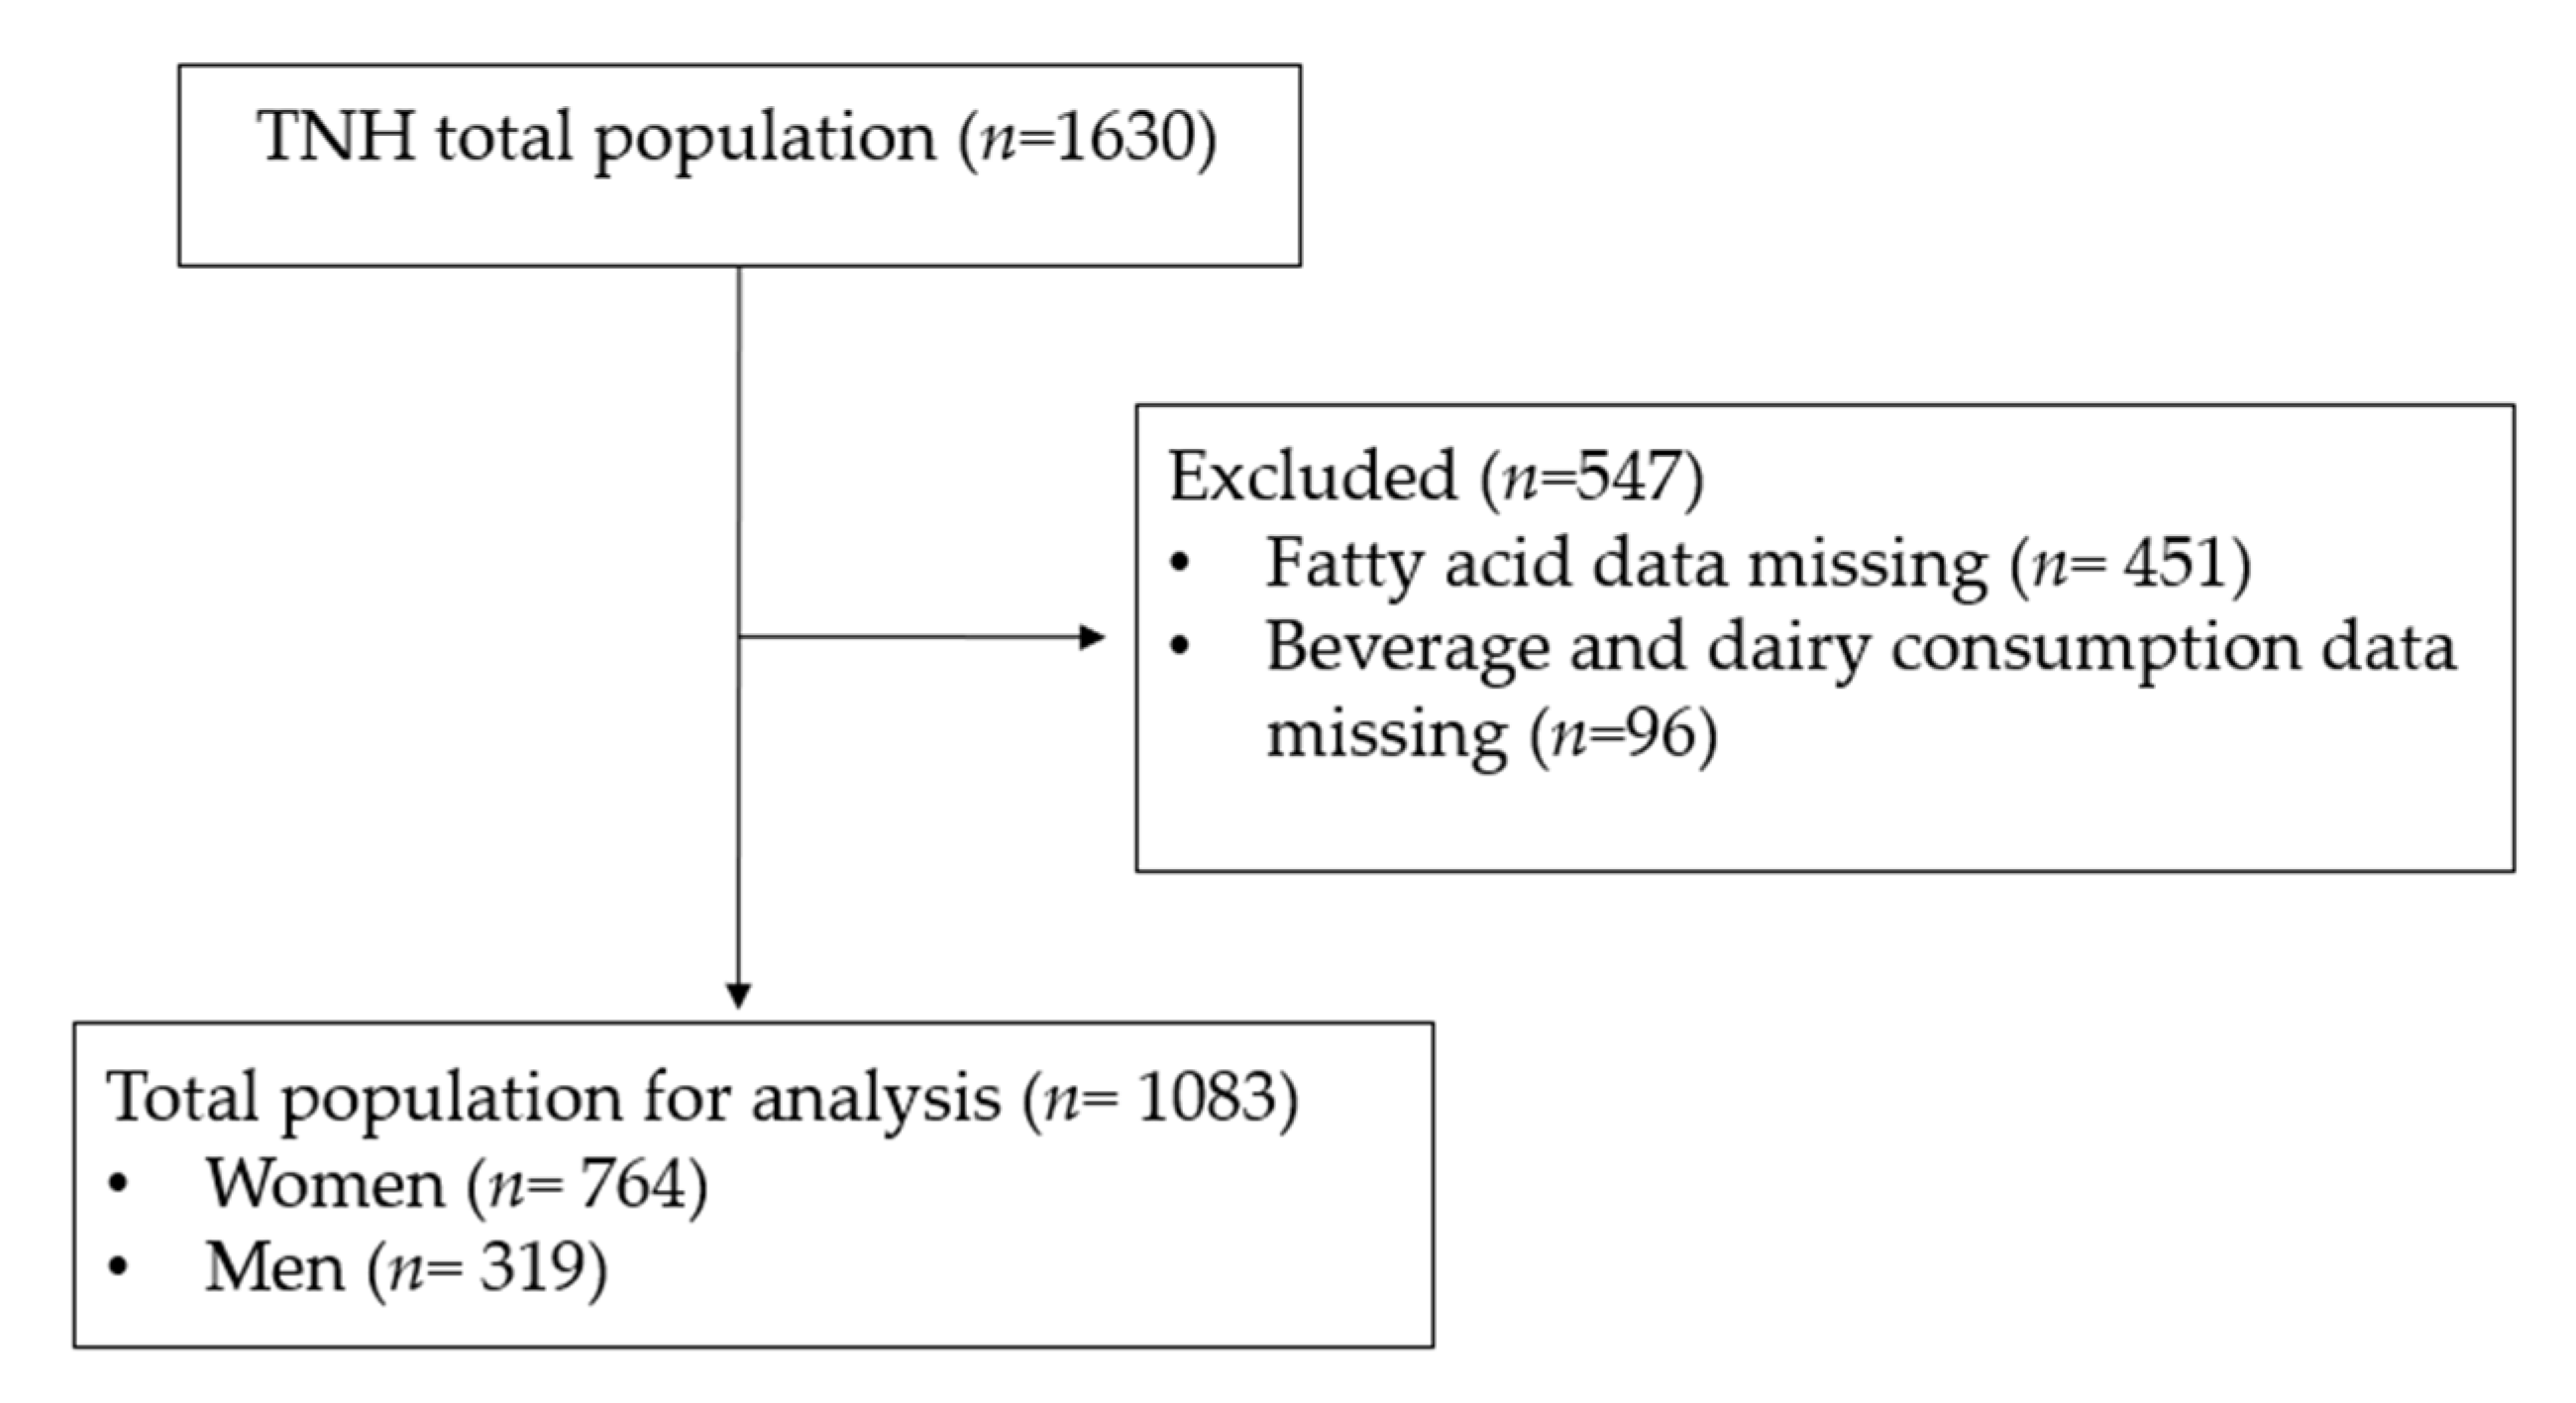
The present study used data previously collected from the cross-sectional Toronto Nutrigenomics and Health (TNH) study. Participants (n = 1630) between the ages of 20 and 29 years were recruited from the University of Toronto between 2004 and 2010. Individuals were excluded from the analysis if fatty acid data (n = 451) and soy/dairy food consumption data (n = 96) were missing (Figure 1).

Figure 1.
CONSORT diagram. Subject inclusion and exclusion criteria.
2.2. Dietary Intake Assessment
The Toronto-modified Willett food frequency questionnaire (FFQ) was used at one timepoint to collect information about diet and beverage intake over the preceding month. The original FFQ was modified to include foods that contributed to the glycemic index of the diet and to assess the consumption of caffeine, as previously described [18]. For the purpose of the present analysis, FFQ data related to the total caloric intake (kcal/d), total omega-3 intake (calculated by summing dietary ALA + EPA + 22:5n-3 (DPA) + DHA), total omega-6 intake (calculated by summing dietary LA + AA) intake, fish oil supplement use, and consumption of fluid milk (skimmed milk, 1% milk, 2% milk, whole milk and flavored milk), soy beverage, as well as the total soy and total dairy foods, were considered. Total soy comprised tofu, soybean and soy beverage servings, while total dairy comprised fluid milk (skimmed milk, 1% milk, 2% milk, whole milk and flavored milk), cream, ice cream, yogurt, cheese, and butter servings. For simplicity, the intake of soy beverage, fluid milk, soy foods, and dairy foods was converted into servings per month from the Willett FFQ.
2.3. Fluid Milk versus Soy Beverage Analysis
For our primary analysis, study participants were divided into four different groups depending on their fluid milk and soy beverage consumption habits (i.e., servings per month). Individuals that consumed 1 or more servings of fluid milk (equivalent to 8 oz or 240 mL) per month and no servings of soy beverage were designated the “Milk” group (n = 671; mean intake ± standard error = 30.6 ± 1.1 servings). Individuals that consumed 1 or more servings of soy beverage (equivalent to 8 oz or 240 mL) per month and no fluid milk servings were designated the “Soy” group (n = 71; mean intake ± standard error = 22.5 ± 3.1 servings). Individuals that consumed both fluid milk and soy beverage (i.e., at least 1 serving per month of each) were designated the “Both” group (n = 269; mean intake fluid milk ± standard error = 24.8 ± 1.6 servings; mean intake ± standard error soy beverage = 11.9 ± 0.9 servings), while individuals that consumed less than 1 serving per month of fluid milk and soy beverage were designated the “No consumption” group (n = 72).
2.4. Total Dairy and Total Soy Analysis
For our secondary analysis, study participants were divided into four different groups depending on their total dairy and total soy food consumption habits (i.e., servings per month). The “Dairy” group (n = 401) comprised individuals who consumed 1 or more servings per month of any type of dairy (mean intake ± standard error = 72.2 ± 2.2 servings). The “Both” group (n = 663) comprised individuals who consumed 1 or more servings per month of any type of dairy and 1 or more servings per month of any type of soy food (mean intake dairy ± standard error = 62.1 ± 1.7 servings; mean intake soy ± standard error = 15.1 ± 0.9 servings). The number of individuals that consumed no dairy foods and only soy foods (n = 15), or neither dairy foods nor soy foods (n = 4), were too low to consider in our analyses. Therefore, our secondary analysis only examined the “Dairy” and “Both” groups.
2.5. Anthropometric and Clinical Measurements
Anthropometric measurements were obtained from all study participants by a trained professional, as previously described [18]. Body mass index (BMI) was calculated using the weight (kg) and height (m) of the participant. Blood samples were obtained from participants following a 12-h overnight fast. Plasma was extracted and used to analyze fatty acids and biochemical markers such as glucose, insulin, cholesterol (total, HDL, and LDL), triglycerides and high sensitivity C-reactive protein (hs-CRP).
2.6. Plasma Fatty Acid Analysis
Total fatty acids were extracted from plasma samples collected after an overnight fast and analyzed by gas chromatography, as previously described [19]. The ratio C17:0 was used as an internal standard to measure fatty acid concentration. Relative fatty acid data, expressed as a percentage of total fatty acid content, were used to estimate fatty acid desaturase and elongase activities using product-to-precursor ratios. Only PUFA data is reported in the present manuscript. The ratios of GLA/LA (18:3n-6/18:2n-6), arachidonic acid (AA)/di-homo-ɣ-linolenic acid (DGLA) (20:4n-6/20:3n-6), DGLA/GLA and adrenic acid/AA (22:4n-6/20:4n-6) were used to estimate D6D, D5D, ELOVL5 and ELOVL2 activities, respectively. Furthermore, the AA/LA and the EPA/ALA ratios were used to estimate the overall activity of the desaturation pathway.
2.7. Statistical Analysis
All analyses were conducted using JMP statistical software V14.0.0 (SAS Institute, Cary, NC, USA). The Shapiro–Wilk test was used to assess covariates for normality. We first ran exploratory correlations between servings per month for fluid milk, soy beverage, total soy and total dairy with estimated enzyme activities using a Pearson’s correlation test. Multivariate linear regression was then used to model the relationships between fluid milk, soy beverage, total soy and total dairy servings per month and estimated enzyme activities to account for the following variables known to influence fatty acid desaturation: sex, BMI, waist circumference, age, ethnicity, total caloric intake and fish oil supplementation [14]. Plasma ALA and LA concentrations (as measured by gas chromatography) were included in our models to account for potential differences in essential fatty acid intake. For subgroup analyses, differences in fatty acid levels and ratios were assessed using an ANCOVA with a Tukey post hoc analysis for our primary analysis (fluid milk vs. soy beverage) and a Student’s t-test for the secondary analysis (total dairy vs. total dairy/total soy). Models for fatty acid sub-group analyses included the following covariates: sex, BMI, age, waist circumference, ethnicity, total caloric intake, and omega-3 supplementation. Models for fatty acid ratio sub-group analyses included the aforementioned covariates, as well as plasma ALA, LA and DHA levels (μg/mL). Data are reported as mean ± standard deviation. A p-value ≤ 0.05 was considered statistically significant.
3. Results
3.1. Correlations between Soy and Dairy Beverage and Food Consumption and Desaturation Indices
A total of 1083 participants (n = 764 women and n = 319 men) were included in the present analysis (Figure 1). We first performed exploratory analyses to determine if the consumption of soy beverage, fluid milk, total soy and total dairy intake was correlated with estimated enzyme activities. Weak but statistically significant inverse correlations were observed between soy beverage intake and the AA/LA ratio (R2 = 0.0125; p = 0.0002; Figure 2A) and estimated D6D activity (R2 = 0.0064; p = 0.0083; Figure 2B). No significant relationships were found between soy beverage intake and estimated D5D, ELOVL2 or ELOVL5 activities. After adjusting for confounding variables in a multivariate model, the relationship between soy beverage consumption and AA/LA estimated activity, as well as with D6D, remained statistically significant (p ≤ 0.05). A weak inverse correlation was found between fluid milk intake and estimated D5D activity (R2 = 0.0113; p = 0.0005; Figure 2C); this relationship remained significant after adjusting for confounding variables (p ≤ 0.05). Weak but statistically significant positive correlations were also found between fluid milk intake and estimated D6D activity (R2 = 0.0053; p = 0.0163) and the EPA/ALA ratio (R2 = 0.0054; p = 0.0153); however, these relationships were lost in a multivariate model accounting for covariates (p > 0.05). No associations were found with fluid milk intake and estimated elongase activities. Similar to soy beverage, significant inverse correlations between total soy and the AA/LA ratio (R2 = 0.0181; p < 0.0001; Figure 2D) and estimated D6D activity (R2 = 0.0099; p = 0.0010; Figure 2E) were found. Both relationships remained significant after accounting for confounding variables (p ≤ 0.05). No other associations were found with total soy intake and estimated enzyme activities. Similar to fluid milk, an inverse correlation was also found between total dairy intake and estimated D5D activity (R2 = 0.0279; p = <0.0001; Figure 2F), which remained significant after adjusting for confounding variables (p ≤ 0.05). A positive correlation was also observed between total dairy intake and estimated D6D activity (R2 = 0.0057; p = 0.0132); however, this relationship was lost after accounting for confounding variables (p = 0.2247). No associations were found with total dairy intake and estimated elongase activities.
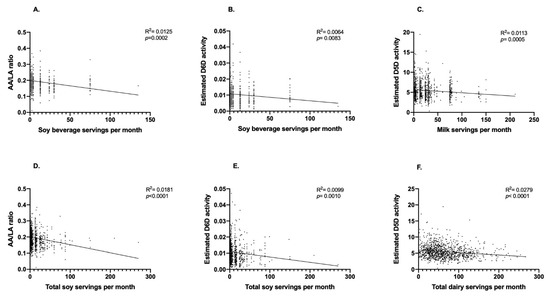
Figure 2.
Relationships between soy beverage, fluid milk, total soy and total dairy intake with estimated desaturase activities. Pearson’s correlation was used to initially explore the relationships between soy beverage, fluid milk, total soy and total dairy intake with estimated desaturase activities. (A) Monthly servings of soy beverage and the AA/LA ratio, (B) monthly servings of soy beverage and estimated D6D activity, (C) monthly servings of fluid milk and estimated D5D activity, (D) monthly servings of total soy and the AA/LA ratio, (E) monthly servings total soy and estimated D6D activity, and (F) monthly servings of total dairy and estimated D5D activity; n = 1083 participants.
3.2. Influence of Fluid Milk and Soy Beverage Consumption on Plasma Fatty Acids and Related Ratios
Considering the weak but statistically significant correlations identified in our exploratory analyses, we next conducted a primary analysis to investigate if relative plasma fatty acids and estimated enzyme activities differed in individuals categorized based on their fluid milk and/or soy beverage consumption habits. Small significant differences in age (p = 0.0468), BMI (p = 0.0058) and total caloric intake (p = 0.0127), were observed when comparing beverage consumption groups (Table 1). The dietary omega-6/omega-3 ratio determined from FFQ data was borderline significant between groups (p = 0.0539). ALA (p = 0.0254) and LA (p = 0.0036) plasma levels (µg/mL), as determined by gas chromatography, differed between groups (Table 1), where subjects in the “Soy” group had the highest LA plasma levels compared to the other groups. No pairwise differences in ALA levels were identified with the post hoc analysis. The plasma LA/ALA ratio was borderline significant (p = 0.0451), although no pairwise post hoc differences were observed.

Table 1.
General characteristics of the population by beverage intake subgroups 1,2.
The relative (%) plasma levels of ALA and omega-6 PUFA differed significantly between groups (Table 2). Individuals consuming soy beverage with or without fluid milk (“Soy” and “Both” groups) had higher plasma levels of ALA (0.83 ± 0.27% and 0.79 ± 0.22%, respectively) compared to individuals consuming only fluid milk (0.72 ± 0.26%), as well as higher levels of LA (34.17 ± 3.65% and 33.42 ± 3.87%, respectively), compared to individuals consuming only fluid milk (31.81 ± 3.94%) and individuals without beverage consumption (31.78 ± 5.09%). ALA and LA levels were similar between individuals in the “Milk” and “No Consumption” groups, and between individuals in the “Soy” and “Both” groups. No significant differences were observed with EPA between the groups. Individuals consuming soy beverage had the lowest DHA levels (1.42 ± 0.54%) compared to the rest of the groups. Plasma levels of GLA were lower in individuals in the “Both” group (0.30 ± 0.16%) compared to those in the “Milk” group (0.34 ± 0.16%), while DGLA and AA levels were similar between individuals in the “Soy” and “Both” groups, and were significantly lower than the levels observed in individuals in the “Milk” and “No consumption” groups.
Table 2.
Plasma polyunsaturated fatty acid levels and ratios by beverage intake subgroups 1,2.
We next examined the estimates for the overall desaturation pathway activity using both omega-3 and omega-6 PUFA. The AA/LA ratio was significantly lower in individuals in the “Both” group compared to individuals in the “Milk” and “No Consumption” groups, suggesting a general suppression in desaturation pathway activity. This same ratio was also marginally lower in the “Soy” group compared to the “Milk” and “No Consumption” groups. Since we were unable to consistently detect all n-3 PUFA intermediates in the desaturation pathway, we used LA, GLA, DGLA, and AA to estimate individual desaturase and elongase activities. The estimated D6D activity was significantly lower in individuals in the “Both” group compared to individuals in the “Milk” and “No Consumption” groups, which aligned with results concerning the overall pathway (AA/LA). No differences were observed in the estimated D5D, ELOVL2, and ELOVL5 activities. Collectively, these observations suggest that soy beverage consumption but not milk consumption may be associated with reduced desaturation pathway activity.
3.3. Fatty Acid Levels and Desaturation Indices by Total Dairy and Soy Consumption Groups
In a secondary analysis, we investigated the relative plasma fatty acids and estimated enzyme activities in individuals categorized based on total dairy and total soy intake. Similar to the observations from our primary analysis, significant differences were found in BMI (p < 0.0001), hs-CRP (p = 0.0269), and LDL (p = 0.0082) values between groups, where individuals consuming only dairy had higher values compared to individuals consuming both dairy and soy (Table 3). HDL levels were also different between groups, where individuals in the “Both” group had higher levels in plasma (p = 0.0192). No significant difference between the two groups was observed for the dietary omega-6/omega-3 ratio based on FFQ data. ALA (p = 0.0057) and LA (p = 0.0003) plasma levels (µg/mL) were higher in individuals in the “Both” group compared to those in the “Dairy” group, while the LA/ALA ratio was significantly higher in individuals in the “Dairy” group (p = 0.0301).
Table 3.
General characteristics of the population by total dairy and total soy intake 1.
The relative (%) plasma fatty acids also differed between individuals in these two groups (Table 4). Individuals in the “Both” group had significantly higher levels of ALA, LA, and DHA compared to individuals in the “Dairy” group. By contrast, GLA, DGLA and AA were all lower in individuals in the “Both” group compared to the “Dairy” group. No differences in EPA levels were observed between the two groups (Table 4).
Table 4.
Plasma polyunsaturated fatty acids and ratios by total dairy and total soy intake 1.
4. Discussion
In the present study, we report that soy intake, irrespective of dairy consumption, is inversely associated with the overall desaturase pathway activity, as well as with estimated D6D activity. Our initial exploratory correlation analyses showed that soy consumption is inversely associated with desaturase activity. These observations were supported by both the primary analysis comparing soy beverage and fluid milk intake, as well as the secondary analysis comparing the total dairy intake with and without the consumption of soy foods. We also observed that fluid milk intake, as well as total dairy intake, was inversely associated with estimated D5D activity. While potentially intriguing, this relationship was not found in any of our subgroup analyses and therefore not considered further.
A strength of our primary analysis was that we could create four distinct groups of individuals based on their fluid milk and soy beverage consumption habits: fluid milk only, soy beverage only, both, and neither. This showed that the consumption of soy beverage, but not fluid milk, was associated with a reduction in estimated D6D activity. This was particularly evident when comparing the two largest subgroups (“Milk” vs. “Both”). We recognized that fluid milk is not the only source of dairy in the diet, and that there are other sources of soy protein as well; therefore, our secondary analysis compared individuals consuming any type of dairy with and without any type of soy. This secondary analysis aligned with our initial findings, and also showed that the inclusion of soy foods in a diet containing dairy foods is associated with a reduction in estimated D6D activity. Collectively, these findings may have important implications for public health nutrition, in particular for individuals who consume plant-based alternatives to dairy and have diets low in omega-3 LC-PUFA.
To the best of our knowledge, this is the first cross-sectional cohort study to assess the relationship between soy intake and estimated desaturase activities in humans. Past animal studies suggested that soy protein consumption decreased LC-PUFA synthesis by inhibiting D6D activity. Brandsch et al. [20] fed rats diets containing either soy or casein as a source of protein. Higher microsomal LA levels concomitant with lower microsomal levels of DGLA, AA and a lower AA/LA ratio, were observed in rats fed soy compared to rats fed casein, suggesting a suppression in the activity of the LC-PUFA desaturation pathway. In two independent studies, Ikeda et al. [16] and Koba et al. [15] both reported suppressed microsomal D6D activity (measured using radiolabeled fatty acids) and lower levels of LC-PUFAs such as EPA and AA in hepatic microsomes isolated from rats who were fed soy compared to casein. Together, this evidence suggested that soy protein consumption decreased LC-PUFA synthesis through a reduction in D6D activity compared to casein consumption.
Although comparative research regarding the effects of soy protein and dairy (more specifically casein) on lipid metabolism exists, the effects of soy and dairy on desaturation pathway activity in humans remain poorly investigated. To the best of our knowledge, only one study examined the impact of soy protein and casein supplementation on plasma fatty acids in humans. Specifically, Gooderham et al. [21] studied the effects of a soy protein isolate and a casein supplement on plasma phospholipid fatty acid profiles in 20 young male adults randomly allocated to each treatment (60 g/d for 28 days). Plasma levels of AA showed lower trends in subjects supplemented with soy protein isolate compared to those given the calcium caseinate supplement, but no significant difference was seen in the estimated overall desaturation pathway activity. It is difficult to directly compare the outcomes from a short-term intervention with a small sample size (n = 10 per supplement group) with our cross-sectional cohort analysis, since the first is assessing supplementation while the second is assessing general dietary patterns. Nevertheless, the trend for the reduction in AA levels observed during the wash-out period after soy supplementation in the intervention trial may suggest a longer-lasting regulation of the desaturation pathway that aligns with our findings.
Although the present investigation provides no mechanistic insight, the suppressive effects of soy on desaturase activity may be mediated at the transcriptional level via sterol regulatory element binding protein-1 (SREPB-1). Indeed, soy protein has been previously reported to regulate the expression of key transcription factors controlling lipid metabolism, such as SREBP-1, liver X receptor (LXR) and peroxisome proliferator activated receptor α (PPAR-α) [22]. These transcription factors control fatty acid desaturase 1 (Fads1) and 2 (Fads2) gene expression [23]. Fads1 and Fads2 genes encode the desaturase enzymes D5D and D6D, respectively [9,24]. Rats who were fed a soy protein diet for 160 days experienced a decrease in hepatic Srebp-1c mRNA expression, concomitant with a decrease in Fads1 and Fads2 gene expression, compared to rats fed a casein diet [25]. Thus, our results may stem from the transcriptional regulation of desaturase genes.
Another possible explanation for the differential effects of soy and casein consumption on the desaturation pathway may relate to differences in amino acid composition. Unlike casein, soy protein has a limited methionine content, an essential amino acid [26]. Sugiyama et al. [27] reported that the supplementation of a soy protein diet with L-methionine restored the microsomal AA/LA ratio to that observed in a casein-based diet. Further, Shimada et al. [28] found that the supplementation of a casein-based diet with L-methionine increased microsomal D6D activity compared to a control casein diet. We examined methionine intake using FFQ data in all subjects, but did not find a consistent pattern between the groups (in either our primary or secondary analyses) that aligned with differences in estimated D6D activity (data not shown); however, measuring methionine levels in circulation will provide greater clarity around this potential explanation for our findings.
The aforementioned mechanisms provide potential explanations for why LC-PUFA levels are lower in subjects who consume soy, irrespective of fluid milk and/or dairy food intake. Further elucidation using stable isotope fatty acid tracers to study LC-PUFA synthesis in subjects who consume soy beverages/foods or soy protein isolates will help clarify the relationship between soy consumption and fatty acid flux through the D6D/D5D pathway. Moreover, measuring hepatic desaturase mRNA and protein expression, as well as transcription factors known to regulate the desaturation pathway, will provide further mechanistic insights regarding the relationship between soy and D6D activity.
The design of the cross-sectional TNH study is potentially limited by the narrow age range of the participants, since individuals were between the ages of 20 and 29 years. Although our findings may not be generalizable to the entire population, these results set the stage for future research on fatty acid desaturation regulation by the consumption of soy foods, which should include individuals from different age groups. Another limitation of the cross-sectional study is the use of an FFQ to obtain dietary intake data from subjects, which are prone to inaccurate reporting. For example, food intake may be underestimated, especially if participants are not familiar with portion sizes and cooking measurements (e.g., cups, milliliters, or ounces). Furthermore, previous findings suggest that dietary recall declines quickly, and that the information provided by individuals generally comes from the short-term memories of their typical diet [29]. Nevertheless, FFQs are a validated tool that can be readily used in large-scale studies, such as the TNH study. The present study is also limited by using plasma fatty acids to estimate enzyme activities. This is notable since plasma fatty acids reflect both dietary intake and endogenous production. Except for ALA and LA (both essential fatty acids), it is not possible to definitively know the origin of other fatty acids measured in plasma without using tracers. Soy beverage contains more LA and ALA [30] than bovine milk [31]. Thus, the higher plasma ALA and LA levels found in individuals consuming soy beverage compared to milk/dairy may reflect differences in the essential fatty acid content of soy beverage and milk/dairy. Past research showed that a higher ALA and LA intake increases desaturation activity and that the LA/ALA ratio in the diet is important [13]. We accounted for LA and ALA plasma concentrations in our multivariate models, and findings from our primary and secondary analyses indicated that, despite individuals consuming soy having higher plasma ALA and LA, the estimated D6D activity using product-to-precursor ratios was lower compared to individuals consuming milk/dairy. While we acknowledge that product-to-precursor ratios are not a direct measure of enzymatic activity, a previous report suggests that these estimates generally align with those obtained using radiolabeled fatty acids [32]. As such, our results, in conjunction with past research in rodent models, suggest that increased soy intake suppresses D6D activity. Future clinical trials using labeled essential fatty acids are needed to definitively conclude whether D6D activity is suppressed with soy. Moreover, future studies are necessary to elucidate which component of soy (e.g., soy protein, lower methionine content, isoflavones, etc.) may be responsible for suppressing D6D activity.
5. Conclusions
In conclusion, we report an inverse association between soy intake and estimated desaturase activities and omega-6 LC-PUFA levels. With the growing popularity and availability of plant-based beverages, many consumers have moved away from consuming fluid milk. Indeed, soy beverage is a common plant-based alternative in the market, with a compound annual growth rate estimated at ~6% by 2025 [33]. Consequently, we anticipate that our findings may have ramifications for public health nutrition. Indeed, these findings are particularly important given that the Western diet is low in omega-3 LC-PUFA such as EPA and DHA, but high in omega-6 LC-PUFA [34]. Low levels of EPA and DHA in the body have been associated with an increased risk of non-alcoholic fatty liver disease, neuropsychiatric disorders, and cardiovascular disease, among other conditions [35,36,37]. As such, individuals consuming soy on a regular basis in the context of a low omega-3 LC-PUFA diet may benefit from increasing these important fatty acids in their diets to offset potential reductions in their endogenous production. These results highlight the importance of continued research regarding the role of soy in LC-PUFA synthesis.
Author Contributions
M.G.-S. and D.M.M. conceived of the study and conducted all analyses; S.A.A. and D.W.L.M. ran plasma fatty acid analyses; A.E.-S. conducted the TNH cohort study; M.G.-S. and D.M.M. wrote the first draft of the manuscript. All authors have read and agreed to the published version of the manuscript.
Funding
M.G.-S. is supported by a CONACYT scholarship. This research is supported by Dairy Farmers of Canada. As per the research agreement, aside from providing financial support, the funders have no decision-making role in the design and conduct of the studies, data collection and analysis or interpretation of the data. Researchers maintain independence in conducting their studies, own their data, and report the outcomes regardless of the results. The decision to publish the findings rests solely with the researchers.
Institutional Review Board Statement
The study was conducted in accordance with the Declaration of Helsinki, and the protocol was approved by the Ethics Committees of the University of Toronto (REB#22587) and the University of Guelph (REB#10AU010). Written informed consent was obtained from all participants.
Informed Consent Statement
Informed consent was obtained from all subjects involved in the study.
Data Availability Statement
Data is contained within the article.
Acknowledgments
We thank Daiva E. Nielsen for her expertise and support with the TNH dataset and the FFQ data. Additionally, we thank Andrea Buchholz for helpful discussions.
Conflicts of Interest
The authors declare no conflict of interest. The funders had no role in the design of the study; in the collection, analyses, or interpretation of data; in the writing of the manuscript, or in the decision to publish the results.
References
- Haug, A.; Høstmark, A.T.; Harstad, O.M. Bovine milk in human nutrition—A review. Lipids Health Dis. 2007, 6, 25. [Google Scholar] [CrossRef] [Green Version]
- Pierre, M.S. Changes in Canadians’ preferences for milk and dairy products. Stat. Can. Available online: https://www150.statcan.gc.ca/n1/pub/21-004-x/2017001/article/14786-eng.htm (accessed on 23 November 2020).
- Vatanparast, H.; Islam, N.; Patil, R.P.; Shamloo, A.; Keshavarz, P.; Smith, J.; Whiting, S. Consumption of Yogurt in Canada and Its Contribution to Nutrient Intake and Diet Quality Among Canadians. Nutrients 2019, 11, 1203. [Google Scholar] [CrossRef] [PubMed] [Green Version]
- Auclair, O.; Han, Y.; Burgos, S.A. Consumption of Milk and Alternatives and Their Contribution to Nutrient Intakes among Canadian Adults: Evidence from the 2015 Canadian Community Health Survey—Nutrition. Nutrients 2019, 11, 1948. [Google Scholar] [CrossRef] [PubMed] [Green Version]
- Lordan, R.; Tsoupras, A.; Mitra, B.; Zabetakis, I. Dairy fats and cardiovascular disease: Do we really need to be concerned? Foods 2018, 7, 29. [Google Scholar] [CrossRef] [PubMed] [Green Version]
- Alexander, D.D.; Bylsma, L.C.; Vargas, A.J.; Cohen, S.S.; Doucette, A.; Mohamed, M.; Irvin, S.R.; Miller, P.E.; Watson, H.; Fryzek, J.P. Dairy consumption and CVD: A systematic review and meta-analysis. Br. J. Nutr. 2016, 115, 737–750. [Google Scholar] [CrossRef] [Green Version]
- Qin, L.Q.; Xu, J.Y.; Han, S.F.; Zhang, Z.L.; Zhao, Y.Y.; Szeto, I.M. Dairy consumption and risk of cardiovascular disease: An updated meta-analysis of prospective cohort studies. Asia Pac. J. Clin. Nutr. 2015, 24, 90–100. [Google Scholar] [CrossRef] [PubMed]
- Lamarche, B.; Givens, D.I.; Soedamah-Muthu, S.; Krauss, R.M.; Jakobsen, M.U.; Bischoff-Ferrari, H.A.; Pan, A.; Després, J.P. Does Milk Consumption Contribute to Cardiometabolic Health and Overall Diet Quality? Can. J. Cardiol. 2016, 32, 1026–1032. [Google Scholar] [CrossRef] [Green Version]
- Torres, N.; Torre-Villalvazo, I.; Tovar, A.R. Regulation of lipid metabolism by soy protein and its implication in diseases mediated by lipid disorders. J. Nutr. Biochem. 2006, 17, 365–373. [Google Scholar] [CrossRef]
- Calder, P.C. Omega-3 fatty acids and inflammatory processes: From molecules to man. Biochem. Soc. Trans. 2017, 45, 1105–1115. [Google Scholar] [CrossRef] [Green Version]
- Brenna, J.T.; Salem, N.; Sinclair, A.J.; Cunnane, S.C. α-Linolenic acid supplementation and conversion to n-3 long-chain polyunsaturated fatty acids in humans. Prostaglandins Leukot. Essent. Fat. Acids 2009, 80, 85–91. [Google Scholar] [CrossRef]
- Metherel, A.H.; Bazinet, R.P. Updates to the n-3 polyunsaturated fatty acid biosynthesis pathway: DHA synthesis rates, tetracosahexaenoic acid and (minimal) retroconversion. Prog. Lipid Res. 2019, 76, 101008. [Google Scholar] [CrossRef] [PubMed]
- Gonzalez-Soto, M.; Mutch, D.M. Diet Regulation of Long-Chain PUFA Synthesis: Role of Macronutrients, Micronutrients, and Polyphenols on Δ-5/Δ-6 Desaturases and Elongases 2/5. Adv. Nutr. 2021, 12, 980–994. [Google Scholar] [CrossRef] [PubMed]
- De Groot, R.H.M.; Emmett, R.; Meyer, B.J. Non-dietary factors associated with n-3 long-chain PUFA levels in humans–A systematic literature review. Br. J. Nutr. 2019, 121, 793–808. [Google Scholar] [CrossRef] [Green Version]
- Koba, K.; Wakamatsu, K.; Obata, K.; Sugano, M. Effects of dietary proteins on linoleic acid desaturation and membrane fluidity in rat liver microsomes. Lipids 1993, 28, 457–464. [Google Scholar] [CrossRef] [PubMed]
- Ikeda, A.; Koba, K.; Sugano, M. Impact of Dietary Protein on Polyunsaturated Fatty Acid Desaturation in Rats Fed Diets Rich in α-Linolenic Acid. Biosci. Biotechnol. Biochem. 1993, 57, 61–64. [Google Scholar] [CrossRef] [PubMed] [Green Version]
- Brandon, E.F.; Raap, C.D.; Meijerman, I.; Beijnen, J.H.; Schellens, J.H. An update on in vitro test methods in human hepatic drug biotransformation research: Pros and cons. Toxicol. Appl. Pharmacol. 2003, 189, 233–246. [Google Scholar] [CrossRef]
- Brenner, D.R.; Boucher, B.A.; Kreiger, N.; Jenkins, D.; El-Sohemy, A. Dietary patterns in an ethnoculturally diverse population of young Canadian adults. Can. J. Diet. Pract. Res. 2011, 72, e161–e168. [Google Scholar] [CrossRef]
- Merino, D.M.; Johnston, H.; Clarke, S.; Roke, K.; Nielsen, D.; Badawi, A.; El-Sohemy, A.; Ma, D.W.; Mutch, D.M. Polymorphisms in FADS1 and FADS2 alter desaturase activity in young Caucasian and Asian adults. Mol. Genet Metab. 2011, 103, 171–178. [Google Scholar] [CrossRef]
- Brandsch, C.; Shukla, A.; Hirche, F.; Stangl, G.I.; Eder, K. Effect of proteins from beef, pork, and turkey meat on plasma and liver lipids of rats compared with casein and soy protein. Nutrition 2006, 22, 1162–1170. [Google Scholar] [CrossRef] [PubMed]
- Gooderham, M.H.; Adlercreutz, H.; Ojala, S.T.; Wähälä, K.; Holub, B.J. A soy protein isolate rich in genistein and daidzein and its effects on plasma isoflavone concentrations, platelet aggregation, blood lipids and fatty acid composition of plasma phospholipid in normal men. J. Nutr. 1996, 126, 2000–2006. [Google Scholar] [CrossRef] [PubMed]
- Xiao, C.W.; Mei, J.; Wood, C.M. Effect of soy proteins and isoflavones on lipid metabolism and involved gene expression. Front. Biosci. 2008, 13, 2660–2673. [Google Scholar] [CrossRef] [PubMed] [Green Version]
- Jump, D.B. Fatty acid regulation of hepatic lipid metabolism. Curr. Opin. Clin. Nutr. Metab. Care 2011, 14, 115–120. [Google Scholar] [CrossRef] [PubMed] [Green Version]
- Patterson, E.; Wall, R.; Fitzgerald, G.F.; Ross, R.P.; Stanton, C. Health Implications of High Dietary Omega-6 Polyunsaturated Fatty Acids. J. Nutr. Metab. 2012, 2012, 539426. [Google Scholar] [CrossRef] [PubMed]
- Tovar, A.R.; Torre-Villalvazo, I.; Ochoa, M.; Elías, A.L.; Ortíz, V.; Aguilar-Salinas, C.A.; Torres, N. Soy protein reduces hepatic lipotoxicity in hyperinsulinemic obese Zucker fa/fa rats. J. Lipid. Res. 2005, 46, 1823–1832. [Google Scholar] [CrossRef] [PubMed] [Green Version]
- Gorissen, S.H.M.; Crombag, J.J.R.; Senden, J.M.G.; Waterval, W.A.H.; Bierau, J.; Verdijk, L.B.; van Loon, L.J.C. Protein content and amino acid composition of commercially available plant-based protein isolates. Amino Acids 2018, 50, 1685–1695. [Google Scholar] [CrossRef] [Green Version]
- Sugiyama, K.; Yamakawa, A.; Kumazawa, A.; Saeki, S. Methionine content of dietary proteins affects the molecular species composition of plasma phosphatidylcholine in rats fed a cholesterol-free diet. J. Nutr. 1997, 127, 600–607. [Google Scholar] [CrossRef] [Green Version]
- Shimada, Y.; Morita, T.; Sugiyama, K. Increased Response of Liver Microsomal Δ6-Desaturase Activity to Dietary Methionine in Rats. Biosci. Biotechnol. Biochem. 2003, 67, 743–751. [Google Scholar] [CrossRef]
- Wirfält, A.K.; Jeffery, R.W.; Elmer, P.J. Comparison of food frequency questionnaires: The reduced Block and Willett questionnaires differ in ranking on nutrient intakes. Am. J. Epidemiol. 1998, 148, 1148–1156. [Google Scholar] [CrossRef] [Green Version]
- Peñalvo, J.L.; Castilho, M.C.; Silveira, M.I.N.; Matallana, M.C.; Torija, M.E. Fatty acid profile of traditional soymilk. Eur. Food Res. Technol. 2004, 219, 251–253. [Google Scholar] [CrossRef]
- Månsson, H.L. Fatty acids in bovine milk fat. Food. Nutr. Res. 2008, 52. [Google Scholar] [CrossRef] [Green Version]
- Gillingham, L.G.; Harding, S.V.; Rideout, T.C.; Yurkova, N.; Cunnane, S.C.; Eck, P.K.; Jones, P.J. Dietary oils and FADS1-FADS2 genetic variants modulate [13C]α-linolenic acid metabolism and plasma fatty acid composition. Am. J. Clin. Nutr. 2013, 97, 195–207. [Google Scholar] [CrossRef] [PubMed] [Green Version]
- Research, G.V. Soy Milk Market Size Worth $11.08 Billion By 2025|CAGR: 6.1%. Available online: https://www.grandviewresearch.com/press-release/global-soy-milk-market (accessed on 23 November 2020).
- Simopoulos, A.P. The importance of the ratio of omega-6/omega-3 essential fatty acids. Biomed Pharm. 2002, 56, 365–379. [Google Scholar] [CrossRef]
- Jump, D.B.; Depner, C.M.; Tripathy, S.; Lytle, K.A. Potential for Dietary ω-3 Fatty Acids to Prevent Nonalcoholic Fatty Liver Disease and Reduce the Risk of Primary Liver Cancer. Adv. Nutr. 2015, 6, 694–702. [Google Scholar] [CrossRef] [Green Version]
- Janssen, C.I.F.; Kiliaan, A.J. Long-chain polyunsaturated fatty acids (LCPUFA) from genesis to senescence: The influence of LCPUFA on neural development, aging, and neurodegeneration. Prog. Lipid Res. 2014, 53, 1–17. [Google Scholar] [CrossRef] [PubMed]
- Del Gobbo, L.C.; Imamura, F.; Aslibekyan, S.; Marklund, M.; Virtanen, J.K.; Wennberg, M.; Yakoob, M.Y.; Chiuve, S.E.; Dela Cruz, L.; Frazier-Wood, A.C.; et al. ω-3 Polyunsaturated Fatty Acid Biomarkers and Coronary Heart Disease: Pooling Project of 19 Cohort Studies. JAMA Intern. Med. 2016, 176, 1155–1166. [Google Scholar] [CrossRef] [PubMed] [Green Version]

Publisher’s Note: MDPI stays neutral with regard to jurisdictional claims in published maps and institutional affiliations. |
© 2021 by the authors. Licensee MDPI, Basel, Switzerland. This article is an open access article distributed under the terms and conditions of the Creative Commons Attribution (CC BY) license (https://creativecommons.org/licenses/by/4.0/).