
The WHO South-East Asia Region Nutrient Profile Model Is Quite Appropriate for India: An Exploration of 31,516 Food Products

 ,
,
Abstract
:1. Introduction
2. Materials and Methods
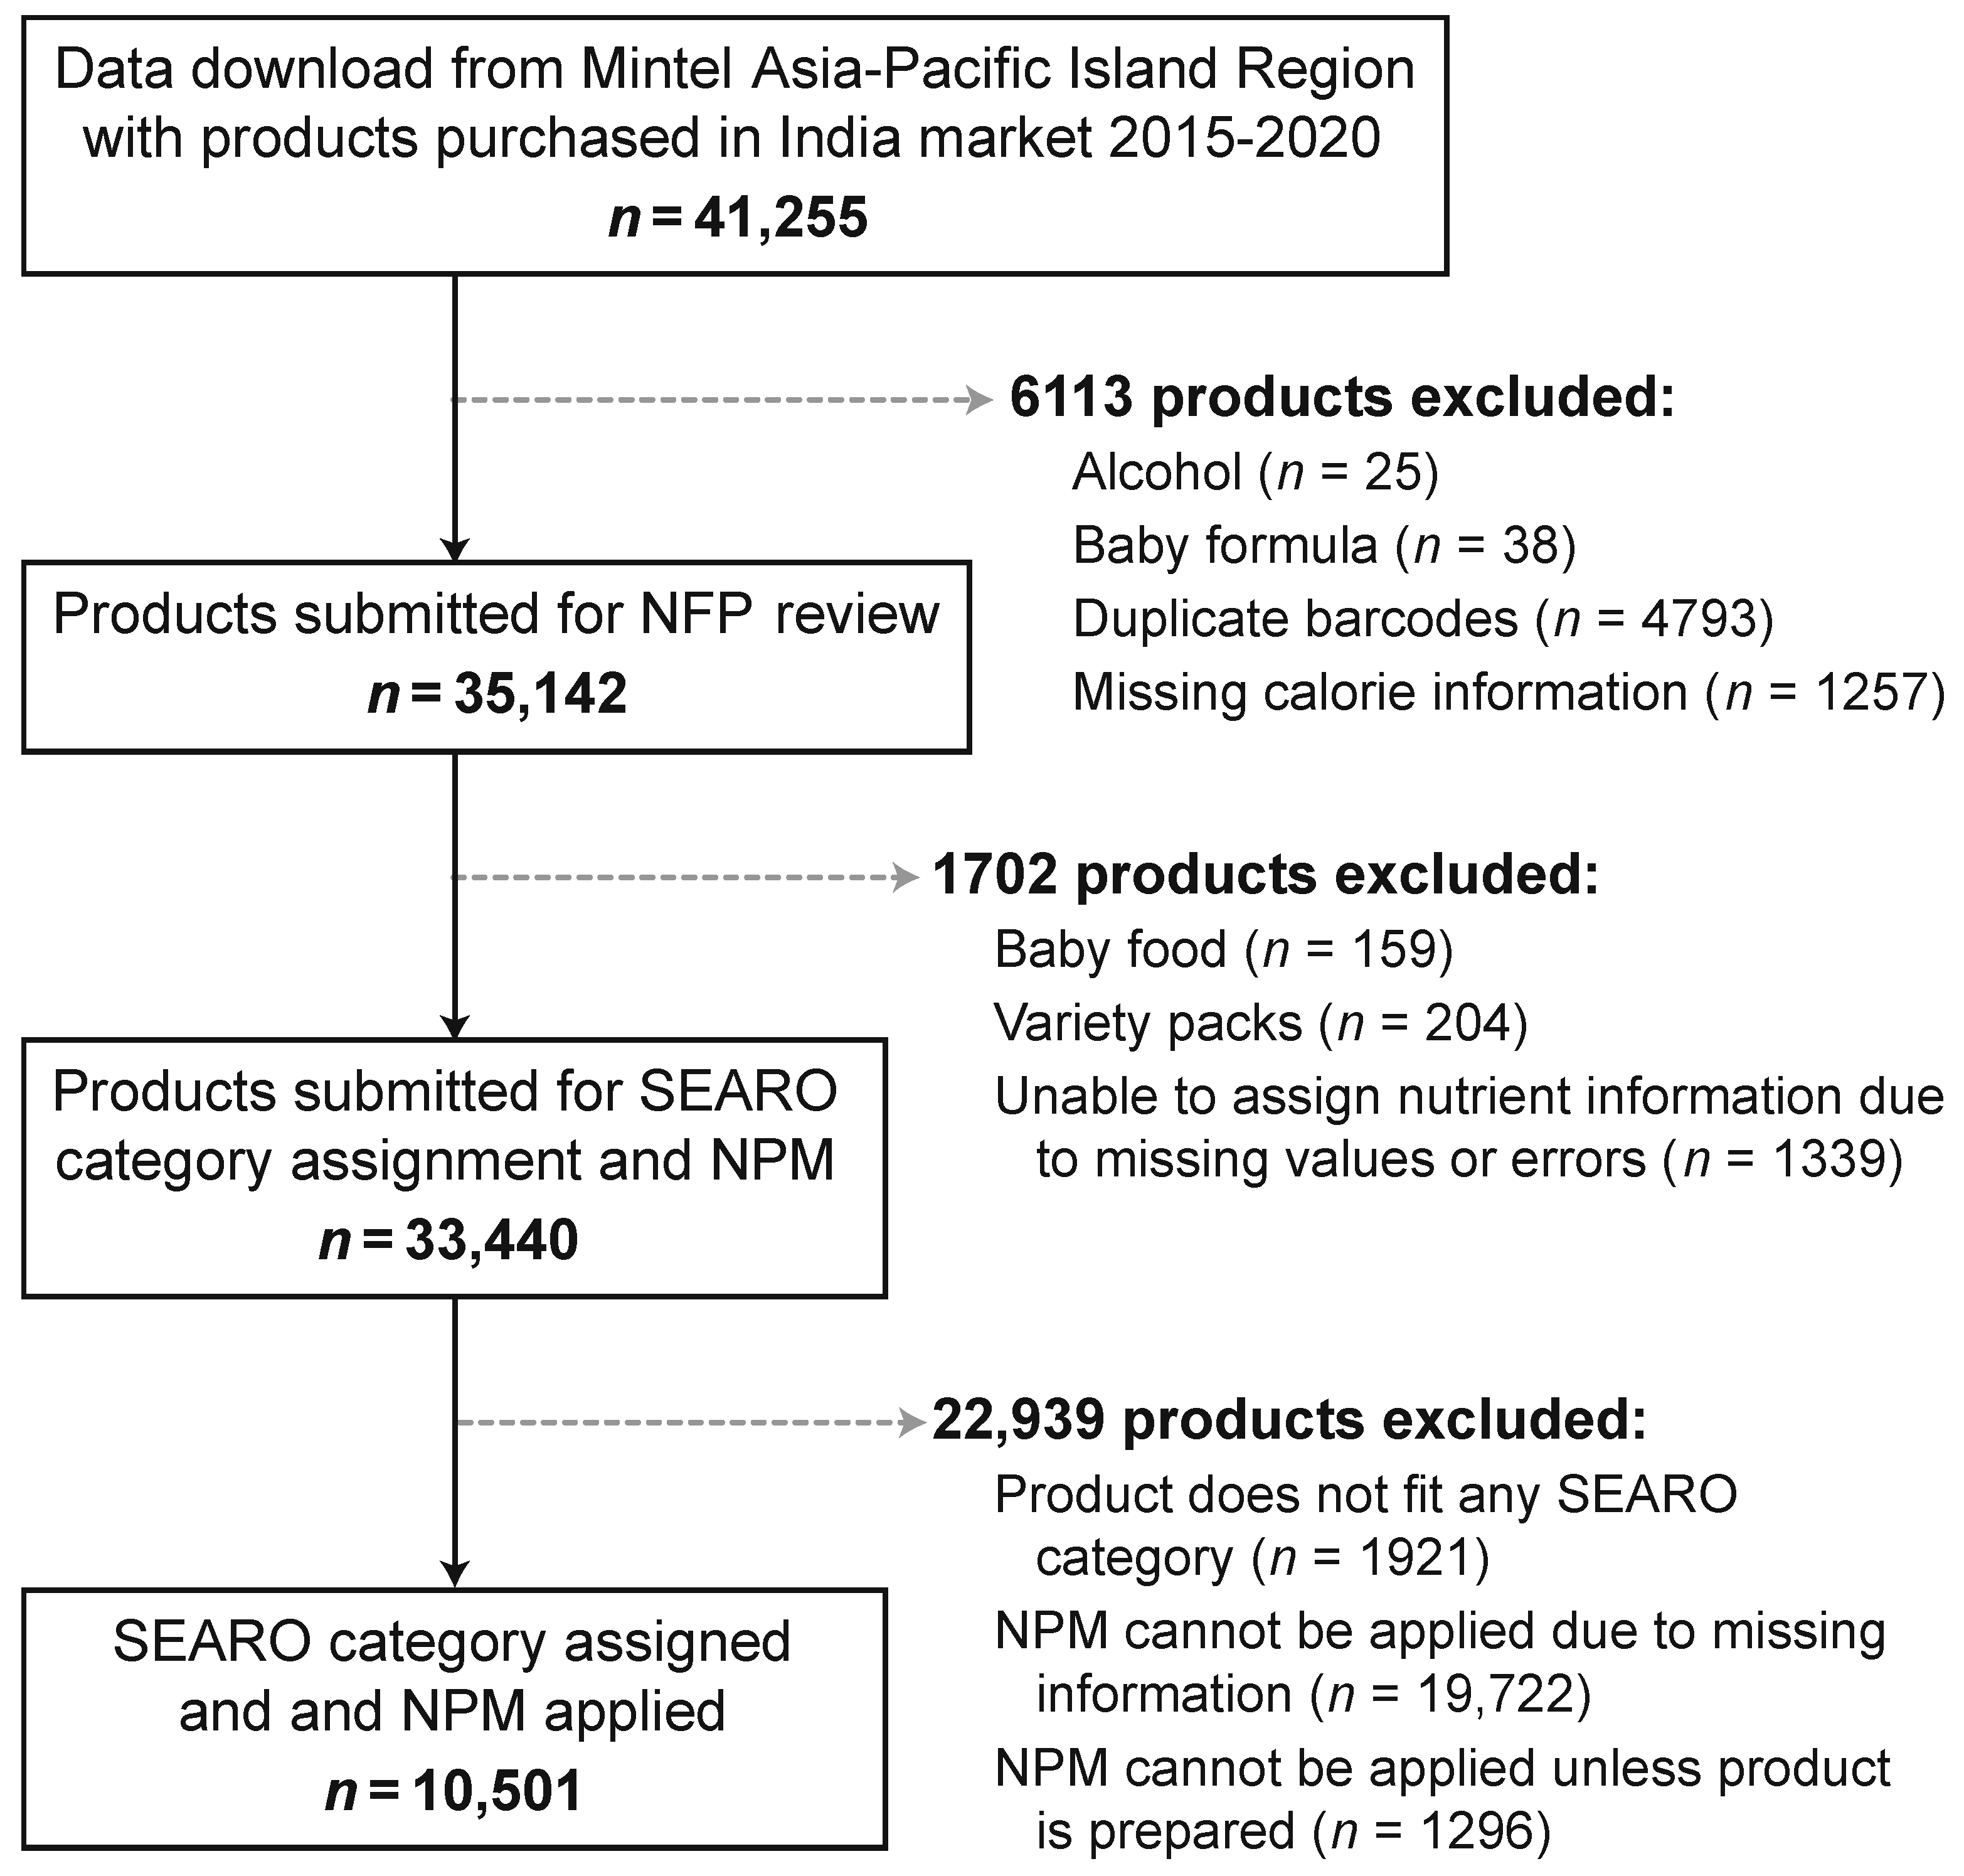
2.1. The Data
2.2. Applying the SEARO and CWO NPM Criteria
2.3. Analysis
3. Results
4. Discussion
5. Conclusions
Supplementary Materials
Author Contributions
Funding
Institutional Review Board Statement
Informed Consent Statement
Data Availability Statement
Acknowledgments
Conflicts of Interest
Appendix A

| SEARO Food Category Code | SEARO Food Category Name | Examples of Food Items | Nutrient Thresholds | |||||
|---|---|---|---|---|---|---|---|---|
| Total Fat (g) | Saturated Fat (g) | Total Sugars (g) | Added Sugars (g) | Sodium (g) | Energy (kcal) | |||
| 1 | Confectionery | Cocoa/chocolate bars and spreads, including imitations and chocolate substitutes; hard, soft, and chewy candies; chewing gum, Indian sweets, sweet sauces, topping sauces, and creamy, sweet, and traditional desserts | 8.0 | N/A | 6.0 | N/A | N/A | 230 |
| 2 | Cakes, sweet biscuits, pastries | Cakes, cookies, pies, doughnuts, sweet rolls, muffins, macaroons, biscuits, pancakes (ready-to-eat form) | 8.0 | N/A | 6.0 | N/A | 0.25 | 230 |
| 3 | Bread and bread products | Bread and rolls, pita, naan, rotis, steamed bread, steamed buns, crackers, mixes for making bread, and ordinary bakery wares | 8.0 | N/A | 6.0 | N/A | 0.25 | N/A |
| 4 | Cereals | Whole, broken, or flaked grains of rice and other cereals (dalia-broken wheat); rice-based, wheat-based, or maize-based breakfast cereals of all flavours; oat meal, mueslis, granola, and muesli bars; cereal bars, rice cakes | 12.0 | N/A | 9.0 | N/A | 0.35 | N/A |
| 5A | Potato, cereal, or starch-based (from roots, legumes, or tubers), and animal-based (from skin) foods | Popcorn and maize corn, savory biscuits, crackers, other snacks made from rice, maize, wheat, dough, potato, cassava (i.e., chips, crisps),varieties of namkeen, papadums | 8.0 | N/A | N/A | 0 | 0.05 | 230 |
| 5B | Processed nuts | Nuts and mixed nuts (including with fruit content) | N/A | N/A | N/A | 0 | 0.05 | N/A |
| 5C | Fish-based foods | fish-based snacks (savory crackers with fish, fish products, or fish flavoring NOT fish jerky) | N/A | N/A | 6.0 | N/A | 0.25 | 230 |
| 6A | Juices | 100% fruit and vegetable juices prepared from direct extraction or reconstituted from concentrate | N/A | N/A | 6.0 | 0 | N/A | N/A |
| 6B | Milk- and dairy-based drinks | Milk, butter milk, flavoured dairy-based milk, fermented dairy-based milk, e.g., chocolate milk, strawberry milk, cocoa, eggnog, drinking yoghurt, whey-based drinks. Milk means milk from animals such as cow, buffalo, goat, etc. | 7.0 | N/A | N/A | 0.0 | N/A | N/A |
| 6C | Water-based flavoured drinks | Sport, energy, electrolyte drinks, carbonated, and non-carbonated water-based flavoured drinks, jaljeera, concentrates (liquid or solid) in or calculated as ready-to-drink form | N/A | N/A | 2.0 | N/A | 0.30 | N/A |
| 6D | Coffee, coffee substitutes, tea, herbal infusions | Coffee, coffee substitutes, tea, herbal infusion in or calculated as ready-to-drink form | N/A | N/A | 2.0 | N/A | N/A | N/A |
| 6E | Cereal, grain, tree nut-based beverages | Cereal, grain, and tree nut-based beverages produced from the extracts of cereals, beans, pulses, and tree nuts, e.g., rice-, almond-, soybean-, and oat-based beverages. | N/A | N/A | 6.0 | N/A | 0.20 | N/A |
| 7 | Frozen dairybased dessertsand edible ices | Ice cream, ice milk, frozen flavouredyoghurt, iced lollipops, and sorbets | 8.0 | N/A | 12.0 | N/A | 0.10 | 230 |
| 8 | Curded dairy-based desserts | Dairy-based products that have been curded by fermentation, acid, enzyme, heat, etc., and flavoured with sugar and other ingredients. Examples are flavoured cream-type yoghurt, jellied milk, caramel pudding, butterscotch pudding, chocolate mousse, khoa, peda, burfee, and gulab jamun. | 7.0 | N/A | 6.0 | N/A | 0.10 | 230 |
| 9 | Cheese and analogues | Un-ripened or ripened cheese, whey cheese, processed cheese, cheese analogues, whey protein cheese that can be classified based on physical characteristics as hard (e.g., parmesan), semi-hard (e.g., cheddar), medium-hard (e.g., edam), semi-soft and soft (e.g., mozzarella, paneer, cottage), as well as serving style such as sliced, grated, or spreadable | 20.0 | N/A | N/A | 0.0 | 0.60 | N/A |
| 10 | Composite foods (preparedfoods) | Mixtures of multiple components (e.g., meat, sauce, grain, cheese, vegetables). These include foods that require minimal preparation heating, thawing, rehydrating), or ready-to-serve meals from restaurants. Examples: frozen and chilled ready meals, hamburgers, fried chicken, pizzas, lasagna, ready-made sandwiches, soups, instant noodles, instant porridge, steamed pork buns, dumplings, burgers in buns, ready meals, soups | 8.0 | 3.5 | 9.0 | N/A | 0.35 | N/A |
| 11 | Fats and oils, and fat emulsions | Butter oil, anhydrous milk fat, ghee, vegetable oils and fats, lard, tallow, fish oils and other animal fats, butter, margarine, and similar products. Examples: cooking oils from plant and animal sources, butter, margarine, fat blends. Fat spreads | N/A | 35.0 | N/A | N/A | 0.10 | N/A |
| 12 | Pasta, noodles, and similar products | Fresh, precooked, or dried noodles, pasta, and similar products; rice paper, rice noodles, vermicelli made from wheat, tapioca, sago, legume etc. (cooked as ready to eat) | 3.0 | N/A | N/A | N/A | 0.25 | N/A |
| 13 | Fresh and frozen meat, poultry, game, fish, and seafood products | Fresh and frozen meat, poultry, game, mollusks, crustaceans, echinoderms in the forms of wholepieces, cuts/fillet, comminuted/minced/creamed. Examples: beef, pork, chicken, lamb, goat, tuna, mackerel, catfish, shrimp etc. | 15.0 | N/A | N/A | N/A | N/A | N/A |
| 14A | Processed meat, poultryand game products | Non-heat and heat-treated whole pieces or cuts or commuted meat poultry and game that have been cured/cured and dried, or fermented. Examples include smoked ham, salted dried meat, salami, sausage, bacon, corned beef, smoked duck, canned meats, chicken nuggets, beef or chicken patty, pork rind. | 8.0 | N/A | N/A | N/A | 0.40 | N/A |
| 14B | Processed fish andseafood products | Frozen battered, cooked and/or fried, smoked, dried, fermented, and/or salted, semi-preserved by pickling or brining, fully-preserved by canning or fermentation of fish and sea foods.Examples: salted fish and seafood, brined fish, salted fish in oil, fermented fish and seafood, anchovies, shrimp paste, canned tuna, sardine, or mackerel, smoked fishes, dried shrimp, fish balls, fish fingers | 8.0 | 3.0 | N/A | N/A | 0.40 | N/A |
| 15 | Fresh or frozen fruits and vegetables; legumes | Fruits, vegetables, mushrooms and fungi, roots and tubers, pulses and legumes, nuts and seeds, seaweed | N/A | N/A | N/A | N/A | N/A | N/A |
| 16 | Processed fruits and vegetables | Dried, canned, or bottled jam, jellies, marmalades; packed in vinegar, oil or brine, pickles, spreads, candied, pulp, purees, topping, milk, fermented, fillings, cooked forms of fruits and vegetables. Examples: fruits and vegetables in vinegar, oil, or brine; dried fruits; marmalade or jams; canned fruits, vegetables, and legumes; dried mushrooms; preserved or pickled fruits and vegetables; pickled tea leaves, peanut butter | N/A | N/A | N/A | N/A | 0.40 | N/A |
| 17 | Solid-form soybean products | Soybean-based beverages, soybean curd (tofu), semi-dehydrated tofu, dehydrated tofu (kori tofu), fermented soybeans (natto, tempeh), other soybean protein products (soya nuggets and textured vegetable protein) | 12.0 | N/A | 5.0 | N/A | 0.10 | N/A |
| 18 | Sauces, dips, and dressings | Emulsified and non-emulsified mixes as concentrated, clear sauces and similar products, soybean-based seasoning, and condiments. Examples: mayonnaise, salad dressing, onion dips, tomato ketchup, colored ketchup, gravy, cheese sauce, cream sauce, bouillon cubes, seasoning powder, fermented and nonfermented soy sauces, fish sauce, sweet chili sauce, spaghetti sauce, BBQ sauces, chili paste, chutney, and marmite | 12.0 | N/A | 10.0 | N/A | 0.30 | N/A |
| Nutrient per 100 g or mL 1 | Liquids 2 (mL) | Solids 3 (Grams) |
|---|---|---|
| Calories (kcal) | 70 | 275 |
| Sodium (mg) | 100 | 400 |
| Total sugar (g) | 5 | 10 |
| Saturated fat (g) | 3 | 4 |
References
- Aiyar, A.; Rahman, A.; Pingali, P. India’s rural transformation and rising obesity burden. World Dev. 2021, 138, 105258. [Google Scholar] [CrossRef]
- Popkin, B.M.; Corvalan, C.; Grummer-Strawn, L.M. Dynamics of the double burden of malnutrition and the changing nutrition reality. Lancet 2020, 395, 65–74. [Google Scholar] [CrossRef]
- Wells, J.C.; Pomeroy, E.; Walimbe, S.R.; Popkin, B.M.; Yajnik, C.S. The elevated susceptibility to diabetes in India: An evolutionary perspective. Front. Public Health 2016, 4, 145. [Google Scholar] [CrossRef] [Green Version]
- Misra, A. Ethnic-Specific Criteria for Classification of Body Mass Index: A Perspective for Asian Indians and American Diabetes Association Position Statement. Diabetes Technol. Ther. 2015, 17, 667–671. [Google Scholar] [CrossRef] [Green Version]
- Shetty, P. Public health: India’s diabetes time bomb. Nature 2012, 485, S14–S16. [Google Scholar] [CrossRef]
- Dunford, E.K.; Ni Mhurchu, C.; Huang, L.; Vandevijvere, S.; Swinburn, B.; Pravst, I.; Tolentino-Mayo, L.; Reyes, M.; L’Abbe, M.; Neal, B.C. A comparison of the healthiness of packaged foods and beverages from 12 countries using the Health Star Rating nutrient profiling system, 2013–2018. Obes. Rev. 2019, 20, 107–115. [Google Scholar] [CrossRef] [PubMed] [Green Version]
- Hall, K.D. Ultra-processed diets cause excess calorie intake and weight gain: A one-month inpatient randomized controlled trial of ad libitum food intake. Cell Metab. 2019, 30, 1–10. [Google Scholar] [CrossRef] [PubMed] [Green Version]
- Pagliai, G.; Dinu, M.; Madarena, M.P.; Bonaccio, M.; Iacoviello, L.; Sofi, F. Consumption of ultra-processed foods and health status: A systematic review and meta-analysis. Br. J. Nutr. 2021, 125, 308–318. [Google Scholar] [CrossRef]
- The Economic Times-Politics. Government working on four fronts to keep India healthy, says Prime Minister Modi. The Economic Times, 2 July 2021. [Google Scholar]
- Popkin, B.M.; Barquera, S.; Corvalan, C.; Hofman, K.J.; Monteiro, C.; Ng, S.W.; Swart, E.C.; Taillie, L.S. Towards unified and impactful policies to reduce ultra-processed food consumption and promote healthier eating. Lancet Diabetes Endocrinol. 2021, 9, 462–470. [Google Scholar] [CrossRef]
- Monteiro, C.A.; Cannon, G.; Moubarac, J.-C.; Levy, R.B.; Louzada, M.L.C.; Jaime, P.C. The UN Decade of Nutrition, the NOVA food classification and the trouble with ultra-processing. Public Health Nutr. 2017, 21, 5–17. [Google Scholar] [CrossRef] [Green Version]
- Passport, E. Euromonitor International, India. Available online: http://www.euromonitor.com/ (accessed on 29 May 2021).
- Euromonitor International. Passport Nutrition. Available online: https://www.euromonitor.com/nutrition (accessed on 15 June 2021).
- Pries, A.M.; Rehman, A.M.; Filteau, S.; Sharma, N.; Upadhyay, A.; Ferguson, E.L. Unhealthy Snack Food and Beverage Consumption Is Associated with Lower Dietary Adequacy and Length-for-Age z-Scores among 12–23-Month-Olds in Kathmandu Valley, Nepal. J. Nutr. 2019, 149, 1843–1851. [Google Scholar] [CrossRef]
- Pries, A.M.; Ferguson, E.L.; Sharma, N.; Upadhyay, A.; Filteau, S. Exploratory Analysis of Nutritional Quality and Metrics of Snack Consumption among Nepali Children during the Complementary Feeding Period. Nutrients 2019, 11, 2962. [Google Scholar] [CrossRef] [Green Version]
- Baker, P.; Machado, P.; Santos, T.; Sievert, K.; Backholer, K.; Hadjikakou, M.; Russell, C.; Huse, O.; Bell, C.; Scrinis, G.; et al. Ultra-processed foods and the nutrition transition: Global, regional and national trends, food systems transformations and political economy drivers. Obes. Rev. 2020, 21, e13126. [Google Scholar] [CrossRef] [PubMed]
- Lawrence, M.A.; Baker, P.I. Ultra-processed food and adverse health outcomes. BMJ 2019, 365, l2289. [Google Scholar] [CrossRef]
- Corvalan, C.; Reyes, M.; Garmendia, M.L.; Uauy, R. Structural responses to the obesity and non-communicable diseases epidemic: Update on the Chilean law of food labelling and advertising. Obes. Rev. 2019, 20, 367–374. [Google Scholar] [CrossRef]
- Taillie, L.S.; Reyes, M.; Colchero, M.A.; Popkin, B.; Corvalán, C. An evaluation of Chile’s Law of Food Labeling and Advertising on sugar-sweetened beverage purchases from 2015 to 2017: A before-and-after study. PLoS Med. 2020, 17, e1003015. [Google Scholar] [CrossRef]
- Taillie, L.; Bercholz, M.; Popkin, B.; Reyes, M.; Colchero, A.; Corvalan, C. Changes in food purchases after Chile’s polices on food labeling, marketing, and sales in schools: A before and after study. Lancety Planet. Health 2021, in press. [Google Scholar] [CrossRef]
- Correa, T.; Fierro, C.; Reyes, M.; Carpentier, F.R.D.; Taillie, L.S.; Corvalan, C. Responses to the Chilean law of food labeling and advertising: Exploring knowledge, perceptions and behaviors of mothers of young children. Int. J. Behav. Nutr. Phys. Act. 2019, 16, 21. [Google Scholar] [CrossRef] [PubMed]
- Shekar, M.; Popkin, B.M. Obesity: Health and Economic Consequences of an Impending Global Challenge; The World Bank: Washington, DC, USA, 2020; p. 204. [Google Scholar]
- WHO. WHO Nutrient Profile Model for South-East Asia Region; WHO for South-East Asia: Manila, Philippines, 2017; p. 13. [Google Scholar]
- Reyes, M.; Smith Taillie, L.; Popkin, B.; Kanter, R.; Vandevijvere, S.; Corvalan, C. Changes in the amount of nutrient of packaged foods and beverages after the initial implementation of the Chilean Law of Food Labelling and Advertising: A nonexperimental prospective study. PLoS Med. 2020, 17, e1003220. [Google Scholar] [CrossRef] [PubMed]
- The Nutrition Alchemy. Nutrient (Fat, Sugar and Sodium) Threshold Study in Packaged Food; FSSAI, Ed.; Food Safety and Standards Authority of India New Delhi: New Delhi, India, 2020; p. 247. [Google Scholar]
- Mintel Global New Products Database(GNDP). Mintel Global New Products Database for India, Continuous Ed.; Mintel GNDP: London, UK, 2021; Volume 2021. [Google Scholar]
- Food Safety and Standards Authority of India (FSSAI). Nutrient (Fat, Sugar & Sodium) Threshold study in Packaged Foods; FSSAI: New Delhi, India, 2020; p. 247. [Google Scholar]
- National Treasury, R.O.S.A. Taxation of Sugar Sweetened Beverages, National Treasury, R.o.S.A.; Economics Tax Analysis Chief Directorate Ed.; National Department of Treasury: Pretoria, South Africa, 2016. [Google Scholar]
- Mora-Plazas, M.; Gómez, L.F.; Miles, D.R.; Parra, D.C.; Taillie, L.S. Nutrition Quality of Packaged Foods in Bogotá, Colombia: A Comparison of Two Nutrient Profile Models. Nutrients 2019, 11, 1011. [Google Scholar] [CrossRef] [Green Version]
- Contreras-Manzano, A.; Jáuregui, A.; Velasco-Bernal, A.; Vargas-Meza, J.; Rivera, J.A.; Tolentino-Mayo, L.; Barquera, S. Comparative Analysis of the Classification of Food Products in the Mexican Market According to Seven Different Nutrient Profiling Systems. Nutrients 2018, 10, 737. [Google Scholar] [CrossRef] [PubMed] [Green Version]
- Duran, A.C.; Ricardo, C.Z.; Mais, L.A.; Bortoletto Martins, A.P. Role of different nutrient profiling models in identifying targeted foods for front-of-package food labelling in Brazil. Public Health Nutr. 2021, 24, 1514–1525. [Google Scholar] [CrossRef]
- Soares-Wynter, S.; Aiken-Hemming, S.A.; Hollingsworth, B.; Miles, D.R.; Ng, S.W. Applying Nutrient Profiling Systems to Packaged Foods and Drinks Sold in Jamaica. Foods 2020, 9, 65. [Google Scholar] [CrossRef] [PubMed] [Green Version]
- Frank, T.; Thow, A.-M.; Ng, S.W.; Ostrowski, J.; Bopape, M.; Swart, E.C. A Fit-for-Purpose Nutrient Profiling Model to Underpin Food and Nutrition Policies in South Africa. Nutrients 2021, 13, 2584. [Google Scholar] [CrossRef]
| SEARO Food Category Code | SEARO Food Category Name | Total N 1 | N with Nutrient Information 2 | Meets at Least One Criteria for WHO SEARO NPM 3 | Meets at Least One Criteria for CWO NPM 4 | ||
|---|---|---|---|---|---|---|---|
| N 5 | % | N 5 | % | ||||
| Total | 31,519 | 10,501 | 7185 | 68.4 | 6623 | 63.0 | |
| 1 | Confectionary | 3148 | 1377 | 1368 | 99.3 | 1333 | 96.8 |
| 2 | Cakes, sweet biscuits, pastries | 2669 | 667 | 667 | 100 | 666 | 99.8 |
| 3 | Bread and bread products | 1050 | 184 | 123 | 66.8 | 109 | 59.2 |
| 4 | Cereals | 2619 | 1008 | 377 | 37.4 | 413 | 40.9 |
| 5A | Potato, cereal, or starch-based (from roots, tuber, or legumes), and animal-based (from skin) foods | 4092 | 1312 | 1312 | 100 | 1285 | 97.9 |
| 5B | Processed nuts | 1022 | 478 | 454 | 94.9 | 249 | 52.1 |
| 5C | Fish-based foods | 4 | 0 | - | - | - | - |
| 6A | Juices | 517 | 235 | 180 | 76.5 | 124 | 52.7 |
| 6B | Milk- and dairy-based drinks | 905 | 228 | 169 | 74.1 | 80 | 35.0 |
| 6C | Water-based flavored drinks | 2123 | 783 | 691 | 88.2 | 583 | 74.4 |
| 6D | Coffee, coffee substitutes, tea, herbal infusions | 1883 | 1418 | 132 | 9.3 | 69 | 4.8 |
| 6E | Cereal, grain, tree nut-based beverages | 249 | 155 | 61 | 39.3 | 55 | 35.4 |
| 7 | Frozen dairy-based desserts and edible ices | 595 | 128 | 123 | 96.0 | 118 | 92.1 |
| 8 | Curded dairy-based desserts | 426 | 111 | 105 | 94.5 | 102 | 91.8 |
| 9 | Cheese and analogues | 626 | 200 | 178 | 89 | 129 | 64.5 |
| 10 | Composite foods (prepared foods) | 1219 | 160 | 114 | 71.2 | 86 | 53.7 |
| 11 | Fats and oils, and fat emulsions | 1715 | 204 | 84 | 41.1 | 21 | 10.2 |
| 12 | Pasta, noodles, and similar products | 630 | 9 | 3 | 33.3 | 3 | 33.3 |
| 13 | Fresh and frozen meat, poultry, game, fish, and seafood products | 20 | 20 | 4 | 20 | 0 | 0 |
| 14A | Processed meat, poultry, and game products | 466 | 61 | 59 | 96.7 | 47 | 77.0 |
| 14B | Processed fish and seafood products | 216 | 61 | 43 | 70.4 | 31 | 50.8 |
| 15 | Fresh and frozen fruits and vegetables, and legumes | 89 | 14 | 0 | 0 | 0 | 0 |
| 16 | Processed fruits and vegetables | 2448 | 849 | 255 | 30.0 | 520 | 61.2 |
| 17 | Solid-form soybean products | 86 | 6 | 1 | 16.6 | 0 | 0 |
| 18 | Sauces, dips, and dressings | 2702 | 833 | 682 | 81.8 | 600 | 72.0 |
| SEARO Food Category Code | SEARO Food Category Name | N with Nutrient Information 1 | Percent of Products Meet SEARO Criteria | |||
|---|---|---|---|---|---|---|
| No Warning Label | 1 Warning Label | 2 Warning Labels | 3 or More Warning Labels | |||
| Total | 10,501 | 31.6 | 21.8 | 15.04 | 31.6 | |
| 1 | Confectionary | 1377 | 0.7 | 1.67 | 10.31 | 87.36 |
| 2 | Cakes, sweet biscuits, pastries | 667 | 0.0 | 0.30 | 1.65 | 98.05 |
| 3 | Bread and bread products | 184 | 33.2 | 39.13 | 26.63 | 1.09 |
| 4 | Cereals | 1008 | 62.6 | 15.97 | 20.44 | 0.99 |
| 5A | Potato, cereal, or starch-based (from roots, tuber, or legumes), and animal-based (from skin) foods | 1312 | 0.0 | 0.23 | 4.80 | 94.97 |
| 5B | Processed nuts | 478 | 5.0 | 38.28 | 56.07 | 0.63 |
| 6A | Juices | 235 | 23.4 | 28.09 | 48.51 | 0.00 |
| 6B | Milk- and dairy-based drinks | 228 | 25.9 | 65.79 | 8.33 | 0.00 |
| 6C | Water-based flavoured drinks | 783 | 11.8 | 82.63 | 5.49 | 0.13 |
| 6D | Coffee, coffee substitutes, tea, herbal infusions | 1418 | 90.7 | 8.96 | 0.35 | 0.00 |
| 6E | Cereal, grain, tree nut-based beverages | 155 | 60.6 | 36.77 | 2.58 | 0.00 |
| 7 | Frozen dairy-based desserts and edible ices | 128 | 3.9 | 17.97 | 31.25 | 46.88 |
| 8 | Curded dairy-based desserts | 111 | 5.4 | 26.13 | 46.85 | 21.62 |
| 9 | Cheese and analogues | 200 | 11.0 | 16.50 | 46.00 | 26.50 |
| 10 | Composite foods (prepared foods) | 160 | 28.8 | 39.38 | 15.63 | 16.25 |
| 11 | Fats and oils, and fat emulsions | 204 | 58.8 | 32.84 | 8.33 | 0.00 |
| 12 | Pasta, noodles, and similar products | 9 | 66.7 | 33.33 | 0.00 | 0.00 |
| 13 | Fresh and frozen meat, poultry, game, fish, and seafood products | 20 | 80.0 | 20.00 | 0.00 | 0.00 |
| 14A | Processed meat, poultry, and game products | 61 | 3.3 | 32.79 | 63.93 | 0.00 |
| 14B | Processed fish and seafood products | 61 | 29.5 | 27.87 | 31.15 | 11.48 |
| 15 | Fresh and frozen fruits and vegetables, and legumes | 14 | 100.0 | 0.00 | 0.00 | 0.00 |
| 16 | Processed fruits and vegetables | 849 | 70.0 | 29.68 | 0.35 | 0.00 |
| 17 | Solid-form soybean products | 6 | 83.3 | 16.67 | 0.00 | 0.00 |
| 18 | Sauces, dips, and dressings | 833 | 18.1 | 34.45 | 44.18 | 3.24 |
| Food Safety and Standards Agency of India Sub-Category Code (Level 3/4) | Number of HFSS Nutrients | |||||||
|---|---|---|---|---|---|---|---|---|
| 0 (Non-HFSS) | 1 | 2 | 3± | |||||
| n | % | n | % | n | % | n | % | |
| Totals | 59 | 4.5% | 188 | 14.4 | 239 | 18.3 | 820 | 62.5 |
| 1.1.2. Dairy-based drinks—flavoured milk and/or fermented | 7 | 9.3 | 47 | 62.7 | 19 | 25.3 | 2 | 2.7 |
| 1.6.4 Cheese and Analogues | 0 | 0.0 | 0 | 0.0 | 0 | 0.0 | 5 | 100.0 |
| 1.7 Dairy-based desserts | 0 | 0.0 | 3 | 2.1 | 10 | 6.8 | 133 | 91.1 |
| 2.2.2 Fat emulsions, mainly water-in-oil | 0 | 0.0 | 4 | 100.0 | 0 | 0.0 | 0 | 0.0 |
| 2.4.1 Cocoa-based spreads, including fillings | 0 | 0.0 | 5 | 100.0 | 0 | 0.0 | 0 | 0.0 |
| 3. Edible Ices | 0 | 0.0 | 0 | 0.0 | 16 | 100.0 | 0 | 0.0 |
| 4.1.2.5 & 4.1.2.9 Jams, Jellies, and Marmalades, and fruit-based desserts, fruit Cheese, including fruit-flavoured, water-baseddesserts | 0 | 0.0 | 8 | 100.0 | 0 | 0.0 | 0 | 0.0 |
| 4.2.2.1 Frozen vegetables | 4 | 26.7 | 11 | 73.3 | 0 | 0.0 | 0 | 0.0 |
| 4.2.2.5 Vegetables (seed purees and spreads) | 6 | 60.0 | 0 | 0.0 | 4 | 40.0 | 0 | 0.0 |
| 4.2.2.6 Vegetables (seed pulps and preparations) | 3 | 42.9 | 3 | 42.9 | 0 | 0.0 | 1 | 14.3 |
| 5.1.3 and 5.1.4 Cocoa and chocolate products | 0 | 0.0 | 0 | 0.0 | 0 | 0.0 | 94 | 100.0 |
| 5.2.1 Hard candy | 0 | 0.0 | 5 | 9.1 | 0 | 0.0 | 50 | 90.9 |
| 5.2.2 and 5.2.3 Soft candy, nougats, and marzipans | 0 | 0.0 | 0 | 0.0 | 0 | 0.0 | 46 | 100.0 |
| 5.3 Chewing gum | 5 | 26.3 | 0 | 0.0 | 0 | 0.0 | 14 | 73.7 |
| 5.4 Decorations (e.g., for fine bakery wares), toppings (non-fruits), and sweet sauces | 0 | 0.0 | 0 | 0.0 | 1 | 25.0 | 3 | 75.0 |
| 6.3 Ready-to-eat cereals, breakfast cereals, including rolled oats (sweet) | 1 | 1.7 | 18 | 30.5 | 10 | 16.9 | 30 | 50.8 |
| 6.3 Ready-to-eat cereals, breakfast cereals, including rolled oats (salty) | 2 | 12.5 | 10 | 62.5 | 3 | 18.8 | 1 | 6.3 |
| 6.4.3 Pasta, noodles, and similar products (e.g., rice paper, rice vermicelli, soybean pasta, and noodles) | 0 | 0.0 | 0 | 0.0 | 3 | 8.1 | 34 | 91.9 |
| 6.7 Pre-cooked or processed cereals/grains/legume products | 0 | 0.0 | 12 | 41.4 | 14 | 48.3 | 3 | 10.3 |
| 6.8.1 Soybean-based beverages | 1 | 10.0 | 9 | 90.0 | 0 | 0.0 | 0 | 0.0 |
| 7.1.2 & 7.1.4 Bread and ordinary bakery wares and mixes | 0 | 0.0 | 0 | 0.0 | 0 | 0.0 | 22 | 100.0 |
| 7.2.1 Fine bakery wares (sweet, salty, savory) and mixes (biscuits, cookies) | 0 | 0.0 | 0 | 0.0 | 0 | 0.0 | 73 | 100.0 |
| 7.2.1 Fine bakery wares (sweet, salty, savory) and mixes (cream sandwich biscuits) | 0 | 0.0 | 0 | 0.0 | 0 | 0.0 | 55 | 100.0 |
| 7.2.1 Fine bakery wares (sweet, salty, savory) and mixes (cakes) | 0 | 0.0 | 0 | 0.0 | 0 | 0.0 | 20 | 100.0 |
| 7.2.2 Other fine bakery products | 0 | 0.0 | 0 | 0.0 | 0 | 0.0 | 21 | 100.0 |
| 7.2.3 Mixes for fine bakery wares | 0 | 0.0 | 0 | 0.0 | 0 | 0.0 | 5 | 100.0 |
| 12.5.2 Mixes for soups and broths | 14 | 82.4 | 3 | 17.6 | 0 | 0.0 | 0 | 0.0 |
| 12.6.2 & 12.6.3 Non-emulsified sauces and mixes for sauces and gravies | 3 | 21.4 | 5 | 35.7 | 1 | 7.1 | 5 | 35.7 |
| 14.1.2 Fruit and vegetable juices | 2 | 9.5 | 17 | 81.0 | 2 | 9.5 | 0 | 0.0 |
| 14.1.4.1 Carbonated water-based flavoured drinks | 8 | 28.6 | 0 | 0.0 | 20 | 71.4 | 0 | 0.0 |
| 14.1.4.2 Non-carbonated water-based flavoured drinks | 1 | 0.8 | 6 | 5.1 | 109 | 92.4 | 2 | 1.7 |
| 14.1.4.3 Concentrates (liquid or solid) for water-based flavoured drinks | 0 | 0.0 | 2 | 9.1 | 20 | 90.9 | 0 | 0.0 |
| 14.1.5 Coffee, coffee substitutes, tea, herbal infusions | 2 | 12.5 | 14 | 87.5 | 0 | 0.0 | 0 | 0.0 |
| 15.1 Snacks and savories—potato, cereal, flour, or starch-based (from roots and tubers, pulses and legumes) foods | 0 | 0.0 | 1 | 0.6 | 1 | 0.6 | 177 | 98.9 |
| 15.2 Processed nuts, including coated nuts and nut mixtures | 0 | 0.0 | 4 | 44.4 | 5 | 55.6 | 0 | 0.0 |
| 16 Prepared Foods | 0 | 0.0 | 1 | 3.8 | 1 | 3.8 | 24 | 92.3 |
Publisher’s Note: MDPI stays neutral with regard to jurisdictional claims in published maps and institutional affiliations. |
© 2021 by the authors. Licensee MDPI, Basel, Switzerland. This article is an open access article distributed under the terms and conditions of the Creative Commons Attribution (CC BY) license (https://creativecommons.org/licenses/by/4.0/).
Share and Cite
Pandav, C.; Smith Taillie, L.; Miles, D.R.; Hollingsworth, B.A.; Popkin, B.M. The WHO South-East Asia Region Nutrient Profile Model Is Quite Appropriate for India: An Exploration of 31,516 Food Products. Nutrients 2021, 13, 2799. https://doi.org/10.3390/nu13082799
Pandav C, Smith Taillie L, Miles DR, Hollingsworth BA, Popkin BM. The WHO South-East Asia Region Nutrient Profile Model Is Quite Appropriate for India: An Exploration of 31,516 Food Products. Nutrients. 2021; 13(8):2799. https://doi.org/10.3390/nu13082799
Chicago/Turabian StylePandav, Chandra, Lindsey Smith Taillie, Donna R. Miles, Bridget A. Hollingsworth, and Barry M. Popkin. 2021. "The WHO South-East Asia Region Nutrient Profile Model Is Quite Appropriate for India: An Exploration of 31,516 Food Products" Nutrients 13, no. 8: 2799. https://doi.org/10.3390/nu13082799
APA StylePandav, C., Smith Taillie, L., Miles, D. R., Hollingsworth, B. A., & Popkin, B. M. (2021). The WHO South-East Asia Region Nutrient Profile Model Is Quite Appropriate for India: An Exploration of 31,516 Food Products. Nutrients, 13(8), 2799. https://doi.org/10.3390/nu13082799