
Vitamin D Status among First-Generation Immigrants from Different Ethnic Groups and Origins: An Observational Study Using the Canadian Health Measures Survey


 and
and
Abstract
:1. Introduction
2. Materials and Methods
2.1. Study Design and Participants
2.2. Measures
2.3. Statistical Analyses
3. Results
3.1. Study Description and Participants Characteristics
3.2. S-25(OH)D Concentration and VitD Status by Sociodemographic, Lifestyle, and Immigration Features
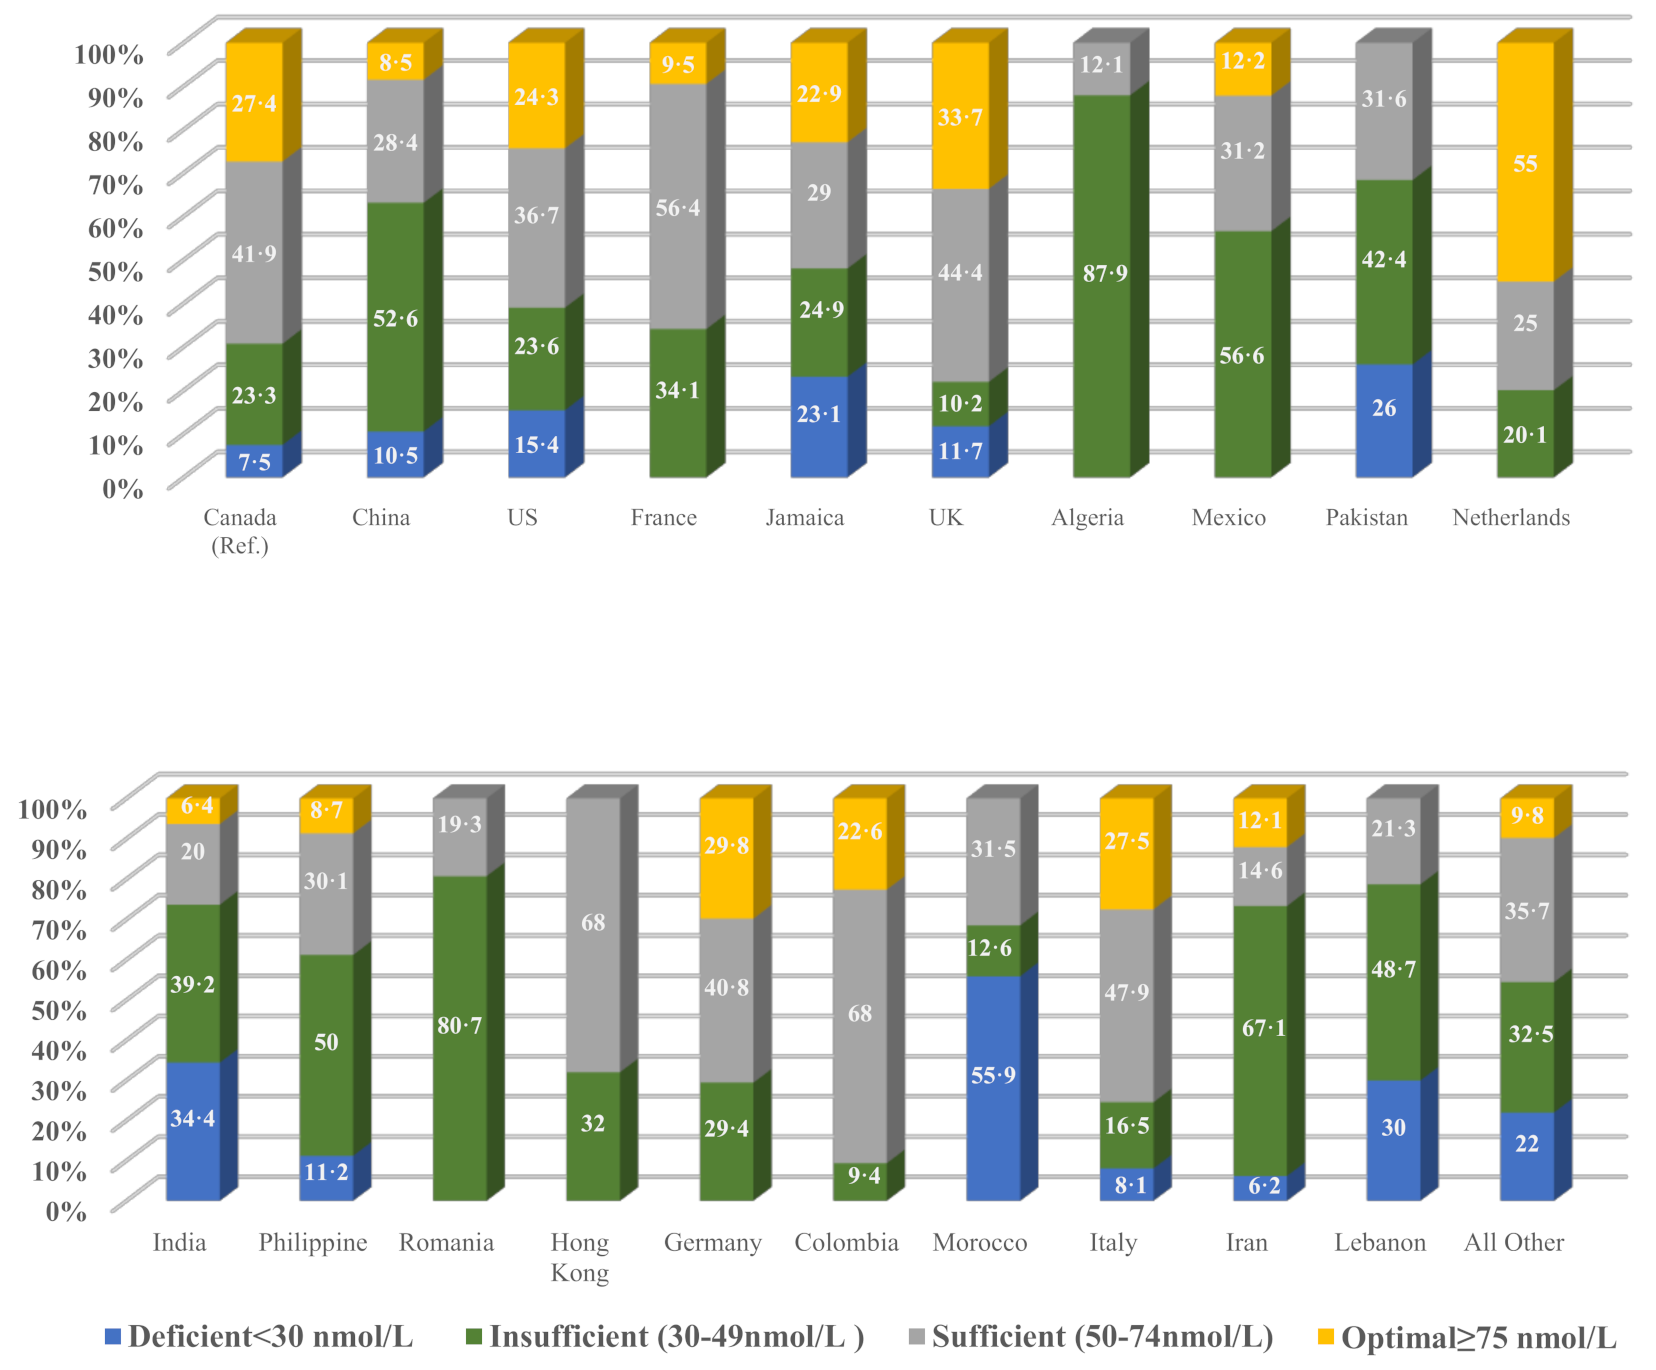
3.3. S-25(OH)D Concentration and VitD Status by Participants’ Ethnicity and Country of Origin
3.4. S-25(OH)D Concentration and VitD Status by Immigration Status and Season
3.5. Results of Multivariate Analysis
4. Discussion
5. Conclusions
Author Contributions
Funding
Institutional Review Board Statement
Informed Consent Statement
Data Availability Statement
Acknowledgments
Conflicts of Interest
Appendix A

| Variable | Description |
|---|---|
| Dependent variable | We used the contentious variable serum 25(OH)D (mmol/L). We categorized vitD status using the following cut-offs for S-25(OH)D: (<30 (nmol/L); (<50 (nmol/L); (<75 (nmol/L); and (≥75 (nmol/L). First, <30 nmol/L is used to identify deficient people. Second, (<50 nmol/L) is a cut-off for the insufficient 25(OH) D, which includes the deficient and insufficient people (it is an accumulating value and not range for the insufficient people). Third, (<75 nmol/L) is a cut-off and accumulating value for deficient, insufficient, and sufficient. Fourth (≥75 (nmol/L), it is the “no added value” or the “optimal” as defined by IOM or other experts [11,12,13]. Moreover, we used ranges of S-25(OH)D for the above mentioned cut-offs (<30 nmol/L; 30–49 nmol/L; 50–74 nmol/L and ≥75 nmol/L) for sub-groups of participants. |
| Independent variables | |
| Immigration status | Landed immigrant (yes, no). |
| Age at time of immigration | Age at immigration was categorized as <18 years or ≥18 years. |
| Time since immigration | We used the continuous variable “length of time since first came to live in Canada” to categorize time since imigration at two cutoff points (≤5 years and >5 years; ≤10 years and >10 years). We used these points as indications of recent immigrants and long-term immigrants. |
| Sex | Male/female. |
| Age | Contentious and categorical variables. |
| Education | Education was classified as ≤secondary school or >secondary school. |
| Household income | Household income was derived and imputed by Statistics Canada. The contentious variable and categorical variables (<50,000, 50,000–100,000, and >100,000) were used as appropriate. |
| Body mass index | Calculated as weight divided by height squared (kg/m2). We used body mass index norms for adults (≥18 years) based on national standards for weight classification [30]. For children (3–17 years), body mass index was classified according to World Health Organization percentiles [31]. |
| Smoking | We categorized smoking status into two groups (former/non-smoker vs. current smoker). |
| Alcohol | We categorized alcohol consumption into two groups (former/non-drinker vs. current drinker). |
| Vitamin D-containing supplements/medications | All prescription medications, over-the-counter, and herbal remedies taken in the past month (including vitD supplements and medications) were recorded in the CHMS data. The Anatomical Therapeutic Chemicals (ATCs) is a system that classifies products according to the organ and their chemical, pharmacological, and therapeutic properties. The vitD -related ATC codes were selected (A11CC01–05). These ATC codes represent ergocalciferol (vitD 2), dihydrotachysterol (synthetic vitD analog), alfacalcidol (analog of vitD), calcitriol, and cholecalciferol (vitD 3). Users of any of these were recorded as “yes,” non-users as “no,” and not respondents as “missing.” |
| Dietary intake | The CHMS collected dietary intake of different types of each item (red meat, liver, fish, egg, milk, cheese, yogurt, margarine) based on the previous month’s consumption. Statistics Canada prepared derived variables for each item to describe the number of times that item had been consumed/year. These derived variables were used to calculate consumption per week or day as needed. Different types of each item were merged into a single category. For example, all kinds of milk (plain, flavored, omega-3) were merged as “all milk.” The same procedure was used for “all meats” (e.g., red meat, liver, sausage, hotdog), as well as “all cheese,” “all yogurt,” “all eggs,” and “all margarine.” Another category was used for all dairy products, called “all diary.” We also used fish consumption in the past two months as (yes vs. no). Values of ≤1 time/week vs. >1 time/week were used for all categories, except all milk and all dairy, which used ≤7 times/week vs. >7 times/week. |
| Calcium and phosphorus | Contentious variables (mmol/L). |
| Pregnancy | Pregnancy was classified as Yes or No. |
| Ethnicity | Broadly, ethnicity was classified into two main groupings as white or non-white. Statistics Canada categorized non-white into the 12 largest ethnic groups (Aboriginal, South Asian, Chinese, Black, Filipino, Latin American, Arab, South East Asian, West Asian, Korean, Japanese, Multiple ethnicities), and another category for all other ethnicities. |
| Season of blood sampling | The season variable was created based on the derived variable of “month of blood sampling.” We categorized the season as winter (December–February), spring (March–May), summer (June–August), and fall (September–November). |
| Regions of birth | We used five regions: Canada and North America; South and Central America and the Caribbean; Europe; Africa; and Asia. |
| Countries of birth | We used the geographic classifications of Statistics Canada to identify the country of birth for all CHMS participants (153 countries) [58]. We ranked and selected the top 20 countries based on the number of participants (≥30 participants from each). These countries were Canada, China, the US, France, Jamaica, the UK, Algeria, Mexico, Pakistan, the Netherlands, India, the Philippines, Romania, Hong Kong, Germany, Colombia, Morocco, Italy, Iran, and Lebanon. We combined all other countries in one category, “Other,” and combined the 153 countries (excluding Canada) in another class to represent all foreign-born immigrants. |
| Sun exposure (10 am to 4 pm) | Sun exposure was classified as <30 min\day or ≥30 min\day. |
| Sunscreen application | Sunscreen application was classified as yes or no. |
| Clothing type | The clothing type was based on coverage and classified as yes or no. Yes indicated typically covered (face, ears, neck or arms and legs). |
| Physical activity | Physical activity for adults (≥18 years) was calculated based on the Canadian Physical Activity Guidelines (CPAG). The CPAG recommendation for adults is to accumulate at least 150 min of moderate-to-vigorous intensity aerobic physical activity per week, in bouts of ≥10 min. The CPAG recommendation for children (5–17 years) is to accumulate at least 60 min of moderate-to-vigorous intensity physical activity daily for at least three days per week [32]. |
| Traveled to a sunny/warmer place (in the past two months) | Travelling to a sunny/warmer place in the past two months was classified as yes or no. |
| Skin pigmentation (melanin levels) | Melanin is the component that gives skin its natural color. Melanin levels were measured from the back of the hand three times; a fourth measurement was required if the difference between the first three melanin values deviated by more than 10 units. The final average calculated by Statistics Canada indicates the absolute index values of melanin, where the higher the value, the more melanin present in the epidermal. The device used for measurement was the DSM II ColorMeter (Cortex Technology, Hadsund, Denmark). |
Appendix A.1. Combining Cycles 3 and 4
Appendix A.2. Population, Comparators, Measures, and Outcome
Appendix A.3. Variables of Interest
Appendix B
| Cycle 3 (49.52%) % | Cycle 4 (50.48%) % | Total (100%) % | ||
|---|---|---|---|---|
| Immigration status | Immigrant | 24.5 | 19.38 | 21.90 |
| Ethnic group | White | 75.10 | 78.87 | 76.98 |
| Sex | Female | 50.00 | 50.10 | 50.08 |
| Age (years) | <5 | 2.47 | 2.14 | 2.30 |
| 5–11 | 7.92 | 8.17 | 8.04 | |
| 12–17 | 7.58 | 7.21 | 7.39 | |
| 18–64 | 70.70 | 70.29 | 70.54 | |
| >64 | 11.20 | 12.20 | 11.72 | |
| Household income (CAD) | <50,000 | 38.10 | 32.91 | 35.45 |
| 50,000–100,000 | 36.00 | 37.26 | 36.61 | |
| >100,000 | 26.00 | 29.84 | 27.93 | |
| S-25(OH)D status (nmol/l) | <50 | 65.04 | 62.27 | 63.64 |
| Weighted Mean | Mean (SE) | Mean (SE) | Mean (SE) | |
| Age (years) | 39.08 (0.15) | 39.35 (0.09) | 39.23 (0.085) | |
| S-25(OH)D (nmol/L) | 61.29 (2.78) | 59.16 (1.99) | 60.28 (1.69) |
| Non-Immigrants (78.9%), % | Immigrants (21.9%), % | All Participants (100%), % | p-Value | ||
|---|---|---|---|---|---|
| All meats (red meat, liver, hotdog, and sausage) | >1 time/week | 90.47 | 78.72 | 87.89 | <0.001 |
| All eggs (yolk/omega-3) | >1 time/week | 59.68 | 66.95 | 61.26 | 0.067 |
| All milk (plain, flavored, and omega-3) | >7 times/week | 54.63 | 48.38 | 53.27 | 0.027 |
| All cheese (cottage and other) | >1 time/week | 86.70 | 63.26 | 81.57 | <0.001 |
| All yogurt | >1 time/week | 72.19 | 70.15 | 71.75 | 0.577 |
| All dairy products (milk, yogurt, and cheese) | >7 times/week | 83.38 | 75.38 | 81.64 | <0.001 |
| All margarine (plain and omega-3) | >1 time/week | 84.11 | 70.95 | 81.90 | 0.007 |
| Fortified juice with calcium/vitamin D | >1 time/week | 7.01 | 6.12 | 6.81 | 0.452 |
| Fish consumption/past 2 months | Yes (No †) | 25.18 | 17.09 | 23.43 | 0.046 |
| S-25(OH)D (nmol/L) | S-25(OH)D Status | |||||||
|---|---|---|---|---|---|---|---|---|
| Mean (SE) | (95% CI) | p-Value | <30 (nmol/L (10.3%),% | <50 (nmol/L (63.64%),% | <75 (nmol/L (76.1%),% | ≥75 (nmol/L (23.9%),% | ||
| Household income (CAD) | <50,000 † | 56.18 (1.90) | - | 13.95 | 45.10 | 79.43 | 20.57 | |
| 50,000–100,000 | 61.44 (1.81) | (−7.73, −2.79) | <0.001 | 9.67 | 33.14 | 76.02 | 23.98 | |
| >100,000 | 63.66 (1.79) | (−9.97, −4.98) | <0.001 | 6.53 *** | 29.64 *** | 72.09 | 27.91 ** | |
| Education | ≤Secondary school † | 59.41 (1.64) | 9.57 | 36.81 | 77.58 | 22.42 | ||
| >Secondary school | 61.00 (1.86) | (−3.59, 0.41) | 0.113 | 10.87 | 35.83 | 74.97 | 25.03 | |
| Pregnancy | No† | 60.35 (2.15) | - | 11.72 | 36.88 | 75.29 | 24.71 | |
| Yes | 51.22 (7.40) | (−6.69, 24.94) | 0.244 | 2.11 | 45.70 | 93.21 | 6.79 * | |
| Smoking habits | Former/non-smoker † | 61.59 (1.66) | - | 9.98 | 34.12 | 73.82 | 26.18 | |
| Current smoker | 53.09 (2.12) | (5.74, 11.24) | <0.001 | 14.88 * | 50.71 *** | 85.02 | 14.98 *** | |
| Alcoholic beverages | Former/non-drinker † | 54.25 (2.17) | - | 15.72 | 38.15 | 81.44 | 18.56 | |
| Current drinker | 61.33 (1.67) | (−10.49, 3.66) | <0.001 | 9.73 ** | 34.70 *** | 74.70 | 25.30 ** | |
| Meet the physical activity recommendations | No † | 58.79 (1.54) | - | 11.32 | 39.34 | 77.91 | 22.09 | |
| Yes | 63.80 (2.34) | (−8.26, 1.76) | 0.004 | 8.01 | 29.54 *** | 72.86 | 27.14 * | |
| Clothing | Uncovered † | 62.07 (1.69) | - | 8.23 | 31.13 | 74.85 | 25.15 | |
| Typically covered | 57.91 (2.00) | (1.46, 6.85) | 0.004 | 12.86 ** | 42.58 *** | 77.86 | 22.14 | |
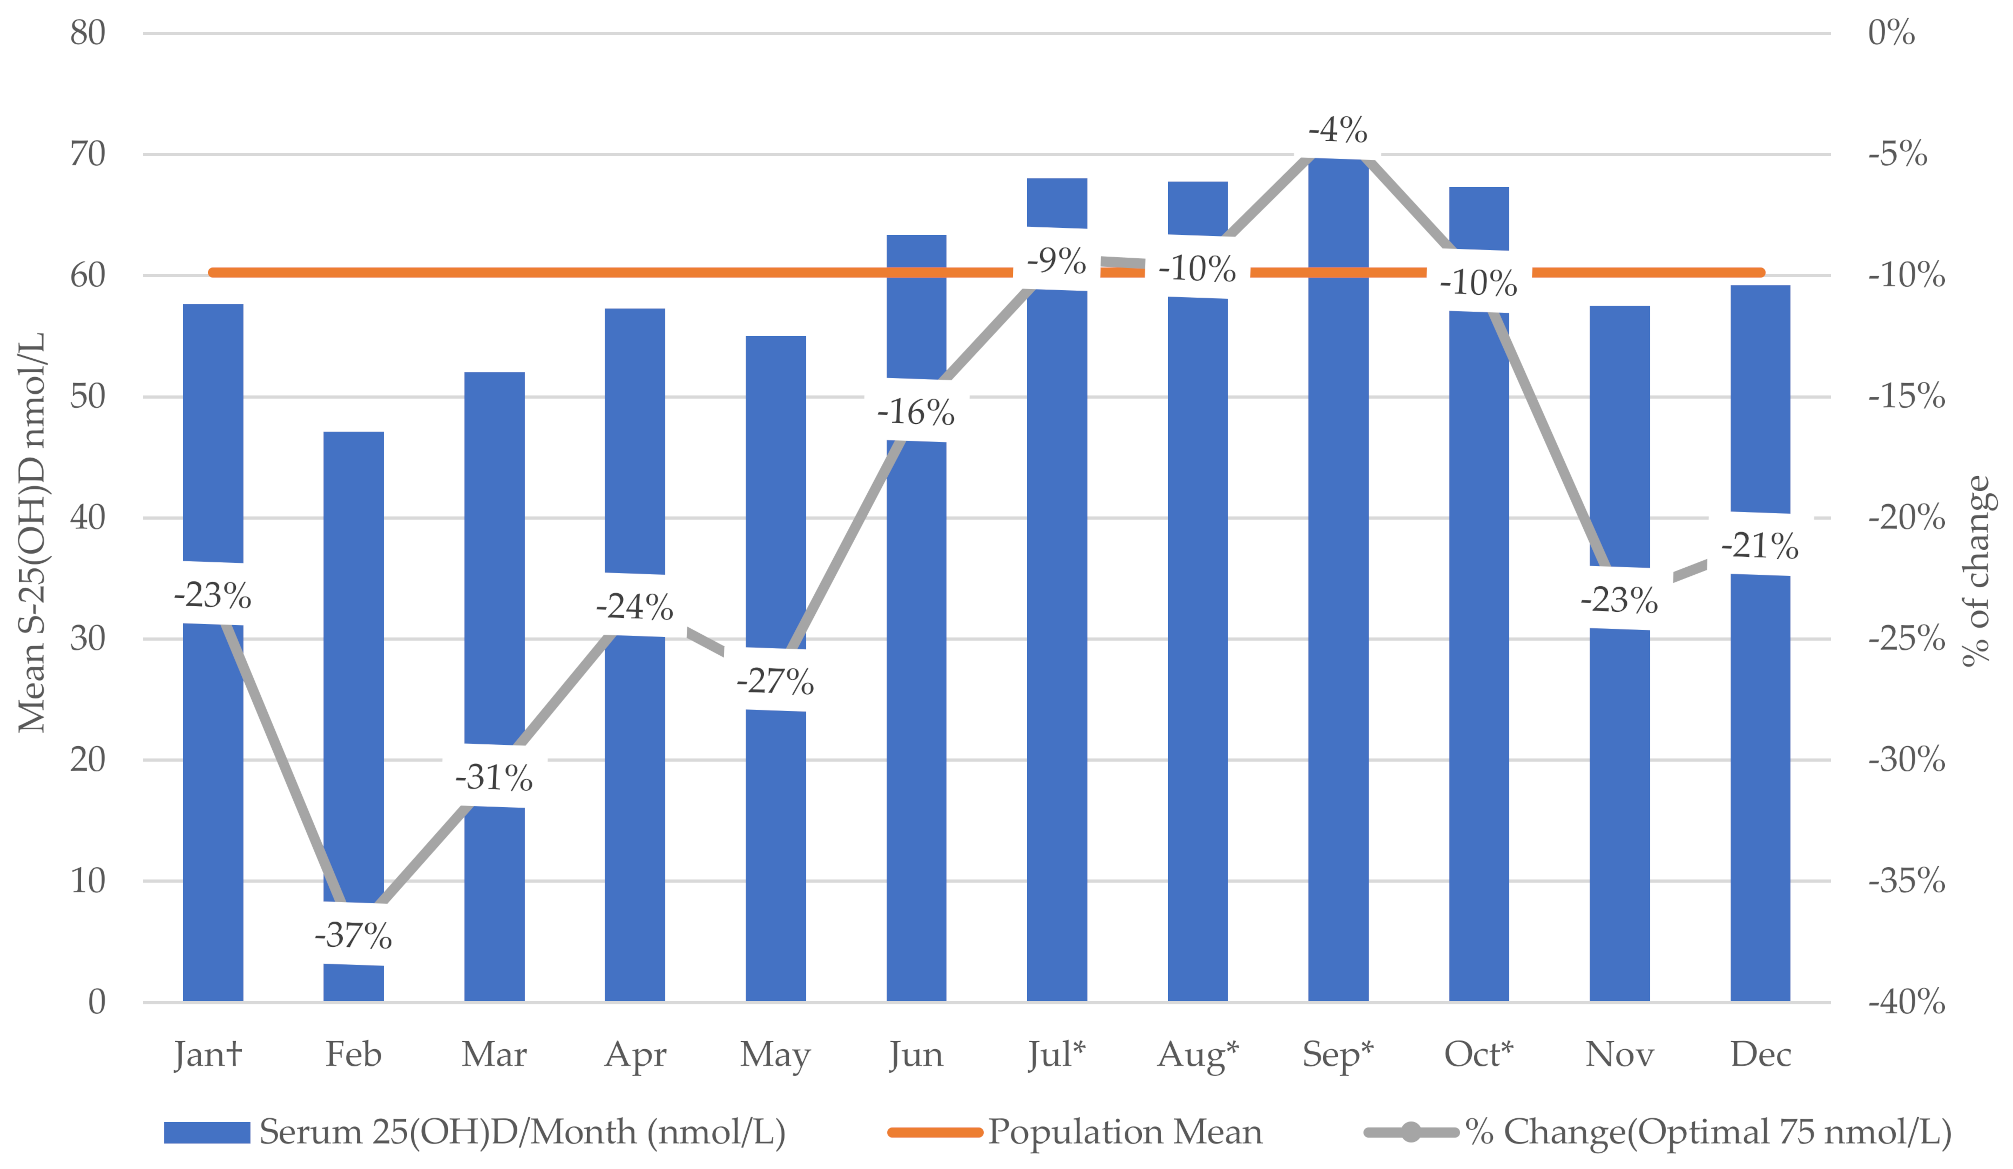
| S-25(OH)D (nmol/L) | p-Value | |||
|---|---|---|---|---|
| Mean (SE) | (95% CI) | |||
| Season | Winter † | 53.80 (2.47) | - | |
| Spring | 54.63 (1.41) | (−7.16, 5.49) | 0.786 | |
| Summer | 66.13 (2.38) | (−18.50, −6.16) | <0.001 | |
| Fall | 66.00 (3.63) | (−20.59, −3.83) | 0.006 | |
| Month | January † | 57.67 (9.25) | - | |
| February | 47.13 (6.17) | (−25.73, 4.65) | 0.164 | |
| March | 52.02 (9.57) | (−28.63, 18.86) | 0.674 | |
| April | 57.31 (1.64) | (−23.46, 3.10) | 0.126 | |
| May | 55.00 (2.17) | (−21.38, 5.63) | 0.240 | |
| June | 63.34 (8.61) | (−38.14, 5.73) | 0.140 | |
| July | 68.02 (5.41) | (−37.88, −3.89) | 0.018 | |
| August | 67.78 (7.31) | (−40.77, −0.53) | 0.045 | |
| September | 72.08 (10.24) | (−49.86, −0.04) | 0.050 | |
| October | 67.34 (5.39) | (−37.99, −2.42) | 0.028 | |
| November | 57.52 (2.80) | (−24.80, −4.02) | 0.149 | |
| December | 59.20 (13.18) | (−42.89, 18.75) | 0.425 | |
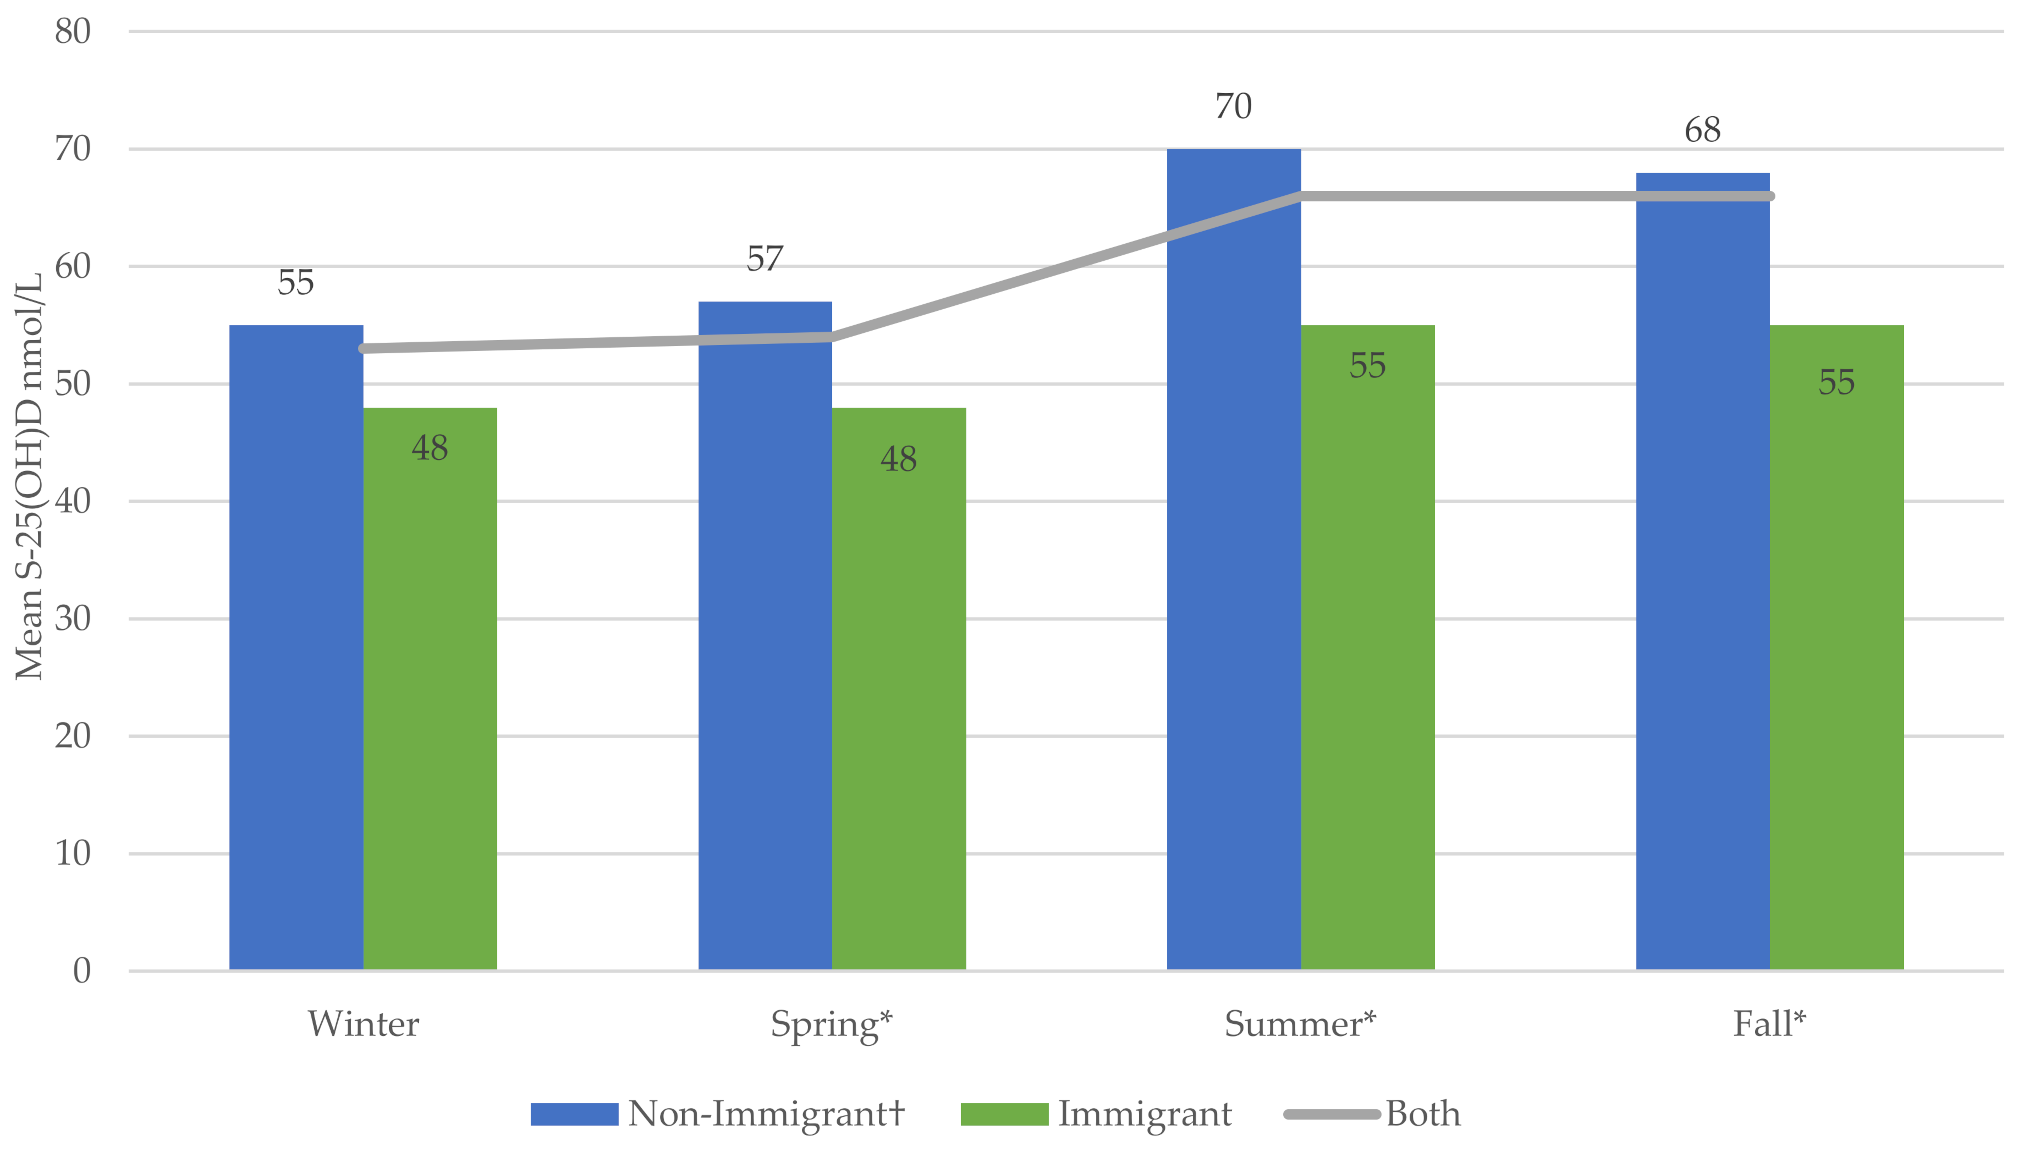
| Non-Immigrant † | Immigrant | ||||
|---|---|---|---|---|---|
| Mean (SE) | Mean (SE) | (95% CI) | p-Value | ||
| Season | Winter | 55.36 (2.33) | 47.79 (4.55) | (−0.67, 15.82) | 0.070 |
| Spring | 56.94 (1.62) | 47.71 (3.07) | (2.27, 16.19) | 0.012 | |
| Summer | 70.03 (2.23) | 55.21 (1.76) | (9.28, 20.36) | <0.001 | |
| Fall | 68.11 (3.55) | 54.87 (3.95) | (8.00, 18.47) | <0.001 | |

References
- Charoenngam, N.; Shirvani, A.; Holick, M.F. Vitamin D for skeletal and non-skeletal health: What we should know. J. Clin. Orthop. Trauma 2019, 10, 1082–1093. [Google Scholar] [CrossRef]
- Shin, S.Y.; Kwon, M.J.; Song, J.; Park, H.; Woo, H.Y. Measurement of Serum Total Vitamin D (25-OH) Using Automated Immunoassay in Comparision With Liquid Chromatography Tandem-Mass Spectrometry. J. Clin. Lab. Anal. 2013, 27, 284–289. [Google Scholar] [CrossRef]
- Atef, S.H. Vitamin D assays in clinical laboratory: Past, present and future challenges. J. Steroid Biochem. Mol. Biol. 2018, 175, 136–137. [Google Scholar] [CrossRef] [PubMed]
- Martens Immunoassay for Free Vitamin D. 2018. Available online: https://patentimages.storage.googleapis.com/57/7e/64/9c4548d4ed8ce1/US9897615.pdf (accessed on 24 February 2021).
- Nowson, C.A.; McGrath, J.J.; Ebeling, P.R.; Haikerwal, A.; Daly, R.M.; Sanders, K.M.; Seibel, M.J.; Mason, R.S. Vitamin D and health in adults in Australia and New Zealand: A position statement. Med. J. Aust. 2012, 196, 686–687. [Google Scholar] [CrossRef]
- Heaney, R.P.; Recker, R.R.; Grote, J.; Horst, R.L.; Armas, L.A. Vitamin D3 is more potent than vitamin D2 in humans. J. Clin. Endocrinol. Metab. 2011, 96, E447–E452. [Google Scholar] [CrossRef] [PubMed] [Green Version]
- De Boer, I.H.; Kestenbaum, B.; Shoben, A.B.; Michos, E.D.; Sarnak, M.J.; Siscovick, D.S. 25-hydroxyvitamin D levels inversely associate with risk for developing coronary artery calcification. J. Am. Soc. Nephrol. 2009, 20, 1805–1812. [Google Scholar] [CrossRef] [Green Version]
- Spiro, A.; Buttriss, J. Vitamin D: An overview of vitamin D status and intake in E urope. Nutr. Bull. 2014, 39, 322–350. [Google Scholar] [CrossRef] [Green Version]
- Zmijewski, M.A. Vitamin D and Human Health. Int. J. Mol. Sci. 2019, 20, 145. [Google Scholar] [CrossRef] [PubMed] [Green Version]
- Mithal, A.; Wahl, D.A.; Bonjour, J.-P.; Burckhardt, P.; Dawson-Hughes, B.; Eisman, J.A.; Fuleihan, G.E.-H.; Josse, R.G.; Lips, P.; Morales-Torres, J. Global vitamin D status and determinants of hypovitaminosis D. Osteoporos. Int. 2009, 20, 1807–1820. [Google Scholar] [CrossRef] [Green Version]
- Ross, A.; Taylor, C.; Yaktine, A.; Del Valle, H. Dietary Reference Intakes: Calcium and Vitamin D. Committee to Review Dietary Reference Intakes for Vitamin D and Calcium Food and Nutrition Board; National Academy of Sciences: Washington, DC, USA, 2011. [Google Scholar]
- Vieth, R. Why the minimum desirable serum 25-hydroxyvitamin D level should be 75 nmol/L (30 ng/mL). Best Pract. Res. Clin. Endocrinol. Metab. 2011, 25, 681–691. [Google Scholar] [CrossRef]
- Dawson-Hughes, B. Vitamin D Deficiency in Adults: Definition, Clinical Manifestations, and Treatment; UpToDate: Waltham, MA, USA, 2014. [Google Scholar]
- Pham, T. Vitamin D Status of Immigrant and Ethnic Minority Children Ages 2 to 5 y in Montréal. Master’s Thesis, McGill University, Montreal, QC, Canada, 2012. [Google Scholar]
- Janz, T.; Pearson, C. Vitamin D Blood Levels of Canadians; Statistics Canada Ottawa (Canada): Ottawa, ON, Canada, 2013. [Google Scholar]
- Yousef, S.; Elliott, J.; Manuel, D.; Colman, I.; Papadimitropoulos, M.; Hossain, A.; Leclair, N.; Wells, G.A. Study protocol: Worldwide comparison of vitamin D status of immigrants from different ethnic origins and native-born populations—A systematic review and meta-analysis. Syst. Rev. 2019, 8, 211. [Google Scholar] [CrossRef] [Green Version]
- Cashman, K.D.; Dowling, K.G.; Škrabáková, Z.; Gonzalez-Gross, M.; Valtueña, J.; De Henauw, S.; Moreno, L.; Damsgaard, C.T.; Michaelsen, K.F.; Mølgaard, C. Vitamin D deficiency in Europe: Pandemic? Am. J. Clin. Nutr. 2016, 103, 1033–1044. [Google Scholar] [CrossRef] [Green Version]
- Martin, C.A.; Gowda, U.; Renzaho, A.M. The prevalence of vitamin D deficiency among dark-skinned populations according to their stage of migration and region of birth: A meta-analysis. Nutrition 2016, 32, 21–32. [Google Scholar] [CrossRef]
- Eggemoen, Å.R.; Knutsen, K.V.; Dalen, I.; Jenum, A.K. Vitamin D status in recently arrived immigrants from Africa and Asia: A cross-sectional study from Norway of children, adolescents and adults. BMJ Open 2013, 3, e003293. [Google Scholar] [CrossRef] [PubMed] [Green Version]
- Chui, T.; Statistics Canada. Immigration and Ethnocultural Diversity in Canada: National Household Survey; Statistics Canada: Ottawa, ON, Canada, 2011. [Google Scholar]
- Salant, T.; Lauderdale, D.S. Measuring culture: A critical review of acculturation and health in Asian immigrant populations. Soc. Sci. Med. 2003, 57, 71–90. [Google Scholar] [CrossRef]
- Zhu, L. Depression risks and correlates among different generations of Chinese Americans: The effects of relationships with friends and relatives. Soc. Sci. 2017, 6, 56. [Google Scholar] [CrossRef] [Green Version]
- Stephens, W.; Klimiuk, P.; Warrington, S.; Taylor, J.; Berry, J.; Mawer, E. Observations on the natural history of vitamin D deficiency amongst Asian immigrants. QJM Int. J. Med. 1982, 51, 171–188. [Google Scholar]
- Stern, P.J. Generational differences. J. Hand Surg. 2002, 27, 187–194. [Google Scholar] [CrossRef]
- Von Elm, E.; Altman, D.G.; Egger, M.; Pocock, S.J.; Gøtzsche, P.C.; Vandenbroucke, J.P. The Strengthening the Reporting of Observational Studies in Epidemiology (STROBE) statement: Guidelines for reporting observational studies. Bull. World Health Organ. 2007, 85, 867–872. [Google Scholar] [CrossRef] [PubMed]
- Day, B.; Langlois, R.; Tremblay, M.; Knoppers, B.-M. Canadian Health Measures Survey: Ethical, legal and social issues. Health Rep. 2007, 18, 37–51. [Google Scholar] [PubMed]
- Ng, E. Canadian Health Measures Survey: A tool for immigrant health research? Health Rep. 2015, 26, 3. [Google Scholar] [PubMed]
- Statistics Canada. Canadian Health Measures Survey, Cycle 4, 2014–2015—Privacy Impact Assessment Summary. Available online: https://www.statcan.gc.ca/eng/about/pia/chmsc4 (accessed on 14 February 2021).
- Statistics Canada. 2012–2013 Canadian Health Measures Survey, Cycle 3—Privacy Impact Assessment. Available online: https://www.statcan.gc.ca/eng/about/pia/chmsc3 (accessed on 14 February 2021).
- Health Canada. Canadian Guidelines for Body Weight Classification in Adults—Quick Reference Tool for Professionals; Health Canada: Ottawa, ON, Canada, 2003. [Google Scholar]
- Onis, M.d.; Onyango, A.W.; Borghi, E.; Siyam, A.; Nishida, C.; Siekmann, J. Development of a WHO growth reference for school-aged children and adolescents. Bull. World Health Organ. 2007, 85, 660–667. [Google Scholar] [CrossRef] [PubMed]
- Canadian Physical Activity. Sedentary Behaviour Guidelines; Canadian Society for Exercise Physiology: Ottawa, ON, Canada, 2012. [Google Scholar]
- Statistics Canada. Canadian Health Measures Survey (CHMS)Data User Guide: Cycle 3. 2015. Available online: https://usermanual.wiki/Pdf/CHMSUserGuideCycle3E.484319040/help (accessed on 24 February 2021).
- Statistics Canada. Canadian Health Measures Survey (CHMS)—Cycle 4. Available online: https://www23.statcan.gc.ca/imdb/p2SV.pl?Function=getSurvey&Id=148760 (accessed on 25 January 2021).
- Hilger, J.; Friedel, A.; Herr, R.; Rausch, T.; Roos, F.; Wahl, D.A.; Pierroz, D.D.; Weber, P.; Hoffmann, K. A systematic review of vitamin D status in populations worldwide. Br. J. Nutr. 2014, 111, 23–45. [Google Scholar] [CrossRef] [Green Version]
- Pludowski, P.; Grant, W.B.; Bhattoa, H.P.; Bayer, M.; Povoroznyuk, V.; Rudenka, E.; Ramanau, H.; Varbiro, S.; Rudenka, A.; Karczmarewicz, E. Vitamin D status in central Europe. Int. J. Endocrinol. 2014, 2014. [Google Scholar] [CrossRef] [PubMed]
- Lips, P. Vitamin D status and nutrition in Europe and Asia. J. Steroid Biochem. Mol. Biol. 2007, 103, 620–625. [Google Scholar] [CrossRef]
- Alshahrani, A.A. Vitamin D Deficiency and Possible Risk Factors among Middle Eastern University Students in London, Ontario, Canada. Master’s Thesis, The University of Western Ontario, London, ON, Canada, 2014. [Google Scholar]
- McCormack, D.; Mai, X.; Chen, Y. Determinants of vitamin D supplement use in Canadians. Public Health Nutr. 2017, 20, 1768–1774. [Google Scholar] [CrossRef] [Green Version]
- Knoss, R.; Halsey, L.G.; Reeves, S. Ethnic dress, vitamin D intake, and calcaneal bone health in young women in the United Kingdom. J. Clin. Densitom. 2012, 15, 250–254. [Google Scholar] [CrossRef]
- Ojah, R.C.; Welch, J.M. Vitamin D and musculoskeletal status in Nova Scotian women who wear concealing clothing. Nutrients 2012, 4, 399–412. [Google Scholar] [CrossRef] [PubMed]
- Mark, S. Vitamin D Status and Recommendations to Improve Vitamin D Status in Canadian Youth. Master’s Thesis, McGill University, Montreal, QC, Canada, 2010. [Google Scholar]
- Naugler, C.; Zhang, J.; Henne, D.; Woods, P.; Hemmelgarn, B.R. Association of vitamin D status with socio-demographic factors in Calgary, Alberta: An ecological study using Census Canada data. BMC Public Health 2013, 13, 316. [Google Scholar] [CrossRef] [Green Version]
- Ghasemian, R.; Shamshirian, A.; Heydari, K.; Malekan, M.; Alizadeh-Navaei, R.; Ebrahimzadeh, M.A.; Jafarpour, H.; Shahmirzadi, A.R.; Khodabandeh, M.; Seyfari, B. The Role of Vitamin D in The Age of COVID-19: A Systematic Review and Meta-Analysis. MedRxiv 2020. [Google Scholar] [CrossRef]
- Munasinghe, L.L.; Yuan, Y.; Willows, N.D.; Faught, E.L.; Ekwaru, J.P.; Veugelers, P.J. Vitamin D deficiency and sufficiency among Canadian children residing at high latitude following the revision of the RDA of vitamin D intake in 2010. Br. J. Nutr. 2017, 117, 457–465. [Google Scholar] [CrossRef] [Green Version]
- Wang, L.; Manson, J.E.; Buring, J.E.; Lee, I.-M.; Sesso, H.D. Dietary intake of dairy products, calcium, and vitamin D and the risk of hypertension in middle-aged and older women. Hypertension 2008, 51, 1073–1079. [Google Scholar] [CrossRef]
- Thuesen, B.; Husemoen, L.; Fenger, M.; Jakobsen, J.; Schwarz, P.; Toft, U.; Ovesen, L.; Jørgensen, T.; Linneberg, A. Determinants of vitamin D status in a general population of Danish adults. Bone 2012, 50, 605–610. [Google Scholar] [CrossRef]
- Renzaho, A.M.; Halliday, J.A.; Nowson, C. Vitamin D, obesity, and obesity-related chronic disease among ethnic minorities: A systematic review. Nutrition 2011, 27, 868–879. [Google Scholar] [CrossRef] [PubMed]
- Neale, R.; Khan, S.; Lucas, R.; Waterhouse, M.; Whiteman, D.; Olsen, C. The effect of sunscreen on vitamin D: A review. Br. J. Dermatol. 2019, 181, 907–915. [Google Scholar] [CrossRef] [PubMed] [Green Version]
- Young, A.; Narbutt, J.; Harrison, G.; Lawrence, K.; Bell, M.; O’Connor, C.; Olsen, P.; Grys, K.; Baczynska, K.; Rogowski-Tylman, M. Optimal sunscreen use, during a sun holiday with a very high ultraviolet index, allows vitamin D synthesis without sunburn. Br. J. Dermatol. 2019, 181, 1052–1062. [Google Scholar] [CrossRef] [Green Version]
- Brooks, S.P.; Greene-Finestone, L.; Whiting, S.; Fioletov, V.E.; Laffey, P.; Petronella, N. An analysis of factors associated with 25-hydroxyvitamin D levels in white and non-white Canadians. J. AOAC Int. 2017, 100, 1345–1354. [Google Scholar] [CrossRef] [PubMed]
- Nimitphong, H.; Holick, M.F. Vitamin D status and sun exposure in Southeast Asia. Derm. Endocrinol. 2013, 5, 34–37. [Google Scholar] [CrossRef] [Green Version]
- Sanou, D.; O’Reilly, E.; Ngnie-Teta, I.; Batal, M.; Mondain, N.; Andrew, C.; Newbold, B.K.; Bourgeault, I.L. Acculturation and nutritional health of immigrants in Canada: A scoping review. J. Immigr. Minority Health 2014, 16, 24–34. [Google Scholar] [CrossRef] [Green Version]
- Carlberg, C. Nutrigenomics of vitamin D. Nutrients 2019, 11, 676. [Google Scholar] [CrossRef] [Green Version]
- Leandro, A.; Rocha, M.; Cardoso, C.; Bonecini-Almeida, M. Genetic polymorphisms in vitamin D receptor, vitamin D-binding protein, Toll-like receptor 2, nitric oxide synthase 2, and interferon-γ genes and its association with susceptibility to tuberculosis. Braz. J. Med Biol. Res. 2009, 42, 312–322. [Google Scholar] [CrossRef] [PubMed] [Green Version]
- Aucoin, M.; Weaver, R.; Thomas, R.; Jones, L. Vitamin D status of refugees arriving in Canada: Findings from the Calgary Refugee Health Program. Can. Fam. Physician 2013, 59, e188–e194. [Google Scholar] [PubMed]
- Baauw, A.; Kist-van Holthe, J.; Slattery, B.; Heymans, M.; Chinapaw, M.; van Goudoever, H. Health needs of refugee children identified on arrival in reception countries: A systematic review and meta-analysis. BMJ Paediatr. Open 2019, 3, e000516. [Google Scholar] [CrossRef] [PubMed]
- Statistics, C. Standard Classification of Countries and Areas of Interest (SCCAI). Available online: https://publications.gc.ca/site/eng/9.856211/publication.html (accessed on 24 February 2020).


| Non-Immigrants (78.9%), % | Immigrants (21.9%), % | All Participants (100%), % | p-Value | ||
|---|---|---|---|---|---|
| Sex | Female | 49.37 | 52.85 | 50.13 | 0.142 |
| Age (years) | <5 | 2.84 | 0.42 | 2.31 | <0.001 |
| 5–11 | 9.37 | 3.38 | 8.05 | ||
| 12–17 | 8.20 | 4.57 | 7.41 | ||
| 18–64 | 69.10 | 75.41 | 70.48 | ||
| >64 | 10.49 | 16.22 | 11.75 | ||
| Household income (CAD) | <50,000 | 33.15 | 43.93 | 35.51 | 0.008 |
| 50,000–100,000 | 37.07 | 34.65 | 36.54 | ||
| >100,000 | 29.79 | 21.43 | 27.95 | ||
| Education | >Secondary school | 47.26 | 64.63 | 51.07 | <0.001 |
| BMI (kg/m2) | Underweight | 2.19 | 2.34 | 2.22 | 0.023 |
| Normal weight | 41.40 | 41.75 | 41.48 | ||
| Overweight | 30.21 | 37.01 | 31.70 | ||
| Obese | 26.21 | 18.89 | 24.60 | ||
| Ethnic group | Non-white | 11.76 | 62.67 | 22.91 | <0.001 |
| VitD-supplement and/or analog use | Yes | 5.39 | 4.84 | 5.27 | 0.664 |
| Smoking status | Current smoker | 22.65 | 14.75 | 20.79 | 0.003 |
| Alcohol | Current drinker | 82.90 | 65.03 | 78.69 | <0.001 |
| Meet the physical activity recommendations | Yes | 35.41 | 30.17 | 34.21 | 0.127 |
| Sun exposure (10 am to 4 pm) | ≥30 min/day | 91.21 | 78.59 | 88.46 | <0.001 |
| Sunscreen use | Yes | 73.94 | 58.57 | 70.64 | <0.001 |
| Clothing | Typically covered | 34.66 | 52.54 | 38.51 | <0.001 |
| Traveled to sunny/warm climate | Yes | 10.56 | 16.48 | 11.85 | 0.018 |
| Weighted means | Mean (SE) | Mean (SE) | (95% CI) | p-value | |
| Age (years) | 37.51 (0.26) | 45.17 (0.58) | (−9.05, −6.26) | <0.001 | |
| Income (CAD) | 91,985 (3831) | 76,317 (4004) | (8087, 23,248) | <0.001 | |
| Calcium (mmol/L) | 2.42 (0.00) | 2.40 (0.01) | (0.01, 0.04) | 0.004 | |
| Phosphorus (mmol/L) | 1.36 (0.01) | 1.32 (0.01) | (0.01, 0.06) | 0.006 | |
| Melanin (index values) | 16.29 (0.29) | 17.08 (0.25) | (−1.29, −0.28) | 0.004 |
| S-25(OH)D (nmol/L) | S-25(OH)D Status | |||||||
|---|---|---|---|---|---|---|---|---|
| Mean (SE) | (95% CI) | p-Value | <30 (nmol/L (10.3%),% | <50 (nmol/L (63.64%),% | <75 (nmol/L (76.1%),% | ≥75 (nmol/L (23.9%),% | ||
| Immigration status | Non-immigrant † | 62.72 (1.73) | - | 7.82 | 31.75 | 73.21 | 26.83 | |
| Immigrant | 51.23 (1.41) | (8.37, 14.62) | <0.001 | 19.01 *** | 52.82 *** | 86.11 | 13.89 *** | |
| Age at immigration (years) | <18 † | 46.54 (1.63) | - | 19.17 | 64.04 | 91.37 | 8.63 | |
| ≥18 | 56.33 (2.34) | (−15.14, −4.44) | 0.001 | 18.80 | 41.23 ** | 80.76 | 19.24 ** | |
| 5 years after immigration | ≤5 † | 45.94 (2.22) | - | 19.55 | 62.54 | 92.35 | 7.65 | |
| >5 | 52.77 (1.73) | (−12.58, −1.08) | 0.022 | 18.59 | 50.04 * | 84.59 | 15.41 * | |
| 10 years after immigration | ≤10 † | 47.03 (1.83) | - | 19.55 | 59.83 | 92.05 | 7.95 | |
| >10 | 53.98 (1.83) | (−11.79, −2.12) | 0.007 | 18.59 | 48.26 | 82.63 | 17.37 ** | |
| Sex | Male † | 57.92 (1.67) | - | 11.13 | 39.65 | 79.62 | 20.38 | |
| Female | 62.53 (1.82) | (−6.30, −2.93) | <0.001 | 9.45 | 33.04 *** | 72.58 | 27.42 *** | |
| Age group (years) | <5 | 69.94 (1.64) | (−13.94, −9.01) | <0.001 | 1.99 | 15.70 | 67.1 | 32.9 |
| 5–11 | 62.49 (2.16) | (−5.91, −2.29) | <0.001 | 4.04 | 27.41 | 77.9 | 22.1 | |
| 12–17 | 55.76 (1.93) | (0.44, 4.81) | 0.021 | 10.49 | 40.38 | 84.36 | 15.64 | |
| 18–64 † | 58.45 (1.81) | - | 12.1 | 39.79 | 78.24 | 21.76 | ||
| >64 | 71.07 (1.20) | (−15.63, −9.55) | <0.001 | 4.59 | 22.39 *** | 58.69 | 41.31 *** | |
| BMI (kg/m2) | Underweight | 62.19 (4.05) | (−5.82, 7.51) | 0.795 | 12.65 | 33.0 | 71.07 | 28.93 |
| Normal weight † | 63.03 (2.04) | - | 9.22 | 31.79 | 73.07 | 26.93 | ||
| Overweight | 61.02 (1.68) | (−0.56, 4.58) | 0.119 | 7.91 | 35.32 | 75.24 | 24.76 | |
| Obese | 54.48 (1.74) | (5.50, 11.60) | <0.001 | 15.25 *** | 45.15 *** | 82.36 | 17.64 ** | |
| VitD-supplement and/or analog use | No † | 56.97 (1.74) | - | 40.52 | 80.56 | 19.44 | ||
| Yes | 83.46 (5.25) | (−35.92, −17.06) | <0.001 | 9.80 *** | 43.16 | 56.84 *** | ||
| Sun exposure (10 am to 4 pm) | <30 min/day † | 55.92 (2.20) | - | 15.58 | 48.72 | 76.51 | 23.49 | |
| ≥30 min/day | 60.82 (1.69) | (−7.81, −1.99) | 0.002 | 9.60 ** | 34.65 *** | 76.04 | 23.96 | |
| Sunscreen use | Never † | 54.78 (1.85) | - | 15.04 | 48.05 | 80.92 | 19.08 | |
| Always, occasionally | 62.86 (1.74) | (−10.16, −5.99) | <0.001 | 7.87 *** | 30.23 *** | 73.99 | 26.01 *** | |
| Traveled to sunny/warm climate | No † | 59.33 (1.83) | - | 10.81 | 37.99 | 77.59 | 22.41 | |
| Yes | 67.03 (2.10) | (−11.85, −3.54) | 0.001 | 6.49 | 23.71 *** | 65.08 | 34.92 *** | |
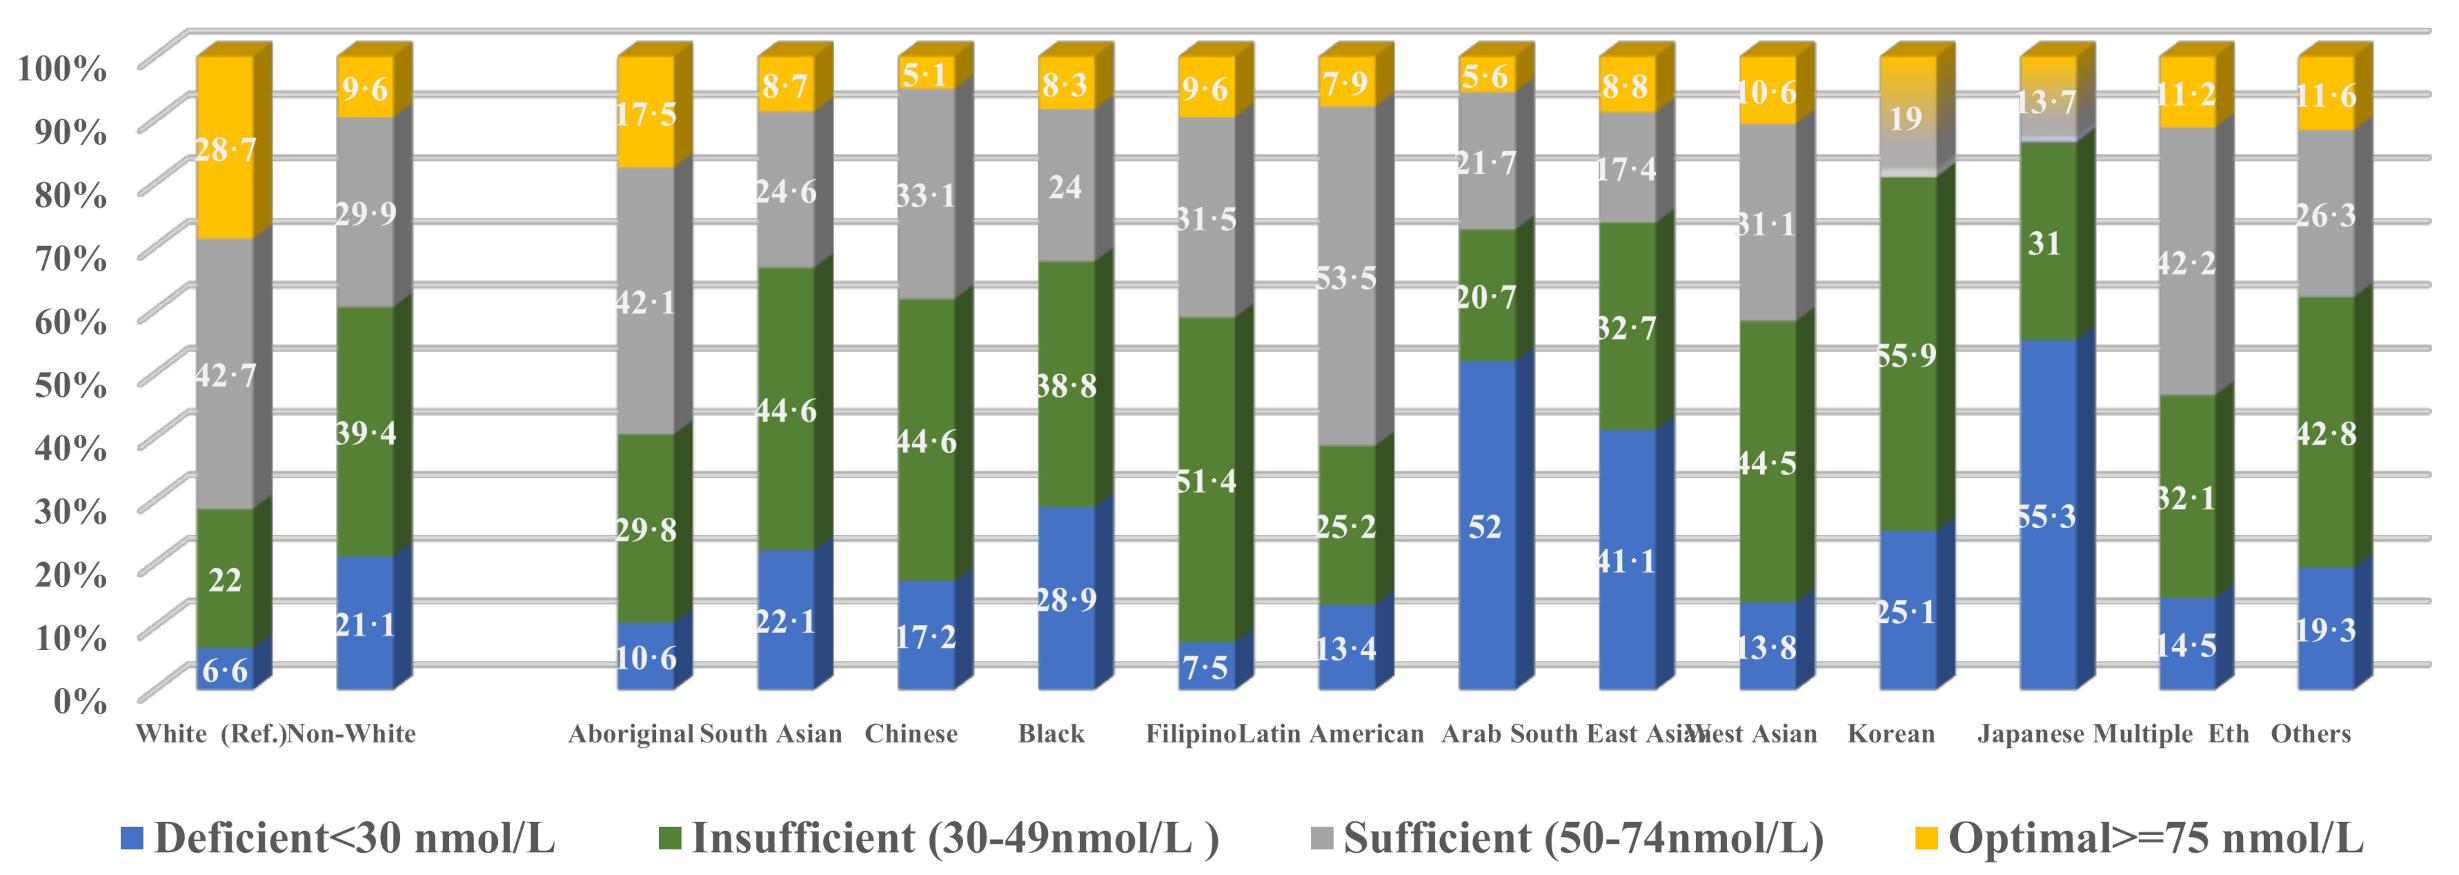
| S-25(OH)D (nmol/L) | S-25(OH)D Status | |||||||
|---|---|---|---|---|---|---|---|---|
| Mean (SE) | (95% CI) | p-Value | <30 (nmol/L (10.3%),% | <50 (nmol/L (63.64%),% | <75 (nmol/L (76.1%),% | ≥75 (nmol/L (23.9%),% | ||
| White † | 64.48 (1.73) | - | 6.61 | 29.10 | 71.25 | 28.75 | ||
| Non-white | 47.67 (1.31) | (13.85, 19.77) | <0.001 | 21.09 *** | 60.49 *** | 90.39 | 9.61 *** | |
| Aboriginal | 55.55 (1.77) | (4.36, 13.50) | 0.001 | 10.63 | 40.35 ** | 82.51 | 17.49 * | |
| South Asian | 45.56 (2.48) | (13.83, 24.02) | <0.001 | 22.11 *** | 66.73 *** | 91.28 | 8.72 *** | |
| Chinese | 46.03 (1.56) | (14.17, 22.74) | <0.001 | 17.18 *** | 61.84 *** | 94.89 | 5.11 *** | |
| Black | 43.82 (2.96) | (15.07, 26.26) | <0.001 | 28.87 *** | 67.72 *** | 91.73 | 8.27 *** | |
| Filipino | 49.39 (3.93) | (5.90, 24.29) | 0.003 | 7.51 | 58.85 * | 90.41 | 9.59 *** | |
| Latin American | 52.64 (2.87) | (5.20, 18.50) | 0.001 | 13.43 | 38.66 | 92.13 | 7.87 * | |
| Arab | 37.14 (4.62) | (18.15, 36.54) | <0.001 | 51.98 *** | 72.17 *** | 94.40 | 5.60 *** | |
| Southeast Asian | 40.92 (4.43) | (13.88, 33.24) | <0.001 | 41.08 *** | 73.84 *** | 91.19 | 8.81 ** | |
| West Asian | 53.74 (6.64) | (−3.29, 24.78) | 0.127 | 13.83 | 58.27 ** | 83.35 | 16.65 | |
| Korean | 44.26 (15.06) | (−10.07, 50.51) | 0.180 | 25.12 * | 81.04 *** | 18.96 | ||
| Japanese | 33.16 (8.59) | (14.12, 48.52) | 0.001 | 55.30 *** | 86.27 *** | 13.83 | ||
| Multiple ethnicities | 53.04 (2.44) | (6.45, 16.44) | <0.001 | 14.48 ** | 46.58 *** | 88.83 | 11.17 *** | |
| Other ethnicities | 50.02 (5.17) | (3.33, 25.61) | 0.013 | 62.13 *** | 88.36 | 11.64 | 62.13 *** | |
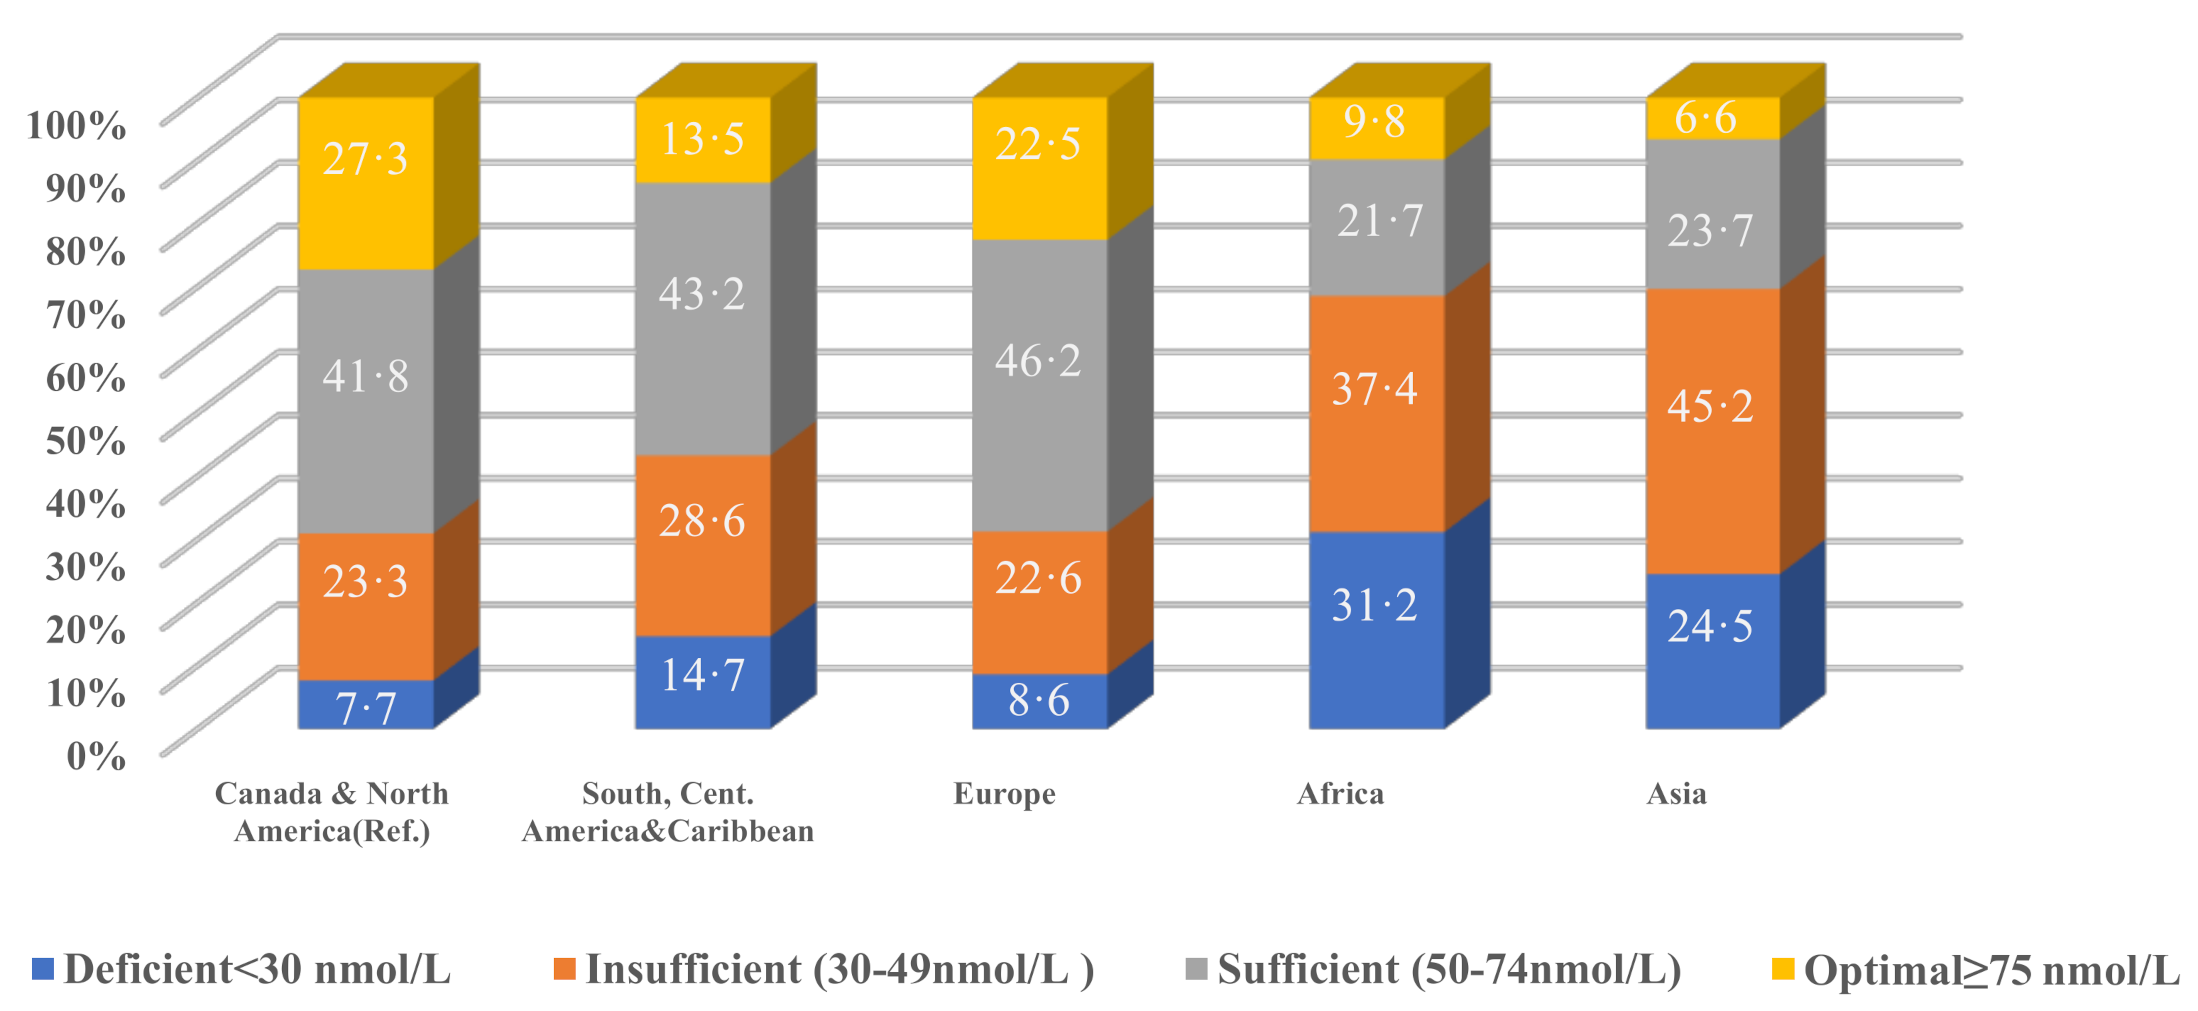
| S-25(OH)D (nmol/L) | S-25(OH)D Status | |||||||
|---|---|---|---|---|---|---|---|---|
| Mean (SE) | (95% CI) | p-Value | <30 (nmol/L (10.3%),% | <50 (nmol/L (63.64%),% | <75 (nmol/L (76.1%),% | ≥75 (nmol/L (23.9%),% | ||
| Region of birth | Canada and North America † | 63.10 (1.74) | - | - | 7.66 | 30.95 | 72.74 | 27.26 |
| South/Central America, and the Caribbean | 53.20 (3.13) | (2.47, 17.33) | 0.011 | 14.65 | 43.29 | 86.51 | 13.49 | |
| Europe | 62.61 (1.83) | (−2.98, 3.95) | 0.775 | 8.62 | 31.24 | 77.46 | 22.54 | |
| Africa | 42.74 (3.50) | (13.08, 27.64) | <0.001 | 31.16 *** | 68.55 *** | 90.21 | 9.79 ** | |
| Asia | 43.67 (1.67) | (15.51, 23.34) | <0.001 | 24.50 *** | 69.67 *** | 93.41 | 6.59 *** | |
| Country of birth | Canada † | 63.23 (1.74) | - | 7.45 | 30.73 | 72.64 | 27.36 | |
| China | 48.62 (2.08) | (10.21, 19.01) | <0.001 | 10.53 | 63.14 *** | 91.50 | 8.50 *** | |
| USA | 58.67 (4.07) | (−4.36, 13.47) | 0.301 | 15.44 * | 39.01 | 75.69 | 24.31 | |
| France | 56.98 (5.19) | (−4.17, 16.67) | 0.226 | 34.10 | 90.52 | 9.48 | ||
| Jamaica | 51.72 (7.47) | (−5.03, 28.05) | 0.163 | 23.13 * | 48.04 | 77.07 | 22.93 | |
| UK | 68.88 (3.16) | (−12.11, 0.81) | 0.083 | 11.73 | 21.95 | 66.34 | 33.66 | |
| Algeria | 34.73 (6.35) | (15.49, 41.50) | <0.001 | 87.90 *** | 12.10 | |||
| Mexico | 45.67 (11.69) | (−5.28, 40.40) | 0.125 | 56.61 | 87.81 | 12.19 | ||
| Pakistan | 41.60 (7.35) | (4.35, 38.90) | 0.017 | 25.96 * | 68.38 | 31.60 | ||
| Netherlands | 72.69 (5.75) | (−20.12, 1.20) | 0.079 | 20.06 | 45.01 | 54.99 *** | ||
| India | 42.40 (4.69) | (11.64, 30.02) | <0.001 | 34.42 *** | 73.64 | 93.64 | 6.36 *** | |
| Philippine | 48.14 (3.55) | (7.25, 22.92) | 0.001 | 11.20 | 61.20 * | 91.32 | 8.68 ** | |
| Romania | 42.95 (5.25) | (9.26, 31.29) | 0.001 | 80.72 *** | 19.30 | |||
| Hong Kong | 53.90 (7.90) | (−8.08, 26.74) | 0.278 | 32.02 | 68.00 | |||
| Germany | 68.53 (6.84) | (−19.37, 8.77) | 0.443 | 29.44 | 70.19 | 29.81 | ||
| Colombia | 60.53 (9.88) | (−19.08, 24.48) | 0.800 | 9.39 | 77.36 | 22.64 | ||
| Morocco | 39.39 (7.25) | (8.77, 38.90) | 0.003 | 55.90 *** | 68.53 *** | 31.50 | ||
| Italy | 63.12 (5.43) | (−10.52, 10.73) | 0.984 | 8.07 | 24.55 | 72.49 | 27.51 | |
| Iran | 49.99 (6.87) | (−1.77, 28.23) | 0.081 | 6.18 | 73.32 ** | 87.94 | 12.06 | |
| Lebanon | 39.38 (8.18) | (6.89, 40.80) | 0.008 | 29.97 ** | 78.70 ** | 21.30 | ||
| Others | 49.28 (1.57) | (10.58, 17.31) | <0.001 | 21.97 *** | 54.45 *** | 90.19 | 9.8% | |
| All (153 Countries) | 51.09 (1.40) | (9.01, 15.27) | <0.001 | 18.91 *** | 53.42 *** | 86.66 | 13.34 *** | |
| S-25(OH)D | |||
|---|---|---|---|
| Beta Estimate (SE) | (95% CI) | p-Value | |
| Immigration status | −5.28 (1.06) | −7.48, −3.09 | <0.001 |
| Sex | 4.54 (0.88) | 2.71, 6.36 | <0.001 |
| Season | 3.44 (0.97) | 1.42, 5.46 | 0.002 |
| Age | 0.14 (0.04) | 0.07, 0.22 | 0.001 |
| Traveled to a warm/sunny climate | 6.31 (1.67) | 2.85, 9.78 | 0.001 |
| BMI | −4.89 (0.64) | −6.11, −3.48 | <0.001 |
| Dairy products (milk, cheese, yogurt) | 5.79 (0.74) | 4.25, 7.32 | <0.001 |
| Skin pigmentation (melanin) | 1.36 (0.28) | 0.79, 1.93 | <0.001 |
| Sunscreen use | 4.95 (1.12) | 2.63, 7.28 | <0.001 |
| Ethnicity | −15.11 (1.61) | −18.46, −11.78 | <0.001 |
| VitD-supplement and/or analog use | 0.52 (0.16) | 0.17, 0.86 | 0.005 |
| -Const. | 29.01 (5.91) | 17.91, 40.12 | <0.001 |
Publisher’s Note: MDPI stays neutral with regard to jurisdictional claims in published maps and institutional affiliations. |
© 2021 by the authors. Licensee MDPI, Basel, Switzerland. This article is an open access article distributed under the terms and conditions of the Creative Commons Attribution (CC BY) license (https://creativecommons.org/licenses/by/4.0/).
Share and Cite
Yousef, S.; Manuel, D.; Colman, I.; Papadimitropoulos, M.; Hossain, A.; Faris, M.; Wells, G.A. Vitamin D Status among First-Generation Immigrants from Different Ethnic Groups and Origins: An Observational Study Using the Canadian Health Measures Survey. Nutrients 2021, 13, 2702. https://doi.org/10.3390/nu13082702
Yousef S, Manuel D, Colman I, Papadimitropoulos M, Hossain A, Faris M, Wells GA. Vitamin D Status among First-Generation Immigrants from Different Ethnic Groups and Origins: An Observational Study Using the Canadian Health Measures Survey. Nutrients. 2021; 13(8):2702. https://doi.org/10.3390/nu13082702
Chicago/Turabian StyleYousef, Said, Douglas Manuel, Ian Colman, Manny Papadimitropoulos, Alomgir Hossain, MoezAlIslam Faris, and George A. Wells. 2021. "Vitamin D Status among First-Generation Immigrants from Different Ethnic Groups and Origins: An Observational Study Using the Canadian Health Measures Survey" Nutrients 13, no. 8: 2702. https://doi.org/10.3390/nu13082702
APA StyleYousef, S., Manuel, D., Colman, I., Papadimitropoulos, M., Hossain, A., Faris, M., & Wells, G. A. (2021). Vitamin D Status among First-Generation Immigrants from Different Ethnic Groups and Origins: An Observational Study Using the Canadian Health Measures Survey. Nutrients, 13(8), 2702. https://doi.org/10.3390/nu13082702