
Whole-Grain Intake in the Mediterranean Diet and a Low Protein to Carbohydrates Ratio Can Help to Reduce Mortality from Cardiovascular Disease, Slow Down the Progression of Aging, and to Improve Lifespan: A Review


Abstract
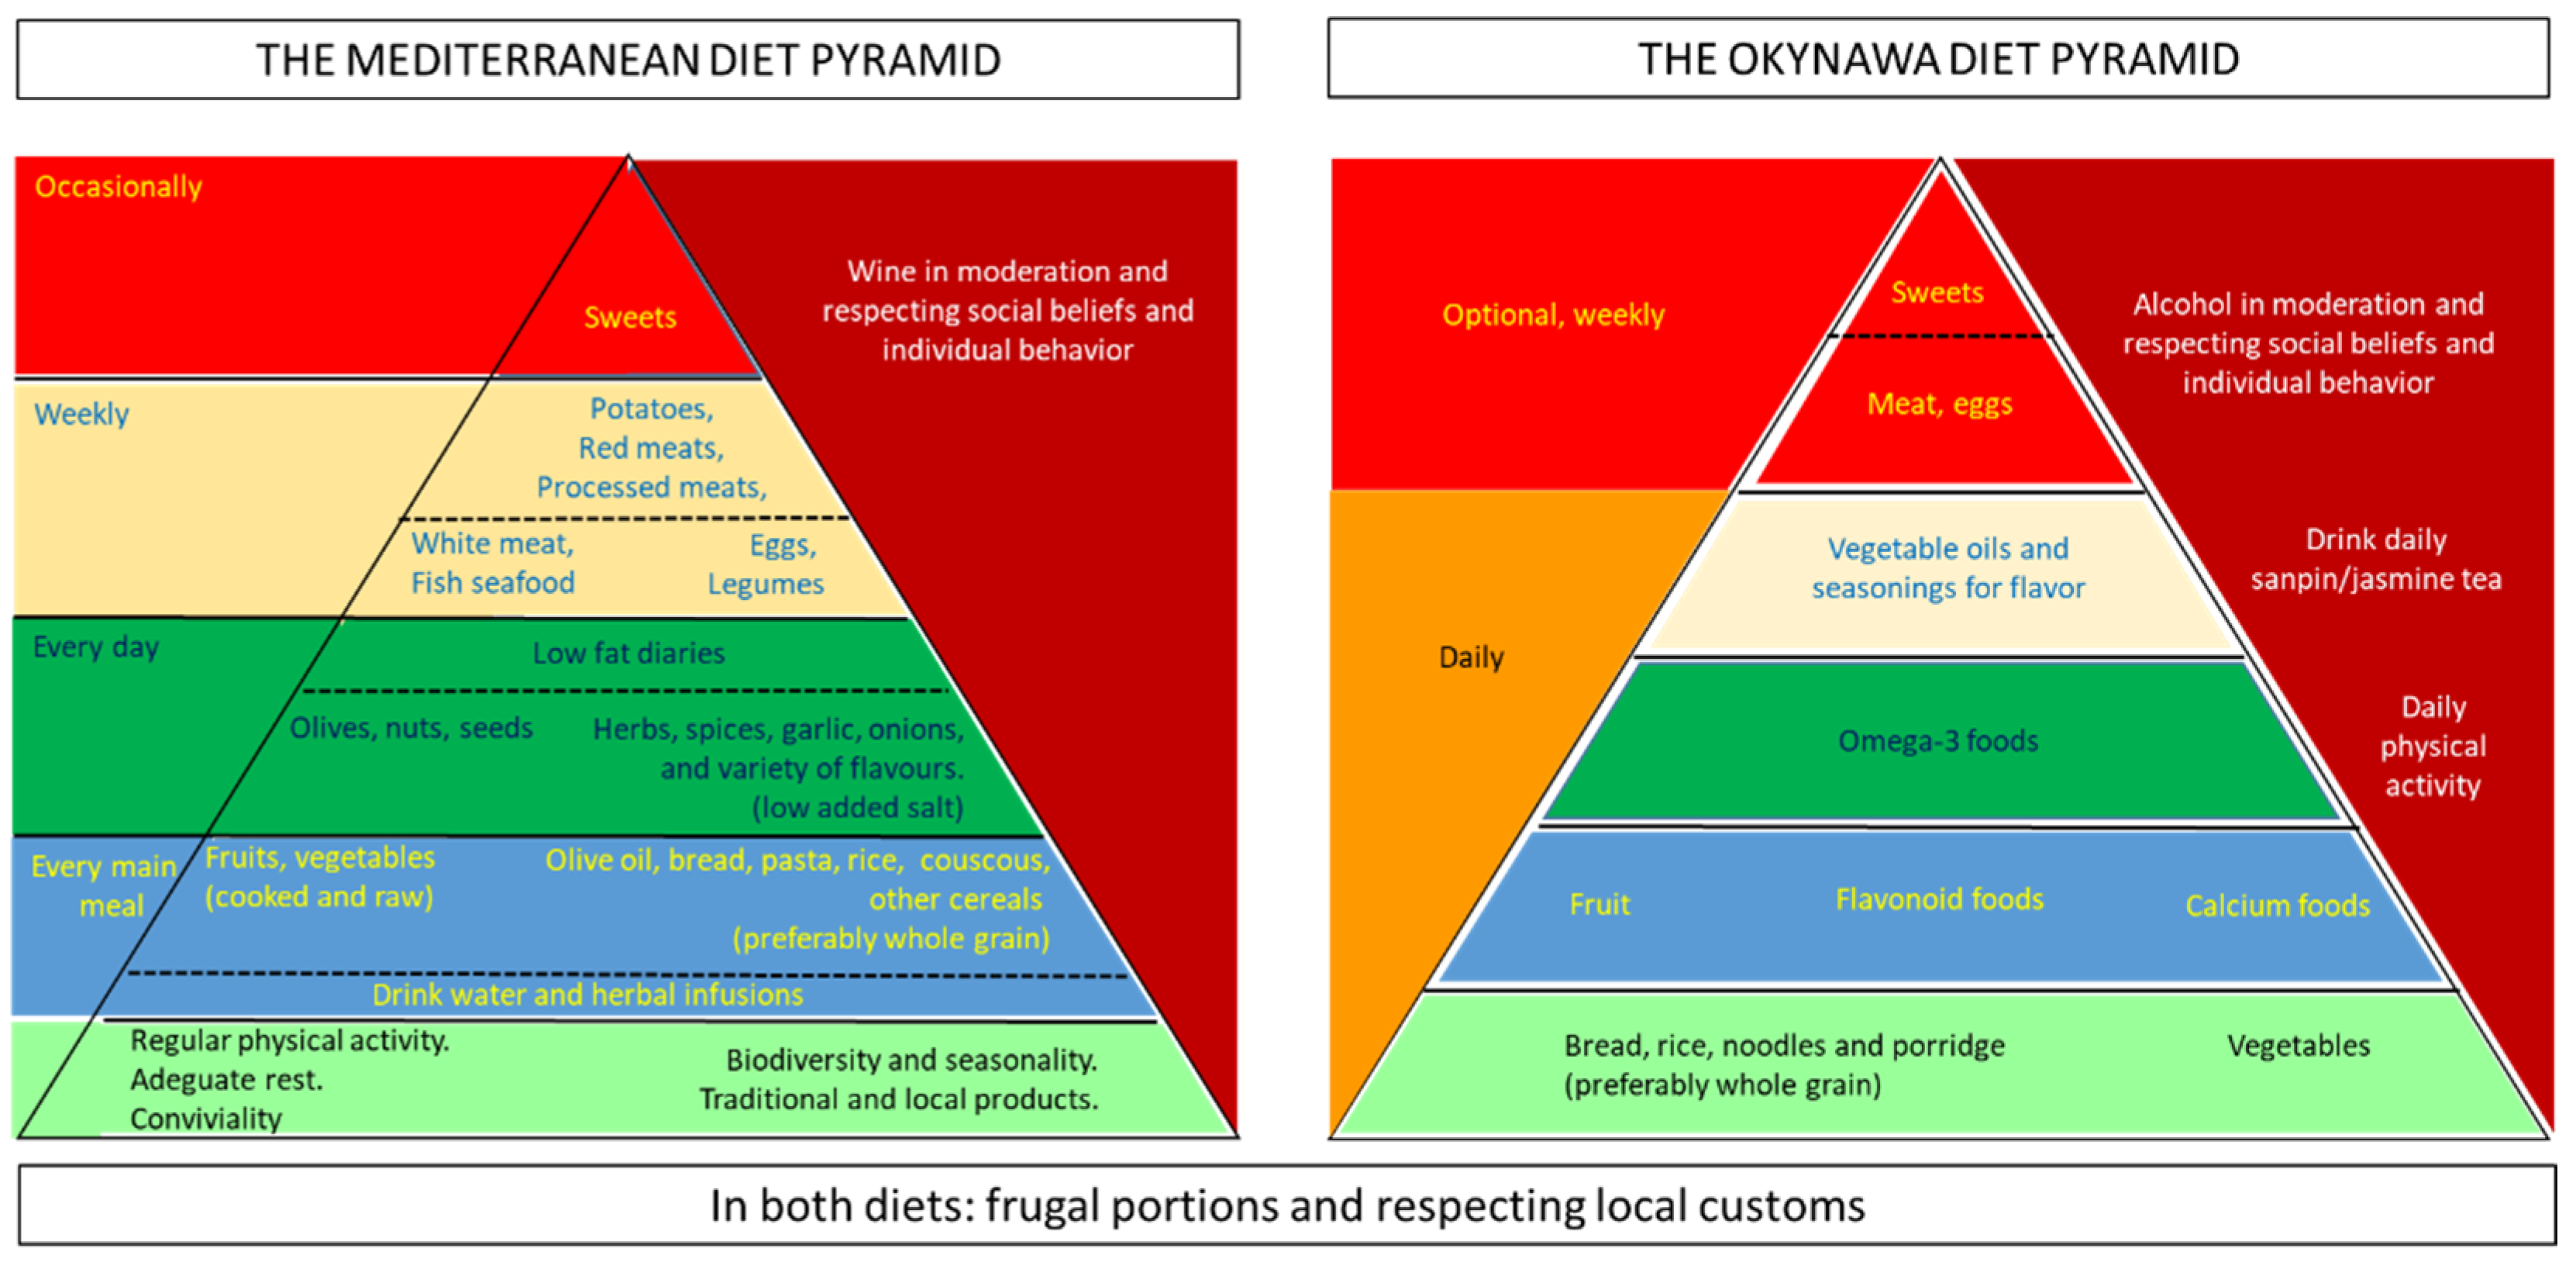
1. Introduction
2. Cereals
2.1. Wheat
2.1.1. Starch and Protein
2.1.2. Wheat Fibers and Cell Wall Polysaccharides
2.1.3. Antioxidant Components and B Vitamins in Wheat
2.1.4. Health Effects
2.2. Rye
2.2.1. Nutrition Properties
2.2.2. Health Effects
2.2.3. Rye Bread and Glucose Metabolism
2.3. Spelt (Triticum Spelta)
Nutrients
2.4. Oats
2.4.1. Nutrients
2.4.2. Oat Beta-Glucan
2.5. Rice
Nutrients
2.6. Maize (Corn)
2.6.1. Nutrients
2.6.2. Maize Oil
2.6.3. Corn Oil vs. Extra-Virgin Olive Oil
2.6.4. Poly- and Monounsaturated Fatty Acids, Serum Cholesterol Levels and Cardiovascular Disease
2.7. Barley
2.7.1. Nutrients
2.7.2. Barley β-Glucan
3. Diet Pattern and Risk of Frailty and Mortality
4. Whole Grains Intake, Cardiovascular Risk Factors, and Body Weight
5. Whole Grains Intake and Reduction of Mortality
6. Reduction of Protein to Carbohydrates Ratio Influence Aging and Lifespan
7. Discussion
8. Conclusions
Funding
Acknowledgments
Conflicts of Interest
References
- United Nations, Department of Economic and Social Affairs, Population Division. World Population Ageing 2015 (ST/ESA/SER.A/390). Available online: https://www.un.org/en/development/desa/population/publications/pdf/ageing/WPA2015_Report.pdf (accessed on 1 August 2020).
- Eurostat. Population Structure and Ageing. Available online: https://ec.europa.eu/eurostat/statistics-explained/index.php/Population_structure_and_ageing#The_share_of_elderly_people_continues_to_increase (accessed on 1 August 2020).
- Rowe, J.W.; Kahn, R.L. Human aging: Usual and successful. Science 1987, 237, 143–149. [Google Scholar] [CrossRef] [PubMed]
- Rowe, J.W.; Kahn, R.L. Successful Aging. Gerontologist 1997, 37, 433–440. [Google Scholar] [CrossRef]
- Keys, A.B. Seven Countries: A Multivariate Analysis of Death and Coronary Heart Disease; Harvard University Press: Cambridge, MA, USA, 1980; ISBN 9780674497887. [Google Scholar]
- Trichopoulou, A.; Costacou, T.; Bamia, C.; Trichopoulos, D. Adherence to a Mediterranean Diet and Survival in a Greek Population. N. Engl. J. Med. 2003, 348, 2599–2608. [Google Scholar] [CrossRef]
- Trichopoulou, A. Diet and overall survival in the elderly. BMJ 1995, 311, 1457–1460. [Google Scholar] [CrossRef] [PubMed]
- Estruch, R.; Ros, E.; Salas-Salvadó, J.; Covas, M.-I.; Corella, D.; Arós, F.; Gómez-Gracia, E.; Ruiz-Gutiérrez, V.; Fiol, M.; Lapetra, J.; et al. Primary Prevention of Cardiovascular Disease with a Mediterranean Diet. N. Engl. J. Med. 2013, 368, 1279–1290. [Google Scholar] [CrossRef]
- Estruch, R.; Ros, E.; Salas-Salvadó, J.; Covas, M.I.; Corella, D.; Arós, F.; Gómez-Gracia, E.; Ruiz-Gutiérrez, V.; Fiol, M.; Lapetra, J.; et al. Primary Prevention of Cardiovascular Disease with a Mediterranean Diet Supplemented with Extra-Virgin Olive Oil or Nuts. N. Engl. J. Med. 2018, 378, e34. [Google Scholar] [CrossRef]
- Sofi, F.; Cesari, F.; Abbate, R.; Gensini, G.F.; Casini, A. Adherence to Mediterranean diet and health status: Meta-analysis. BMJ 2008, 337, a1344. [Google Scholar] [CrossRef]
- Sofi, F.; Abbate, R.; Gensini, G.F.; Casini, A. Accruing evidence on benefits of adherence to the Mediterranean diet on health: An updated systematic review and meta-analysis. Am. J. Clin. Nutr. 2010, 92, 1189–1196. [Google Scholar] [CrossRef]
- Akbaraly, T.; Sabia, S.; Hagger-Johnson, G.; Tabak, A.; Shipley, M.J.; Jokela, M.; Brunner, E.; Hamer, M.; Batty, G.; Singh-Manoux, A.; et al. Does Overall Diet in Midlife Predict Future Aging Phenotypes? A Cohort Study. Am. J. Med. 2013, 126, 411–419.e3. [Google Scholar] [CrossRef] [PubMed]
- Samieri, C.; Sun, Q.; Townsend, M.K.; Chiuve, S.E.; Okereke, O.I.; Willett, W.C.; Stampfer, M.; Grodstein, F. The association between dietary patterns at midlife and health in aging: An observational study. Ann. Intern. Med. 2013, 159, 584–591. [Google Scholar] [CrossRef]
- Brites, C. Cereals in the context of the Mediterranean Diet. In Dimensions of Mediterranean Diet: World cultural Heritage; Universidade do Algarve: Faro, Portugal, 2015; pp. 181–195. ISBN 978-989-8472-74-8. [Google Scholar]
- Fundación Dieta Mediterránea. 2010. Available online: https://dietamediterranea.com (accessed on 30 August 2020).
- Willcox, D.C.; Scapagnini, G.; Willcox, B.J. Healthy aging diets other than the Mediterranean: A focus on the Okinawan diet. Mech. Ageing Dev. 2014, 136–137, 148–162. [Google Scholar] [CrossRef] [PubMed]
- Forum, O.B.O.T.H.; Ross, A.B.; van der Kamp, J.-W.; King, R.; Lê, K.-A.; Mejborn, H.; Seal, C.J.; Thielecke, F. Perspective: A Definition for Whole-Grain Food Products—Recommendations from the Healthgrain Forum. Adv. Nutr. 2017, 8, 525–531. [Google Scholar] [CrossRef]
- Cavazos, A.; De Mejia, E.G. Identification of Bioactive Peptides from Cereal Storage Proteins and Their Potential Role in Prevention of Chronic Diseases. Compr. Rev. Food Sci. Food Saf. 2013, 12, 364–380. [Google Scholar] [CrossRef]
- Solfrizzi, V.; Panza, F.; Torres, F.; Mastroianni, F.; Del Parigi, A.; Venezia, A.; Capurso, A. High monounsaturated fatty acids intake protects against age-related cognitive decline. Neurology 1999, 52, 1563. [Google Scholar] [CrossRef]
- Capurso, A.; Crepaldi, G.; Capurso, C. Benefits of the Mediterranean Diet in the Elderly Patient, Practical Issues in Geriatrics; Springer: Berlin/Heidelberg, Germany, 2018; Chapter 8; pp. 139–172. [Google Scholar]
- NutritionValue.Org. Available online: https://www.nutritionvalue.org (accessed on 15 October 2020).
- Peter, R. Natural Variation in Grain Composition of Wheat and Related Cereals. J. Agric. Food Chem. 2013, 61, 8295–8303. [Google Scholar]
- Vogel, K.P.; Johnson, V.A.; Mattern, P.J. Protein and Lysine Content of Grain, Endosperm, and Bran of Wheats from the USDA World Wheat Collection 1. Crop. Sci. 1976, 16, 655–660. [Google Scholar] [CrossRef]
- Rakszegi, M.; Boros, D.; Kuti, C.; Láng, L.; Bedo, Z.; Shewry, P.R. Composition and End-Use Quality of 150 Wheat Lines Selected for the HEALTHGRAIN Diversity Screen. J. Agric. Food Chem. 2008, 56, 9750–9757. [Google Scholar] [CrossRef] [PubMed]
- Shewry, P.R. Genetics of wheat gluten proteins. Adv Genet. 2003, 49, 111–184. [Google Scholar]
- Philips, G.O. An introduction: Evolution and finalisation of the regulatory definition of dietary fibre. Food Hydrocolloids 2011, 25, 139–143. [Google Scholar] [CrossRef]
- Official Journal of the European Union, 29 October 2008; L 285 (51): 9. Available online: https://eur-lex.europa.eu/legal-content/EN/TXT/PDF/?uri=OJ:L:2008:285:FULL&from=PL (accessed on 1 June 2021).
- Official Journal of the European Union, 22 November 2011; L 304 (54): 18. Available online: https://eur-lex.europa.eu/legal-content/EN/TXT/PDF/?uri=OJ:L:2011:304:FULL&from=FR (accessed on 1 June 2021).
- Jmares, D.; Stone, B. Studies on Wheat Endosperm I. Chemical Composition and Ultrastructure of the Cell Walls. Aust. J. Biol. Sci. 1973, 26, 793. [Google Scholar] [CrossRef]
- Barron, C.; Surget, A.; Rouau, X. Relative amounts of tissues in mature wheat (Triticum aestivum L.) grain and their carbohydrate and phenolic acid composition. J. Cereal Sci. 2007, 45, 88–96. [Google Scholar] [CrossRef]
- Stone, B. Carbohydrates. In Wheat: Chemistry and Technology, 4th ed.; Khan, K., Shewry, P.R., Eds.; AACC: St. Paul, MN, USA, 2009; pp. 299–362. [Google Scholar]
- Laddomada, B.; Caretto, S.; Mita, G. Wheat Bran Phenolic Acids: Bioavailability and Stability in Whole Wheat-Based Foods. Molecules 2015, 20, 15666–15685. [Google Scholar] [CrossRef] [PubMed]
- Anson, N.M.; Berg, R.V.D.; Havenaar, R.; Bast, A.; Haenen, G. Ferulic Acid from Aleurone Determines the Antioxidant Potency of Wheat Grain (Triticum aestivumL.). J. Agric. Food Chem. 2008, 56, 5589–5594. [Google Scholar] [CrossRef]
- Adom, K.K.; Sorrells, A.M.E.; Liu, R.H. Phytochemicals and Antioxidant Activity of Milled Fractions of Different Wheat Varieties. J. Agric. Food Chem. 2005, 53, 2297–2306. [Google Scholar] [CrossRef]
- Qu, H.; Madl, R.L.; Takemoto, D.J.; Baybutt, R.C.; Wang, W. Lignans Are Involved in the Antitumor Activity of Wheat Bran in Colon Cancer SW480 Cells. J. Nutr. 2005, 135, 598–602. [Google Scholar] [CrossRef]
- Aune, D. Whole grain consumption and risk of cardiovascular disease, cancer, and all cause and cause specific mortality: Systematic review and dose-response meta-analysis of prospective studies. Br. Med. J. 2016, 353, i2716. [Google Scholar] [CrossRef]
- American Heart Association. Whole Grains and Fiber. 2016. Available online: https://www.heart.org/en/healthy-living/healthy-eating/eat-smart/nutrition-basics/whole-grains-refined-grains-and-dietary-fiber (accessed on 1 June 2021).
- Juntunen, K.S.; Laaksonen, D.; Autio, K.; Niskanen, L.K.; Holst, J.J.; Savolainen, K.; Liukkonen, K.-H.; Poutanen, K.S.; Mykkänen, H.M. Structural differences between rye and wheat breads but not total fiber content may explain the lower postprandial insulin response to rye bread. Am. J. Clin. Nutr. 2003, 78, 957–964. [Google Scholar] [CrossRef]
- Nordlund, E.; Katina, K.; Mykkänen, H.; Poutanen, K. Distinct Characteristics of Rye and Wheat Breads Impact on Their in Vitro Gastric Disintegration and in Vivo Glucose and Insulin Responses. Foods 2016, 5, 24. [Google Scholar] [CrossRef] [PubMed]
- Rojas-Bonzi, P.; Vangsøe, C.T.; Nielsen, K.L.; Lærke, H.N.; Hedemann, M.S.; Knudsen, K.E.B. The Relationship between In Vitro and In Vivo Starch Digestion Kinetics of Breads Varying in Dietary Fibre. Foods 2020, 9, 1337. [Google Scholar] [CrossRef]
- Christensen, K.L.; Hedemann, M.S.; Lærke, H.N.; Jørgensen, H.; Mutt, S.J.; Herzig, K.-H.; Knudsen, K.E.B. Concentrated Arabinoxylan but Not Concentrated β-Glucan in Wheat Bread Has Similar Effects on Postprandial Insulin as Whole-Grain Rye in Porto-arterial Catheterized Pigs. J. Agric. Food Chem. 2013, 61, 7760–7768. [Google Scholar] [CrossRef]
- Ruibal-Mendieta, N.L. Spelt (Triticum aestivum ssp. spelta) as a source of breadmaking flours and bran naturally en-riched in oleic acid and minerals but not phytic acid. J. Agric. Food Chem. 2005, 53, 2751–2759. [Google Scholar] [CrossRef] [PubMed]
- Schober, T.J.; Bean, S.R.; Kuhn, M. Gluten proteins from spelt (Triticum aestivum ssp. spelta) cultivars: A rheological and size-exclusion high-performance liquid chromatography study. J. Cereal Sci. 2006, 44, 161–173. [Google Scholar] [CrossRef]
- Gonzalez, J.T.; Stevenson, E.J. Postprandial glycemia and appetite sensations in response to porridge made with rolled and pinhead oats. J. Am. Coll. Nutr. 2012, 31, 111–116. [Google Scholar] [CrossRef]
- Alyami, J.; Ladd, N.; Pritchard, S.E.; Hoad, C.; Sultan, A.A.; Spiller, R.C.; Gowland, P.A.; Macdonald, I.; Aithal, G.P.; Marciani, L.; et al. Glycaemic, gastrointestinal and appetite responses to breakfast porridges from ancient cereal grains: A MRI pilot study in healthy humans. Food Res. Int. 2019, 118, 49–57. [Google Scholar] [CrossRef]
- Augustin, L.S.A.; Aas, A.-M.; Astrup, A.; Atkinson, F.S.; Baer-Sinnott, S.; Barclay, A.W.; Brand-Miller, J.C.; Brighenti, F.; Bullo, M.; Buyken, A.E.; et al. Dietary Fibre Consensus from the International Carbohydrate Quality Consortium (ICQC). Nutrients 2020, 12, 2553. [Google Scholar] [CrossRef]
- Sievenpiper, J.L. Low-carbohydrate diets and cardiometabolic health: The importance of carbohydrate quality over quantity. Nutr. Rev. 2020, 78, 69–77. [Google Scholar] [CrossRef]
- Tosh, S.M.; Bordenave, N. Emerging science on benefits of whole grain oat and barley and their soluble dietary fibers for heart health, glycemic response, and gut microbiota. Nutr. Rev. 2020, 78, 13–20. [Google Scholar] [CrossRef] [PubMed]
- Bączek, N.; Jarmułowicz, A.; Wronkowska, M.; Haros, C.M. Assessment of the glycaemic index, content of bioactive compounds, and their in vitro bioaccessibility in oat-buckwheat breads. Food Chem. 2020, 330, 127199. [Google Scholar] [CrossRef] [PubMed]
- Wolever, T.M.S.; Jones, P.J.H.; Jenkins, A.L.; Mollard, R.C.; Wang, H.; Johnston, A.; Johnson, J.; Chu, Y. Glycaemic and insulinaemic impact of oats soaked overnight in milk vs. cream of rice with and without sugar, nuts, and seeds: A randomized, controlled trial. Eur. J. Clin. Nutr. 2018, 73, 86–93. [Google Scholar] [CrossRef]
- Åberg, S.; Mann, J.; Neumann, S.; Ross, A.B.; Reynolds, A.N. Whole-Grain Processing and Glycemic Control in Type 2 Diabetes: A Randomized Crossover Trial. Diabetes Care 2020, 43, 1717–1723. [Google Scholar] [CrossRef] [PubMed]
- Whitehead, A.; Beck, E.J.; Tosh, S.; Wolever, T.M. Cholesterol-lowering effects of oat β-glucan: A meta-analysis of randomized controlled trials. Am. J. Clin. Nutr. 2014, 100, 1413–1421. [Google Scholar] [CrossRef]
- Food Service Guidelines Federal Workgroup. Food Service Guidelines for Federal Facilities; U.S. Department of Health and Human Services: Washington, DC, USA, 2017. [Google Scholar]
- Guideline: Fortification of Rice with Vitamins and Minerals as a Public Health Strategy; World Health Organization: Geneva, Switzerland, 2018; Licence: CC BY-NC-SA 3.0 IGO; ISBN 978-92-4-155029-1.
- Bienvenido, O.J. Rice in Human Nutrition; Food and Agricultural Organization of the United Nations: Rome, Italy, 1993; ISSN 1014-3181. [Google Scholar]
- Matsuda, T. Rice Flour: A Promising Food Material for Nutrition and Global Health. J. Nutr. Sci. Vitaminol. 2019, 65, S13–S17. [Google Scholar] [CrossRef]
- FAO. Food and Nutrition Paper 92. Dietary Protein Quality Evaluation in Human Nutrition; Report of an FAO Expert Consultation; Food and Agricultural Organization of the United Nations: Rome, Italy, 2013; ISBN 9789251074176. [Google Scholar]
- Herreman, L.; Nommensen, P.; Pennings, B.; Laus, M.C. Comprehensive overview of the quality of plant- and animal-sourced proteins based on the digestible indispensable amino acid score. Food Sci. Nutr. 2020, 8, 5379–5391. [Google Scholar] [CrossRef]
- Sung-Wook, H. Nutritional quality of rice bran protein in comparison to animal and vegetable protein. Food Chem. 2015, 172, 766–769. [Google Scholar]
- Barrera-Arellano, D.; Badan-Ribeiro, A.P.; Serna-Saldivar, S.O. Chapter 21—Corn Oil: Composition, Processing, and Utilization. Corn, 3rd ed.; AACC International Press: Washington, DC, USA, 2019; pp. 593–613. ISBN 9780128119716. [Google Scholar] [CrossRef]
- Owen, R.; Giacosa, A.; Hull, W.; Haubner, R.; Spiegelhalder, B.; Bartsch, H. The antioxidant/anticancer potential of phenolic compounds isolated from olive oil. Eur. J. Cancer 2000, 36, 1235–1247. [Google Scholar] [CrossRef]
- Perona, J.; Cabello-Moruno, R.; Ruiz-Gutiérrez, V. The role of virgin olive oil components in the modulation of endothelial function. J. Nutr. Biochem. 2006, 17, 429–445. [Google Scholar] [CrossRef] [PubMed]
- Ouni, Y. Characterisation and quantification of phenolic compounds of extra-virgin olive oils according to their geo-graphical origin by a rapid and resolutive LC–ESI-TOF MS method. Food Chem. 2011, 127, 1263–1267. [Google Scholar] [CrossRef] [PubMed]
- Vissers, M.N.; Zock, P.; Katan, M.B. Bioavailability and antioxidant effects of olive oil phenols in humans: A review. Eur. J. Clin. Nutr. 2004, 58, 955–965. [Google Scholar] [CrossRef] [PubMed]
- Visioli, F.; Galli, C.; Bornet, F.; Mattei, A.; Patelli, R.; Galli, G.; Caruso, D. Olive oil phenolics are dose-dependently absorbed in humans. FEBS Lett. 2000, 468, 159–160. [Google Scholar] [CrossRef]
- Mensink, R.P.; Katan, M.B. Effect of dietary fatty acids on serum lipids and lipoproteins. A meta-analysis of 27 trials. Arter. Thromb. A J. Vasc. Biol. 1992, 12, 911–919. [Google Scholar] [CrossRef]
- Maki, K.C.; Lawless, A.L.; Kelley, K.M.; Kaden, V.N.; Geiger, C.J.; Palacios, O.M.; Dicklin, M.R. Corn oil intake favorably impacts lipoprotein cholesterol, apolipoprotein and lipoprotein particle levels compared with extra-virgin olive oil. Eur. J. Clin. Nutr. 2016, 71, 33–38. [Google Scholar] [CrossRef] [PubMed]
- Hu, F.B.; Stampfer, M.J.; Manson, J.E.; Rimm, E.; Colditz, G.; Rosner, B.A.; Hennekens, C.H.; Willett, W.C. Dietary Fat Intake and the Risk of Coronary Heart Disease in Women. N. Engl. J. Med. 1997, 337, 1491–1499. [Google Scholar] [CrossRef]
- Willett, W.C. Dietary fats and coronary heart disease. J. Intern. Med. 2012, 272, 13–24. [Google Scholar] [CrossRef]
- Jakobsen, M.U.; O’Reilly, E.J.; Heitmann, B.L.; Pereira, M.; Bälter, K.; Fraser, G.; Goldbourt, U.; Hallmans, G.; Knekt, P.; Liu, S.; et al. Major types of dietary fat and risk of coronary heart disease: A pooled analysis of 11 cohort studies. Am. J. Clin. Nutr. 2009, 89, 1425–1432. [Google Scholar] [CrossRef]
- Lai, H.; Otto, M.C.D.O.; Lee, Y.; Wu, J.; Song, X.; King, I.B.; Psaty, B.M.; Lemaitre, R.N.; McKnight, B.; Siscovick, D.S.; et al. Serial Plasma Phospholipid Fatty Acids in the De Novo Lipogenesis Pathway and Total Mortality, Cause-Specific Mortality, and Cardiovascular Diseases in the Cardiovascular Health Study. J. Am. Heart Assoc. 2019, 8, e012881. [Google Scholar] [CrossRef] [PubMed]
- Fried, L.P.; Borhani, N.O.; Enright, P.; Furberg, C.D.; Gardin, J.M.; Kronmal, R.A.; Kuller, L.H.; Manolio, T.A.; Mittelmark, M.B.; Newman, A.B.; et al. The cardiovascular health study: Design and rationale. Ann. Epidemiol. 1991, 1, 263–276. [Google Scholar] [CrossRef]
- Borges, M.C. Circulating Fatty Acids and Risk of Coronary Heart Disease and Stroke: Individual Participant Data Me-ta-Analysis in Up to 16 126 Participants. J. Am. Heart Assoc. 2020, 9, e013131. [Google Scholar] [CrossRef]
- Lee, Y. Serial Biomarkers of De Novo Lipogenesis Fatty Acids and Incident Heart Failure in Older Adults: The Cardio-vascular Health Study. J. Am. Heart Assoc. 2020, 9, e014119. [Google Scholar] [CrossRef]
- Fincher, G.B. Morphology and Chemical Composition of Barley Endosperm Cell Walls. J. Inst. Brew. 1975, 81, 116–122. [Google Scholar] [CrossRef]
- Garcia-Gimenez, G. Barley grain (1,3;1,4)-β-glucan content: Effects of transcript and sequence variation in genes encod-ing the corresponding synthase and endohydrolase enzymes. Sci. Rep. 2019, 9, 17250. [Google Scholar] [CrossRef] [PubMed]
- AbuMweis, S.S. b-glucan from barley and its lipid-lowering capacity: A meta-analysis of randomized, controlled trials. Eur. J. Clin. Nutr. 2010, 64, 1472–1480. [Google Scholar] [CrossRef]
- Ho, H.V.T. A systematic review and meta-analysis of randomized controlled trials of the effect of barley β-glucan on LDL-C, non-HDL-C and apoB for cardiovascular disease risk reduction i-iv. Eur. J. Clin. Nutr. 2016, 70, 1239–1245. [Google Scholar] [CrossRef]
- Hui, S.; Liu, K.; Lang, H.; Liu, Y.; Wang, X.; Zhu, X.; Doucette, S.; Yi, L.; Mi, M. Comparative effects of different whole grains and brans on blood lipid: A network meta-analysis. Eur. J. Nutr. 2019, 58, 2779–2787. [Google Scholar] [CrossRef]
- EFSA NDA Panel (EFSA Panel on Nutrition, Novel Foods and Food Allergen). Beta-glucans from oats and/or bar-ley in a ready-to-eat cereal manufactured via pressure cooking and reduction of blood-glucose rise after consumption: Evaluation of a health claim pursuant to Article 13(5) of Regulation (EC) No 1924/2006. EFSA J. 2021, 19, e06493.
- Malunga, L.N.; Ames, N.; Zhouyao, H.; Blewett, H.; Thandapilly, S.J. Beta-Glucan From Barley Attenuates Post-prandial Glycemic Response by Inhibiting the Activities of Glucose Transporters but Not Intestinal Brush Border Enzymes and Amylolysis of Starch. Front. Nutr. 2021, 8. [Google Scholar] [CrossRef] [PubMed]
- Henrion, M.; Francey, C.; Lê, K.-A.; Lamothe, L. Cereal B-Glucans: The Impact of Processing and How It Affects Physiological Responses. Nutrients 2019, 11, 1729. [Google Scholar] [CrossRef]
- Shimizu, C.; Wakita, Y.; Kihara, M.; Kobayashi, N.; Tsuchiya, Y.; Nabeshima, T. Association of Lifelong Intake of Barley Diet with Healthy Aging: Changes in Physical and Cognitive Functions and Intestinal Microbiome in Senescence-Accelerated Mouse-Prone 8 (SAMP8). Nutrients 2019, 11, 1770. [Google Scholar] [CrossRef] [PubMed]
- Mozaffarian, D.; Appel, L.J.; Van Horn, L. Components of a Cardioprotective Diet. Circulation 2011, 123, 2870–2891. [Google Scholar] [CrossRef]
- Pour Fard, N.R.; Amirabdollahian, F.; Haghighatdoost, F. Dietary patterns and frailty: A systematic review and meta-analysis. Nutr. Rev. 2019, 77, 498–513. [Google Scholar] [CrossRef]
- Lo, Y.-L.; Hsieh, Y.-T.; Hsu, L.-L.; Chuang, S.-Y.; Chang, H.-Y.; Hsu, C.-C.; Chen, C.-Y.; Pan, W.-H. Dietary Pattern Associated with Frailty: Results from Nutrition and Health Survey in Taiwan. J. Am. Geriatr. Soc. 2017, 65, 2009–2015. [Google Scholar] [CrossRef]
- Trichopoulou, A.; Kouris-Blazos, A.; Wahlqvist, M.L.; Gnardellis, C.; Lagiou, P.; Polychronopoulos, E.; Vassilakou, T.; Lipworth, L.; Trichopoulos, D. Diet and overall survival in elderly people. BMJ 1995, 311, 1457–1460. [Google Scholar] [CrossRef] [PubMed]
- Martinez-Gonzalez, M.A.; Corella, D.; Salas-Salvadó, J.; Ros, E.; Covas, M.I.; Fiol, M.; Wärnberg, J.; Arós, F.; Ruíz-Gutiérrez, V.; Lamuela-Raventos, R.M.; et al. Cohort Profile: Design and methods of the PREDIMED study. Int. J. Epidemiol. 2010, 41, 377–385. [Google Scholar] [CrossRef] [PubMed]
- Kromhout, D.; Menotti, A.; Alberti-Fidanza, A.; Puddu, P.E.; Hollman, P.; Kafatos, A.; Tolonen, H.; Adachi, H.; Jacobs, D.R. Comparative ecologic relationships of saturated fat, sucrose, food groups, and a Mediterranean food pattern score to 50-year coronary heart disease mortality rates among 16 cohorts of the Seven Countries Study. Eur. J. Clin. Nutr. 2018, 72, 1103–1110. [Google Scholar] [CrossRef]
- Zaslavsky, O.; Zelber-Sagi, S.; Shikany, J.M.; Orchard, T.; Wallace, R.; Snetselaar, L.; Tinker, L. Anatomy of the Mediterranean Diet and Mortality Among Older Women with Frailty. J. Nutr. Gerontol. Geriatr. 2018, 37, 269–281. [Google Scholar] [CrossRef] [PubMed]
- TWHI Study. Design of the Women’s Health Initiative clinical trial and observational study. Control. Clin. Trials 1998, 19, 61–109. [Google Scholar] [CrossRef]
- Hays, J. The Women’s Health Initiative recruit-ment methods and results. Ann. Epidemiol. 2003, 13 (Suppl. S9), S18–S77. [Google Scholar] [CrossRef]
- Fried, L.P.; Tangen, C.M.; Walston, J.; Newman, A.B.; Hirsch, C.; Gottdiener, J.; Seeman, T.; Tracy, R.; Kop, W.J.; Burke, G.; et al. Frailty in Older Adults: Evidence for a Phenotype. J. Gerontol. Ser. A Biol. Sco. Med.Sci. 2001, 56, M146–M157. [Google Scholar] [CrossRef]
- Fung, T.T.; Rexrode, K.; Mantzoros, C.S.; Manson, J.E.; Willett, W.C.; Hu, F.B. Mediterranean Diet and Incidence of and Mortality From Coronary Heart Disease and Stroke in Women. Circulation 2009, 119, 1093–1100. [Google Scholar] [CrossRef] [PubMed]
- Campanella, A. The effect of the Mediterranean Diet on lifespan. A treatment-effect survival analysis of a popula-tion-based prospective cohort study in Southern Italy. Int. J. Epidemiol. 2021, 50, 245–255. [Google Scholar] [CrossRef]
- Attili, A.F.; Carulli, N.; Roda, E.; Barbara, B.; Capocaccia, L.; Menotti, A.; Okoliksanyi, L.; Ricci, G.; Festi, D.; Lalloni, L.; et al. Epidemiology of Gallstone Disease in Italy: Prevalence Data of the Multicenter Italian Study on Cholelithiasis (M.I.COL.). Am. J. Epidemiol. 1995, 141, 158–165. [Google Scholar] [CrossRef]
- Cozzolongo, R.; Osella, A.; Elba, S.; Petruzzi, J.; Buongiorno, G.; Giannuzzi, V.; Leone, G.; Bonfiglio, C.; Lanzilotta, E.; Manghisi, O.G.; et al. Epidemiology of HCV Infection in the General Population: A Survey in a Southern Italian Town. Am. J. Gastroenterol. 2009, 104, 2740–2746. [Google Scholar] [CrossRef]
- Buckland, G.; González, C.A.; Agudo, A.; Vilardell, M.; Berenguer, A.; Amiano, P.; Ardanaz, E.; Arriola, L.; Barricarte, A.; Basterretxea, M.; et al. Adherence to the Mediterranean Diet and Risk of Coronary Heart Disease in the Spanish EPIC Cohort Study. Am. J. Epidemiol. 2009, 170, 1518–1529. [Google Scholar] [CrossRef]
- Tosti, V.; Bertozzi, B.; Fontana, L. Health Benefits of the Mediterranean Diet: Metabolic and Molecular Mechanisms. J. Gerontol. A Biol. Sci. Med. Sci. 2018, 73, 318–326. [Google Scholar] [CrossRef]
- Hernaez, A. Increased Consumption of Virgin Olive Oil, Nuts, Legumes, Whole Grains, and Fish Promotes HDL Func-tions in Humans. Mol. Nutr. Food Res. 2019, 63, e1800847. [Google Scholar] [CrossRef]
- van der Kamp, J.W. The HEALTHGRAIN definition of ‘whole grain’. Food Nutr. Res. 2014, 58, 22100. [Google Scholar] [CrossRef]
- Maras, J.E.; Newby, P.; Bakun, P.J.; Ferrucci, L.; Tucker, K.L. Whole grain intake: The Baltimore Longitudinal Study of Aging. J. Food Compos. Anal. 2009, 22, 53–58. [Google Scholar] [CrossRef]
- Shock, N. Normal Human Aging: The Baltimore Longitudinal Study of Aging; US Government Printing Office: Washington, DC, USA, 1984; NIH Publication No. 84-2450. [Google Scholar]
- Sette, S.; D’Addezio, L.; Piccinelli, R.; Hopkins, S.; Le Donne, C.; Ferrari, M.; Mistura, L.; Turrini, A. Intakes of whole grain in an Italian sample of children, adolescents and adults. Eur. J. Nutr. 2015, 56, 521–533. [Google Scholar] [CrossRef]
- Ruggiero, E.; Bonaccio, M.; Di Castelnuovo, A.; Bonanni, A.; Costanzo, S.; Persichillo, M.; Bracone, F.; Cerletti, C.; Donati, M.B.; de Gaetano, G.; et al. Consumption of whole grain food and its determinants in a general Italian population: Results from the INHES study. Nutr. Metab. Cardiovasc. Dis. 2019, 29, 611–620. [Google Scholar] [CrossRef] [PubMed]
- Seal, C.; Brownlee, I. Whole-grain foods and chronic disease: Evidence from epidemiological and intervention studies. Proc. Nutr. Soc. 2015, 74, 313–319. [Google Scholar] [CrossRef] [PubMed]
- Costabile, A.; Klinder, A.; Fava, F.; Napolitano, A.; Fogliano, V.; Leonard, C.; Gibson, G.R.; Tuohy, K. Whole-grain wheat breakfast cereal has a prebiotic effect on the human gut microbiota: A double-blind, placebo-controlled, crossover study. Br. J. Nutr. 2007, 99, 110–120. [Google Scholar] [CrossRef] [PubMed]
- Giacco, R. Effects of the regular consumption of wholemeal wheat foods on cardiovascular risk factors in healthy peo-ple. Nutr. Metab. Cardiovasc. Dis. 2010, 20, 186–194. [Google Scholar] [CrossRef] [PubMed]
- Juntunen, K.S.; Laaksonen, D.; Poutanen, K.S.; Niskanen, L.K.; Mykkänen, H.M. High-fiber rye bread and insulin secretion and sensitivity in healthy postmenopausal women. Am. J. Clin. Nutr. 2003, 77, 385–391. [Google Scholar] [CrossRef] [PubMed]
- Kelly, S.; Hartley, L.; Loveman, E.; Colquitt, J.L.; Jones, H.M.; Al-Khudairy, L.; Clar, C.; Germanò, R.; Lunn, H.R.; Frost, G.; et al. Whole grain cereals for the primary or secondary prevention of cardiovascular disease. Cochrane Database Syst. Rev. 2017, 8, CD005051. [Google Scholar] [CrossRef] [PubMed]
- Kirwan, J.P.; Malin, S.; Scelsi, A.R.; Kullman, E.L.; Navaneethan, S.D.; Pagadala, M.R.; Haus, J.; Filion, J.; Godin, J.-P.; Kochhar, S.; et al. A Whole-Grain Diet Reduces Cardiovascular Risk Factors in Overweight and Obese Adults: A Randomized Controlled Trial. J. Nutr. 2016, 146, 2244–2251. [Google Scholar] [CrossRef] [PubMed]
- Marventano, S. Whole Grain Intake and Glycaemic Control in Healthy Subjects: A Systematic Review and Me-ta-Analysis of Randomized Controlled Trials. Nutrients 2017, 9, 769. [Google Scholar] [CrossRef]
- Canfora, E.; Jocken, J.W.; Blaak, E.E. Short-chain fatty acids in control of body weight and insulin sensitivity. Nat. Rev. Endocrinol. 2015, 11, 577–591. [Google Scholar] [CrossRef]
- Musa-Veloso, K. The effects of whole-grain compared with refined wheat, rice, and rye on the postprandial blood glu-cose response: A systematic review and meta-analysis of randomized controlled trials. Am. J. Clin. Nutr. 2018, 108, 759–774. [Google Scholar] [CrossRef]
- Kirø, C. Higher Whole-Grain Intake Is Associated with Lower Risk of Type 2 Diabetes among Middle-Aged Men and Women: The Danish Diet, Cancer, and Health Cohort. J. Nutr. 2018, 148, 1434–1444. [Google Scholar] [CrossRef]
- Tjonneland, A.; Olsen, A.; Boll, K.; Stripp, C.; Christensen, J.; Engholm, G.; Overvad, K. Study design, exposure variables, and socioeconomic determinants of participation in Diet, Cancer and Health: A population-based prospective cohort study of 57,053 men and women in Denmark. Scand. J. Public Health 2007, 35, 432–441. [Google Scholar] [CrossRef]
- Maki, K.C.; Palacios, O.M.; Koecher, K.; Sawicki, C.M.; Livingston, K.A.; Bell, M.; Cortes, H.N.; McKeown, N.M. The Relationship between Whole Grain Intake and Body Weight: Results of Meta-Analyses of Observational Studies and Randomized Controlled Trials. Nutrients 2019, 11, 1245. [Google Scholar] [CrossRef]
- Ma, X.; Tang, W.-G.; Yang, Y.; Zhang, Q.-L.; Zheng, J.; Xiang, Y.-B. Association between whole grain intake and all-cause mortality: A meta-analysis of cohort studies. Oncotarget 2016, 7, 61996–62005. [Google Scholar] [CrossRef] [PubMed]
- Zong, G. Whole Grain Intake and Mortality From All Causes, Cardiovascular Disease, and Cancer: A Meta-Analysis of Prospective Cohort Studies. Circulation 2016, 133, 2370–2380. [Google Scholar] [CrossRef]
- Wei, H.; Gao, Z.; Liang, R.; Li, Z.; Hao, H.; Liu, X. Whole-grain consumption and the risk of all-cause, CVD and cancer mortality: A meta-analysis of prospective cohort studies. Br. J. Nutr. 2016, 116, 514–525. [Google Scholar] [CrossRef]
- Benisi-Kohansal, S. Whole-Grain Intake and Mortality from All Causes, Cardiovascular Disease, and Cancer: A Sys-tematic Review and Dose-Response Meta-Analysis of Prospective Cohort Studies. Adv. Nutr. 2016, 7, 1052–1065. [Google Scholar] [CrossRef] [PubMed]
- Zhang, B.; Zhao, Q.; Guo, W.; Bao, W.; Wang, X. Association of whole grain intake with all-cause, cardiovascular, and cancer mortality: A systematic review and dose–response meta-analysis from prospective cohort studies. Eur. J. Clin. Nutr. 2018, 72, 57–65. [Google Scholar] [CrossRef]
- Ekmekcioglu, C. Nutrition and longevity—From mechanisms to uncertainties. Crit. Rev. Food Sci. Nutr. 2019, 60, 3063–3082. [Google Scholar] [CrossRef]
- McKeown, N.M.; Livingston, K.; Sawicki, C.M.; Miller, K.B. Evidence mapping to assess the available research on fiber, whole grains, and health. Nutr. Rev. 2020, 78, 37–42. [Google Scholar] [CrossRef]
- Gopinath, B.; Flood, V.M.; Kifley, A.; Louie, J.C.Y.; Mitchell, P. Association Between Carbohydrate Nutrition and Successful Aging Over 10 Years. J. Gerontol. Ser. A Boil. Sci. Med. Sci. 2016, 71, 1335–1340. [Google Scholar] [CrossRef] [PubMed]
- Attebo, K.; Mitchell, P.; Smith, W. Visual Acuity and the Causes of Visual Loss in Australia. Ophthalmology 1996, 103, 357–364. [Google Scholar] [CrossRef]
- Foscolou, A. The Association between Whole Grain Products Consumption and Successful Aging: A Combined Analysis of MEDIS and ATTICA Epidemiological Studies. Nutrients 2019, 11, 1221. [Google Scholar] [CrossRef] [PubMed]
- Panagiotakos, D.B. Ten-year (2002–2012) cardiovascular disease incidence and all-cause mortality, in urban Greek population: The ATTICA Study. Int. J. Cardiol. 2015, 180, 178–184. [Google Scholar] [CrossRef]
- Tyrovolas, S. Successful aging, dietary habits, and health status of elderly individulas: A k-dimensional approach within the multi-national MEDIS study. Exp. Gerontol. 2014, 60, 57–63. [Google Scholar] [CrossRef]
- Fontana, L.; Kennedy, B.; Longo, V.D.; Seals, D.; Melov, S. Medical research: Treat ageing. Nat. Cell Biol. 2014, 511, 405–407. [Google Scholar] [CrossRef]
- Goldman, D.P. Substantial health and economic returns from delayed aging may warrant a new focus for medical research. Health Aff. 2013, 32, 1698–1705. [Google Scholar] [CrossRef] [PubMed]
- Longo, V.D.; Antebi, A.; Bartke, A.; Barzilai, N.; Brown-Borg, H.M.; Caruso, C.; Curiel, T.J.; de Cabo, R.; Franceschi, C.; Gems, D.; et al. Interventions to Slow Aging in Humans: Are We Ready? Aging Cell 2015, 14, 497–510. [Google Scholar] [CrossRef] [PubMed]
- Fontana, L.; Partridge, L. Promoting Health and Longevity through Diet: From Model Organisms to Humans. Cell 2015, 161, 106–118. [Google Scholar] [CrossRef] [PubMed]
- Solon-Biet, S.M.; Mitchell, S.J.; de Cabo, R.; Raubenheimer, D.; Le Couteur, D.; Simpson, S.J. Macronutrients and caloric intake in health and longevity. J. Endocrinol. 2015, 226, R17–R28. [Google Scholar] [CrossRef]
- Weindruch, R.; Sohal, R.S. Caloric Intake and Aging. N. Engl. J. Med. 1997, 337, 986–994. [Google Scholar] [CrossRef]
- Heilbronn, L.K. Effect of 6-month calorie restriction on biomarkers of longevity, metabolic adaptation, and oxidative stress in overweight individuals: A randomized controlled trial. JAMA 2006, 295, 1539–1548. [Google Scholar] [CrossRef] [PubMed]
- Fontana, L.; Partridge, L.; Longo, V.D. Extending Healthy Life Span--From Yeast to Humans. Science 2010, 328, 321–326. [Google Scholar] [CrossRef]
- Heilbronn, L.K. Alternate-day fasting in nonobese subjects: Effects on body weight, body composition, and energy metabolism. Am. J. Clin. Nutr. 2005, 81, 69–73. [Google Scholar] [CrossRef]
- Harvie, M.N.; Pegington, M.; Mattson, M.P.; Frystyk, J.; Dillon, B.; Evans, G.; Cuzick, J.; Jebb, S.; Martin, B.; Cutler, R.G.; et al. The effects of intermittent or continuous energy restriction on weight loss and metabolic disease risk markers: A randomized trial in young overweight women. Int. J. Obes. 2010, 35, 714–727. [Google Scholar] [CrossRef] [PubMed]
- Most, J.; Tosti, V.; Redman, L.M.; Fontana, L. Calorie restriction in humans: An update. Ageing Res. Rev. 2017, 39, 36–45. [Google Scholar] [CrossRef] [PubMed]
- de Cabo, R. Effects of Intermittent Fasting on Health, Aging, and Disease. N. Engl. J. Med. 2019, 381, 2541–2551. [Google Scholar] [CrossRef]
- Stanfel, M.N. The TOR pathway comes of age. Biochim. Biophys. Acta 2009, 1790, 1067–1074. [Google Scholar] [CrossRef]
- Zimmerman, J. Nutritional control of aging. Exp. Gerontol. 2003, 38, 47–52. [Google Scholar] [CrossRef]
- Mair, W.; Morantte, I.; Rodrigues, A.P.C.; Manning, G.; Montminy, M.; Shaw, R.J.; Dillin, A. Lifespan extension induced by AMPK and calcineurin is mediated by CRTC-1 and CREB. Nat. Cell Biol. 2011, 470, 404–408. [Google Scholar] [CrossRef] [PubMed]
- Solon-Biet, S.M.; McMahon, A.C.; Ballard, J.W.O.; Ruohonen, K.; Wu, L.E.; Cogger, V.C.; Warren, A.; Huang, X.; Pichaud, N.; Melvin, R.; et al. The Ratio of Macronutrients, Not Caloric Intake, Dictates Cardiometabolic Health, Aging, and Longevity in Ad Libitum-Fed Mice. Cell Metab. 2020, 31, 654. [Google Scholar] [CrossRef]
- Fontana, L. The science of nutritional modulation of aging. Ageing Res. Rev. 2017, 39, 1–2. [Google Scholar] [CrossRef]
- Simpson, S.J.; Le Couteur, D.G.; James, D.; George, J.; Gunton, J.E.; Solon-Biet, S.; Raubenheimer, D. The Geometric Framework for Nutrition as a tool in precision medicine. Nutr. Health Aging 2017, 4, 217–226. [Google Scholar] [CrossRef]
- Raubenheimer, D.; Simpson, S.J.; Le Couteur, D.; Solon-Biet, S.; Coogan, S.C. Nutritional ecology and the evolution of aging. Exp. Gerontol. 2016, 86, 50–61. [Google Scholar] [CrossRef]
- Lee, K.P.; Simpson, S.J.; Clissold, F.J.; Brooks, R.; Ballard, J.W.O.; Taylor, P.W.; Soran, N.; Raubenheimer, D. Lifespan and reproduction in Drosophila: New insights from nutritional geometry. Proc. Natl. Acad. Sci. USA 2008, 105, 2498–2503. [Google Scholar] [CrossRef]
- Archer, C.R.; Royle, N.; South, S.; Selman, C.; Hunt, J. Nutritional Geometry Provides Food for Thought. J. Gerontol. Ser. A Boil. Sci. Med. Sci. 2009, 64, 956–959. [Google Scholar] [CrossRef][Green Version]
- Duffield, K.R. Macronutrient intake and simulated infection threat independently affect life history traits of male deco-rated crickets. Ecol. Evol. 2020, 10, 11766–11778. [Google Scholar] [CrossRef] [PubMed]
- Moatt, J.P.; Fyfe, M.A.; Heap, E.; Mitchell, L.J.M.; Moon, F.; Walling, C.A. Reconciling nutritional geometry with classical dietary restriction: Effects of nutrient intake, not calories, on survival and reproduction. Aging Cell 2019, 18, e12868. [Google Scholar] [CrossRef] [PubMed]
- Gibbs, V.K.; Smith, D.L. Nutrition and energetics in rodent longevity research. Exp. Gerontol. 2016, 86, 90–96. [Google Scholar] [CrossRef] [PubMed]
- Senior, A.M.; Solon-Biet, S.M.; Cogger, V.C.; Le Couteur, D.G.; Nakagawa, S.; Raubenheimer, D.; Simpson, S.J. Dietary macronutrient content, age-specific mortality and lifespan. Proc. R. Soc. B Boil. Sci. 2019, 286, 20190393. [Google Scholar] [CrossRef] [PubMed]
- Wali, J.A. Cardio-metabolic consequences of dietary carbohydrates: Reconciling contradictions using nutritional geometry. Cardiovasc. Res. 2021, 117, 386–401. [Google Scholar] [CrossRef] [PubMed]
- Pedersen, A.N.; Kondrup, J.; Børsheim, E. Health effects of protein intake in healthy adults: A systematic literature review. Food Nutr. Res. 2013, 57, 57. [Google Scholar] [CrossRef] [PubMed]
- Lee, D.; Son, H.G.; Jung, Y.; Lee, S.-J.V. The role of dietary carbohydrates in organismal aging. Cell. Mol. Life Sci. 2016, 74, 1793–1803. [Google Scholar] [CrossRef]
- Seidelmann, S.B.; Claggett, B.; Cheng, S.; Henglin, M.; Shah, A.; Steffen, L.M.; Folsom, A.R.; Rimm, E.B.; Willett, W.C.; Solomon, S.D. Dietary carbohydrate intake and mortality: A prospective cohort study and meta-analysis. Lancet Public Health 2018, 3, e419–e428. [Google Scholar] [CrossRef]
- Simpson, S.J.; Le Couteur, D.; Raubenheimer, D.; Solon-Biet, S.; Cooney, G.J.; Cogger, V.C.; Fontana, L. Dietary protein, aging and nutritional geometry. Ageing Res. Rev. 2017, 39, 78–86. [Google Scholar] [CrossRef]
- Le Couteur, D.G. The impact of low-protein high-carbohydrate diets on aging and lifespan. Cell. Mol. Life Sci. 2016, 73, 1237–1252. [Google Scholar] [CrossRef] [PubMed]
- Dehghan, M.; Mente, A.; Zhang, X.; Swaminathan, S.; Li, W.; Mohan, V.; Iqbal, R.; Kumar, R.; Wentzel-Viljoen, E.; Rosengren, A.; et al. Associations of fats and carbohydrate intake with cardiovascular disease and mortality in 18 countries from five continents (PURE): A prospective cohort study. Lancet 2017, 390, 2050–2062. [Google Scholar] [CrossRef]
- Miller, V. Fruit, vegetable, and legume intake, and cardiovascular disease and deaths in 18 countries (PURE): A prospective cohort study. Lancet 2017, 390, 2037–2049. [Google Scholar] [CrossRef]
- Ramsden, C.; Domenichiello, A.F. PURE study challenges the definition of a healthy diet: But key questions remain. Lancet 2017, 390, 2018–2019. [Google Scholar] [CrossRef]
- Wali, J.A.; Milner, A.J.; Luk, A.W.S.; Pulpitel, T.J.; Dodgson, T.; Facey, H.J.W.; Wahl, D.; Kebede, M.A.; Senior, A.M.; Sullivan, M.A.; et al. Impact of dietary carbohydrate type and protein–carbohydrate interaction on metabolic health. Nat. Metab. 2021, 3, 810–828. [Google Scholar] [CrossRef] [PubMed]
- Murray, C.J.L. The state of US health, 1990–2010: Burden of diseases, injuries, and risk factors. JAMA 2013, 310, 591–608. [Google Scholar] [CrossRef] [PubMed]
- Ford, D.W. Association between dietary quality and mortality in older adults: A review of the epidemiological evi-dence. J. Nutr. Gerontol. Geriatr. 2013, 32, 85–105. [Google Scholar] [CrossRef]
- Swaminathan, S.; Dehghan, M.; Raj, J.M.; Thomas, T.; Rangarajan, S.; Jenkins, D.; Mony, P.; Mohan, V.; Lear, S.; Avezum, A.; et al. Associations of cereal grains intake with cardiovascular disease and mortality across 21 countries in Prospective Urban and Rural Epidemiology study: Prospective cohort study. BMJ 2021, 372, m4948. [Google Scholar] [CrossRef]
- Masala, G.; Ceroti, M.; Pala, V.; Krogh, V.; Vineis, P.; Sacerdote, C.; Saieva, C.; Salvini, S.; Sieri, S.; Berrino, F.; et al. A dietary pattern rich in olive oil and raw vegetables is associated with lower mortality in Italian elderly subjects. Br. J. Nutr. 2007, 98, 406–415. [Google Scholar] [CrossRef]
- Carballo-Casla, A.; Ortolá, R.; García-Esquinas, E.; Oliveira, A.; Sotos-Prieto, M.; Lopes, C.; Lopez-Garcia, E.; Rodríguez-Artalejo, F. The Southern European Atlantic Diet and all-cause mortality in older adults. BMC Med. 2021, 19, 1–11. [Google Scholar] [CrossRef] [PubMed]
- Kennedy, E.T. Evidence for nutritional benefits in prolonging wellness. Am. J. Clin. Nutr. 2006, 83, 410S–414S. [Google Scholar] [CrossRef]
- Tessa, J. Physical frailty in older men: Prospective associations with diet quality and patterns. Age Ageing 2019, 48, 355–360. [Google Scholar]
- Le Couteur, D.G. New Horizons: Dietary protein, ageing and the Okinawan ratio. Age Ageing 2016, 45, 443–447. [Google Scholar] [CrossRef] [PubMed]
- Mirzaei, H.; Suarez, J.A.; Longo, V.D. Protein and amino acid restriction, aging and disease: From yeast to humans. Trends Endocrinol. Metab. 2014, 25, 558–566. [Google Scholar] [CrossRef]
- Willcox, D.C.; Willcox, B.J.; Hsueh, W.-C.; Suzuki, M. Genetic determinants of exceptional human longevity: Insights from the Okinawa Centenarian Study. AGE 2006, 28, 313–332. [Google Scholar] [CrossRef]
- Pes, G.M.; Tolu, F.; Dore, M.P.; Sechi, G.P.; Errigo, A.; Canelada, A.; Poulain, M. Male longevity in Sardinia, a review of historical sources supporting a causal link with dietary factors. Eur. J. Clin. Nutr. 2014, 69, 411–418. [Google Scholar] [CrossRef]
- Willcox, B.J.; Willcox, D.C.; Todoriki, H.; Fujiyoshi, A.; Yano, K.; He, Q.; Curb, J.D.; Suzuki, M. Caloric Restriction, the Traditional Okinawan Diet, and Healthy Aging: The Diet of the World’s Longest-Lived People and Its Potential Impact on Morbidity and Life Span. Ann. N. Y. Acad. Sci. 2007, 1114, 434–455. [Google Scholar] [CrossRef]
- Maioli, M. Sourdough-leavened bread improves postprandial glucose and insulin plasma levels in subjects with im-paired glucose tolerance. Acta Diabetol. 2008, 45, 91–96. [Google Scholar] [CrossRef]
- Capurso, C.; Bellanti, F.; Buglio, A.L.; Vendemiale, G. The Mediterranean Diet Slows Down the Progression of Aging and Helps to Prevent the Onset of Frailty: A Narrative Review. Nutrients 2020, 12, 35. [Google Scholar] [CrossRef] [PubMed]
- Voelker, R. The Mediterranean Diet’s Fight against Frailty. JAMA 2018, 319, 1971. [Google Scholar] [CrossRef] [PubMed]
- Bach-Faig, A.; Berry, E.M.; Lairon, D.; Reguant, J.; Trichopoulou, A.; Dernini, S.; Medina, F.X.; Battino, M.; Belahsen, R.; Miranda, G.; et al. Mediterranean diet pyramid today. Science and cultural updates. Public Health Nutr. 2011, 14, 2274–2284. [Google Scholar] [CrossRef]
- McKeown, T. The Role of Medicine: Dream, Mirage or Nemesis; Blackwell: Oxford, UK, 1979. [Google Scholar]
- Bunker, J.P. The role of medical care in contributing to health improvements within societies. Int. J. Epidemiol. 2001, 30, 1260–1263. [Google Scholar] [CrossRef] [PubMed]
- Borneo, R.; León, A.E. Whole grain cereals: Functional components and health benefits. Food Funct. 2012, 3, 110–119. [Google Scholar] [CrossRef] [PubMed]


| Wheat (Variety Hard, Red Winter) | Spelt (Uncooked) | Oats | Rye | Barley (Raw and Pearled) | Rice (Unenriched White Rice) | Maize (Sweetcorn, Yellow, Raw) | |
|---|---|---|---|---|---|---|---|
| Energy (KJ) | 1368 | 1415 | 1628 | 1414 | 1473 | 1498 | 1506 |
| Protein (g) | 12.61 | 14.57 | 16.89 | 10.34 | 9.91 | 6.5 | 3.27 |
| Global fats (g) | 1.54 | 2.43 | 6.9 | 1.63 | 1.16 | 0.52 | 1.35 |
| Global saturated fatty acids (g) | 0.269 | 0.406 | 1.217 | 0.197 | 0.244 | 0.140 | 0.325 |
| Global monounsaturated fatty acids (g) | 0.2 | 0.445 | 2.178 | 0.208 | 0.149 | 0.161 | 0.432 |
| Polysaturated fatty acids (g) | 0.627 | 1.258 | 2.535 | 0.767 | 0.560 | 0.138 | 0.487 |
| Carbohydrates (g) | 71.18 | 70.19 | 66.27 | 75.86 | 77.72 | 79.15 | 18.7 |
| Sugars (g) | 0.41 | 6.82 | 0 | 0.98 | 0.80 | 0 | 6.26 |
| Dietary fibers (g) | 12.2 | 10.7 | 10.6 | 15.1 | 15.6 | 0 | 2 |
| Vitamin A IU | 9 | 10 | 0 | 11 | 22 | 0 | 187 |
| Thiamine (B1) (mg; % DV) | 0.383; 33% | 0.364; 32% | 0.763; 66% | 0.316; 26% | 1.191;16% | 0.07; 6% | 0.155; 13% |
| Riboflavin (B2) (mg; % DV) | 0.115; 10% | 0.113; 9% | 0.139; 12% | 0.251; 19% | 0;0% | 0.048; 4% | 0.055; 4% |
| Niacin (B3) (mg; % DV) | 5.464; 36% | 6.843; 46% | 0.961; 6% | 4.27; 27% | 4.604;29% | 1600; 10% | 1.77; 11% |
| Pantothenic acid (B5) (mg; % DV) | 0.954; 19% | 1.068; 11% | 1.349; 27% | 1.456; 29% | 0.282;6% | 1287; 26% | 0.717; 14% |
| Vitamin B6 (mg; % DV) | 0.3; 23% | 0.230; 18% | 0.120; 9% | 0.294; 23% | 0.260;20% | 0.171; 13% | 0.093; 7% |
| Folate (B9) (μg; % DV) | 38; 10% | 45; 11% | 56; 5% | 38; 10% | 23;6% | 6; 1.5% | 42; 11% |
| Vitamin B12 (μg; % DV) | 0; 0% | 0; 0% | 0; 0% | 0; 0% | 0;0% | 0; 0% | 0; 0% |
| Vitamin E (mg; % DV) | 1.01; 7% | 0.79; 5% | 0; 0% | 0.85; 6% | 0.02;0% | 0; 0% | 0.07; 0% |
| Vitamin K (μg; % DV) | 1.9; 2% | 3.6; 3% | 0; 0% | 5.9; 5% | 2.2;2% | 0; 0% | 0.3; 0% |
| Calcium (mg; % DV) | 29; 3% | 27; 3% | 54; 5.58% | 24; 2.48% | 29;2% | 1; 0.08% | 2; 0.2% |
| Iron (mg; % DV) | 3.19; 25% | 4.44; 34% | 5; 38% | 2.63; 15% | 2.5;14% | 0.2; 1% | 0.52; 3% |
| Magnesium (mg; % DV) | 126; 35% | 136; 38% | 177; 50% | 110; 28% | 79;20% | 8; 2% | 37; 9% |
| Manganese (mg; % DV) | 3.985; 190% | 3; 143% | 4.9; 233% | 2.577; 112% | 1.322;57% | 0.357; 16% | 0.163; 7% |
| Phosphorus (mg; % DV) | 288; 41% | 401; 57% | 523; 75% | 332; 47% | 221;32% | 33; 5% | 89; 13% |
| Potassium (mg; % DV) | 363; 8% | 388; 8% | 429; 9% | 510; 11% | 280;6% | 26; 1% | 270; 6% |
| Selenium (μg; % DV) | 70.7; 129% | 11.7; 17% | Not reported | 13.9; 25% | 37.7;69% | 0; 0% | 0.6; 1% |
| Sodium (mg; % DV) | 2; 0.13% | 8; 0.53% | 2; 0.13% | 2; 0.13% | 9;0% | 0; 0% | 15; 1% |
| Zinc (mg; % DV) | 2.65; 28% | 3.28; 35% | 4; 42% | 2.65; 28% | 2.13;19% | 0.4; 4% | 0.46; 4% |
| Author and Year of Publication | Study Design | Duration of Study | Sample Size | Lipoprotein Levels and CVD |
|---|---|---|---|---|
| Mensink, 1992 [66] | Meta-analysis of 27 case-control studies | 14–91 days | 682 subjects, 474 men and 208 women | Carbohydrates in the diet replaced isocaloricalry by saturated fatty acids: Increase HDL cholesterol (p < 0.001), LDL cholesterol (p < 0.001), Total Cholesterol (p < 0.001); lower triglycerides (p < 0.001). Carbohydrates in the diet replaced isocaloricalry by monounsaturated fatty acids: Increase HDL cholesterol (p < 0.001); no effects on LDL cholesterol (p = 0.114), Total Cholesterol (p = 0.342); lower triglycerides (p < 0.001). Carbohydrates in the diet replaced isocaloricalry by polyunsaturated fatty acids: Increase HDL cholesterol (p = 0.002), LDL cholesterol (p = 0.002), Total Cholesterol (p < 0.001), triglycerides (p < 0.001). |
| Maki, 2017 [67] | Randomized, double-blind, crossover trial | 21-day treatment (54 g per day of CO or EVOO) 21-day washout | 54 volunteers, men and women | CO intake vs. EVOO intake: Total cholesterol = −0.37 vs. 0.02 mmol/L (p > 0.001); LDL = −0.36 vs. −0.08 mmol/L (p > 0.001); VLDL = −0.03 vs. 0.04 mmol/L (p > 0.001); non-HDL = −0.39 vs. −0.04 mmol/L (p > 0.001). ApoB = −9.0 vs. −2.5 mg/dl (p > 0.001). HDL = 0.02 vs. 0.05 mmol/L (p = 0.112). EVOO intake vs. CO intake: ApoA1 = 4.6 vs. 0.7 mg/dl (p = 0.016). |
| Hu, 1997 [68] Willet, 2012 [69] | Prospective Cohort Study | Follow-up: 14 years | 80,082 women, from the cohort of the Nurses’ Health Study | CHD Risk for each 5% increase in energy intake from saturated fats: RR = 1.17; 95% CI = 0.97–1.41; p = 0.10. CHD Risk for each 2% increase in energy intake from trans-unsaturated fats: RR = 1.93; 95% CI = 1.43–2.61; p = 0.001) CHD Risk for each 5% increase in energy intake from monounsaturated fats: RR = 0.81; 95% CI = 0.65–1.00; p = 0.05). CHD Risk for each 5% increase in energy intake from polyunsaturated fats: RR = 0.62; 95% CI = 0.46–0.85; p < 0.003. CHD Risk by replacing 5% energy from saturated fat with unsaturated fat: RR = 0.58; 95% CI = 0.23–0.56; p < 0.001) CHD Risk by replacing 2% of energy from trans unsaturated fat with un-hydrogenated, unsaturated fats: RR = 0.47; 95% CI = 0.34–0.67; p < 0.001. |
| Jakobsen, 2009 [70] | Meta-analysis of prospective cohort studies | Follow-up: 4 to 10 years | 344,696 subjects from 11 American and European studies included in the Pooling Project of Cohort Studies on Diet and Coronary Disease | CHD Risk by replacing 5% of energy from SFA with MUFA or PUFA or carbohydrates (CHs): MUFAs vs. SFAs: HR= 1.19; 95% CI = 1.00–1.42. PUFAs vs. SFAs: HR = 0.87; 95% CI = 0.77–0.97. CHs vs. SFAs: HR = 1.07; 95% CI = 1.01–1.14. Coronary deaths Risk by replacing 5% of energy from SFA with MUFA or PUFA or carbohydrates (CHs): MUFAs vs. SFAs: HR = 1.01; 95% CI = 0.73–1.41. PUFAs vs. SFAs: HR = 0.74; 95% CI = 0.61–0.89. CHs vs. SFAs: HR = 0.96; 95% CI = 0.82–1.13. |
| Lai, 2019 [71] | Prospective Cohort Study | Follow-up: 22 years | 3869 subjects from the cohort of the Cardiovascular Health Study (CHS) | Palmitic acid (16:0) and risk of mortality All-cause mortality: HR = 1.35; 95% CI = 1.17–1.56; p < 0.001. CVD mortality: HR = 1.44; 95% CI = 1.18–1.76; p < 0.001. Non-CVD mortality: HR = 1.36; 95% CI = 1.16–1.59; p < 0.001. Palmitoleic acid (16:1n-7) and risk of mortality All-cause mortality: HR = 1.40; 95% CI = 1.21–1.62; p < 0.001. CVD mortality: HR = 1.42; 95% CI = 1.15–1.76; p = 0.001. Non-CVD mortality: HR = 1.30; 95% CI = 1.12–1.52; p = 0.001 Stearic acid (18:0) and risk of mortality All-cause mortality: HR = 0.76; 95% CI = 0.66–0.88; p < 0.001. CVD mortality: HR = 0.77; 95% CI = 0.62–0.94; p = 0.003. Non-CVD mortality: HR = 0.72; 95% CI = 0.62–0.84; p < 0.001 Oleic acid (18:1n-9) and risk of mortality All-cause mortality: HR = 1.56; 95% CI = 1.35–1.80; p < 0.001. CVD mortality: HR = 1.48; 95% CI = 1.21–1.82; p < 0.001. Non-CVD mortality: HR = 1.50 95% CI = 1.28–1.75; p < 0.001. Palmitic acid (16:0) and risk of incident CVD Fatal and non-fatal CVD: HR = 1.20; 95% CI = 1.01–1.43; p = 0.029. Fatal and non-fatal CHD: HR = 1.13; 95% CI = 0.93–1.38; p = 0.287. Fatal and non-fatal Stroke: HR = 1.26; 95% CI = 0.96–1.66; p = 0.028. Palmitoleic acid (16:1n-7) and risk of incident CVD Fatal and non-fatal CVD: HR = 1.28; 95% CI = 1.07–1.53; p = 0.012. Fatal and non-fatal CHD: HR = 1.07; 95% CI = 0.88–1.31; p = 0.506. Fatal and non-fatal Stroke: HR = 1.38; 95% CI = 1.05–1.83; p = 0.038. Stearic acid (18:0) and risk of incident CVD Fatal and non-fatal CVD: HR = 0.82; 95% CI = 0.69–0.97; p = 0.003. Fatal and non-fatal CHD: HR = 0.93; 95% CI = 0.77–1.13; p = 0.266. Fatal and non-fatal Stroke: HR = 0.77; 95% CI = 0.59–1.00; p = 0.013. Oleic acid (18:1n-9) and risk of incident CVD Fatal and non-fatal CVD: HR = 1.33; 95% CI = 1.12–1.57; p < 0.001. Fatal and non-fatal CHD: HR = 1.23; 95% CI = 1.01–1.48; p = 0.008. Fatal and non-fatal Stroke: HR = 1.34; 95% CI = 1.02–1.75; p = 0.005. |
| Borges, 2020 [73] | Meta-analysis of prospective cohort and case-control studies | Follow-up: 10 to 25 years | 23,518 subjects from 5 cohort studies and 1 case-control study, from the UCL-LSHTM-Edinburgh-Bristol (UCLEB) Consortium | DHA and risk for CHD OR = 0.85; 95% CI = 0.76–0.95 LA and risk for CHD OR = 1.01; 95% CI = 0.87–1.18 MUFA and risk for CHD OR = 1.36; 95% CI = 1.15–1.61 SFA and risk for CHD OR = 0.94; 95% CI = 0.82–1.09 DHA and risk for Stroke OR = 0.95; 95% CI = 0.89–1.02 LA and risk for Stroke OR = 0.82; 95% CI = 0.75–0.90 MUFA and risk for Stroke OR = 1.22; 95% CI = 1.03–1.44 SFA and risk for Stroke OR = 0.94; 95% CI = 0.79–1.11 |
| Lee, 2020 [74] | Prospective Cohort Study | Follow-up: 22 years | 4249 subjects from the cohort of the Cardiovascular Health Study (CHS) | Habitual levels of plasma fatty acids and risk of incident HF palmitic acid: HR = 1.17, 95% CI 1.00–1.36; 7-hexadecenoic acid: HR = 1.05, 95% CI 0.92–1.18; vaccenic acid: HR = 1.06, 95% CI 0.92–1.22; but changes in levels were associated with a higher risk of HF (HR = 1.43, 95% CI 1.18–1.72); myristic acid: HR = 0.90, 95% CI = 0.77–1.05; palmitoleic acid: HR = 1.01, 95% CI = 0.88–1.16; stearic acid: HR = 0.94, 95% CI = 0.81–1.09; oleic acid: HR = 1.13, 95% CI = 0.98–1.30; Change in serial levels of plasma fatty acids and risk of incident HF palmitic acid: HR = 1.26 95% CI 1.03–1.55; 7-hexadecenoic acid: HR = 1.36, 95% CI 1.13–1.62; vaccenic acid: HR = 1.43, 95% CI 1.18–1.72; myristic acid: HR = 1.11, 95% CI = 0.91–1.36; palmitoleic acid: HR = 1.06, 95% CI = 0.87–1.28; stearic acid: HR = 0.94, 95% CI = 0.76–1.15; oleic acid: HR = 1.13, 95% CI = 0.93–1.37. |
| Author and Year of Publication | Study Design | Duration of Study | Sample Size | Risk of Frailty and Mortality |
|---|---|---|---|---|
| Lo, 2017 [86] | Cross-sectional study | 3 years | 923 subjects aged 65 years and older from the cohort of Nutrition and Health Survey in Taiwan (NAHSIT) | Associations between tertiles of dietary pattern score and frailty according Fried criteria: OR = 0.12 (95% CI = 0.02–0.76; p = 0.019) for tertile 3 of dietary pattern score. Associations between tertiles of dietary pattern score and pre-frailty according Fried criteria: OR = 0.40 (95% CI = 0.19–0.83; p = 0.015) for tertile 3 of dietary pattern scores. |
| Trichopoulou, 2003 [6] | Population-based, prospective study | Median duration of follow-up: 3.7 years | 8895 men and 13,148 women | All-cause death: HR = 0.75 (95% CI 0.64–0.87) for a Two-Point Increase in the Mediterranean-Diet Score Death from CHD (coronary heart disease): HR = 0.67 (95% CI 0.47–0.94) for a Two-Point Increase in the Mediterranean-Diet Score Death from cancer: HR = 0.76 (95% CI 0.59–0.98) for a Two-Point Increase in the Mediterranean-Diet Score |
| Estruch, 2018 [9] | Parallel-group, multicenter, randomized trial | Median duration of follow-up: 4.8 years | 1050 men and 1493 women with MD(Mediterranean-Diet) with EVOO(extra virgin olive oil) 1128 men and 1326 women with MD with nuts 987 men and 1463 women with Control Diet | Myocardial infarction: HR = 0.82 (95% CI 0.52–1.30) for MD with EVOO vs. Control Diet HR = 0.76 (95% CI 0.47–1.25) for MD with Nuts vs. Control Diet Stroke: HR = 0.65 (95% CI 0.44–0.95) for MD with EVOO vs. Control Diet HR = 0.54 (95% CI 0.35–0.82) for MD with Nuts vs. Control Diet Death from CVD: HR = 0.62 (95% CI 0.36–1.06) for MD with EVOO vs. Control Diet HR = 1.02 (95% CI 0.63–1.67) for MD with Nuts vs. Control Diet All-cause death: HR = 0.90 (95% CI 0.69–1.18) for MD with EVOO vs. Control Diet HR = 1.12 (95% CI 0.86–1.47) for MD with Nuts vs. Control Diet |
| Sofi, 2008 [10] | Meta-analysis of prospective cohort studies | Follow-up time range: from 3.7 to 18 years | 1,574,299 subjects from 12 studies | Mortality from CVD: RR = 0.91 (95% CI 0.87–0.95) All-cause mortality: RR = 0.91 (95% CI 0.89–0.94 Mortality from cancer: RR = 0.94 (95% CI 0.92–0.96) Incidence of Parkinson’s disease and Alzheimer’s disease: RR = 0.87 (95% CI 0.80–0.96) |
| Sofi, 2010 [11] | Meta-analysis of prospective cohort studies | Follow-up time range: from 4 to 20 years | 508,393 subjects from 7 studies | Mortality from CVD: RR = 0.90 (95% CI 0.87–0.93) All-cause mortality: RR = 0.92 (95% CI 0.90–0.94) Mortality from cancer: RR = 0.94 (95% CI 0.92–0.96) Incidence of neurodegenerative disease: RR = 0.87 (95% CI 0.81–0.94) |
| Kromhout, 2018 [89] | Prospective Cohort Study | Follow-up time: 50-years | 12,763 subjects from 16 cohorts of the Seven Countries Study. | Mortality from CVD: Inverse correlation between consumption of cereals, vegetables, legumes, and alcohol and long-term CHD mortality rates (r = −0.52 to −0.62) Direct correlation between consumption of hard fat plus sweet products, animal foods except fish, and long-term CHD mortality rates (r = 0.68 to 0.84) |
| Zaslavsky, 2018 [90] | Prospective Cohort Study | Mean follow-up: 12.4 years | 10,431 women aged 65–84 year from the cohorts of the Women’s Health Initiative Observational Study | Associations between of dietary pattern and mortality: HR = 0.91, 95% CI: 0.84–0.99, p = 0.02, for high intake of vegetables; HR = 0.87, 95% CI: 0.80–0.94, p < 0.001, for high intake of nuts; HR = 0.83, 95% CI: 0.77–0.90, p < 0.001, for high intake of whole grains. |
| Campanella, 2020 [95] | Prospective Cohort Study | Median follow-up time: 12.82, 12.91 and 12.84 years for high, medium and low rMED subjects | 5152 subjects from the cohorts of MICOL/PANEL and NUTRIHEP Study (2851 from MICOL/PANEL; 2301 from NUTRIHEP) | Associations between of dietary pattern and mortality: Direct correlation between higher adherence to the MD at baseline and mortality. Higher adherence to the MD at baseline was related to a lifespan 6.21 and 8.28 years longer. |
| Hernaez, 2019 [100] | Parallel-group, multicenter, randomized trial | Follow-up time: 1 year. | 296 subjects from the cohort of the PREDIMED Study | Association among food groups and improvements in HDL functions: Increments in cholesterol efflux capacity: +0.7% (p = 0.026) for increase in daily intake of 10 g of EVOO; +0.6% (p = 0.017) for increase in daily intake of 25 g of WG; –1.1% (p = 0.010) for increase in daily intake of 25 g of fish. Increments in PON1(Paraoxonase 1) activity: +12.2% (p = 0.049) for increase in daily intake of 30 g of nuts; +11.7% (p = 0.043) for increase in daily intake of 25 g of legume; +3.9% (p = 0.030) for increase in daily intake of 25 g of fish. Decreases in CETP(cholesteryl ester transfer protein) activity: –4.8% (p = 0.028) for increase in daily intake of 25 g of legume; –1.6%, (p = 0.021) for increase in daily intake of 25 g of fish. |
| Author and Year of Publication | Study Design | Duration of Study | Sample Size | Effect of WG Intake on Cardiovascular Risk Factors and Body Weight |
|---|---|---|---|---|
| Kelly, 2017 [110] | Meta-analysis of RCTs | Duration of studies: 12 to 16 weeks | 1414 subjects from 9 RCTs | Total CVD mortality and CVD events: Authors did not find any studies that reported significative effects of WG foods on total cardiovascular mortality or cardiovascular events. CVD risk factors (mean difference, MD; 95% CI): Body weight change (kg) = (MD −0.41; 95% CI = −1.04–0.23); BMI = (MD −0.12; 95% CI = −0.24–0.01); Total cholesterol (mmol/L) = (MD 0.07; 95% CI = −0.07–0.21); LDL cholesterol (mmol/L) = (MD 0.06; 95% CI = −0.05–0.16); HDL cholesterol (mmol/L) = (MD −0.02; 95% CI = −0.05–0.01); Triglycerides (mmol/L) = (MD 0.03; 95% CI = −0.08–0.13); SBP(systolic blood pressure) (mmHg) (MD 0.04; 95% CI = −1.67–1.75); DBP(diastolic blood pressure) (mmHg) (MD 0.16; 95% CI = −0.89–1.21). |
| Kirwan, 2016 [111] | Double-blind, randomized, controlled crossover study | Duration of study: 8 weeks, with a 10 weeks washout period between diets | 33 overweight or obese men and women. | Body weight: No significant difference between WG vs. control diets. SBP: No significant difference between WG vs. control diets (p = 0.80). DBP: WG vs. control diet = (−5.8 mm Hg (95% CI = 27.7–24.0) vs. −1.6 mm Hg (95% CI = 24.4–1.3 mm Hg), p = 0.01. Total Cholesterol and LDL Cholesterol: No significant difference between WG vs. control diets HbA1c (glycated hemoglobin): WG diet significantly lowered HbA1c (p = 0.04) FPI (fasting plasma insulin): WG diet significantly lowered FPI (p = 0.02) Adiponectin: WG vs. control diet = −0.1 mg/mL (95% CI = −0.9–0.7) vs. −1.4 mg/mL (95% CI = −2.6–−0.3), p = 0.05. |
| Marventano, 2017 [112] | Meta-analysis of RCTs | Where available, AUC(area under the curve) values range from 0 to 240 min | 206 subjects from 14 RCTs | Changes from baseline in glucose iAUC values at 120 min (MD; 95% CI): MD = −29.71 mmol x min/L; 95% CI = −43.57–−15.85 Changes from baseline in insulin iAUC values at 120min (MD; 95% CI): MD = −2.01 nmol x min/L; 95% CI = −2.88–−1.14 |
| Musa-Veloso, 2018 [114] | Meta-analysis of RCTs | Where available, AUC values range from 0 to 120 min | 274 subjects from 20 RCTs | Postprandial blood glucose AUC of WG vs. refined wheat, rice, or rye: WG vs. white wheat: AUC = −6.7 mmol/L x min; 95% CI = −25.1–11.7; p = 0.477. WG vs. endosperm rye: AUC = −5.5 mmol/L x min; 95% CI = −24.8–13.8; p = 0.576. WG vs. white rice: AUC = −40.5 mmol/L x min; 95% CI = −59.6–−21.3; p < 0.001. |
| Kirø, 2018 [115] | Prospective Cohort Study | Median follow-up: 15 years | 55,565 subjects (26,251 men, 29,214 women) from the Diet, Cancer, and Health Cohort | Increment of 16 g/day of WG intake and risk of type 2 diabetes: Men: HR = 0.89, 95% CI = 0.87, 0.91 Women: HR = 0.93, 95% CI = 0.91. 0.96 Highest vs. lowest quartile of WG intake and risk of type 2 diabetes: Men: HR = 0.66, 95% CI: 0.60–0.72, p < 0.0001 Women: HR = 0.78, 95% CI: 0.70–0.86, p < 0.0001 Increment of 50 g/day of WG intake and risk of type 2 diabetes: Men: HR = 0.88, 95% CI = 0.86–0.90 Women: HR = HR = 0.93, 95% CI = 0.90–0.96 Highest vs. lowest quartile of WG intake and risk of type 2 diabetes: Men: HR = 0.63, 95% CI: 0.58–0.69, p < 0.0001 Women: HR = 0.80, 95% CI: 0.72–0.88, p < 0.0001 |
| Maki, 2019 [117] | Meta-analysis of observational studies and RCTs | Mean duration of 3 prospective cohort studies: 8 years. Mean duration of 9 cross-sectional studies: 5 years. Mean duration of 9 RCTs: 90 days | 136,834 subjects from 12 observational studies (3 prospective cohort studies and 9 cross-sectional studies) and 973 subjects from 9 RCTs | Meta-Regression Analysis from Cross-Sectional Studies: Inverse correlation between WG consumption and BMI (r = −0.526, p = 0.0001) Qualitative Analysis from Prospective Cohort Studies: Inverse association between WG consumption and weight change, with a follow-up period from 5 to 20 years Meta-Regression of RCTs: No significant difference between WG consumption and weight change (standardized MD = −0.049 Kg; 95% CI = −0.388–0.199; p = 0.698) |
| Author and Year of Publication | Study Design | Duration of Study | Sample Size | Highest vs. Lowest Whole Grains Intake and Reduction of Mortality |
|---|---|---|---|---|
| Ma, 2016 [118] | Meta-analysis of prospective cohort studies | Median follow-up time: 5.9 to 26 years | 809,901 subjects (99,224 deaths) from 10 prospective cohort studies | WG intake and all-cause mortality: RR = 0.82; 95% CI = 0.78–0.87 Increment of 1 serving/day of WG intake and all-cause mortality risk: RR = 0.93; 95% CI = 0.89–0.97 |
| Zong, 2016 [119] | Meta-analysis of prospective cohort studies | Median follow-up time: 6 to 28 years | 786,076 subjects (97,867 deaths) form 14 prospective cohort studies | WG intake and all-cause death: RR = 0.84; 95% CI = 0.80–0.88; p < 0.001 WG intake and death from CVD: RR = 0.82; 95% CI = 0.79–0.85; p < 0.001 WG intake and death from cancer: RR = 0.88; 95% CI = 0.83–0.94; p < 0.001 Increment of 1 serving/day of WG intake and total mortality risk: RR = 0.93; 95% CI = 0.92–0.94 Increment of 1 serving/day of WG intake and CVD mortality risk: RR = 0.91; 95% CI = 0.90–0.93 Increment of 1 serving/day of WG intake and cancer mortality risk: RR = 0.95; 95% CI = 0.94–0.96 |
| Wei, 2016 [120] | Meta-analysis of prospective cohort studies | Median follow-up time: 14 years (range: 5.5–26 years) | 816,599 subjects (89,251 deaths) form 11 prospective cohort studies | WG intake and all-cause death: SRR = 0.87; 95% CI = 0.84–0.90 WG intake and death from CVD: SRR = 0.81; 95% CI = 0.75 – 0.89 WG intake and death from cancer: SRR = 0.89; 95% CI = 0.82 – 0.96 Increment of 3 serving/day of WG intake and total mortality risk: SRR = 0.81; 95% CI = 0.76 – 0.85 Increment of 3 serving/day of WG intake and CVD mortality risk: SRR = 0.74; 95% CI = 0.66 – 0.83 Increment of 3 serving/day of WG intake and cancer mortality risk: SRR = 0.91; 95% CI = 0.84 – 0.98 |
| Aune, 2016 [36] | Meta-analysis of prospective cohort studies | Follow-up time range: 3–26 years | 245,012 to 705,253 subjects (34,346 deaths from cancer; 100,726 deaths from any cause) from 45 prospective studies | WG intake and death from CHD: RR = 0.65; 95% CI = 0.52–0.83 WG intake and death from Stroke: RR = 0.85; 95% CI = 0.64–1.13 WG intake and death from CVD: RR = 0.81; 95% CI = 0.75–0.87 WG intake and death from cancer: RR = 0.89; 95% CI = 0.82–0.96 WG intake and all-cause death: RR = 0.82; 95% CI = 0.77–0.88 Increment of 3 serving/day of WG intake and total CHD mortality risk: RR = 0.81; 95% CI = 0.74–0.89 Increment of 3 serving/day of WG intake and Stroke mortality risk: RR = 0.86; 95% CI = 0.74–0.99 Increment of 3 serving/day of WG intake and CVD mortality risk: RR = 0.71; 95% CI = 0.61–0.82 Increment of 3 serving/day of WG intake and cancer mortality risk: RR = 0.85; 95% CI = 0.80–0.91 Increment of 3 serving/day of WG intake and all-cause mortality risk: RR = 0.83; 95% CI = 0.77–0.90 |
| Benisi-Kohansal, 2016 [121] | Meta-analysis of prospective cohort studies | Follow-up time range: 5.5–26 years | 2,282,603 subjects from 20 prospective cohort studies | WG intake and all-cause death: RR = 0.87; 95% CI = 0.84–0.91 WG intake and death from CVD: RR = 0.84; 95% CI = 0.78–0.89 WG intake and death from cancer: RR = 0.94; 95% CI = 0.91, 0.98 Increment of 3 serving/day of WG intake and total all-cause mortality risk: SRR = 0.83; 95% CI = 0.79–0.88 Increment of 3 serving/day of WG intake and CVD mortality risk: SRR = 0.75; 95% CI = 0.68–0.83 Increment of 3 serving/day of WG intake and cancer mortality risk: SRR = 0.90; 95% CI = 0.83–0.98 |
| Zhang, 2018 [122] | Meta-analysis of prospective cohort studies | Follow-up time range: 4–26 years | 1,041,692 subjects (96,710 deaths) from 19 prospective cohort studies | WG intake and all-cause death: RR = 0.84; 95% CI = 0.81–0.88 WG intake and death from CVD: RR = 0.83; 95% CI = 0.79–0.86 WG intake and death from cancer: RR = 0.94; 95% CI = 0.87–1.01 Increment of 1 serving/day of WG intake and total all-cause mortality risk: RR = 0.91; 95% CI = 0.90–0.93 Increment of 1 serving/day of WG intake and CVD mortality risk: RR = 0.86; 95% CI = 0.83–0.89 Increment of 1 serving/day of WG intake and cancer mortality risk: RR = 0.97; 95% CI = 0.95–0.99 |
Publisher’s Note: MDPI stays neutral with regard to jurisdictional claims in published maps and institutional affiliations. |
© 2021 by the author. Licensee MDPI, Basel, Switzerland. This article is an open access article distributed under the terms and conditions of the Creative Commons Attribution (CC BY) license (https://creativecommons.org/licenses/by/4.0/).
Share and Cite
Capurso, C. Whole-Grain Intake in the Mediterranean Diet and a Low Protein to Carbohydrates Ratio Can Help to Reduce Mortality from Cardiovascular Disease, Slow Down the Progression of Aging, and to Improve Lifespan: A Review. Nutrients 2021, 13, 2540. https://doi.org/10.3390/nu13082540
Capurso C. Whole-Grain Intake in the Mediterranean Diet and a Low Protein to Carbohydrates Ratio Can Help to Reduce Mortality from Cardiovascular Disease, Slow Down the Progression of Aging, and to Improve Lifespan: A Review. Nutrients. 2021; 13(8):2540. https://doi.org/10.3390/nu13082540
Chicago/Turabian StyleCapurso, Cristiano. 2021. "Whole-Grain Intake in the Mediterranean Diet and a Low Protein to Carbohydrates Ratio Can Help to Reduce Mortality from Cardiovascular Disease, Slow Down the Progression of Aging, and to Improve Lifespan: A Review" Nutrients 13, no. 8: 2540. https://doi.org/10.3390/nu13082540
APA StyleCapurso, C. (2021). Whole-Grain Intake in the Mediterranean Diet and a Low Protein to Carbohydrates Ratio Can Help to Reduce Mortality from Cardiovascular Disease, Slow Down the Progression of Aging, and to Improve Lifespan: A Review. Nutrients, 13(8), 2540. https://doi.org/10.3390/nu13082540