
Macronutrient Quality and All-Cause Mortality in the SUN Cohort

 , , , ,
  and
and
Abstract
1. Introduction
2. Materials and Methods
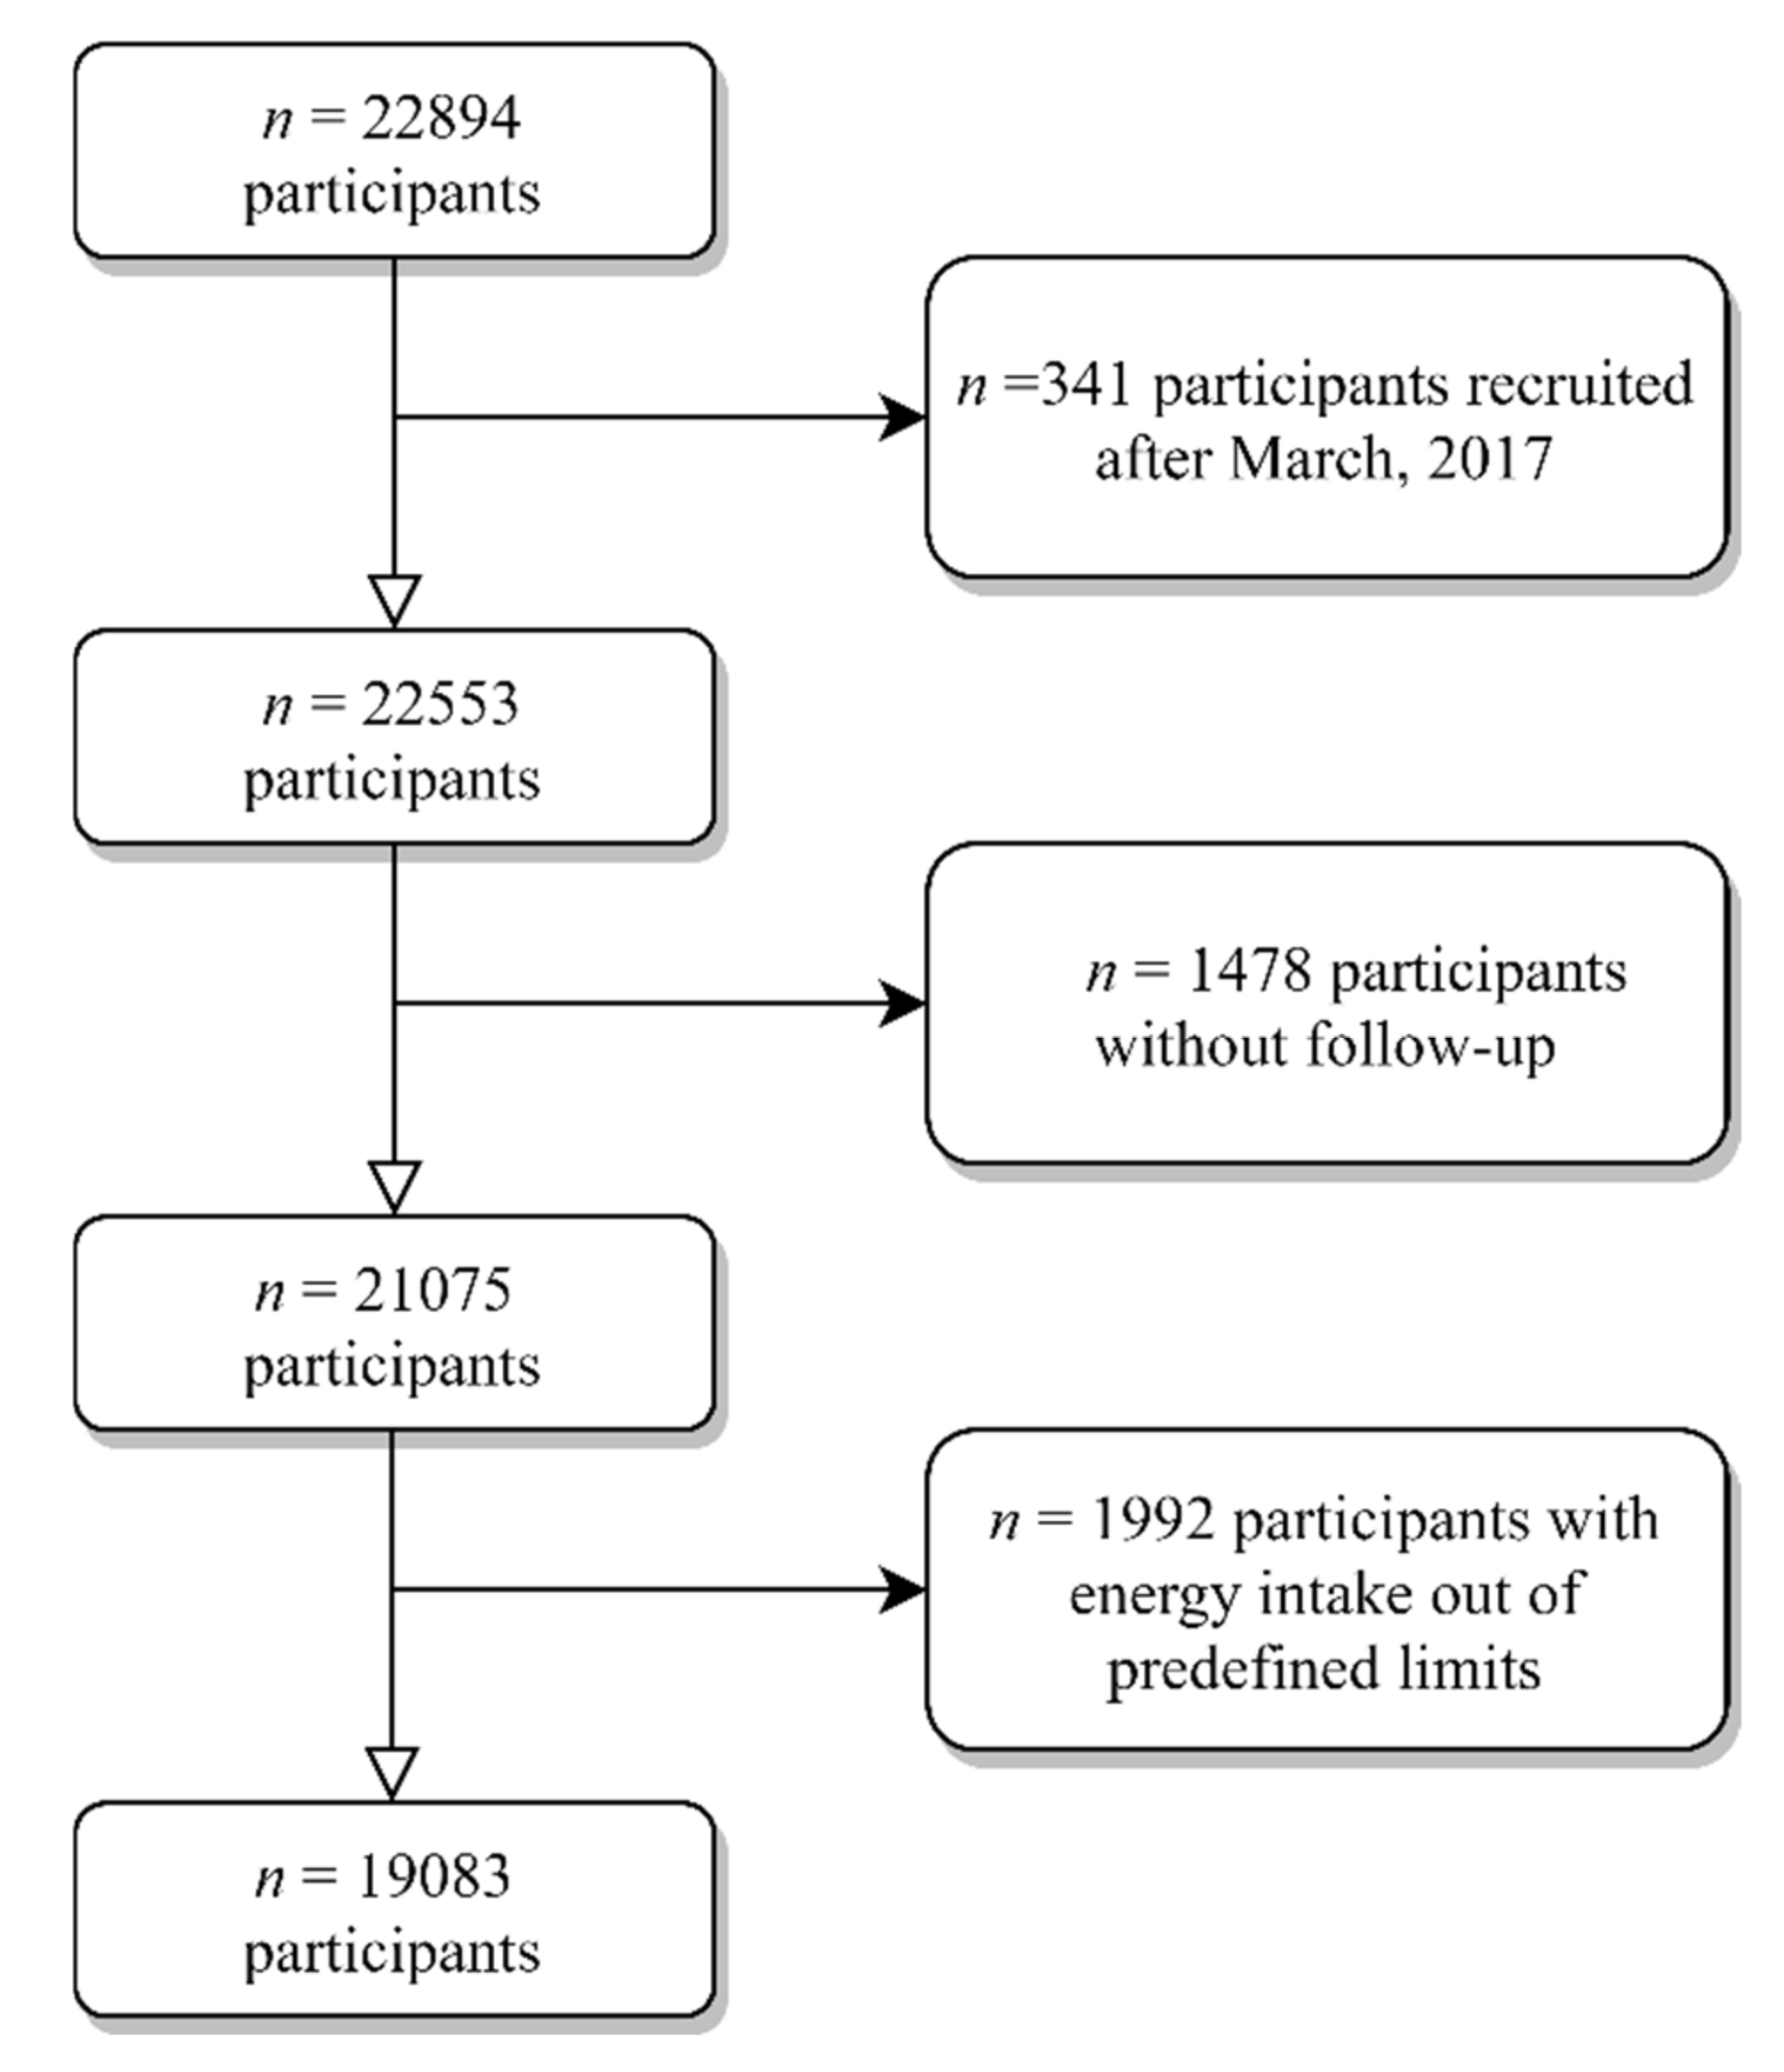
2.1. Study Design
2.2. Exposure Assessment
2.3. Outcome Assessment: All-Cause Mortality
2.4. Ascertainment of Covariates
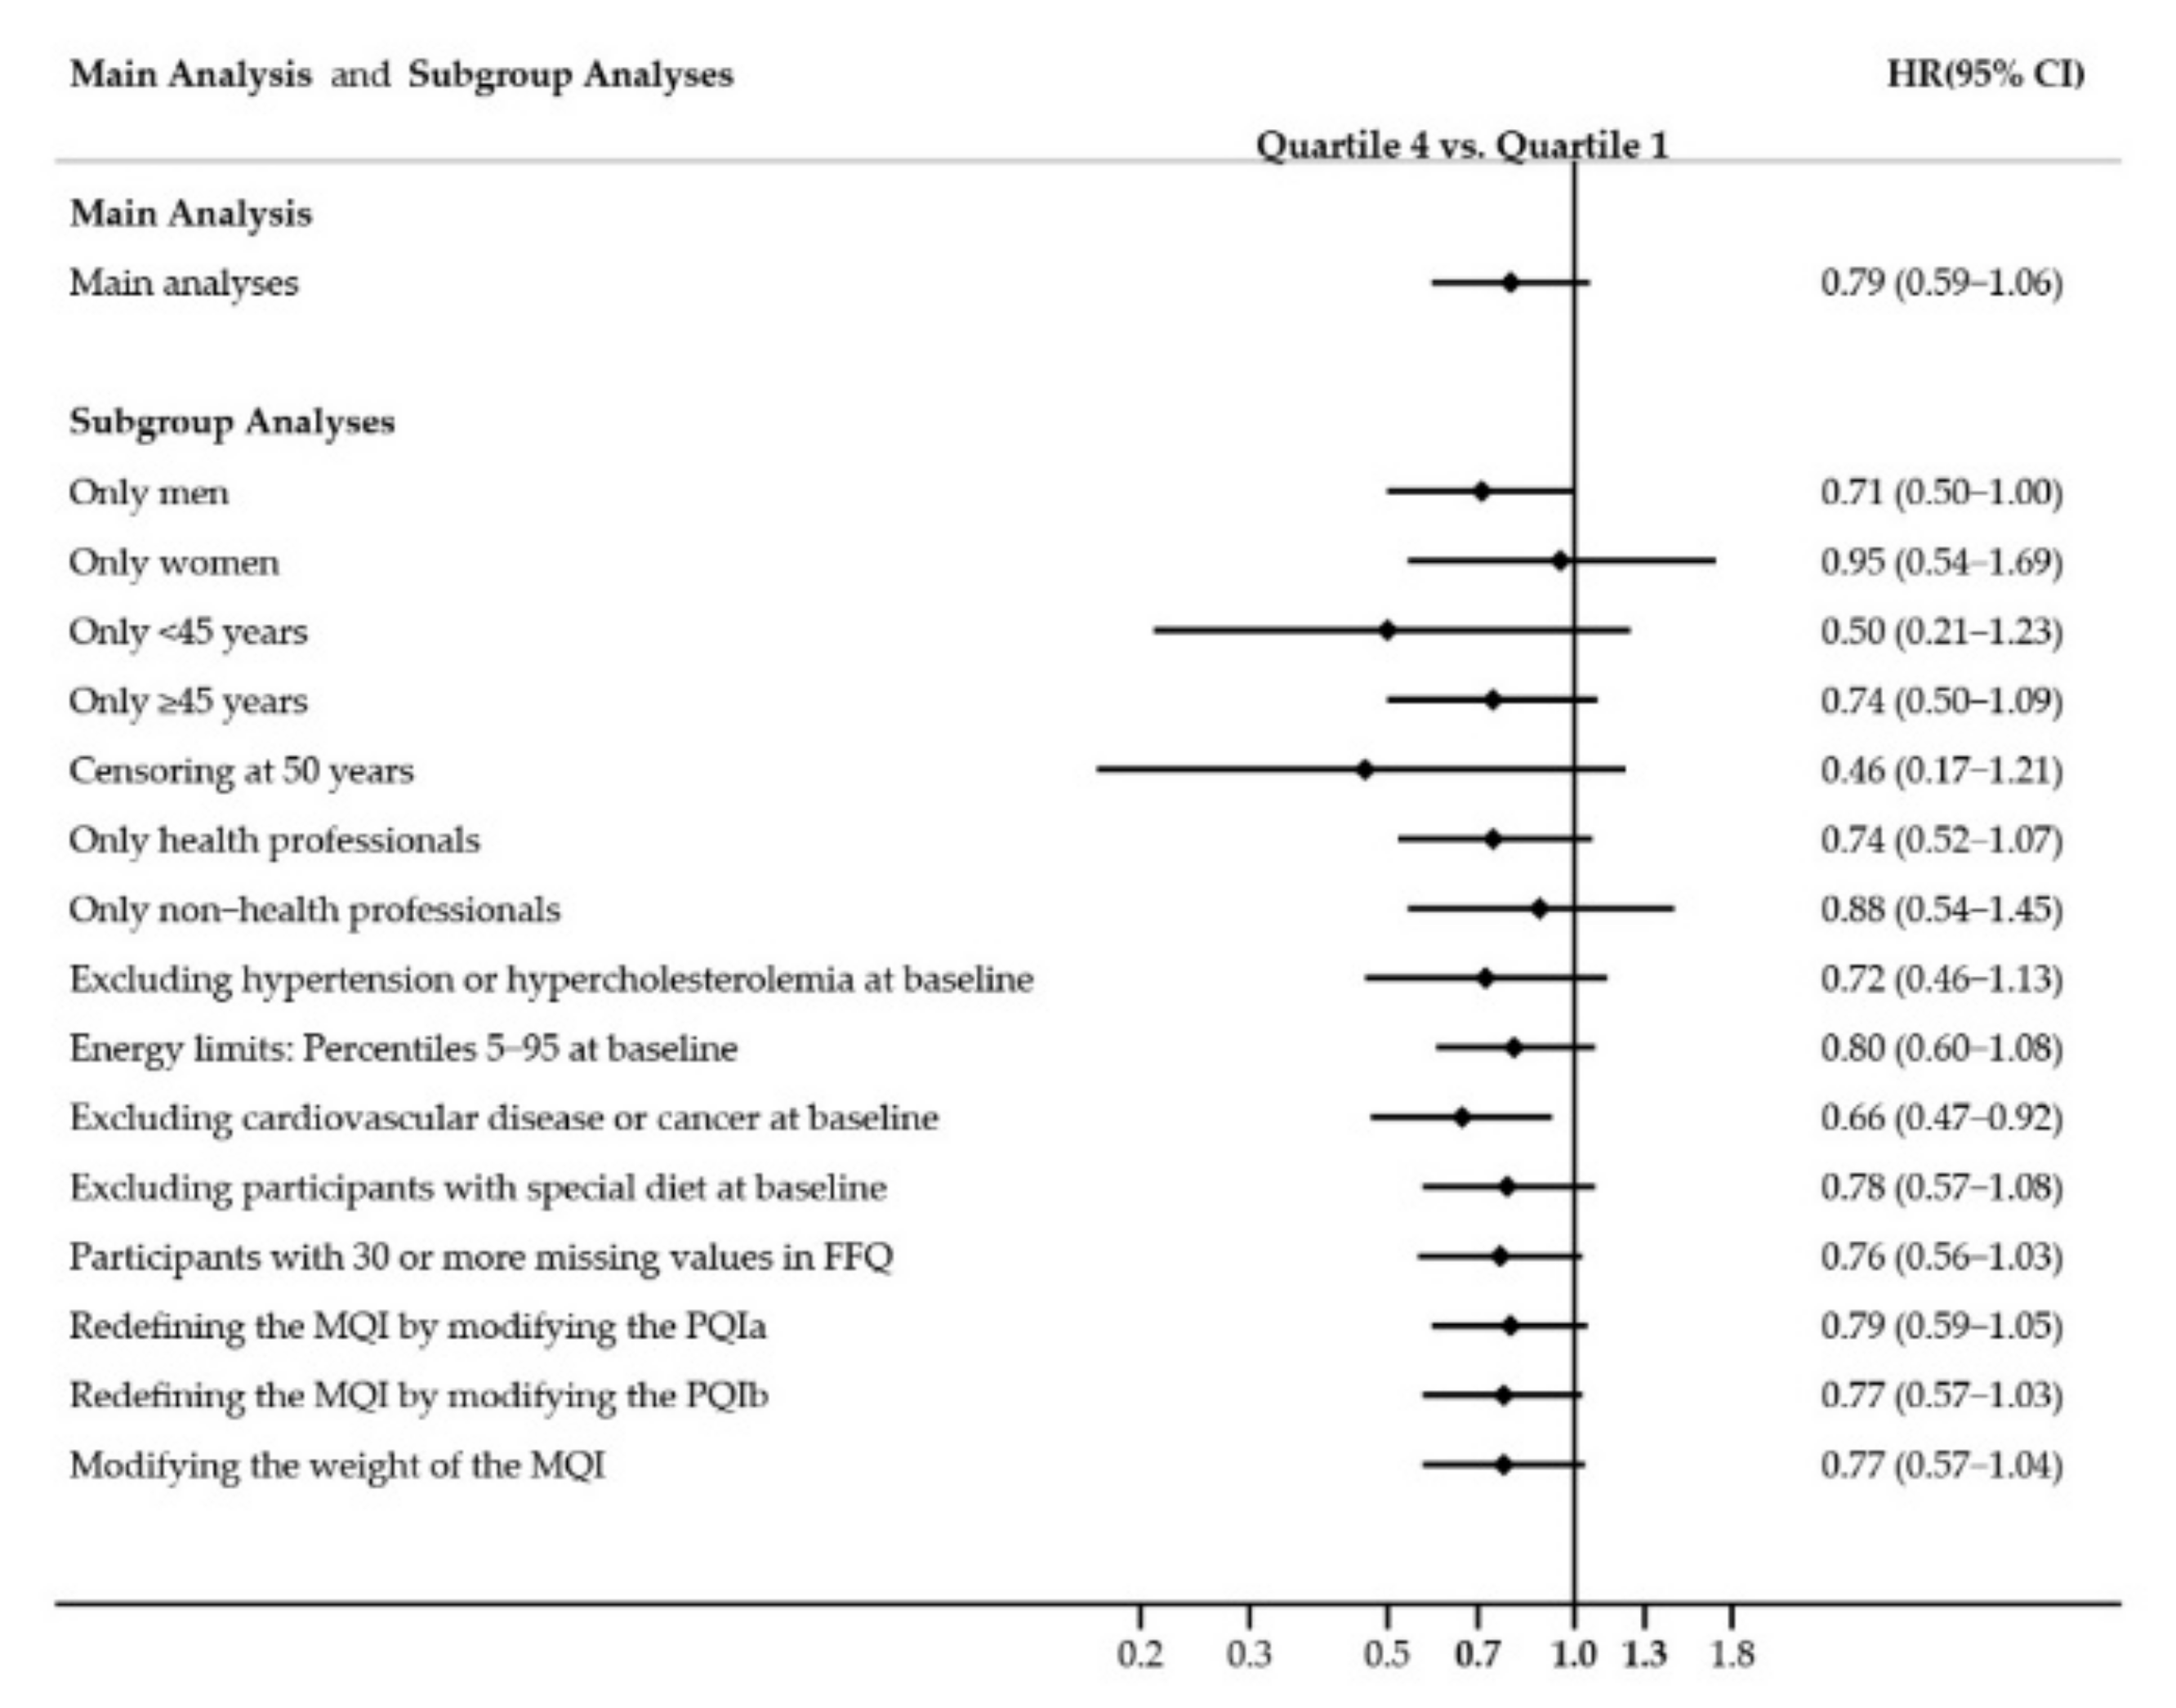
2.5. Statistical Analyses
3. Results
4. Discussion
5. Conclusions
Author Contributions
Funding
Institutional Review Board Statement
Informed Consent Statement
Data Availability Statement
Acknowledgments
Conflicts of Interest
References
- Chatelan, A.; Muka, T.; Franco, O.H. Eating to add years of life and life to these years: What should be in the menu? Am. J. Clin. Nutr. 2020, 111, 733–734. [Google Scholar] [CrossRef]
- Afshin, A.; Sur, P.J.; Fay, K.A.; Cornaby, L.; Ferrara, G.; Salama, J.S.; Mullany, E.C.; Abate, K.H.; Abbafati, C.; Abebe, Z.; et al. Health effects of dietary risks in 195 countries, 1990–2017: A systematic analysis for the Global Burden of Disease Study 2017. Lancet 2019, 393, 1958–1972. [Google Scholar] [CrossRef]
- Mozaffarian, D.; Forouhi, N.G. Dietary guidelines and health—Is nutrition science up to the task? BMJ 2018, 360. [Google Scholar] [CrossRef] [PubMed]
- Burggraf, C.; Teuber, R.; Brosig, S.; Meier, T. Review of a priori dietary quality indices in relation to their construction criteria. Nutr. Rev. 2018, 76, 747–764. [Google Scholar] [CrossRef] [PubMed]
- Waijers, P.M.C.M.; Feskens, E.J.M.; Ocké, M.C. A critical review of predefined diet quality scores. Br. J. Nutr. 2007, 97, 219–231. [Google Scholar] [CrossRef]
- Miller, V.; Webb, P.; Micha, R.; Mozaffarian, D. Defining diet quality: A synthesis of dietary quality metrics and their validity for the double burden of malnutrition. Lancet Planet. Health 2020, 4, e352–e370. [Google Scholar] [CrossRef]
- Venn, B.J. Macronutrients and human health for the 21st century. Nutrients 2020, 12, 2363. [Google Scholar] [CrossRef]
- Kwon, Y.-J.; Lee, H.S.; Park, J.-Y.; Lee, J.-W. Associating Intake Proportion of Carbohydrate, Fat, and Protein with All-Cause Mortality in Korean Adults. Nutrients 2020, 12, 3208. [Google Scholar] [CrossRef]
- Shan, Z.; Guo, Y.; Hu, F.B.; Liu, L.; Qi, Q. Association of Low-Carbohydrate and Low-Fat Diets with Mortality among US Adults. JAMA Intern. Med. 2020, 180, 513–523. [Google Scholar] [CrossRef]
- Senior, A.M.; Nakagawa, S.; Raubenheimer, D.; Simpson, S.J. Global associations between macronutrient supply and age-specific mortality. Proc. Natl. Acad. Sci. USA 2020, 117, 30824–30835. [Google Scholar] [CrossRef]
- Seidelmann, S.B.; Claggett, B.; Cheng, S.; Henglin, M.; Shah, A.; Steffen, L.M.; Folsom, A.R.; Rimm, E.B.; Willett, W.C.; Solomon, S.D. Dietary carbohydrate intake and mortality: A prospective cohort study and meta-analysis. Lancet Public Health 2018, 3, e419–e428. [Google Scholar] [CrossRef]
- Dehghan, M.; Mente, A.; Zhang, X.; Swaminathan, S.; Li, W.; Mohan, V.; Iqbal, R.; Kumar, R.; Wentzel-Viljoen, E.; Rosengren, A.; et al. Associations of fats and carbohydrate intake with cardiovascular disease and mortality in 18 countries from five continents (PURE): A prospective cohort study. Lancet 2017, 390, 2050–2062. [Google Scholar] [CrossRef]
- Astrup, A.; Magkos, F.; Bier, D.M.; Brenna, J.T.; de Oliveira Otto, M.C.; Hill, J.O.; King, J.C.; Mente, A.; Ordovas, J.M.; Volek, J.S.; et al. Saturated Fats and Health: A Reassessment and Proposal for Food-Based Recommendations: JACC State-of-the-Art Review. J. Am. Coll. Cardiol. 2020, 76, 844–857. [Google Scholar] [CrossRef]
- Kim, Y.; Je, Y.; Giovannucci, E.L. Association between dietary fat intake and mortality from all-causes, cardiovascular disease, and cancer: A systematic review and meta-analysis of prospective cohort studies. Clin. Nutr. 2020. [Google Scholar] [CrossRef]
- Qi, X.X.; Shen, P. Associations of dietary protein intake with all-cause, cardiovascular disease, and cancer mortality: A systematic review and meta-analysis of cohort studies. Nutr. Metab. Cardiovasc. Dis. 2020, 30, 1094–1105. [Google Scholar] [CrossRef] [PubMed]
- Naghshi, S.; Sadeghi, O.; Willett, W.C.; Esmaillzadeh, A. Dietary intake of total, animal, and plant proteins and risk of all cause, cardiovascular, and cancer mortality: Systematic review and dose-response meta-analysis of prospective cohort studies. BMJ 2020, 370. [Google Scholar] [CrossRef]
- Chen, Z.; Glisic, M.; Song, M.; Aliahmad, H.A.; Zhang, X.; Moumdjian, A.C.; Gonzalez-Jaramillo, V.; van der Schaft, N.; Bramer, W.M.; Ikram, M.A.; et al. Dietary protein intake and all-cause and cause-specific mortality: Results from the Rotterdam Study and a meta-analysis of prospective cohort studies. Eur. J. Epidemiol. 2020, 35, 411–429. [Google Scholar] [CrossRef] [PubMed]
- Shan, Z.; Rehm, C.D.; Rogers, G.; Ruan, M.; Wang, D.D.; Hu, F.B.; Mozaffarian, D.; Zhang, F.F.; Bhupathiraju, S.N. Trends in Dietary Carbohydrate, Protein, and Fat Intake and Diet Quality among US Adults, 1999–2016. J. Am. Med. Assoc. 2019, 322, 1178–1187. [Google Scholar] [CrossRef] [PubMed]
- Fernandez-Lazaro, C.I.; Zazpe, I.; Santiago, S.; Toledo, E.; Barbería-Latasa, M.; Martínez González, M.Á. Association of carbohydrate quality and all-cause mortality in the Sun Project: A prospective cohort study. Clin. Nutr. 2020. [Google Scholar] [CrossRef] [PubMed]
- Ludwig, D.S.; Hu, F.B.; Tappy, L.; Brand-Miller, J. Dietary carbohydrates: Role of quality and quantity in chronic disease. BMJ 2018, 361. [Google Scholar] [CrossRef]
- Reynolds, A.; Mann, J.; Cummings, J.; Winter, N.; Mete, E.; Te Morenga, L. Carbohydrate quality and human health: A series of systematic reviews and meta-analyses. Lancet 2019, 393, 434–445. [Google Scholar] [CrossRef]
- Buyken, A.E.; Goletzke, J.; Joslowski, G.; Felbick, A.; Cheng, G.; Herder, C.; Brand-Miller, J.C. Association between carbohydrate quality and inflammatory markers: Systematic review of observational and interventional studies. Am. J. Clin. Nutr. 2014, 99, 813–833. [Google Scholar] [CrossRef]
- Carlos, S.; De La Fuente-Arrillaga, C.; Bes-Rastrollo, M.; Razquin, C.; Rico-Campà, A.; Martínez-González, M.A.; Ruiz-Canela, M. Mediterranean diet and health outcomes in the SUN cohort. Nutrients 2018, 10, 439. [Google Scholar] [CrossRef] [PubMed]
- Willet, W.C. Nutritional Epidemiology, 3rd ed.; Oxford University Press: New York, NY, USA, 2013. [Google Scholar]
- De La Fuente-Arrillaga, C.; Vzquez Ruiz, Z.; Bes-Rastrollo, M.; Sampson, L.; Martinez-González, M.A. Reproducibility of an FFQ validated in Spain. Public Health Nutr. 2010, 13, 1364–1372. [Google Scholar] [CrossRef]
- Fernández-Ballart, J.D.; Piñol, J.L.; Zazpe, I.; Corella, D.; Carrasco, P.; Toledo, E.; Perez-Bauer, M.; Martínez-González, M.Á.; Salas-Salvadó, J.; Martn-Moreno, J.M. Relative validity of a semi-quantitative food-frequency questionnaire in an elderly Mediterranean population of Spain. Br. J. Nutr. 2010, 103, 1808–1816. [Google Scholar] [CrossRef]
- Martin-moreno, J.M.; Boyle, P.; Gorgojo, L.; Maisonneuve, P.; Fernandez-rodriguez, J.C.; Salvini, S.; Willett, W.C. Development and validation of a food frequency questionnaire in Spain. Int. J. Epidemiol. 1993, 22, 512–519. [Google Scholar] [CrossRef] [PubMed]
- Mataix Verdu, J. Tabla de Composición de Alimentos Españoles (Spanish Food Composition Tables), 4th ed.; Universidad de Granada: Granada, Spain, 2003. [Google Scholar]
- Moreiras, O.; Carbajal, Á.; Cabrera, L.; Cuadrado, C. Tablas de Composición de Alimentos (Food Composition Tables), 9th ed.; Pirámide: Madrid, Spain, 2005. [Google Scholar]
- Zazpe, I.; Santiago, S.; Gea, A.; Ruiz-Canela, M.; Carlos, S.; Bes-Rastrollo, M.; Martínez-González, M.A. Association between a dietary carbohydrate index and cardiovascular disease in the SUN (Seguimiento Universidad de Navarra) Project. Nutr. Metab. Cardiovasc. Dis. 2016, 26, 1048–1056. [Google Scholar] [CrossRef]
- Zazpe, I.; Sánchez-Taínta, A.; Santiago, S.; De La Fuente-Arrillaga, C.; Bes-Rastrollo, M.; Martínez, J.A.; Martínez-González, M.Á. Association between dietary carbohydrate intake quality and micronutrient intake adequacy in a Mediterranean cohort: The SUN (Seguimiento Universidad de Navarra) project. Br. J. Nutr. 2014, 111, 2000–2009. [Google Scholar] [CrossRef] [PubMed]
- Santiago, S.; Zazpe, I.; Bes-Rastrollo, M.; Sánchez-Tainta, A.; Sayón-Orea, C.; De La Fuente-Arrillaga, C.; Benito, S.; Martínez, J.A.; Martínez-González, M. Carbohydrate quality, weight change and incident obesity in a Mediterranean cohort: The SUN Project. Eur. J. Clin. Nutr. 2015, 69, 297–302. [Google Scholar] [CrossRef]
- Sánchez-Tainta, A.; Zazpe, I.; Bes-Rastrollo, M.; Salas-Salvadó, J.; Bullo, M.; Sorlí, J.V.; Corella, D.; Covas, M.I.; Arós, F.; Gutierrez-Bedmar, M.; et al. Nutritional adequacy according to carbohydrates and fat quality. Eur. J. Nutr. 2016, 55, 93–106. [Google Scholar] [CrossRef] [PubMed]
- Martínez-González, M.A.; Fernandez-Lazaro, C.I.; Toledo, E.; Diáz-López, A.; Corella, D.; Goday, A.; Romaguera, D.; Vioque, J.; Alonso-Gómez, Á.M.; Wärnberg, J.; et al. Carbohydrate quality changes and concurrent changes in cardiovascular risk factors: A longitudinal analysis in the PREDIMED-Plus randomized trial. Am. J. Clin. Nutr. 2020, 111, 291–306. [Google Scholar] [CrossRef] [PubMed]
- Bulló, M.; Papandreou, C.; Ruiz-Canela, M.; Guasch-Ferré, M.; Li, J.; Hernández-Alonso, P.; Toledo, E.; Liang, L.; Razquin, C.; Corella, D.; et al. Plasma Metabolomic Profiles of Glycemic Index, Glycemic Load, and Carbohydrate Quality Index in the PREDIMED Study. J. Nutr. 2021, 151, 50–58. [Google Scholar] [CrossRef]
- Santiago, S.; Zazpe, I.; Gea, A.; Nuñez-Córdoba, J.M.; Carlos, S.; Bes-Rastrollo, M.; Martínez-González, M.A. Fat Quality Index and Risk of Cardiovascular Disease in the Sun Project. J. Nutr. Health Aging 2018, 22, 526–533. [Google Scholar] [CrossRef]
- Ojeda-Rodríguez, A.; Zazpe, I.; Alonso-Pedrero, L.; Zalba, G.; Guillen-Grima, F.; Martinez-Gonzalez, M.A.; Marti, A. Association between diet quality indexes and the risk of short telomeres in an elderly population of the SUN project. Clin. Nutr. 2020, 39, 2487–2494. [Google Scholar] [CrossRef] [PubMed]
- U.S. Department of Health and Human Services; U.S. Department of Agriculture. 2015–2020 Dietary Guidelines for Americans. Available online: http://health.gov/dietaryguidelines/2015/guidelines/ (accessed on 15 December 2020).
- Harvard T.H. Chan School of Public. The Nutrition Source. What Should I Eat? Available online: https://www.hsph.harvard.edu/nutritionsource/what-should-you-eat/protein/ (accessed on 15 December 2020).
- Institute of Medicine. Dietary Reference Intakes: Dietary Reference Intakes for Energy, Carbohydrate, Fiber, Fat, Fatty Acids, Cholesterol, Protein, and Amino Acids (Macronutrients); National Academy Press: Washington, DC, USA, 2005. [Google Scholar] [CrossRef]
- Harvard T.H. Chan School of Public. Healthy Eating Plate | The Nutrition Source. Available online: https://www.hsph.harvard.edu/nutritionsource/healthy-eating-plat (accessed on 15 December 2020).
- Martínez-González, M.A.; López-Fontana, C.; Varo, J.J.; Sánchez-Villegas, A.; Martinez, J.A. Validation of the Spanish version of the physical activity questionnaire used in the Nurses’ Health Study and the Health Professionals’ Follow-Up Study. Public Health Nutr. 2005, 8, 920–927. [Google Scholar] [CrossRef] [PubMed]
- Bes-Rastrollo, M.; Pérez Valdivieso, J.R.; Sánchez-Villegas, A.; Alonso, Á.; Martínez-González, M. Validación del peso e índice de masa corporal auto-declarados de los participantes de una cohorte de graduados universitarios [Validation of self-reported weight and body mass index in a cohort of university graduates]. Rev. Esp. Obes. 2005, 3, 352–358. [Google Scholar]
- Trichopoulou, A.; Costacou, T.; Bamia, C.; Trichopoulos, D. Adherence to a Mediterranean Diet and Survival in a Greek Population. N. Engl. J. Med. 2003, 348, 2599–2608. [Google Scholar] [CrossRef] [PubMed]
- Martínez-González, M.A.; Gea, A.; Ruiz-Canela, M. The Mediterranean Diet and Cardiovascular Health: A Critical Review. Circ. Res. 2019, 124, 779–798. [Google Scholar] [CrossRef]
- Alonso, A.; Beunza, J.J.; Delgado-Rodríguez, M.; Martínez-González, M.A. Validation of self reported diagnosis of hypertension in a cohort of university graduates in Spain. BMC Public Health 2005, 5, 1–7. [Google Scholar] [CrossRef]
- Fernández-Montero, A.; Beunza, J.J.; Bes-Rastrollo, M.; Barrio, M.T.; de la Fuente-Arrillaga, C.; Moreno-Galarraga, L.; Martínez-González, M.A. Validación de los componentes del síndrome metabólico autodeclarados en un estudio de cohortes. Gac. Sanit. 2011, 25, 303–307. [Google Scholar] [CrossRef] [PubMed]
- Morales, G.; Martínez-González, M.A.; Barbería-Latasa, M.; Bes-Rastrollo, M.; Gea, A. Mediterranean diet, alcohol-drinking pattern and their combined effect on all-cause mortality: The Seguimiento Universidad de Navarra (SUN) cohort. Eur. J. Nutr. 2020. [Google Scholar] [CrossRef]
- Yang, Y.; Zhao, L.G.; Wu, Q.J.; Ma, X.; Xiang, Y.B. Association between dietary fiber and lower risk of all-cause mortality: A meta-analysis of cohort studies. Am. J. Epidemiol. 2015, 181, 83–91. [Google Scholar] [CrossRef] [PubMed]
- Clar, C.; Al-Khudairy, L.; Loveman, E.; Kelly, S.A.M.; Hartley, L.; Flowers, N.; Germanò, R.; Frost, G.; Rees, K. Low glycaemic index diets for the prevention of cardiovascular disease. Cochrane Database Syst. Rev. 2017, 7, CD004467. [Google Scholar] [CrossRef] [PubMed]
- Ho, F.K.; Gray, S.R.; Welsh, P.; Petermann-Rocha, F.; Foster, H.; Waddell, H.; Anderson, J.; Lyall, D.; Sattar, N.; Gill, J.M.R.; et al. Associations of fat and carbohydrate intake with cardiovascular disease and mortality: Prospective cohort study of UK Biobank participants. BMJ 2020, 368. [Google Scholar] [CrossRef] [PubMed]
- Hardy, D.S.; Garvin, J.T.; Xu, H. Carbohydrate quality, glycemic index, glycemic load and cardiometabolic risks in the US, Europe and Asia: A dose–response meta-analysis. Nutr. Metab. Cardiovasc. Dis. 2020, 30, 853–871. [Google Scholar] [CrossRef]
- Ekmekcioglu, C. Nutrition and longevity–From mechanisms to uncertainties. Crit. Rev. Food Sci. Nutr. 2020, 60, 3063–3082. [Google Scholar] [CrossRef]
- Basterra-Gortari, F.J.; Bes-Rastrollo, M.; Forga, L.; Martínez, J.A.; Martínez-González, M.A. Validity of self-reported body mass index in the National Health Survey. Anales Sist. Sanit. Navar. 2007, 30, 373–381. [Google Scholar]
- Harcombe, Z. US dietary guidelines: Is saturated fat a nutrient of concern? Br. J. Sports Med. 2019, 53, 1393–1396. [Google Scholar] [CrossRef]
- Billingsley, H.E.; Carbone, S. The antioxidant potential of the Mediterranean diet in patients at high cardiovascular risk: An in-depth review of the PREDIMED. Nutr. Diabetes 2018, 8, 13. [Google Scholar] [CrossRef]
- Estruch, R.; Ros, E.; Salas-Salvadó, J.; Covas, M.-I.; Corella, D.; Arós, F.; Gómez-Gracia, E.; Ruiz-Gutiérrez, V.; Fiol, M.; Lapetra, J.; et al. Primary Prevention of Cardiovascular Disease with a Mediterranean Diet Supplemented with Extra-Virgin Olive Oil or Nuts. N. Engl. J. Med. 2018, 378, e34. [Google Scholar] [CrossRef] [PubMed]
- Guasch-Ferré, M.; Babio, N.; Martínez-González, M.A.; Corella, D.; Ros, E.; Martín-Peláez, S.; Estruch, R.; Arós, F.; Gómez-Gracia, E.; Fiol, M.; et al. Dietary fat intake and risk of cardiovascular disease and all-cause mortality in a population at high risk of cardiovascular disease. Am. J. Clin. Nutr. 2015, 102, 1563–1573. [Google Scholar] [CrossRef]
- Li, Y.; Hruby, A.; Bernstein, A.M.; Ley, S.H.; Wang, D.D.; Chiuve, S.E.; Sampson, L.; Rexrode, K.M.; Rimm, E.B.; Willett, W.C.; et al. Saturated Fats Compared with Unsaturated Fats and Sources of Carbohydrates in Relation to Risk of Coronary Heart Disease A Prospective Cohort Study. J. Am. Coll. Cardiol. 2015, 66, 1538–1548. [Google Scholar] [CrossRef]
- Hooper, L.; Martin, N.; Abdelhamid, A.; Davey Smith, G. Reduction in saturated fat intake for cardiovascular disease. Cochrane Database Syst. Rev. 2015, 6, CD011737. [Google Scholar] [CrossRef] [PubMed]
- Wang, X.; Lin, X.; Ouyang, Y.Y.; Liu, J.; Zhao, G.; Pan, A.; Hu, F.B. Red and processed meat consumption and mortality: Dose-response meta-analysis of prospective cohort studies. Public Health Nutr. 2016, 19, 893–905. [Google Scholar] [CrossRef]
- Burd, N.A.; McKenna, C.F.; Salvador, A.F.; Paulussen, K.J.M.; Moore, D.R. Dietary protein quantity, quality, and exercise are key to healthy living: A muscle-centric perspective across the lifespan. Front. Nutr. 2019, 6, 83. [Google Scholar] [CrossRef] [PubMed]
- Katz, D.L.; Doughty, K.N.; Geagan, K.; Jenkins, D.A.; Gardner, C.D. Perspective: The Public Health Case for Modernizing the Definition of Protein Quality. Adv. Nutr. 2019, 10, 755–764. [Google Scholar] [CrossRef]
- Martínez-González, M.A.; Sánchez-Tainta, A.; Corella, D.; Salas-Salvadó, J.; Ros, E.; Arós, F.; Gómez-Gracia, E.; Fiol, M.; Lamuela-Raventós, R.M.; Schröder, H.; et al. A provegetarian food pattern and reduction in total mortality in the Prevención con Dieta Mediterránea (PREDIMED) study. Am. J. Clin. Nutr. 2014, 100 (Suppl. S1), 320S–328S. [Google Scholar] [CrossRef] [PubMed]
- Fung, T.T.; Chiuve, S.E.; McCullough, M.L.; Rexrode, K.M.; Logroscino, G.; Hu, F.B. Adherence to a DASH-style diet and risk of coronary heart disease and stroke in women. Arch. Intern. Med. 2008, 168, 713–720. [Google Scholar] [CrossRef]


| Components of Macronutrient Quality Index | Index Range (Points) | Criteria for Minimum Index | Criteria for Maximum Index |
|---|---|---|---|
| Carbohydrate quality index (CQI) | 1–5 | Minimum CQI (first quintile) | Maximum CQI (fifth quintile) |
| Fat quality index (FQI) | 1–5 | Minimum FQI (first quintile) | Maximum FQI (fifth quintile) |
| Healthy Plate Protein quality index (HPPQI) | 1–5 | Minimum HPPQI (first quintile) | Maximum HPPQI (fifth quintile) |
| Total index (range) | 3–15 |
| Characteristics | Q1 | Q2 | Q3 | Q4 |
|---|---|---|---|---|
| n (frequency) | 6646 | 4509 | 3906 | 4022 |
| MQI range | <8 | 8–9 | 10–11 | >11 |
| Marital status | ||||
| Single | 42.8 | 43.4 | 43.4 | 45.9 |
| Married | 52.1 | 50.8 | 50.9 | 47.5 |
| Widowed | 1.0 | 1.2 | 1.0 | 0.8 |
| Others | 4.2 | 4.7 | 4.7 | 5.7 |
| Years at university | 5.1 (1.5) | 5.1 (1.6) | 5.0 (1.5) | 5.0 (1.5) |
| Smoking (%) | ||||
| Never smoker | 47.0 | 46.0 | 49.6 | 49.4 |
| Current smoker | 28.6 | 28.7 | 29.7 | 32.0 |
| Former smoker | 24.4 | 25.3 | 20.7 | 18.6 |
| Cumulative smoking habit (packs-years) | 6.1 (10.1) | 6.1 (10.1) | 5.7 (9.6) | 5.5 (9.1) |
| Alcohol intake (g/d) | ||||
| Never | 18.5 | 17.3 | 17.3 | 18.0 |
| <5 women/<10 men | 48.4 | 48.4 | 48.3 | 49.4 |
| 5–25 women/10–50 men | 31.3 | 32.2 | 32.3 | 31.2 |
| >25 women/>50 men | 1.9 | 2.1 | 2.1 | 1.4 |
| Physical activity (METs-h/week) | 19.1 (20.7) | 20.7 (21.8) | 23.0 (24.5) | 26.3 (25.9) |
| Body mass index (kg/m2) | 23.5 (3.6) | 23.6 (3.5) | 23.7 (3.6) | 23.5 (3.5) |
| Time spent sitting (h/d) | 5.3 (2.1) | 5.3 (2.0) | 5.2 (2.0) | 5.2 (2.0) |
| Snacking between meals (% Yes) | 35.4 | 34.3 | 31.5 | 29.5 |
| Special diet (% Yes) | 5.2 | 7.1 | 9.3 | 14.6 |
| Medically-diagnosed conditions at baseline | ||||
| Prevalent diabetes (%) | 1.6 | 2.0 | 2.5 | 2.2 |
| Prevalent hypertension (%) | 10.3 | 10.8 | 11.5 | 12.7 |
| Prevalent dyslipemia (%) | 6.1 | 6.9 | 7.7 | 7.8 |
| Prevalent cardiovascular disease (%) 3 | 4.5 | 4.2 | 4.9 | 5.0 |
| Prevalent cancer (%) | 2.6 | 2.4 | 2.4 | 2.8 |
| Dietary variables | ||||
| Trichopoulou’s MedDiet score | 2.6 (1.3) | 3.6 (1.3) | 4.4 (1.3) | 5.3 (1.3) |
| Total energy intake (kcal/d) | 2304 (613) | 2355 (618) | 2369 (633) | 2364 (620) |
| Carbohydrate intake, % E | 41.7 (7.3) | 43.0 (7.1) | 43.9 (7.2) | 45.6 (7.8) |
| Fat intake, % E | 37.8 (6.1) | 36.7 (6.3) | 35.9 (6.6) | 34.3 (7.0) |
| Protein intake, % E | 18.4 (3.3) | 18.2 (3.1) | 18.1 (3.5) | 18.2 (3.5) |
| Q1 | Q2 | Q3 | Q4 | p for Trend | |
|---|---|---|---|---|---|
| n (frequency) | 6646 | 4509 | 3906 | 4022 | |
| MQI range | <8 | 8–9 | 10–11 | >11 | |
| Deaths | 138 | 102 | 113 | 87 | |
| Person-years | 79,526 | 52,396 | 44,304 | 43,661 | |
| Mortality rate/1000 person years | 1.74 | 1.95 | 2.55 | 1.99 | |
| Crude model | 1.00 (Ref.) | 1.10 (0.85–1.42) | 1.43 (1.12–1.84) | 1.10 (0.84–1.44) | 0.214 |
| Model 1 | 1.00 (Ref.) | 0.98 (0.75–1.27) | 1.10 (0.85–1.42) | 0.71 (0.54–0.94) | 0.035 |
| Model 2 | 1.00 (Ref.) | 1.07 (0.83–1.39) | 1.20 (0.93–1.56) | 0.84 (0.63–1.12) | 0.408 |
| Model 3 | 1.00 (Ref.) | 1.03 (0.79–1.34) | 1.15 (0.89–1.50) | 0.79 (0.59–1.06) | 0.199 |
| CQI | Q1 | Q2 | Q3 | Q4 | p for Trend |
|---|---|---|---|---|---|
| n (frequency) | 6038 | 4281 | 5366 | 3398 | |
| CQI range | <10 | 10–11 | 12–14 | >14 | |
| Deaths | 139 | 109 | 129 | 63 | |
| Person-years | 71,607 | 50,014 | 60,962 | 37,303 | |
| Mortality rate/1000 person years | 1.94 | 2.18 | 2.12 | 1.69 | |
| Crude model | 1.00 (Ref.) | 1.12 (0.87–1.44) | 1.06 (0.83–1.35) | 0.84 (0.62–1.13) | 0.337 |
| Model 1 | 1.00 (Ref.) | 0.87 (0.67–1.12) | 0.86 (0.67–1.10) | 0.57 (0.42–0.78) | 0.001 |
| Model 2 | 1.00 (Ref.) | 0.98 (0.75–1.27) | 0.97 (0.75–1.25) | 0.66 (0.48–0.91) | 0.024 |
| Model 3 | 1.00 (Ref.) | 0.99 (0.76–1.28) | 0.99 (0.77–1.28) | 0.65 (0.47–0.90) | 0.023 |
| Model 4 | 1.00 (Ref.) | 0.97 (0.74–1.27) | 0.96 (0.73–1.27) | 0.64 (0.45–0.90) | 0.021 |
| FQI | Q1 | Q2 | Q3 | Q4 | p for Trend |
| n (frequency) | 4771 | 4771 | 4771 | 4770 | |
| FQI range | <1.40 | 1.40–1.61 | 1.62–1.90 | >1.90 | |
| Deaths | 116 | 93 | 108 | 123 | |
| Person-years | 55,424 | 56,039 | 54,355 | 54,069 | |
| Mortality rate/1000 person years | 2.10 | 1.66 | 1.99 | 2.27 | |
| Crude model | 1.00 (Ref.) | 0.78 (0.59–1.03) | 0.94 (0.72–1.22) | 1.07 (0.83–1.37) | 0.276 |
| Model 1 | 1.00 (Ref.) | 0.90 (0.69–1.19) | 0.90 (0.69–1.18) | 0.91 (0.70–1.18) | 0.547 |
| Model 2 | 1.00 (Ref.) | 0.93 (0.70–1.24) | 0.99 (0.75–1.30) | 0.94 (0.72–1.22) | 0.723 |
| Model 3 | 1.00 (Ref.) | 0.89 (0.67–1.18) | 0.92 (0.70–1.21) | 0.86 (0.66–1.12) | 0.337 |
| Model 5 | 1.00 (Ref.) | 0.85 (0.64–1.13) | 0.86 (0.65–1.14) | 0.75 (0.56–1.00) | 0.070 |
| HPPQI | Q1 | Q2 | Q3 | Q4 | p for Trend |
| n (frequency) | 4771 | 4771 | 4771 | 4770 | |
| PQI range | <0.65 | 0.65–0.93 | 0.93–1.38 | >1.38 | |
| Deaths | 115 | 87 | 103 | 135 | |
| Person-years | 58,047 | 55,988 | 53,819 | 52,032 | |
| Mortality rate/1000 person years | 1.98 | 1.55 | 1.91 | 2.59 | |
| Crude model | 1.00 (Ref.) | 0.77 (0.59–1.02) | 0.93 (0.71–1.21) | 1.26 (0.98–1.61) | 0.007 |
| Model 1 | 1.00 (Ref.) | 0.71 (0.54–0.94) | 0.72 (0.55–0.94) | 0.82 (0.63–1.05) | 0.470 |
| Model 2 | 1.00 (Ref.) | 0.81 (0.61–1.08) | 0.79 (0.60–1.04) | 0.97 (0.74–1.25) | 0.781 |
| Model 3 | 1.00 (Ref.) | 0.79 (0.60–1.05) | 0.73 (0.55–0.97) | 0.92 (0.70–1.19) | 0.945 |
| Model 6 | 1.00 (Ref.) | 0.80 (0.60–1.07) | 0.74 (0.55–0.99) | 0.93 (0.69–1.25) | 0.844 |
| Updated Diet 1 | Q1 | Q2 | Q3 | Q4 | p for Trend |
|---|---|---|---|---|---|
| MQI range | <7 | 7–9 | 10–11 | >11 | |
| Deaths | 93 | 149 | 107 | 91 | |
| Person-years | 56,297 | 77,428 | 42,972 | 43,190 | |
| Mortality rate/1000 person years | 1.65 | 1.92 | 2.49 | 2.11 | |
| Crude model | 1.00 (Ref.) | 1.18 (0.91–1.53) | 1.53 (1.16–2.02) | 1.25 (0.94–1.67) | 0.044 |
| Model 1 | 1.00 (Ref.) | 1.04 (0.80–1.36) | 1.14 (0.86–1.52) | 0.81 (0.60–1.10) | 0.211 |
| Model 2 | 1.00 (Ref.) | 1.11 (0.85–1.44) | 1.25 (0.93–1.67) | 0.97 (0.71–1.32) | 0.953 |
| Model 3 | 1.00 (Ref.) | 1.06 (0.81–1.38) | 1.19 (0.89–1.60) | 0.90 (0.66–1.23) | 0.610 |
| Cumulative Diet Average 2 | Q1 | Q2 | Q3 | Q4 | p for Trend |
| MQI range | >7.5 | 7.5–9 | 9.5–11 | >11 | |
| Deaths | 137 | 104 | 110 | 89 | |
| Person-years | 79,578 | 53,326 | 44,228 | 42,754 | |
| Mortality rate/1000 person years | 1.72 | 1.95 | 2.49 | 2.08 | |
| Crude model | 1.00 (Ref.) | 1.10 (0.85–1.42) | 1.41 (1.10–1.81) | 1.17 (0.89–1.52) | 0.095 |
| Model 1 | 1.00 (Ref.) | 0.97 (0.75–1.25) | 1.09 (0.84–1.41) | 0.75 (0.57–0.99) | 0.079 |
| Model 2 | 1.00 (Ref.) | 1.06 (0.82–1.38) | 1.19 (0.92–1.55) | 0.90 (0.67–1.20) | 0.630 |
| Model 3 | 1.00 (Ref.) | 1.02 (0.78–1.33) | 1.16 (0.89–1.51) | 0.84 (0.63–1.12) | 0.367 |
| Updated Diet 1 | Q1 | Q2 | Q3 | Q4 | p for Trend |
|---|---|---|---|---|---|
| CQI range | <10 | 10–11 | 12–14 | >14 | |
| Deaths | 136 | 108 | 129 | 67 | |
| Person-years | 69,854 | 48,971 | 62,043 | 39,018 | |
| Mortality rate/1000 person years | 1.95 | 2.21 | 2.08 | 1.71 | |
| Crude model | 1.00 (Ref.) | 1.13 (0.87–1.45) | 1.02 (0.80–1.29) | 0.82 (0.61–1.10) | 0.194 |
| Model 1 | 1.00 (Ref.) | 0.92 (0.69–1.16) | 0.87 (0.68–1.12) | 0.60 (0.44–0.81) | 0.002 |
| Model 2 | 1.00 (Ref.) | 1.00 (0.77–1.30) | 0.97 (0.75–1.25) | 0.69 (0.51–0.94) | 0.031 |
| Model 3 | 1.00 (Ref.) | 1.01 (0.78–1.31) | 1.00 (0.77–1.29) | 0.68 (0.50–0.93) | 0.032 |
| Model 4 | 1.00 (Ref.) | 1.00 (0.76–1.31) | 0.97 (0.74–1.28) | 0.68 (0.49–0.94) | 0.031 |
| Cumulative Diet Average 2 | Q1 | Q2 | Q3 | Q4 | p for Trend |
| CQI range | <9.5 | 9.5–11 | 11.5–13.5 | >13.5 | |
| Deaths | 133 | 111 | 103 | 93 | |
| Person-years | 68,635 | 51,152 | 46,443 | 43,657 | |
| Mortality rate/1000 person years | 1.94 | 2.17 | 2.21 | 1.73 | |
| Crude model | 1.00 (Ref.) | 0.88 (0.68–1.14) | 0.93 (0.72–1.21) | 0.59 (0.46–0.78) | <0.001 |
| Model 1 | 1.00 (Ref.) | 0.89 (0.69–1.16) | 0.94 (0.72–1.23) | 0.61 (0.46–0.80) | 0.001 |
| Model 2 | 1.00 (Ref.) | 1.01 (0.78–1.32) | 1.04 (0.79–1.37) | 0.71 (0.53–0.94) | 0.017 |
| Model 3 | 1.00 (Ref.) | 1.02 (0.79–1.33) | 1.07 (0.82–1.41) | 0.70 (0.53–0.94) | 0.017 |
| Model 4 | 1.00 (Ref.) | 1.01 (0.77–1.32) | 1.05 (0.79–1.39) | 0.69 (0.50–0.93) | 0.016 |
Publisher’s Note: MDPI stays neutral with regard to jurisdictional claims in published maps and institutional affiliations. |
© 2021 by the authors. Licensee MDPI, Basel, Switzerland. This article is an open access article distributed under the terms and conditions of the Creative Commons Attribution (CC BY) license (http://creativecommons.org/licenses/by/4.0/).
Share and Cite
Santiago, S.; Zazpe, I.; Fernandez-Lazaro, C.I.; de la O, V.; Bes-Rastrollo, M.; Martínez-González, M.Á. Macronutrient Quality and All-Cause Mortality in the SUN Cohort. Nutrients 2021, 13, 972. https://doi.org/10.3390/nu13030972
Santiago S, Zazpe I, Fernandez-Lazaro CI, de la O V, Bes-Rastrollo M, Martínez-González MÁ. Macronutrient Quality and All-Cause Mortality in the SUN Cohort. Nutrients. 2021; 13(3):972. https://doi.org/10.3390/nu13030972
Chicago/Turabian StyleSantiago, Susana, Itziar Zazpe, Cesar I. Fernandez-Lazaro, Víctor de la O, Maira Bes-Rastrollo, and Miguel Ángel Martínez-González. 2021. "Macronutrient Quality and All-Cause Mortality in the SUN Cohort" Nutrients 13, no. 3: 972. https://doi.org/10.3390/nu13030972
APA StyleSantiago, S., Zazpe, I., Fernandez-Lazaro, C. I., de la O, V., Bes-Rastrollo, M., & Martínez-González, M. Á. (2021). Macronutrient Quality and All-Cause Mortality in the SUN Cohort. Nutrients, 13(3), 972. https://doi.org/10.3390/nu13030972