
Resistant Starch Type 2 from Wheat Reduces Postprandial Glycemic Response with Concurrent Alterations in Gut Microbiota Composition

 , ,
, ,
Abstract
1. Introduction
2. Materials and Methods
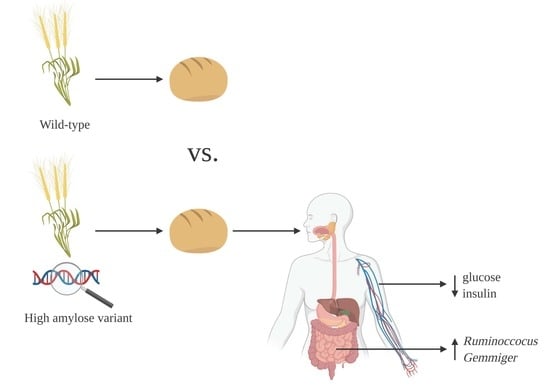
2.1. Study Design
2.2. Meal Challenge and Test Protocol
2.3. Stool Sample Collection
2.4. Bacterial 16S rRNA Gene Sequencing
2.5. 16S rRNA Sequence Analysis
2.6. Blood and Breath Analyte Profiling
2.7. Stool pH Measurement
2.8. Stool Short-Chain Fatty Acid Analysis
2.9. Statistical Analyses
3. Results
3.1. Effects of RS2-Enriched Wheat on Dietary Intake and Glycemic Response
3.2. Effects of RS2-Enriched Wheat Consumption on Gut Microbiota
3.3. Effects of RS2-Enriched Wheat on Microbial Metabolites
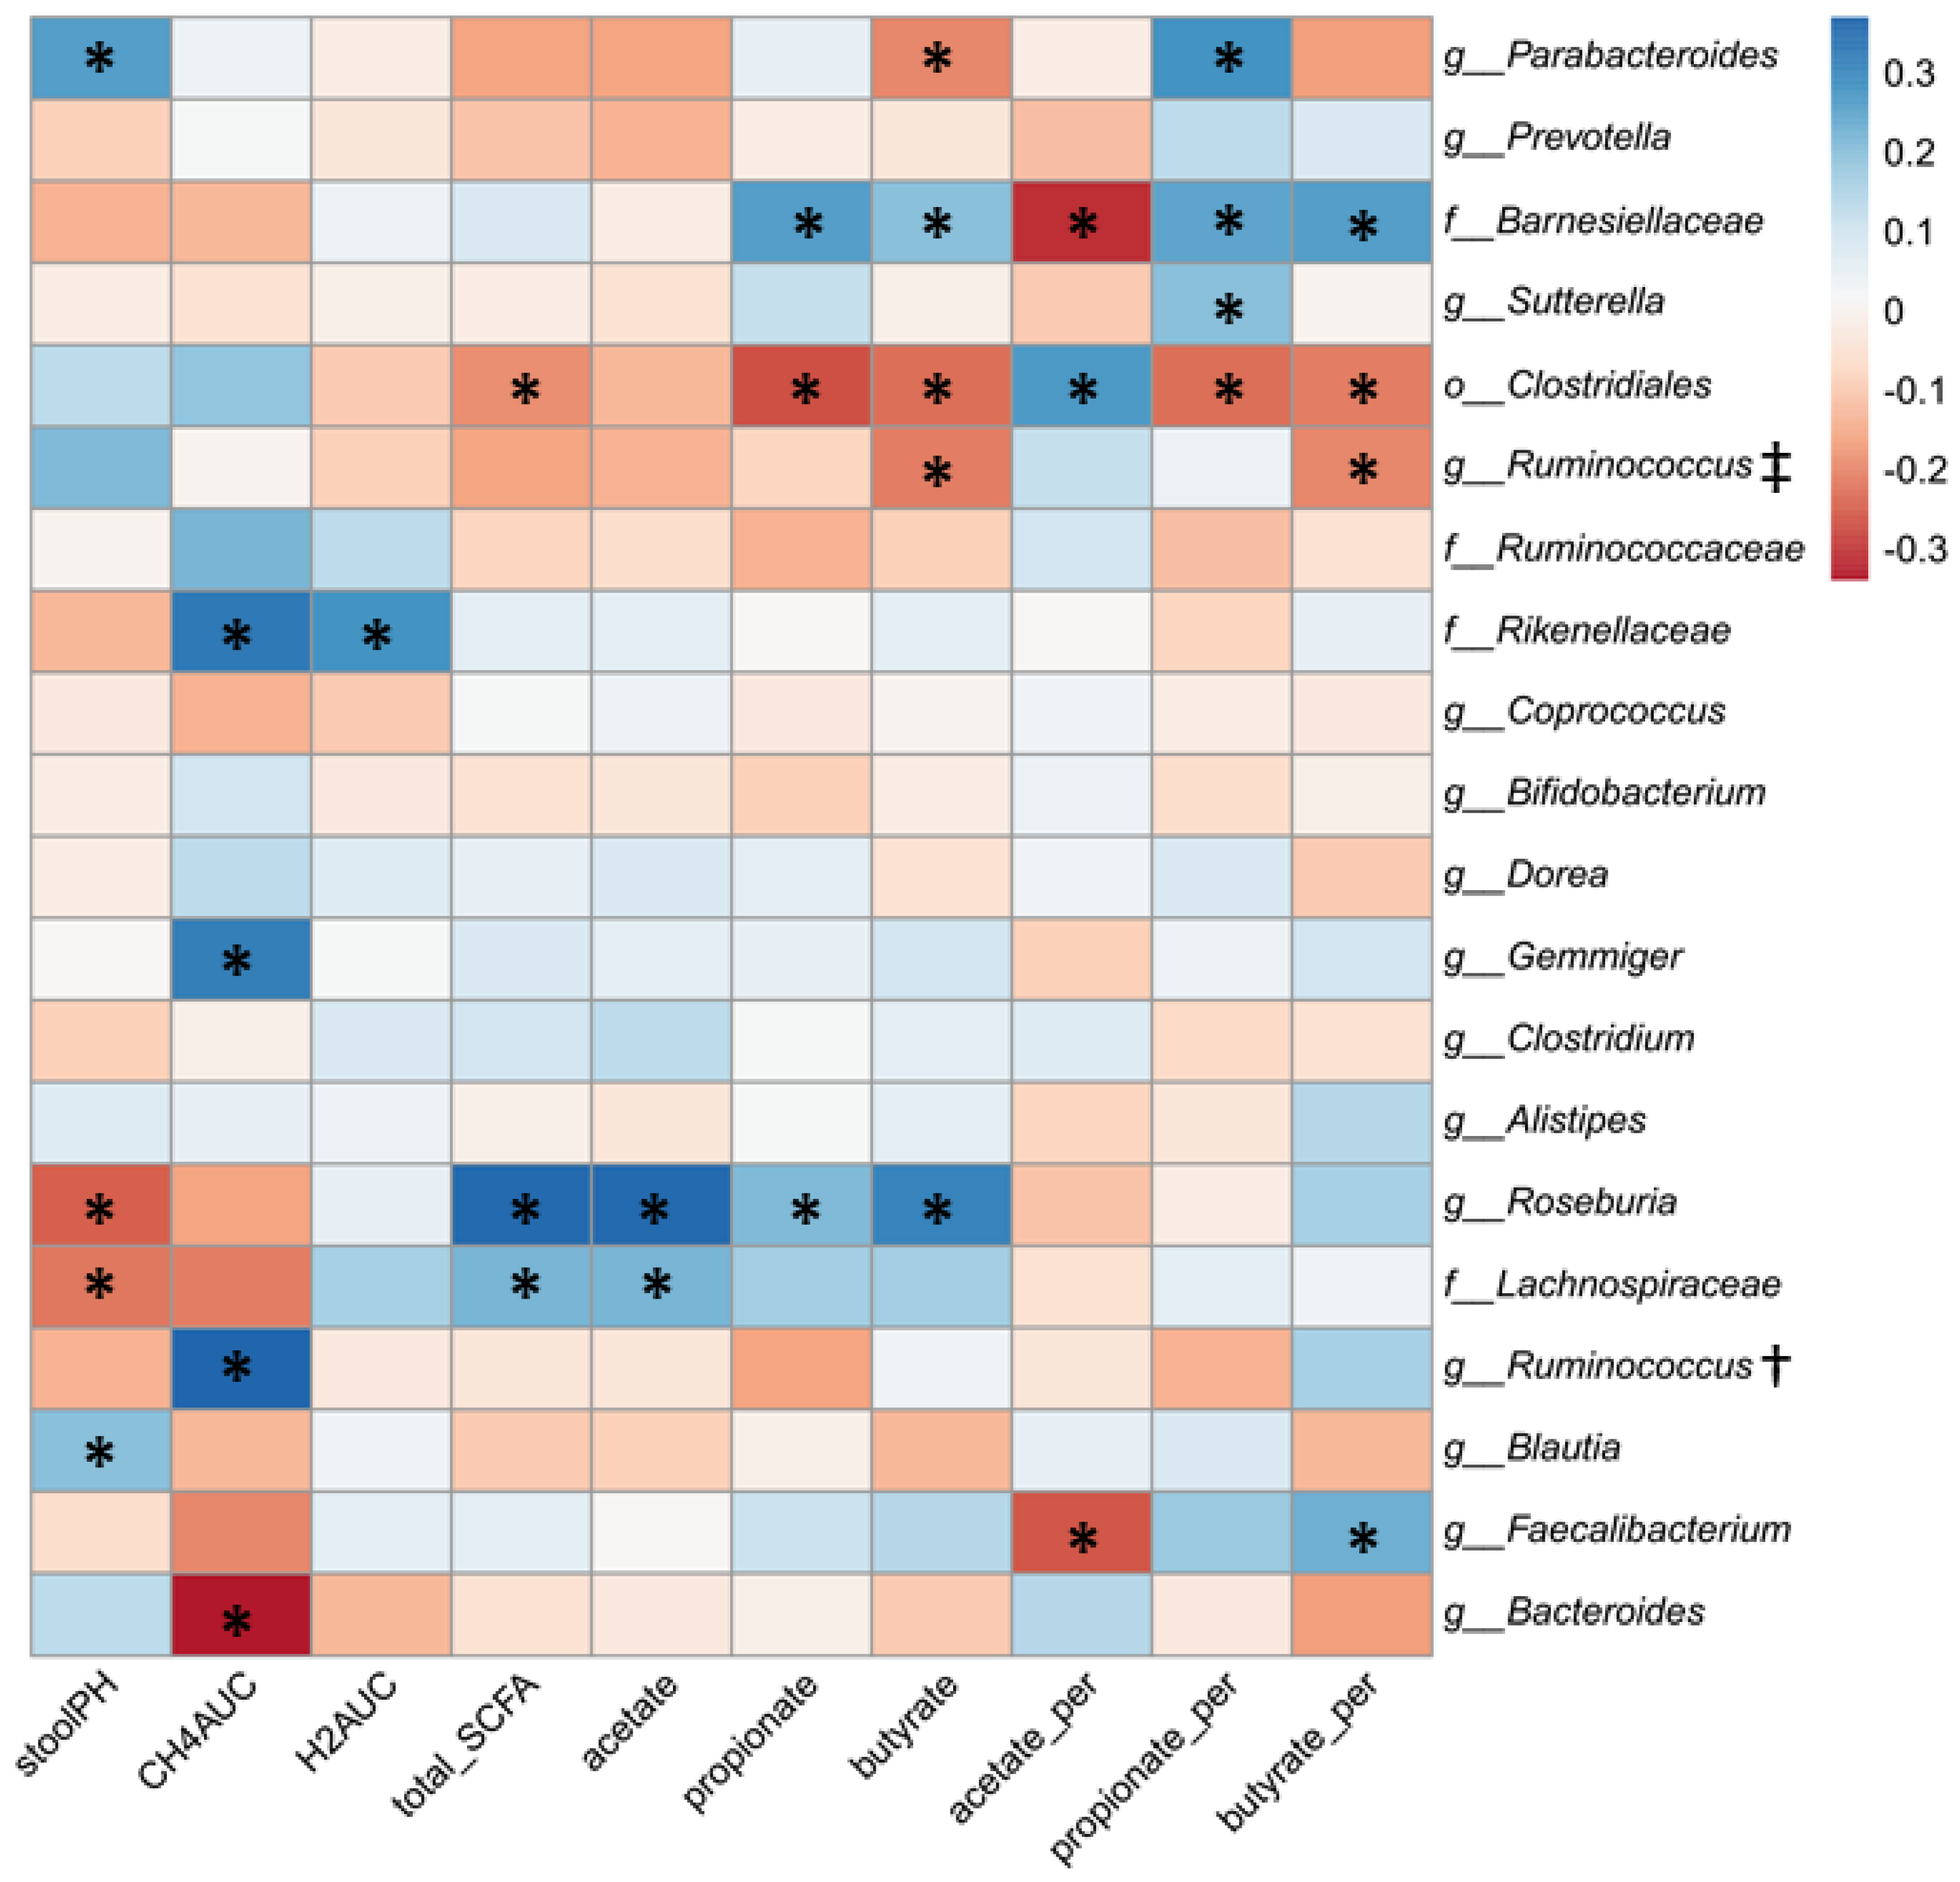
3.4. Relationship between Gut Microbial Composition and Metabolic Indices of Intestinal Fermentation
3.5. Relationship between Indices of Fermentation and Postprandial Glucose and Insulin
4. Discussion
Supplementary Materials
Author Contributions
Funding
Institutional Review Board Statement
Informed Consent Statement
Data Availability Statement
Acknowledgments
Conflicts of Interest
References
- Mandaliya, D.; Patel, S.; Seshadri, S. Fiber in Our Diet and Its Role in Health and Disease. In Functional Food and Human Health; Springer: Singapore, 2018; pp. 247–255. [Google Scholar] [CrossRef]
- Makki, K.; Deehan, E.C.; Walter, J.; Backhed, F. The Impact of Dietary Fiber on Gut Microbiota in Host Health and Disease. Cell Host Microbe 2018, 23, 705–715. [Google Scholar] [CrossRef] [PubMed]
- Klurfeld, D.M.; Davis, C.D.; Karp, R.W.; Allen-Vercoe, E.; Chang, E.B.; Chassaing, B.; Fahey, G.C., Jr.; Hamaker, B.R.; Holscher, H.D.; Lampe, J.W.; et al. Considerations for best practices in studies of fiber or other dietary components and the intestinal microbiome. Am. J. Physiol. Metab. 2018, 315, E1087–E1097. [Google Scholar] [CrossRef]
- Sajilata, M.G.; Singhal, R.S.; Kulkarni, P.R. Resistant starch—A review. Compr. Rev. Food Sci. Food Saf. 2006, 5, 1–17. [Google Scholar] [CrossRef] [PubMed]
- Slade, A.J.; McGuire, C.; Loeffler, D.; Mullenberg, J.; Skinner, W.; Fazio, G.; Holm, A.; Brandt, K.M.; Steine, M.N.; Goodstal, J.F.; et al. Development of high amylose wheat through TILLING. BMC Plant Biol. 2012, 12, 69. [Google Scholar] [CrossRef] [PubMed]
- Food and Drug Administration (FDA). High-Amylose Maize Starch and Diabetes. Available online: https://www.regulations.gov/docket?D=FDA-2015-Q-2352 (accessed on 9 April 2020).
- Maki, K.C.; Pelkman, C.L.; Finocchiaro, E.T.; Kelley, K.M.; Lawless, A.L.; Schild, A.L.; Rains, T.M. Resistant starch from high-amylose maize increases insulin sensitivity in overweight and obese men. J. Nutr. 2012, 142, 717–723. [Google Scholar] [CrossRef]
- Robertson, M.D.; Wright, J.W.; Loizon, E.; Debard, C.; Vidal, H.; Shojaee-Moradie, F.; Russell-Jones, D.; Umpleby, A.M. Insulin-sensitizing effects on muscle and adipose tissue after dietary fiber intake in men and women with metabolic syndrome. J. Clin. Endocrinol. Metab. 2012, 97, 3326–3332. [Google Scholar] [CrossRef]
- Augustin, L.S.; Kendall, C.W.; Jenkins, D.J.; Willett, W.C.; Astrup, A.; Barclay, A.W.; Björck, I.; Brand-Miller, J.C.; Brighenti, F.; Buyken, A.E.; et al. Glycemic index, glycemic load and glycemic response: An International Scientific Consensus Summit from the International Carbohydrate Quality Consortium (ICQC). Nutr. Metab. Cardiovasc. Dis. 2015, 25, 795–815. [Google Scholar] [CrossRef]
- DeMartino, P.; Cockburn, D.W. Resistant starch: Impact on the gut microbiome and health. Curr. Opin. Biotechnol. 2020, 61, 66–71. [Google Scholar] [CrossRef]
- Lockyer, S.; Nugent, A.P. Health effects of resistant starch. Nutr. Bull. 2017, 42, 10–41. [Google Scholar] [CrossRef]
- EFSA Panel on Dietetic Products, Nutrition and Allergies (NDA). Scientific Opinion on the substantiation of health claims related to resistant starch and reduction of post-prandial glycaemic responses (ID 681), “digestive health benefits”(ID 682) and “favours a normal colon metabolism”(ID 783) pursuant to Article 13 (1) of Regulation (EC) No. 1924/2006. EFSA J. 2011, 9, 2024. [Google Scholar]
- Tremaroli, V.; Bäckhed, F. Functional interactions between the gut microbiota and host metabolism. Nature 2012, 489, 242–249. [Google Scholar] [CrossRef]
- Nicholson, J.K.; Holmes, E.; Kinross, J.; Burcelin, R.; Gibson, G.; Jia, W.; Pettersson, S. Host-gut microbiota metabolic interactions. Science 2012, 336, 1262–1267. [Google Scholar] [CrossRef] [PubMed]
- Kau, A.L.; Ahern, P.P.; Griffin, N.W.; Goodman, A.L.; Gordon, J.I. Human nutrition, the gut microbiome and the immune system. Nature 2011, 474, 327. [Google Scholar] [CrossRef] [PubMed]
- Hooper, L.V.; Littman, D.R.; Macpherson, A.J. Interactions between the microbiota and the immune system. Science 2012, 336, 1268–1273. [Google Scholar] [CrossRef]
- Janssen, A.W.; Kersten, S. Potential mediators linking gut bacteria to metabolic health: A critical view. J. Physiol. 2017, 595, 477–487. [Google Scholar] [CrossRef]
- Troke, R.C.; Tan, T.M.; Bloom, S.R. The future role of gut hormones in the treatment of obesity. Ther. Adv. Chronic Dis. 2014, 5, 4–14. [Google Scholar] [CrossRef] [PubMed]
- Bendiks, Z.A.; Knudsen, K.E.; Keenan, M.J.; Marco, M.L. Conserved and variable responses of the gut microbiome to resistant starch type 2. Nutr. Res. 2020, 77, 12–28. [Google Scholar] [CrossRef]
- Maier, T.V.; Lucio, M.; Lee, L.H.; VerBerkmoes, N.C.; Brislawn, C.J.; Bernhardt, J.; Lamendella, R.; McDermott, J.E.; Bergeron, N.; Heinzmann, S.S.; et al. Impact of Dietary Resistant Starch on the Human Gut Microbiome, Metaproteome, and Metabolome. MBio 2017, 8, e01343-17. [Google Scholar] [CrossRef] [PubMed]
- Belobrajdic, D.P.; Regina, A.; Klingner, B.; Zajac, I.; Chapron, S.; Berbezy, P.; Bird, A.R. High-Amylose Wheat Lowers the Postprandial Glycemic Response to Bread in Healthy Adults: A Randomized Controlled Crossover Trial. J. Nutr. 2019, 149, 1335–1345. [Google Scholar] [CrossRef] [PubMed]
- Subar, A.F.; Kirkpatrick, S.I.; Mittl, B.; Zimmerman, T.P.; Thompson, F.E.; Bingley, C.; Willis, G.; Islam, N.G.; Baranowski, T.; McNutt, S. The Automated Self-Administered 24-h dietary recall (ASA24): A resource for researchers, clinicians, and educators from the National Cancer Institute. J. Acad. Nutr. Diet. 2012, 112, 1134–1137. [Google Scholar] [CrossRef]
- Fadrosh, D.W.; Ma, B.; Gajer, P.; Sengamalay, N.; Ott, S.; Brotman, R.M.; Ravel, J. An improved dual-indexing approach for multiplexed 16S rRNA gene sequencing on the Illumina MiSeq platform. Microbiome 2014, 2, 6. [Google Scholar] [CrossRef] [PubMed]
- Bolyen, E.; Rideout, J.R.; Dillon, M.R.; Bokulich, N.A.; Abnet, C.C.; Al-Ghalith, G.A.; Alexander, H.; Alm, E.J.; Arumugam, M.; Asnicar, F.; et al. Reproducible, interactive, scalable and extensible microbiome data science using QIIME 2. Nat. Biotechnol. 2019, 37, 852–857. [Google Scholar] [CrossRef] [PubMed]
- Callahan, B.J.; McMurdie, P.J.; Rosen, M.J.; Han, A.W.; Johnson, A.J.; Holmes, S.P. DADA2: High-resolution sample inference from Illumina amplicon data. Nat. Methods 2016, 13, 581–583. [Google Scholar] [CrossRef]
- Oksanen, J.; Kindt, R.; Legendre, P.; O’Hara, B.; Stevens, M.H.H.; Oksanen, M.J.; Suggests, M. The Vegan Package. Community Ecology Package; GNU: Boston, MA, USA, 2007; Volume 10, pp. 631–637. [Google Scholar]
- Vavrek, M.J.; Vavrek, M.M.J. Package “fossil”: Palaeoecological and palaeogeographical analysis tools. Palaeontol. Electron. 2012, 14, 16. [Google Scholar]
- Love, M.I.; Huber, W.; Anders, S. Moderated estimation of fold change and dispersion for RNA-seq data with DESeq2. Genome Biol. 2014, 15, 550. [Google Scholar] [CrossRef] [PubMed]
- Slifker, J.F.; Shapiro, S.S. The Johnson System: Selection and Parameter Estimation. Technometrics 1980, 22, 239–246. [Google Scholar] [CrossRef]
- Dietary Guidelines Advisory Committee. Dietary Guidelines for Americans 2015–2020, 8th ed.; USDA: Washington, DC, USA, 2015.
- Gao, Z.; Yin, J.; Zhang, J.; Ward, R.E.; Martin, R.J.; Lefevre, M.; Cefalu, W.T.; Ye, J. Butyrate improves insulin sensitivity and increases energy expenditure in mice. Diabetes 2009, 58, 1509–1517. [Google Scholar] [CrossRef] [PubMed]
- Robertson, M.D.; Currie, J.M.; Morgan, L.M.; Jewell, D.P.; Frayn, K.N. Prior short-term consumption of resistant starch enhances postprandial insulin sensitivity in healthy subjects. Diabetologia 2003, 46, 659–665. [Google Scholar] [CrossRef] [PubMed]
- Behall, K.M.; Scholfield, D.J. Food amylose content affects postprandial glucose and insulin responses. Cereal Chem. 2005, 82, 654–659. [Google Scholar] [CrossRef]
- Behall, K.M.; Hallfrisch, J. Plasma glucose and insulin reduction after consumption of breads varying in amylose content. Eur. J. Clin. Nutr. 2002, 56, 913–920. [Google Scholar] [CrossRef] [PubMed]
- Raben, A.; Tagliabue, A.; Christensen, N.J.; Madsen, J.; Holst, J.J.; Astrup, A. Resistant starch: The effect on postprandial glycemia, hormonal response, and satiety. Am. J. Clin. Nutr. 1994, 60, 544–551. [Google Scholar] [CrossRef] [PubMed]
- Parada Venegas, D.; De la Fuente, M.K.; Landskron, G.; González, M.J.; Quera, R.; Dijkstra, G.; Harmsen, H.J.M.; Faber, K.N.; Hermoso, M.A. Short Chain Fatty Acids (SCFAs)—Mediated Gut Epithelial and Immune Regulation and Its Relevance for Inflammatory Bowel Diseases. Front. Immunol. 2019, 10, 277. [Google Scholar] [CrossRef] [PubMed]
- Venkataraman, A.; Sieber, J.R.; Schmidt, A.W.; Waldron, C.; Theis, K.R.; Schmidt, T.M. Variable responses of human microbiomes to dietary supplementation with resistant starch. Microbiome 2016, 4, 33. [Google Scholar] [CrossRef] [PubMed]
- Vital, M.; Howe, A.; Bergeron, N.; Krauss, R.M.; Jansson, J.K.; Tiedje, J.M. Metagenomic insights into the degradation of resistant starch by human gut microbiota. Appl. Environ. Microbiol. 2018, 84, 84. [Google Scholar] [CrossRef] [PubMed]
- Roager, H.M.; Hansen, L.B.; Bahl, M.I.; Frandsen, H.L.; Carvalho, V.; Gøbel, R.J.; Dalgaard, M.D.; Plichta, D.R.; Sparholt, M.H.; Vestergaard, H. Colonic transit time is related to bacterial metabolism and mucosal turnover in the gut. Nat. Microbiol. 2016, 1, 16093. [Google Scholar] [CrossRef] [PubMed]
- Kovatcheva-Datchary, P.; Nilsson, A.; Akrami, R.; Lee, Y.S.; De Vadder, F.; Arora, T.; Hallen, A.; Martens, E.; Bjorck, I.; Backhed, F. Dietary fiber-induced improvement in glucose metabolism is associated with increased abundance of prevotella. Cell Metab. 2015, 22, 971–982. [Google Scholar] [CrossRef] [PubMed]
- Zhao, L.; Zhang, F.; Ding, X.; Wu, G.; Lam, Y.Y.; Wang, X.; Fu, H.; Xue, X.; Lu, C.; Ma, J. Gut bacteria selectively promoted by dietary fibers alleviate type 2 diabetes. Science 2018, 359, 1151–1156. [Google Scholar] [CrossRef] [PubMed]
- Louis, P.; Young, P.; Holtrop, G.; Flint, H.J. Diversity of human colonic butyrate-producing bacteria revealed by analysis of the butyryl-CoA: Acetate CoA-transferase gene. Environ. Microbiol. 2010, 12, 304–314. [Google Scholar] [CrossRef] [PubMed]
- Miquel, S.; Leclerc, M.; Martin, R.; Chain, F.; Lenoir, M.; Raguideau, S.; Hudault, S.; Bridonneau, C.; Northen, T.; Bowen, B. Identification of metabolic signatures linked to anti-inflammatory effects of Faecalibacterium prausnitzii. MBio 2015, 6, e00300-15. [Google Scholar] [CrossRef] [PubMed]
- Lee, Y.Y.; Erdogan, A.; Rao, S.S. How to assess regional and whole gut transit time with wireless motility capsule. J. Neurogastroenterol. Motil. 2014, 20, 265. [Google Scholar] [CrossRef] [PubMed]
- Wolever, T.M.; Jenkins, D.J.; Ocana, A.M.; Rao, V.A.; Collier, G.R. Second-meal effect: Low-glycemic-index foods eaten at dinner improve subsequent breakfast glycemic response. Am. J. Clin. Nutr. 1988, 48, 1041–1047. [Google Scholar] [CrossRef] [PubMed]
- Yong, M.K.; Solah, V.A.; Johnson, S.K.; Meng, X.; Kerr, D.A.; James, A.P.; Fenton, H.K.; Gahler, R.J.; Wood, S. Effects of a viscous-fibre supplemented evening meal and the following un-supplemented breakfast on post-prandial satiety responses in healthy women. Physiol. Behav. 2016, 154, 34–39. [Google Scholar] [CrossRef] [PubMed]
- Müller, M.; Hernández, M.A.G.; Goossens, G.H.; Reijnders, D.; Holst, J.J.; Jocken, J.W.E.; van Eijk, H.; Canfora, E.E.; Blaak, E.E. Circulating but not faecal short-chain fatty acids are related to insulin sensitivity, lipolysis and GLP-1 concentrations in humans. Sci. Rep. 2019, 9, 12515. [Google Scholar] [CrossRef] [PubMed]
- Hughes, R.L.; Marco, M.L.; Hughes, J.P.; Keim, N.L.; Kable, M.E. The Role of the Gut Microbiome in Predicting Response to Diet and the Development of Precision Nutrition Models—Part I: Overview of Current Methods. Adv. Nutr. 2019, 10, 953–978. [Google Scholar] [CrossRef]
- Knight, R.; Vrbanac, A.; Taylor, B.C.; Aksenov, A.; Callewaert, C.; Debelius, J.; Gonzalez, A.; Kosciolek, T.; McCall, L.-I.; McDonald, D. Best practices for analysing microbiomes. Nat. Rev. Microbiol. 2018, 16, 410. [Google Scholar] [CrossRef] [PubMed]


| Participant Characteristic | Male (n = 12) | Female (n = 18) | Overall Study (n = 30) |
|---|---|---|---|
| Age ( + sd), years | 54.9 (7.6) | 53.2 (5.7) | 53.9 (6.6) |
| BMI ( + sd), kg/m2 | 26.6 (3.0) | 26.0 (4.2) | 26.5 (3.8) |
| W:H ratio ( + sd) | 0.9 (0.05) | 0.8 (0.05) | 0.8 (0.1) |
| Fasting Glucose ( + sd), mg/dL | 90.8 (6.6) | 90.9 (7.6) | 90.8 (7.3) |
| Total cholesterol ( + sd), mg/dL | 193.2 (17.7) | 193.3 (27.2) | 193.2 (24.3) |
| Triglycerides ( + sd), mg/dL | 122.4 (49.5) | 75.2 (26.8) | 94.1 (44.8) |
| Nutrient | Resistant Starch (RS) Roll | Control Roll |
|---|---|---|
| Calories (kcal) | 242.0 | 246.6 |
| Carbohydrate (g) * | 39.1 | 44.0 |
| Total dietary fiber (g) + | 9.8 | 2.4 |
| Resistant starch (g) + | 4.8 | 0.9 |
| Insoluble fiber (g) + | 5.9 | 1.1 |
| Soluble fiber (g) + | 3.9 | 1.2 |
| Protein (g) | 12.0 | 10.6 |
| Fat (g) | 3.8 | 3.1 |
| Monounsaturated (g) | 1.8 | 1.6 |
| Polyunsaturated (g) | 1.4 | 1.1 |
| Saturated (g) | 0.5 | 0.4 |
| Nutrient | Resistant Starch (RS) Meal | Control Meal |
|---|---|---|
| Calories (kcal) | 780.1 | 789.3 |
| Carbohydrate (g) * | 79.2 | 88.9 |
| Total dietary fiber (g) | 19.7 | 4.7 |
| Resistant starch (g) | 9.6 | 1.8 |
| Insoluble fiber (g) | 11.8 | 2.3 |
| Soluble fiber (g) | 7.8 | 2.4 |
| Protein (g) | 38.0 | 35.2 |
| Fat (g) | 33.7 | 32.3 |
| Monounsaturated (g) | 11.6 | 11.2 |
| Polyunsaturated (g) | 5.9 | 5.3 |
| Saturated (g) | 13.4 | 13.2 |
| Glycemic Response | Resistant Starch (RS) | Control |
|---|---|---|
| iAUC | ||
| Glucose (mg·min/dL) | −1111.8 ± 1846.3 | 124.5 ± 2355.3 |
| Insulin (pmol·min/L) | 25,147.3 ± 20,486.7 | 47,084.2 ± 33,989.3 |
| Peak | ||
| Glucose (mg/dL) | 104.0 ± 14.5 | 114.1 ± 24.3 |
| Insulin (pmol/L) | 315.6 ± 205.7 | 532.0 ± 375.7 |
| p-Values | |||||
|---|---|---|---|---|---|
| SCFA | Concentration (pmol/mg) | Control vs. RS | Control vs. Pre-C | RS vs. Pre-RS | Pre-RS vs. Pre-C |
| Total SCFAs | 28.2 ± 9.6 | 0.98 | 0.63 | 0.37 | 0.70 |
| Acetate | 20.2 ± 6.6 | 0.93 | 0.98 | 0.41 | 0.35 |
| Butyrate | 4.7 ± 2.5 | 0.58 | 0.25 | 0.65 | 0.21 |
| Propionate | 3.4 ± 1.4 | 0.72 | 0.18 | 0.23 | 0.81 |
| Relative Concentration (%) | |||||
| Acetate | 72.2 ± 6.7 | 0.65 | 0.10 | 0.20 | 0.42 |
| Butyrate | 15.9 ± 4.8 | 0.29 | 0.23 | 0.64 | 0.07 |
| Propionate | 11.9 ± 3.4 | 0.61 | 0.12 | 0.07 | 0.43 |
| Members | R2 with Own Cluster | R2 with Next Closest | 1-R2 Ratio |
|---|---|---|---|
| Cluster 2 | |||
| f__Victivallaceae | 0.95 | 0.05 | 0.05 |
| c__Alphaproteobacteria | 0.90 | 0.06 | 0.11 |
| f__Anaeroplasmataceae | 0.78 | 0.05 | 0.23 |
| o__Burkholderiales | 0.77 | 0.04 | 0.24 |
| k__Bacteria | 0.73 | 0.07 | 0.29 |
| g__Desulfovibrio | 0.71 | 0.10 | 0.33 |
| o__ML615J28 | 0.31 | 0.11 | 0.77 |
| o__Bacteroidales | 0.02 | 0.01 | 0.99 |
| Cluster 13 | |||
| g__Butyricicoccus | 0.66 | 0.05 | 0.36 |
| g__Coprobacillus | 0.62 | 0.004 | 0.38 |
| f__Lachnospiraceae | 0.09 | 0.03 | 0.94 |
| Cluster 15 | |||
| g__Roseburia | 0.53 | 0.06 | 0.50 |
| g__Ruminococcus | 0.43 | 0.16 | 0.68 |
| g__Parabacteroides | 0.37 | 0.13 | 0.73 |
| g__Butyricimonas | 0.30 | 0.06 | 0.74 |
| g__Lactobacillus | 0.13 | 0.004 | 0.88 |
| Model R2 | Sex | Cluster 15 | Cluster 13 | Cluster 2 | |
|---|---|---|---|---|---|
| SCFA | 0.34 | p = 0.0002 | p = 0.0001 | p = 0.0034 | p = 0.007 |
| Acetate | 0.28 | p = 0.011 | p = 0.0001 | p = 0.0042 | p = 0.031 |
| Propionate | 0.22 | p = 0.0002 | p = 0.3 | p = 0.030 | p = 0.010 |
| Butyrate | 0.37 | p < 0.0001 | p = 0.0002 | p = 0.038 | p = 0.0042 |
Publisher’s Note: MDPI stays neutral with regard to jurisdictional claims in published maps and institutional affiliations. |
© 2021 by the authors. Licensee MDPI, Basel, Switzerland. This article is an open access article distributed under the terms and conditions of the Creative Commons Attribution (CC BY) license (http://creativecommons.org/licenses/by/4.0/).
Share and Cite
Hughes, R.L.; Horn, W.H.; Finnegan, P.; Newman, J.W.; Marco, M.L.; Keim, N.L.; Kable, M.E. Resistant Starch Type 2 from Wheat Reduces Postprandial Glycemic Response with Concurrent Alterations in Gut Microbiota Composition. Nutrients 2021, 13, 645. https://doi.org/10.3390/nu13020645
Hughes RL, Horn WH, Finnegan P, Newman JW, Marco ML, Keim NL, Kable ME. Resistant Starch Type 2 from Wheat Reduces Postprandial Glycemic Response with Concurrent Alterations in Gut Microbiota Composition. Nutrients. 2021; 13(2):645. https://doi.org/10.3390/nu13020645
Chicago/Turabian StyleHughes, Riley L., William H. Horn, Peter Finnegan, John W. Newman, Maria L. Marco, Nancy L. Keim, and Mary E. Kable. 2021. "Resistant Starch Type 2 from Wheat Reduces Postprandial Glycemic Response with Concurrent Alterations in Gut Microbiota Composition" Nutrients 13, no. 2: 645. https://doi.org/10.3390/nu13020645
APA StyleHughes, R. L., Horn, W. H., Finnegan, P., Newman, J. W., Marco, M. L., Keim, N. L., & Kable, M. E. (2021). Resistant Starch Type 2 from Wheat Reduces Postprandial Glycemic Response with Concurrent Alterations in Gut Microbiota Composition. Nutrients, 13(2), 645. https://doi.org/10.3390/nu13020645