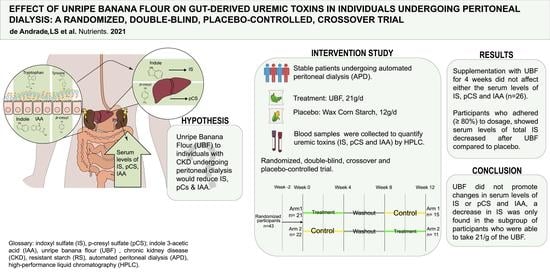
Effect of Unripe Banana Flour on Gut-Derived Uremic Toxins in Individuals Undergoing Peritoneal Dialysis: A Randomized, Double-Blind, Placebo-Controlled, Crossover Trial

 ,
,  , , and
Abstract
1. Introduction
2. Materials and Methods
2.1. Study Population
2.2. Intervention
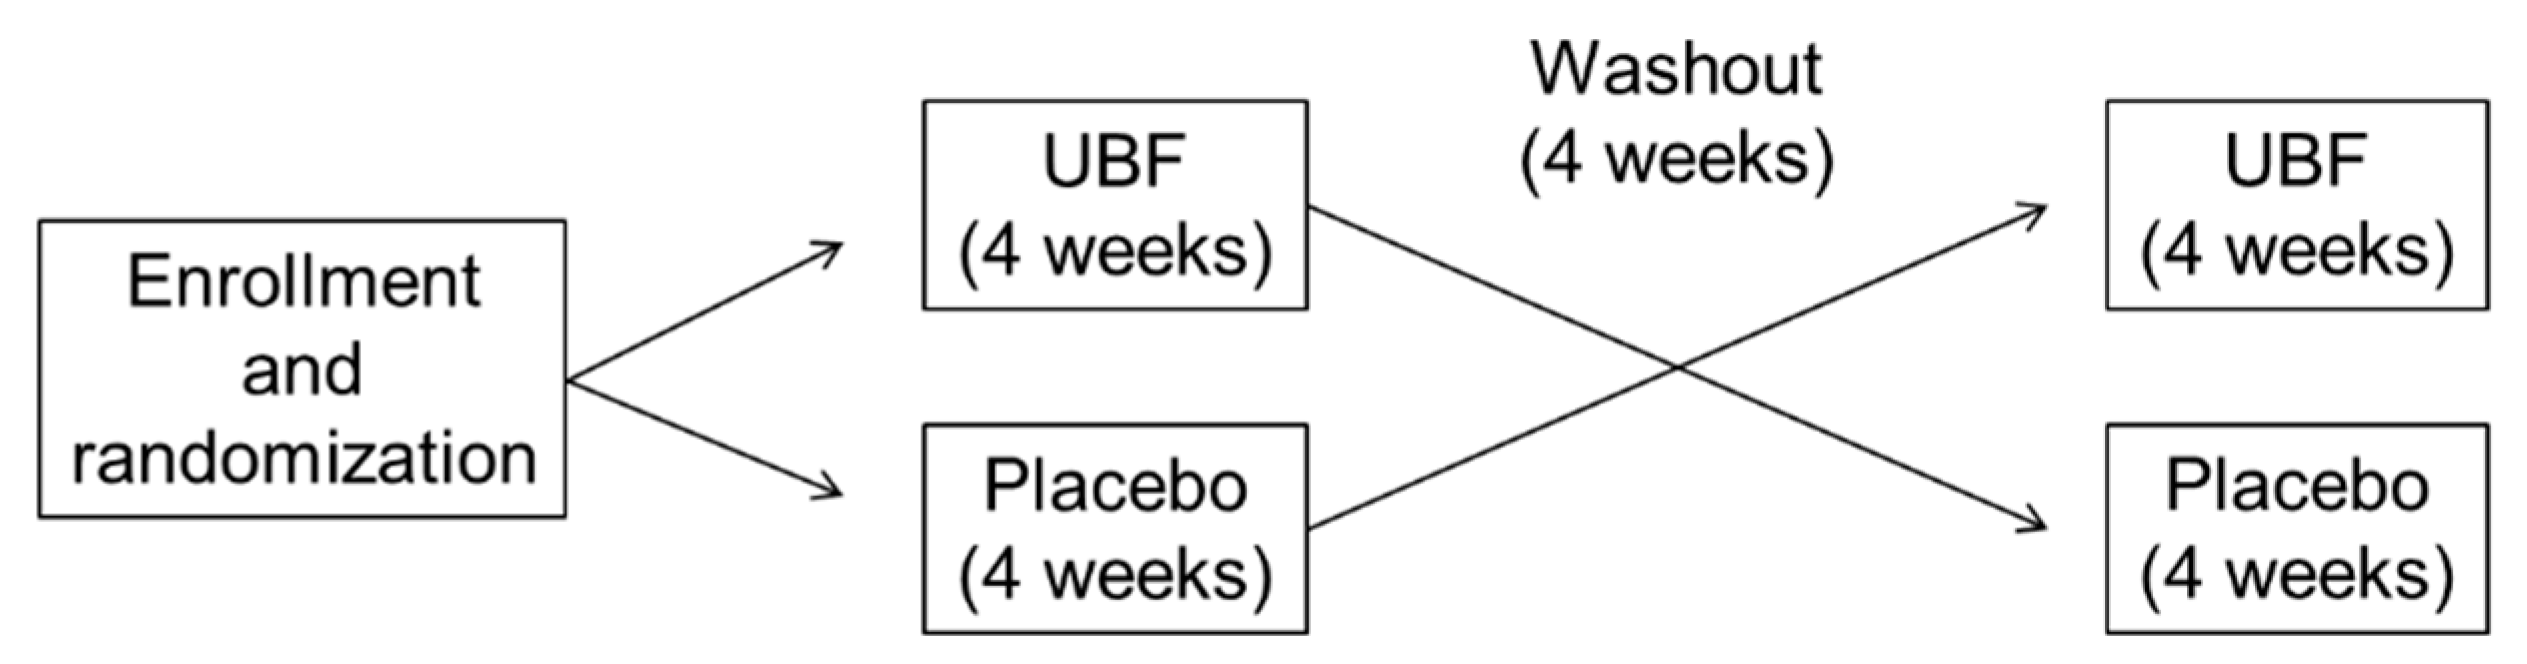
2.3. Study Protocol
2.4. Outcome Measures
2.5. Demographic, Clinical, and Biochemical Data
2.6. Dietary Intake
2.7. Gastrointestinal Symptoms
2.8. Statistical Analysis
3. Results
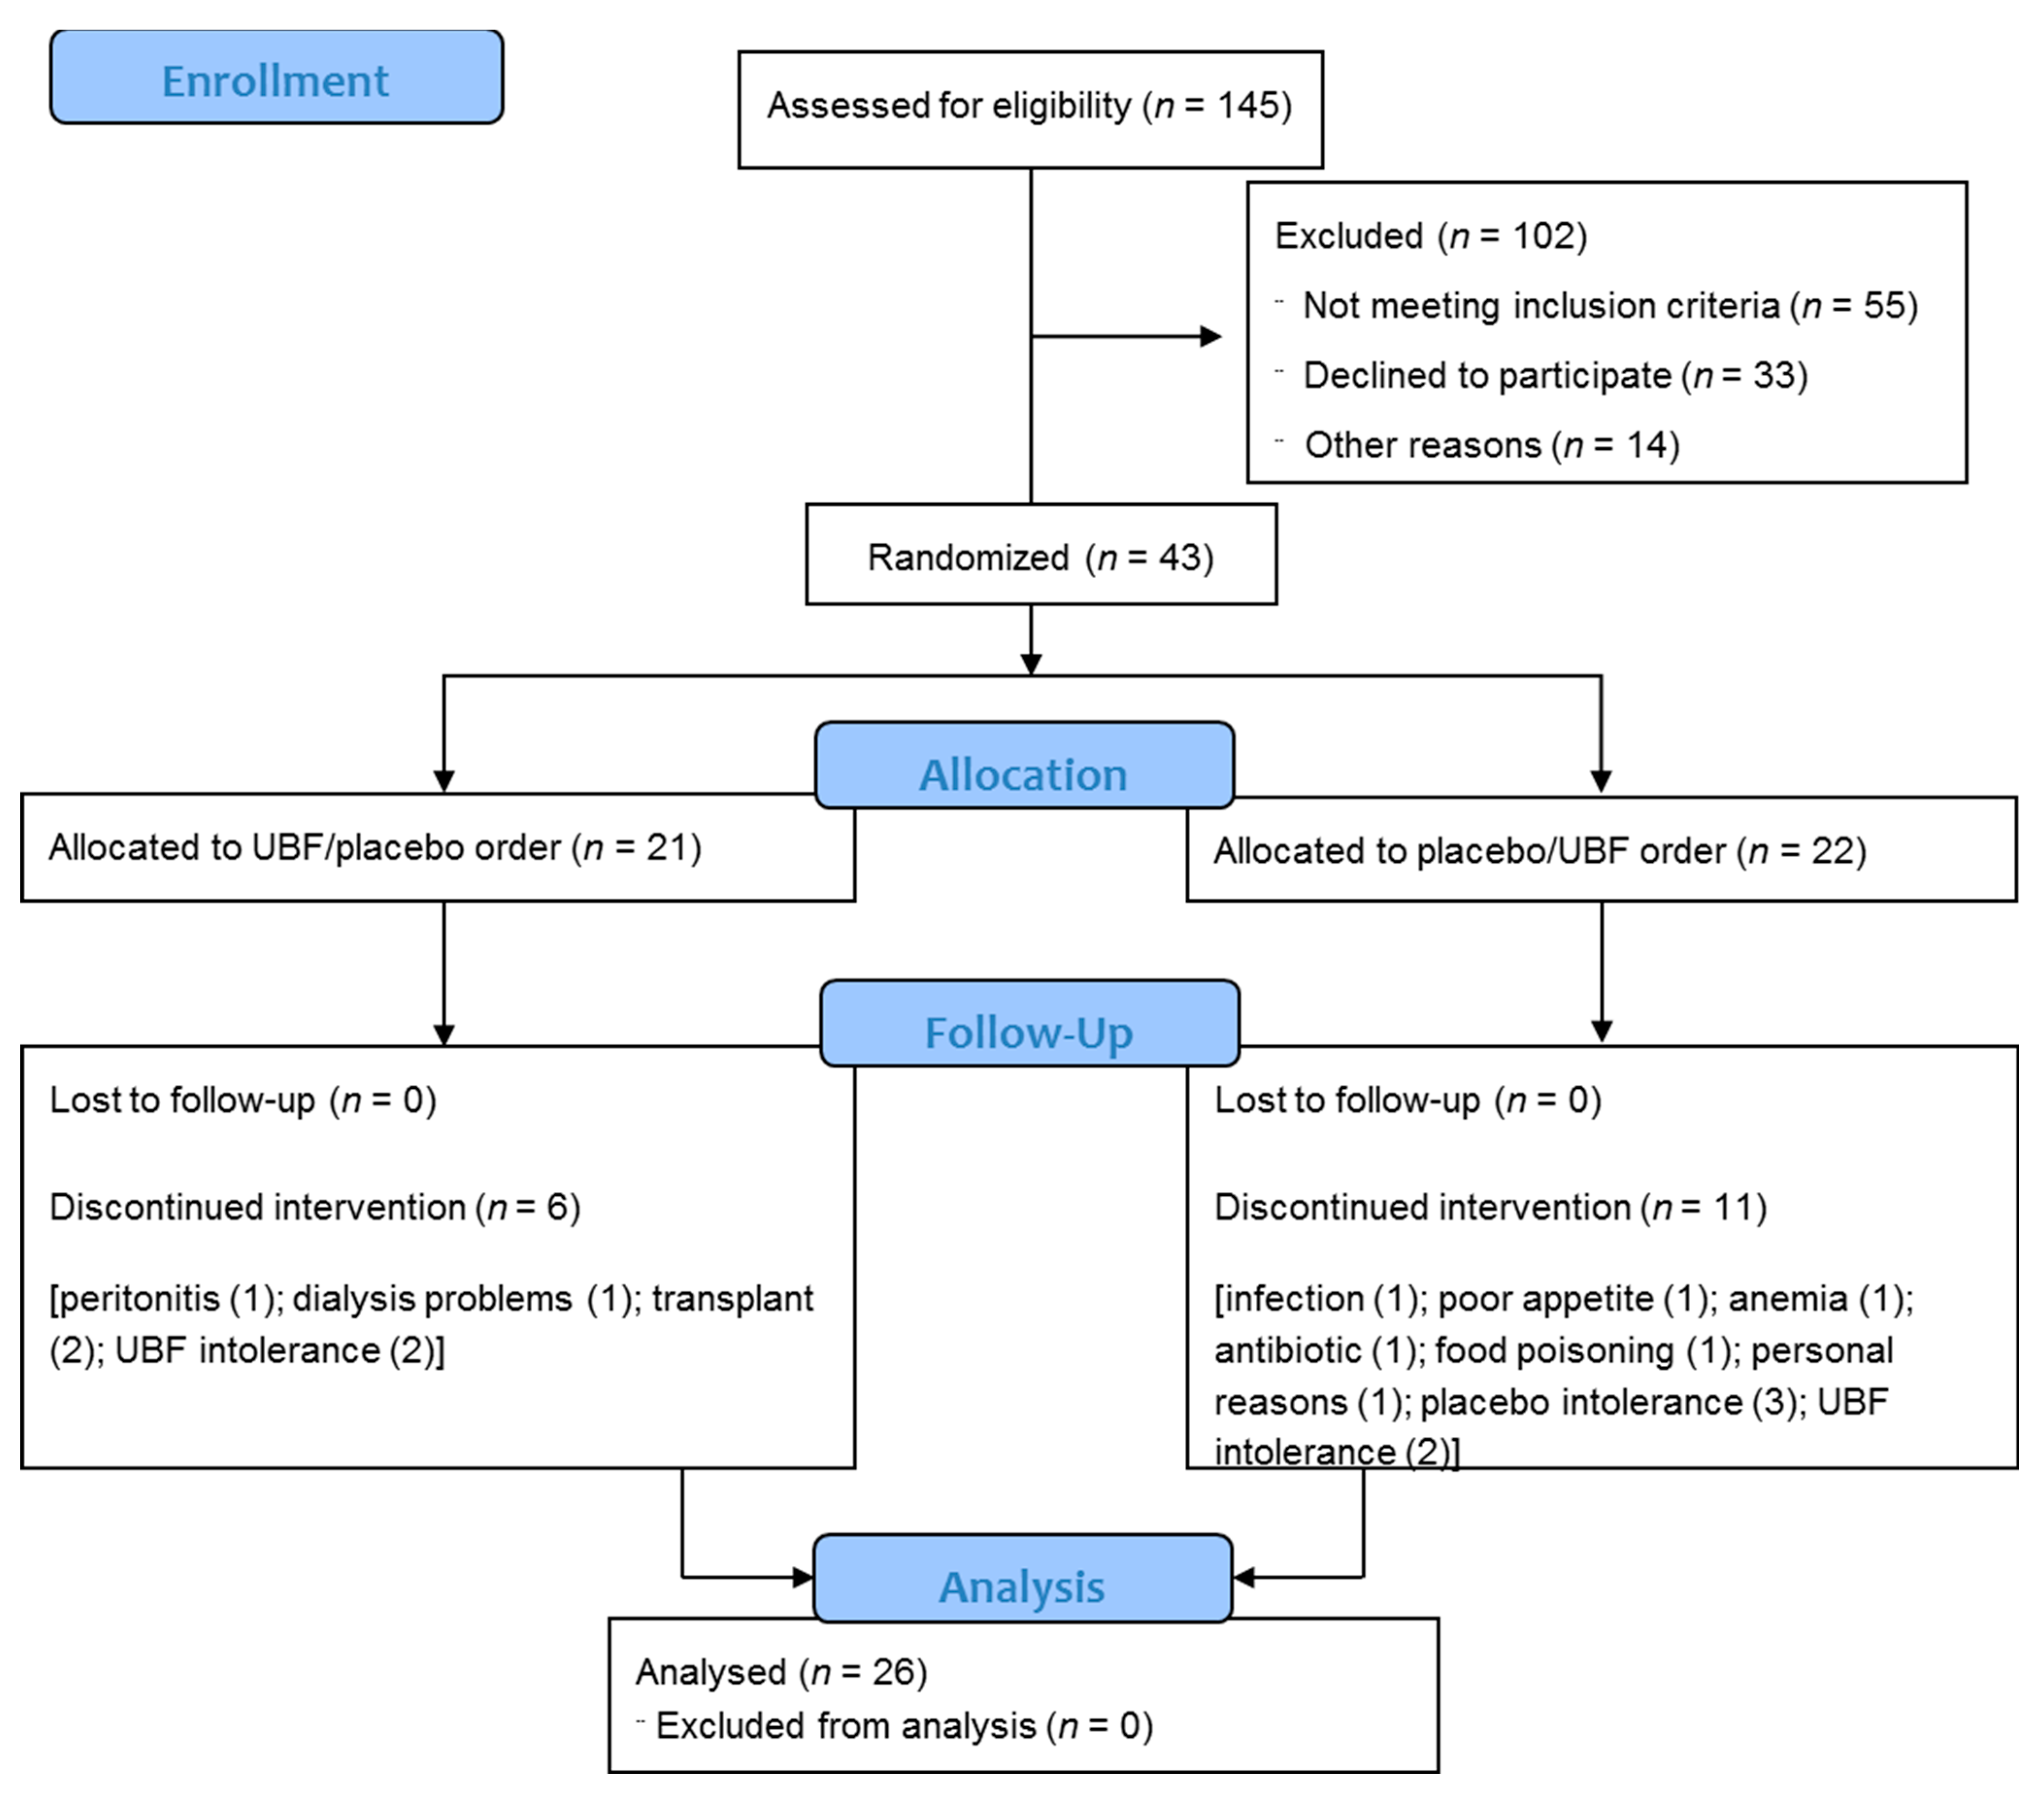
3.1. Study Participants
3.2. Adherence, Tolerance, and Gastrointestinal Symptoms
3.3. Laboratory Parameters and Dietary Intake
3.4. Uremic Toxins
3.5. Subgroup Based on Adherence to the Supplement
4. Discussion
5. Conclusions
Author Contributions
Funding
Institutional Review Board Statement
Informed Consent Statement
Data Availability Statement
Acknowledgments
Conflicts of Interest
References
- Wikoff, W.R.; Anfora, A.T.; Liu, J.; Schultz, P.G.; Lesley, S.A.; Peters, E.C.; Siuzdak, G. Metabolomics analysis reveals large effects of gut microflora on mammalian blood metabolites. Proc. Natl. Acad. Sci. USA 2009, 106, 3698–3703. [Google Scholar] [CrossRef] [PubMed]
- Mair, R.D.; Sirich, T.L.; Plummer, N.S.; Meyer, T.W. Characteristics of Colon-Derived Uremic Solutes. Clin. J. Am. Soc. Nephrol. 2018, 13, 1398–1404. [Google Scholar] [CrossRef] [PubMed]
- Mafra, D.; Barros, A.F.; Fouque, D. Dietary protein metabolism by gut microbiota and its consequences for chronic kidney disease patients. Future Microbiol. 2013, 8, 1317–1323. [Google Scholar] [CrossRef]
- Gao, J.; Xu, K.; Liu, H.; Liu, G.; Bai, M.; Peng, C.; Li, T.; Yin, Y. Impact of the Gut Microbiota on Intestinal Immunity Mediated by Tryptophan Metabolism. Front. Cell. Infect. Microbiol. 2018, 8, 13. [Google Scholar] [CrossRef]
- Deltombe, O.; Van Biesen, W.; Glorieux, G.; Massy, Z.A.; Dhondt, A.; Eloot, S. Exploring Protein Binding of Uremic Toxins in Patients with Different Stages of Chronic Kidney Disease and during Hemodialysis. Toxins 2015, 7, 3933–3946. [Google Scholar] [CrossRef] [PubMed]
- Sirich, T.L.; Aronov, P.A.; Plummer, N.S.; Hostetter, T.H.; Meyer, T.W. Numerous protein-bound solutes are cleared by the kidney with high efficiency. Kidney Int. 2013, 84, 585–590. [Google Scholar] [CrossRef]
- Lin, C.-J.; Chen, H.-H.; Pan, C.-F.; Chuang, C.-K.; Wang, T.-J.; Sun, F.-J.; Wu, C.-J. p-cresylsulfate and indoxyl sulfate level at different stages of chronic kidney disease. J. Clin. Lab. Anal. 2011, 25, 191–197. [Google Scholar] [CrossRef]
- Sirich, T.L.; Funk, B.A.; Plummer, N.S.; Hostetter, T.H.; Meyer, T.W. Prominent Accumulation in Hemodialysis Patients of Solutes Normally Cleared by Tubular Secretion. J. Am. Soc. Nephrol. 2014, 25, 615–622. [Google Scholar] [CrossRef]
- Lesaffer, G.; De Smet, R.; Lameire, N.; Dhondt, A.; Duym, P.; Vanholder, R. Intradialytic removal of protein-bound uraemic toxins: Role of solute characteristics and of dialyser membrane. Nephrol. Dial. Transplant. 2000, 15, 50–57. [Google Scholar] [CrossRef]
- Wu, I.-W.; Hsu, K.-H.; Lee, C.-C.; Sun, C.-Y.; Hsu, H.-J.; Tsai, C.-J.; Tzen, C.-Y.; Wang, Y.-C.; Lin, C.-Y.; Wu, M.-S. p-Cresyl sulphate and indoxyl sulphate predict progression of chronic kidney disease. Nephrol. Dial. Transplant. 2011, 26, 938–947. [Google Scholar] [CrossRef]
- Rossi, M.; Campbell, K.L.; Johnson, D.W.; Stanton, T.; Vesey, D.A.; Coombes, J.S.; Weston, K.S.; Hawley, C.M.; McWhinney, B.C.; Ungerer, J.P.; et al. Protein-bound Uremic Toxins, Inflammation and Oxidative Stress: A Cross-sectional Study in Stage 3–4 Chronic Kidney Disease. Arch. Med. Res. 2014, 45, 309–317. [Google Scholar] [CrossRef]
- Borges, N.A.; Barros, A.F.; Nakao, L.S.; Dolenga, C.J.; Fouque, D.; Mafra, D. Protein-Bound Uremic Toxins from Gut Microbiota and Inflammatory Markers in Chronic Kidney Disease. J. Ren. Nutr. 2016, 26, 396–400. [Google Scholar] [CrossRef]
- Rossi, M.; Campbell, K.; Johnson, D.; Stanton, T.; Pascoe, E.; Hawley, C.; Dimeski, G.; McWhinney, B.; Ungerer, J.; Isbel, N. Uraemic toxins and cardiovascular disease across the chronic kidney disease spectrum: An observational study. Nutr. Metab. Cardiovasc. Dis. 2014, 24, 1035–1042. [Google Scholar] [CrossRef]
- Dou, L.; Sallée, M.; Cerini, C.; Poitevin, S.; Gondouin, B.; Jourde-Chiche, N.; Fallague, K.; Brunet, P.; Calaf, R.; Dussol, B.; et al. The Cardiovascular Effect of the Uremic Solute Indole-3 Acetic Acid. J. Am. Soc. Nephrol. 2015, 26, 876–887. [Google Scholar] [CrossRef] [PubMed]
- Barreto, F.C.; Barreto, D.V.; Liabeuf, S.; Meert, N.; Glorieux, G.; Temmar, M.; Choukroun, G.; Vanholder, R.; Massy, Z.A.; on behalf of the European Uremic Toxin Work Group (EUTox). Serum Indoxyl Sulfate Is Associated with Vascular Disease and Mortality in Chronic Kidney Disease Patients. Clin. J. Am. Soc. Nephrol. 2009, 4, 1551–1558. [Google Scholar] [CrossRef]
- Lin, C.-J.; Wu, V.; Wu, P.-C.; Wu, C.-J. Meta-Analysis of the Associations of p-Cresyl Sulfate (PCS) and Indoxyl Sulfate (IS) with Cardiovascular Events and All-Cause Mortality in Patients with Chronic Renal Failure. PLoS ONE 2015, 10, e0132589. [Google Scholar] [CrossRef] [PubMed]
- Shafi, T.; Meyer, T.W.; Hostetter, T.H.; Melamed, M.L.; Parekh, R.S.; Hwang, S.; Banerjee, T.; Coresh, J.; Powe, N.R. Free Levels of Selected Organic Solutes and Cardiovascular Morbidity and Mortality in Hemodialysis Patients: Results from the Retained Organic Solutes and Clinical Outcomes (ROSCO) Investigators. PLoS ONE 2015, 10, e0126048. [Google Scholar] [CrossRef] [PubMed]
- Vaziri, N.D.; Wong, J.; Pahl, M.V.; Piceno, Y.M.; Yuan, J.; DeSantis, T.Z.; Ni, Z.; Nguyen, T.-H.; Andersen, G.L. Chronic kidney disease alters intestinal microbial flora. Kidney Int. 2013, 83, 308–315. [Google Scholar] [CrossRef]
- Wong, J.; Piceno, Y.M.; DeSantis, T.Z.; Pahl, M.; Andersen, G.L.; Vaziri, N.D. Expansion of Urease- and Uricase-Containing, Indole- and p-Cresol-Forming and Contraction of Short-Chain Fatty Acid-Producing Intestinal Microbiota in ESRD. Am. J. Nephrol. 2014, 39, 230–237. [Google Scholar] [CrossRef]
- Stadlbauer, V.; Horvath, A.; Ribitsch, W.; Schmerböck, B.; Schilcher, G.; Lemesch, S.; Stiegler, P.; Rosenkranz, A.R.; Fickert, P.; Leber, B. Structural and functional differences in gut microbiome composition in patients undergoing haemodialysis or peritoneal dialysis. Sci. Rep. 2017, 7, 15601. [Google Scholar] [CrossRef]
- Hu, J.; Zhong, X.; Yan, J.; Zhou, D.; Qin, D.; Xiao, X.; Zheng, Y.; Liu, Y. High-throughput sequencing analysis of intestinal flora changes in ESRD and CKD patients. BMC Nephrol. 2020, 21, 1–11. [Google Scholar] [CrossRef] [PubMed]
- Lozupone, C.A.; Stombaugh, J.I.; Gordon, J.I.; Jansson, J.K.; Knight, R. Diversity, stability and resilience of the human gut microbiota. Nat. Cell Biol. 2012, 489, 220–230. [Google Scholar] [CrossRef] [PubMed]
- Gryp, T.; De Paepe, K.; Vanholder, R.; Kerckhof, F.-M.; Van Biesen, W.; Van De Wiele, T.; Verbeke, F.; Speeckaert, M.; Joossens, M.; Couttenye, M.M.; et al. Gut microbiota generation of protein-bound uremic toxins and related metabolites is not altered at different stages of chronic kidney disease. Kidney Int. 2020, 97, 1230–1242. [Google Scholar] [CrossRef]
- Poesen, R.; Windey, K.; Neven, E.; Kuypers, D.; De Preter, V.; Augustijns, P.; D’Haese, P.; Evenepoel, P.; Verbeke, K.; Meijers, B. The Influence of CKD on Colonic Microbial Metabolism. J. Am. Soc. Nephrol. 2016, 27, 1389–1399. [Google Scholar] [CrossRef] [PubMed]
- Scott, K.P.; Gratz, S.W.; Sheridan, P.O.; Flint, H.J.; Duncan, S.H. The influence of diet on the gut microbiota. Pharmacol. Res. 2013, 69, 52–60. [Google Scholar] [CrossRef]
- Birkett, A.; Muir, J.; Phillips, J.; Jones, G.; O’Dea, K. Resistant starch lowers fecal concentrations of ammonia and phenols in humans. Am. J. Clin. Nutr. 1996, 63, 766–772. [Google Scholar] [CrossRef]
- Poesen, R.; Mutsaers, H.A.M.; Windey, K.; van den Broek, P.H.; Verweij, V.; Augustijns, P.; Kuypers, D.; Jansen, J.; Evenepoel, P.; Verbeke, K.; et al. The Influence of Dietary Protein Intake on Mammalian Tryptophan and Phenolic Metabolites. PLoS ONE 2015, 10, e0140820. [Google Scholar] [CrossRef] [PubMed]
- Patel, K.P.; Luo, F.J.-G.; Plummer, N.S.; Hostetter, T.H.; Meyer, T.W. The Production of p-Cresol Sulfate and Indoxyl Sulfate in Vegetarians Versus Omnivores. Clin. J. Am. Soc. Nephrol. 2012, 7, 982–988. [Google Scholar] [CrossRef] [PubMed]
- Rossi, M.; Johnson, D.; Xu, H.; Carrero, J.; Pascoe, E.; French, C.; Campbell, K. Dietary protein-fiber ratio associates with circulating levels of indoxyl sulfate and p-cresyl sulfate in chronic kidney disease patients. Nutr. Metab. Cardiovasc. Dis. 2015, 25, 860–865. [Google Scholar] [CrossRef]
- Kalantar-Zadeh, K.; Kopple, J.D.; Deepak, S.; Block, D.; Block, G. Food intake characteristics of hemodialysis patients as obtained by food frequency questionnaire. J. Ren. Nutr. 2002, 12, 17–31. [Google Scholar] [CrossRef] [PubMed]
- Schena, F.P. Management of patients with chronic kidney disease. Intern. Emerg. Med. 2011, 6 (Suppl. S1), 77–83. [Google Scholar] [CrossRef]
- Gibson, G.R.; Hutkins, R.; Sanders, M.E.; Prescott, S.L.; Reimer, R.A.; Salminen, S.J.; Scott, K.; Stanton, C.; Swanson, K.S.; Cani, P.D.; et al. Expert consensus document: The International Scientific Association for Probiotics and Prebiotics (ISAPP) consensus statement on the definition and scope of prebiotics. Nat. Rev. Gastroenterol. Hepatol. 2017, 14, 491–502. [Google Scholar] [CrossRef]
- Jones, J.M. CODEX-aligned dietary fiber definitions help to bridge the ‘fiber gap’. Nutr. J. 2014, 13, 34. [Google Scholar] [CrossRef] [PubMed]
- Sirich, T.L.; Plummer, N.S.; Gardner, C.D.; Hostetter, T.H.; Meyer, T.W. Effect of Increasing Dietary Fiber on Plasma Levels of Colon-Derived Solutes in Hemodialysis Patients. Clin. J. Am. Soc. Nephrol. 2014, 9, 1603–1610. [Google Scholar] [CrossRef] [PubMed]
- Kieffer, D.A.; Piccolo, B.D.; Vaziri, N.D.; Liu, S.; Lau, W.L.; Khazaeli, M.; Nazertehrani, S.; Moore, M.E.; Marco, M.L.; Martin, R.J.; et al. Resistant starch alters gut microbiome and metabolomic profiles concurrent with amelioration of chronic kidney disease in rats. Am. J. Physiol. Renal. Physiol. 2016, 310, F857–F871. [Google Scholar] [CrossRef] [PubMed]
- Esgalhado, M.; Kemp, J.A.; Paiva, B.R.; Brito, J.S.; Cardozo, L.F.M.F.; Azevedo, R.; Cunha, D.B.; Nakao, L.S.; Mafra, D. Resistant starch type-2 enriched cookies modulate uremic toxins and inflammation in hemodialysis patients: A randomized, double-blind, crossover and placebo-controlled trial. Food Funct. 2020, 11, 2617–2625. [Google Scholar] [CrossRef]
- Menezes, E.W.; Tadini, C.C.; Tribess, T.B.; Zuleta, A.; Binaghi, J.; Pak, N.; Vera, G.; Dan, M.C.T.; Bertolini, A.C.; Cordenunsi, B.R.; et al. Chemical Composition and Nutritional Value of Unripe Banana Flour (Musa acuminata, var. Nanicão). Plant Foods Hum. Nutr. 2011, 66, 231–237. [Google Scholar] [CrossRef] [PubMed]
- Tribess, T.B.; Hernandez-Uribe, J.P.; Mendez-Montealvo, M.G.C.; Menezes, E.W.; Bello-Perez, L.A.; Tadini, C.C. Thermal properties and resistant starch content of green banana flour (Musa cavendishii) produced at different drying conditions. LWT 2009, 42, 1022–1025. [Google Scholar] [CrossRef]
- AOAC. Official Methods of Analysis of AOAC International, 18th ed.; AOAC International: Rockville, MD, USA, 2006. [Google Scholar]
- Cordenunsi, B.R.; Lajolo, F.M. Starch Breakdown during Banana Ripening: Sucrose Synthase and Sucrose Phosphate Synthase. J. Agric. Food Chem. 1995, 43, 347–351. [Google Scholar] [CrossRef]
- Kopple, J.D. National kidney foundation K/DOQI clinical practice guidelines for nutrition in chronic renal failure. Am. J. Kidney Dis. 2000, 35 (Suppl. S2), S1–S140. [Google Scholar] [CrossRef] [PubMed]
- Fouque, D.; Vennegoor, M.; Ter Wee, P.; Wanner, C.; Basci, A.; Canaud, B.; Haage, P.; Konner, K.; Kooman, J.; Martin-Malo, A.; et al. EBPG Guideline on Nutrition. Nephrol. Dial. Transplant. 2007, 22, ii45–ii87. [Google Scholar] [CrossRef] [PubMed]
- Rodrigues, S.D.; Santos, S.S.; Meireles, T.; Romero, N.; Glorieux, G.; Pecoits-Filho, R.; Zhang, D.D.; Nakao, L.S. Uremic toxins promote accumulation of oxidized protein and increased sensitivity to hydrogen peroxide in endothelial cells by impairing the autophagic flux. Biochem. Biophys. Res. Commun. 2020, 523, 123–129. [Google Scholar] [CrossRef]
- van Olden, R.W.; Krediet, R.T.; Struijk, D.G.; Arisz, L. Measurement of residual renal function in patients treated with continuous ambulatory peritoneal dialysis. J. Am. Soc. Nephrol. 1996, 7, 745–750. [Google Scholar]
- Group PDAW. Clinical Practice Guidelines for Peritoneal Dialysis Adequacy. Am. J. Kidney Dis. 2006, 48 (Suppl. S1), S98–S129. [Google Scholar] [CrossRef]
- Souza, G.S.; Sardá, F.A.H.; Giuntini, E.B.; Gumbrevicius, I.; De Morais, M.B.; De Menezes, E.W. TRANSLATION AND VALIDATION OF THE BRAZILIAN PORTUGUESE VERSION OF THE GASTROINTESTINAL SYMPTOM RATING SCALE (GSRS) QUESTIONNAIRE. Arq. de Gastroenterol. 2016, 53, 146–151. [Google Scholar] [CrossRef] [PubMed]
- Khosroshahi, H.T.; Abedi, B.; Ghojazadeh, M.; Samadi, A.; Jouyban, A. Effects of fermentable high fiber diet supplementation on gut derived and conventional nitrogenous product in patients on maintenance hemodialysis: A randomized controlled trial. Nutr. Metab. 2019, 16, 1–8. [Google Scholar] [CrossRef] [PubMed]
- Snelson, M.; Kellow, N.J.; Coughlan, M.T. Modulation of the Gut Microbiota by Resistant Starch as a Treatment of Chronic Kidney Diseases: Evidence of Efficacy and Mechanistic Insights. Adv. Nutr. 2019, 10, 303–320. [Google Scholar] [CrossRef] [PubMed]
- Zybailov, B.L.; Glazko, G.V.; Rahmatallah, Y.; Andreyev, D.S.; McElroy, T.; Karaduta, O.; Byrum, S.D.; Orr, L.; Tackett, A.J.; Mackintosh, S.G.; et al. Metaproteomics reveals potential mechanisms by which dietary resistant starch supplementation attenuates chronic kidney disease progression in rats. PLoS ONE 2019, 14, e0199274. [Google Scholar] [CrossRef]
- Ze, X.; Duncan, S.H.; Louis, P.; Flint, H.J. Ruminococcus bromii is a keystone species for the degradation of resistant starch in the human colon. ISME J. 2012, 6, 1535–1543. [Google Scholar] [CrossRef] [PubMed]
- Laffin, M.R.; Khosroshahi, H.T.; Park, H.; Laffin, L.J.; Madsen, K.; Kafil, H.S.; Abedi, B.; Shiralizadeh, S.; Vaziri, N.D. Amylose resistant starch (HAM-RS2) supplementation increases the proportion of Faecalibacterium bacteria in end-stage renal disease patients: Microbial analysis from a randomized placebo-controlled trial. Hemodial. Int. 2019, 23, 343–347. [Google Scholar] [CrossRef]
- Hold, G.L.; Schwiertz, A.; Aminov, R.I.; Blaut, M.; Flint, H.J. Oligonucleotide Probes That Detect Quantitatively Significant Groups of Butyrate-Producing Bacteria in Human Feces. Appl. Environ. Microbiol. 2003, 69, 4320–4324. [Google Scholar] [CrossRef] [PubMed]
- Louis, P.; Flint, H.J. Diversity, metabolism and microbial ecology of butyrate-producing bacteria from the human large intestine. FEMS Microbiol. Lett. 2009, 294, 1–8. [Google Scholar] [CrossRef] [PubMed]
- Jiang, S.; Xie, S.; Lv, D.; Zhang, Y.; Deng, J.; Zeng, L.; Chen, Y. A reduction in the butyrate producing species roseburia spp. and Faecalibacterium prausnitzii is associated with chronic kidney disease progression. Antonie van Leeuwenhoek 2016, 109, 1389–1396. [Google Scholar] [CrossRef] [PubMed]
- Qin, J.; MetaHIT Consortium; Li, R.; Raes, J.; Arumugam, M.; Burgdorf, K.S.; Manichanh, C.; Nielsen, T.; Pons, N.; Levenez, F.; et al. A human gut microbial gene catalogue established by metagenomic sequencing. Nat. Cell Biol. 2010, 464, 59–65. [Google Scholar] [CrossRef] [PubMed]
- Joossens, M.; Faust, K.; Gryp, T.; Nguyen, A.T.L.; Wang, J.; Eloot, S.; Schepers, E.; Dhondt, A.; Pletinck, A.; Vieira-Silva, S.; et al. Gut microbiota dynamics and uraemic toxins: One size does not fit all. Gut 2019, 68, 2257–2260. [Google Scholar] [CrossRef] [PubMed]
- Meijers, B.K.I.; De Preter, V.; Verbeke, K.; Vanrenterghem, Y.; Evenepoel, P. p-Cresyl sulfate serum concentrations in haemodialysis patients are reduced by the prebiotic oligofructose-enriched inulin. Nephrol. Dial. Transplant. 2009, 25, 219–224. [Google Scholar] [CrossRef] [PubMed]
- Salmean, Y.A.; Segal, M.S.; Palii, S.P.; Dahl, W.J. Fiber Supplementation Lowers Plasma p-Cresol in Chronic Kidney Disease Patients. J. Ren. Nutr. 2015, 25, 316–320. [Google Scholar] [CrossRef]
- Ramos, C.I.; Armani, R.G.; Canziani, M.E.F.; Dalboni, M.A.; Dolenga, C.J.R.; Nakao, L.S.; Campbell, K.L.; Cuppari, L. Effect of prebiotic (fructooligosaccharide) on uremic toxins of chronic kidney disease patients: A randomized controlled trial. Nephrol. Dial. Transplant. 2019, 34, 1876–1884. [Google Scholar] [CrossRef]
- Li, L.; Xiong, Q.; Zhao, J.; Lin, X.; He, S.; Wu, N.; Yao, Y.; Liang, W.; Zuo, X.; Ying, C. Inulin-type fructan intervention restricts the increase in gut microbiome–generated indole in patients with peritoneal dialysis: A randomized crossover study. Am. J. Clin. Nutr. 2020, 111, 1087–1099. [Google Scholar] [CrossRef] [PubMed]
- Guarino, M.P.L.; Altomare, A.; Emerenziani, S.; Di Rosa, C.; Ribolsi, M.; Balestrieri, P.; Iovino, P.; Rocchi, G.; Cicala, M. Mechanisms of Action of Prebiotics and Their Effects on Gastro-Intestinal Disorders in Adults. Nutrients 2020, 12, 1037. [Google Scholar] [CrossRef]
- Akchurin, O.M.; Kaskel, F. Update on Inflammation in Chronic Kidney Disease. Blood Purif. 2015, 39, 84–92. [Google Scholar] [CrossRef] [PubMed]
- Lau, W.L.; Kalantar-Zadeh, K.; Vaziri, N.D. The Gut as a Source of Inflammation in Chronic Kidney Disease. Nephron 2015, 130, 92–98. [Google Scholar] [CrossRef] [PubMed]
- Smith, P.M.; Howitt, M.R.; Panikov, N.; Michaud, M.; Gallini, C.A.; Bohlooly-Y, M.; Glickman, J.N.; Garrett, W.S. The Microbial Metabolites, Short-Chain Fatty Acids, Regulate Colonic Treg Cell Homeostasis. Science 2013, 341, 569–573. [Google Scholar] [CrossRef] [PubMed]
- Szeto, C.-C.; Kwan, B.C.-H.; Chow, K.-M.; Lai, K.-B.; Chung, K.-Y.; Leung, C.-B.; Li, P.K.-T. Endotoxemia is Related to Systemic Inflammation and Atherosclerosis in Peritoneal Dialysis Patients. Clin. J. Am. Soc. Nephrol. 2008, 3, 431–436. [Google Scholar] [CrossRef]
- McIntyre, C.W.; Harrison, L.E.; Eldehni, M.T.; Jefferies, H.J.; Szeto, C.-C.; John, S.G.; Sigrist, M.K.; Burton, J.O.; Hothi, D.; Korsheed, S.; et al. Circulating Endotoxemia: A Novel Factor in Systemic Inflammation and Cardiovascular Disease in Chronic Kidney Disease. Clin. J. Am. Soc. Nephrol. 2011, 6, 133–141. [Google Scholar] [CrossRef] [PubMed]
- Vaziri, N.D.; Liu, S.-M.; Lau, W.L.; Khazaeli, M.; Nazertehrani, S.; Farzaneh, S.H.; Kieffer, D.A.; Adams, S.H.; Martin, R.J. High Amylose Resistant Starch Diet Ameliorates Oxidative Stress, Inflammation, and Progression of Chronic Kidney Disease. PLoS ONE 2014, 9, e114881. [Google Scholar] [CrossRef]
- Khosroshahi, H.T.; Vaziri, N.D.; Abedi, B.; Asl, B.H.; Ghojazadeh, M.; Jing, W.; Vatankhah, A.M. Effect of high amylose resistant starch (HAM-RS2) supplementation on biomarkers of inflammation and oxidative stress in hemodialysis patients: A randomized clinical trial. Hemodial. Int. 2018, 22, 492–500. [Google Scholar] [CrossRef] [PubMed]


| Variables | All Patients (n = 43) | Patients Who Discontinued the Study (n = 17) | Patients Who Completed the Follow Up (n = 26) | p * |
|---|---|---|---|---|
| Age (years) | 52 ± 18 | 49 ± 16 | 55 ± 12 | 0.16 |
| Male (n (%)) | 23 (53.5) | 9 (52.9) | 14 (53.8) | 0.95 |
| BMI (kg/m2) | 25.9 ± 4.1 | 24.7 ± 3.9 | 26.7 ± 4.1 | 0.12 |
| GSRS score | 29 (24–41) | 35 (29–42) | 27.5 (21.2–36.5) | 0.03 |
| Diabetes (n (%)) | 13 (30) | 4 (23.5) | 9 (34.6) | 0.44 |
| Dialysis vintage (months) | 18 (6–42) | 18 (11–49) | 16 (5–31) | 0.22 |
| Residual diuresis (n (%)) | 35 (81.5) | 13 (76.5) | 22 (84.6) | 0.69 |
| RRF (mL/min./1.73 m²) | 4.3 ± 3.3 | 4.5 ± 2.4 | 5.8 ± 3 | 0.20 |
| Urine volume (mL/24 h) | 1224 ± 543 | 1105 ± 532 | 1294 ± 549 | 0.33 |
| Weekly Kt/V | 2.12 ± 0.55 | 2.0 ± 0.5 | 2.2 ± 0.6 | 0.22 |
| Daily ultrafiltration (mL) | 824.6 ± 444 | 759 ± 442 | 867.5 ± 448 | 0.44 |
| Laboratory data | ||||
| Urea (mg/dL) | 124 ± 26 | 129 ± 27 | 120 ± 26 | 0.31 |
| Creatinine (mg/dL) | 8.3 (6.5–11.8) | 10.3 (7.4–13.1) | 7.4 (6–11.6) | 0.26 |
| Albumin (g/dL) | 3.9 ± 0.34 | 3.9 ± 0.31 | 4 ± 0.36 | 0.48 |
| Hemoglobin (g/dL) | 11.6 ± 1.4 | 11.5 ± 1.7 | 11.7 ± 1.2 | 0.60 |
| HbA1C (%) | 5.7 (5.3–7) | 5.7 (5.2–6) | 5.8 (5.3–7.4) | 0.52 |
| hsCRP (mg/dL) | 0.23 (0.11–0.53) | 0.21 (0.1–0.44) | 0.24 (0.1–0.59) | 0.58 |
| Uremic toxins | ||||
| Serum total IS (μmol/L) | 79 (49–150) | 84 (55–168) | 62 (45–133) | 0.24 |
| Serum total pCS (μmol/L) | 182 ± 97.7 | 196 ± 96.3 | 173 ± 99.4 | 0.46 |
| Serum total IAA (μmol/L) | 8.8 (5.6–14.3) | 8.8 (5.7–16.4) | 8.8 (5.5–13.3) | 0.77 |
| Daily dietary intake | ||||
| Energy (kcal/kg) | 22 ± 6 | 21 ± 6 | 23 ± 6 | 0.50 |
| Protein (g/kg) | 0.75 (0.55–0.95) | 0.73 (0.53–1.1) | 0.76 (0.57–0.9) | 0.84 |
| Fiber (g) | 9 (6.5–13.5) | 8.8 (6.4–13.1) | 9 (6.2–14.5) | 0.80 |
| Protein:fiber ratio | 5.1 (3.4–8.3) | 5 (3.9–7.6) | 5.8 (2.8–8.7) | 0.98 |
| PNA (g/kg) | 0.69 ± 0.13 | 0.7 ± 0.13 | 0.69 ± 0.13 | 0.81 |
| Variables | UBF | Placebo | p | ||
|---|---|---|---|---|---|
| Pre | Post | Pre | Post | ||
| Laboratory data | |||||
| Urea (mg/dL) | 121 ± 25 | 126 ± 31 | 124 ± 24 | 128 ± 27 | 0.37 |
| Creatinine (mg/dL) | 7.5 (6–11.7) | 8.4 (6.2–12) a | 8 (6.7–12.4) | 8.4 (6.5–12.8) b | 0.01 |
| Sodium (mEq/L) | 139 ± 2 | 139 ± 2 | 139 ± 2 | 139 ± 2 b | 0.02 |
| Potassium (mEq/L) | 4.7 (4.3–4.9) | 4.8 (4.3–5.2) | 4.6 (4.4–5.2) | 4.5 (4.3–5.1) | 0.60 |
| Ionized calcium (mmol/L) | 1.25 ± 0.08 | 1.24 ± 0.1 | 1.24 ± 0.08 | 1.24 ± 0.09 | 0.93 |
| Phosphorus (mg/dL) | 5.8 (4.9–6.5) | 5.5 (5.2–6) | 5.5 (4.6–5.9) | 5.6 (5–6.3) | 0.12 |
| Glucose (mg/dL) | 85 (79–118) | 91 (77–112) | 85 (78–104) | 91 (83–103) | 0.26 |
| Albumin (g/dL) | 3.9 ± 0.3 | 3.9 ± 0.3 | 3.9 ± 0.4 | 3.9 ± 0.3 | 0.93 |
| HbA1C (%) | 5.8 (5.5–7.2) | 5.7 (5.3–7.7) | 5.9 (5.2–8.3) | 5.9 (5.3–8.1) | 1.0 |
| Urine volume (mL/24 h) | 1272 ± 571 | 1235 ± 569 | 1211 ± 551 | 1312 ± 677 | 0.60 |
| RRF (mL/min./1.73 m²) | 5.7 ± 3 | 5.7 ± 3.3 | 5.3 ± 2.8 | 5.9 ± 3.6 | 0.05 |
| Weekly Kt/V | 2.2 ± 0.6 | 2.1 ± 0.6 | 2.1 ± 0.5 | 2.2 ± 0.6 | 0.17 |
| Inflammatory markers | |||||
| hsCRP (mg/dL) | 0.25 (0.1–0.5) | 0.20 (0.08–0.5) | 0.22 (0.09–0.4) | 0.26 (0.1–0.4) | 0.08 |
| IL-6 (pg/mL) | 3.6 (2.2–5.8) | 3.8 (2.8–7.3) b | 4 (2–7.1) | 4.3 (2.5–7.7) b | 0.004 |
| IL-10 (pg/mL) | 13.3 (9.7–19.3) | 13.3 (9.7–19.9) | 15.8 (7.5–21.7) | 14.1 (9.6–22.6) | 0.52 |
| TNF-α (pg/mL) | 71.3 ± 28 | 68.7 ± 21 | 71.9 ± 27 | 71.1 ± 21.7 | 0.74 |
| LPS (EU/mL) | 0.07 (0.05–0.1) | 0.09 (0.07–0.2) | 0.07 (0.05–0.1) | 0.1 (0.06–0.1) | 0.28 |
| Daily dietary intake | |||||
| Energy (kcal/kg) | 21.4 ± 7.1 | 20.6 ± 7.2 | 20.8 ± 5.2 | 20.3 ± 6.1 | 0.44 |
| Protein (g/kg) | 0.74 ± 0.2 | 0.78 ± 0.3 | 0.73 ± 0.2 | 0.74 ± 0.2 | 0.63 |
| Fiber (g) | 7 (5.8–12.2) | 9 (6.5–14.6) | 10 (6.9–15.2) | 9.6 (6.9–13.4) | 0.25 |
| Protein:fiber ratio | 6 (3.6–9.9) c | 6.1 (3.6–8.4) | 4.7 (3.4–7) | 5.7 (3.4–8) | 0.002 |
| PNA (g/kg) | 0.69 ± 0.13 | 0.70 ± 0.17 | 0.69 ± 0.14 | 0.72 ± 0.16 | 0.20 |
| Variables | UBF | Placebo | p | ||
|---|---|---|---|---|---|
| Pre | Post | Pre | Post | ||
| Serum total uremic toxins (μmol/L) | |||||
| IS | 67 (35–141) | 63 (35–139) | 59 (37–137.5) | 72.7 (32.5–136) | 0.70 |
| pCS | 153.5 (88–283) | 171.5 (131–263) | 149.5 (95–235) | 164 (108–242) | 0.70 |
| IAA | 8.7 (5.7–13.4) | 9 (6–15) | 9.7 (5.3–13) | 8 (5.8–13.2) | 0.74 |
| Serum free uremic toxins (μmol/L) | |||||
| IS | 1.4 (0.6–4.3) | 1.6 (0.7–3.5) | 1.7 (0.8–4.2) | 1.5 (0.7–3.1) | 0.95 |
| pCS | 1.8 (0.9–4.7) | 2.2 (1–5.5) | 2.3 (1–5) | 2.3 (1.1–4.6) | 0.24 |
| IAA | 0.60 (0.2–1.1) | 0.65 (0.3–1) | 0.68 (0.25–1) | 0.62 (0.3–0.8) | 0.29 |
| Urinary total uremic toxins (μmol/24 h) | |||||
| IS | 200 (130–290) | 199 (64–263) | 210 (87–273) | 180 (105–285) | 0.36 |
| pCS | 97 (30–184) | 100 (48–286) | 117 (49–240) | 97 (39–222) | 0.25 |
| IAA | 5.7 (2.9–8.6) | 5.2 (2.7–11.3) | 3.6 (2.5–9.3) | 3.9 (2.3–7.6) | 0.55 |
| Dialysate total uremic toxins (μmol/24 h) | |||||
| IS | 30 (14–78) | 29 (15–76) | 33.4 (19–68) | 28.4 (19–88) | 0.45 |
| pCS | 24 (10–139) | 28 (12–88) | 30.4 (10–98) | 25 (12–85) | 0.90 |
| IAA | 8.3 (5–18) | 10 (5–19) | 11.4 (6–19) | 11 (6–15) | 0.82 |
| Variables | UBF | Placebo | p | ||
|---|---|---|---|---|---|
| Pre | Post | Pre | Post | ||
| Serum total uremic toxins (μmol/L) | |||||
| IS | 73 (30–136) | 62.5 (31–133) a,b | 82 (23–163) | 79.5 (31–142) | 0.001 |
| pCS | 136 (82–240) | 144 (75–160) | 124 (90–226) | 144 (74–175) | 0.95 |
| IAA | 6.5 (5–10) | 8.3 (5.8–10.6) | 7.6 (4.9–11.1) | 7.5 (5.8–10) | 0.88 |
| Serum free uremic toxins (μmol/L) | |||||
| IS | 0.98 (0.6–2.5) | 1.0 (0.5–2.2) | 0.86 (0.4–3.2) | 1.1 (0.5–1.9) | 0.24 |
| pCS | 1.1 (0.6–2) | 1.3 (0.8–1.6) | 1.0 (0.9–3) | 1.4 (0.6–2.4) | 0.54 |
| IAA | 0.4 (0.2–0.7) | 0.5 (0.2–0.7) | 0.3 (0.2–0.8) | 0.4 (0.3–0.8) | 0.62 |
| Urinary total uremic toxins (μmol/24 h) | |||||
| IS | 192 (109–240) | 176 (49–226) | 154 (56–220) | 160 (95–238) | 0.05 |
| pCS | 82 (19–201) | 85 (14–232) | 60 (25–211) | 79 (31–190) | 0.76 |
| IAA | 4.4 (2.9–7.1) | 3.4 (2.7–6) | 2.8 (2.2–6.1) | 3.1 (2–4.1) | 0.14 |
| Dialysate total uremic toxins (μmol/24 h) | |||||
| IS | 19.7 (14.7–66.1) | 19.6 (8.4–33.2) | 29.8 (10.3–67.5) | 27.9 (11–51) | 0.27 |
| pCS | 23.8 (5.6–66.7) | 13.3 (7.5–51.8) | 14.9 (3.5–34.3) | 22.5 (2.8–40) | 0.30 |
| IAA | 6.3 (4.1–15.4) | 6.1 (3.9–12.2) | 5.9 (4.2–14.1) | 9.6 (3.9–13.6) | 0.40 |
Publisher’s Note: MDPI stays neutral with regard to jurisdictional claims in published maps and institutional affiliations. |
© 2021 by the authors. Licensee MDPI, Basel, Switzerland. This article is an open access article distributed under the terms and conditions of the Creative Commons Attribution (CC BY) license (http://creativecommons.org/licenses/by/4.0/).
Share and Cite
de Andrade, L.S.; Sardá, F.A.H.; Pereira, N.B.F.; Teixeira, R.R.; Rodrigues, S.D.; de Lima, J.D.; Dalboni, M.A.; Aoike, D.T.; Nakao, L.S.; Cuppari, L. Effect of Unripe Banana Flour on Gut-Derived Uremic Toxins in Individuals Undergoing Peritoneal Dialysis: A Randomized, Double-Blind, Placebo-Controlled, Crossover Trial. Nutrients 2021, 13, 646. https://doi.org/10.3390/nu13020646
de Andrade LS, Sardá FAH, Pereira NBF, Teixeira RR, Rodrigues SD, de Lima JD, Dalboni MA, Aoike DT, Nakao LS, Cuppari L. Effect of Unripe Banana Flour on Gut-Derived Uremic Toxins in Individuals Undergoing Peritoneal Dialysis: A Randomized, Double-Blind, Placebo-Controlled, Crossover Trial. Nutrients. 2021; 13(2):646. https://doi.org/10.3390/nu13020646
Chicago/Turabian Stylede Andrade, Laila Santos, Fabiana Andréa Hoffmann Sardá, Natalia Barros Ferreira Pereira, Renata Rodrigues Teixeira, Silvia Daniéle Rodrigues, Jordana Dinorá de Lima, Maria Aparecida Dalboni, Danilo Takashi Aoike, Lia Sumie Nakao, and Lilian Cuppari. 2021. "Effect of Unripe Banana Flour on Gut-Derived Uremic Toxins in Individuals Undergoing Peritoneal Dialysis: A Randomized, Double-Blind, Placebo-Controlled, Crossover Trial" Nutrients 13, no. 2: 646. https://doi.org/10.3390/nu13020646
APA Stylede Andrade, L. S., Sardá, F. A. H., Pereira, N. B. F., Teixeira, R. R., Rodrigues, S. D., de Lima, J. D., Dalboni, M. A., Aoike, D. T., Nakao, L. S., & Cuppari, L. (2021). Effect of Unripe Banana Flour on Gut-Derived Uremic Toxins in Individuals Undergoing Peritoneal Dialysis: A Randomized, Double-Blind, Placebo-Controlled, Crossover Trial. Nutrients, 13(2), 646. https://doi.org/10.3390/nu13020646