
Functional Food Components, Intestinal Permeability and Inflammatory Markers in Patients with Inflammatory Bowel Disease


 , ,
, , 
Abstract
1. Introduction
- -
- Curcumin and quercetin are two polyphenols that occur in nature and can influence the intestinal barrier structure. It has already been demonstrated that curcumin can block tumor necrosis factor α (TNFα) and interleukin-1β (IL-1β) induced nuclear factor kappa B (NF -κB) activation, increasing the transepithelial electric resistance and reducing IP [7]. The polyphenol quercetin is the most common flavonoid in nature, and in vitro studies verified that it increases the transepithelial electric resistance and reduces paracellular flux by an increase in claudin-4 and the assembly of ZO-2, occludin and claudin-1 at the TJP level [7].
- -
- -
- Zinc: it seems to present a crucial role in the intestinal barrier integrity through keeping the expression of occludin and claudin-3 and suppressing the proteolysis of occludin [12]. Finamore et al. verified in vitro the importance of zinc in the maintenance of membrane barrier function and in controlling inflammatory reactions. The depletion of zinc caused changes in TJP, promoting the migration of neutrophils [18].
- -
- Vitamin D: the biological activity of 1,25-dihydroxyvitamin D is mediated by the vitamin D receptor that is highly expressed in gut epithelial cells, and its signaling seems to preserve the integrity of the intestinal barrier by inhibiting the phosphorylation of myosin, as well as by raising the expression of TJP [7,14,21].
- -
- Prebiotics (beta-glucans and butyrate): it was verified, in vitro, that the increase of dietary fiber stimulates the production of mucus and the expression of TJP, leading to a reduction of the IP [10,11]. In rats, butyrate strengthens the intestinal barrier through the increase of transepithelial electric resistance [7]. The β-glucans fiber, as it is fermented, leads to a rise in fecal butyrate concentration [20].
- -
- Glutamine: is the main source of amino acids for the intestinal mucosa and can restore stress-induced loss of barrier integrity by increasing transepithelial electric resistance [7]. Despite the importance of glutamine in the small intestine, excessive glutamine in the colon leads to increase oxidative tissue injury; thus, its supplementation is controversial [22].
2. Materials and Methods
2.1. Participants
- -
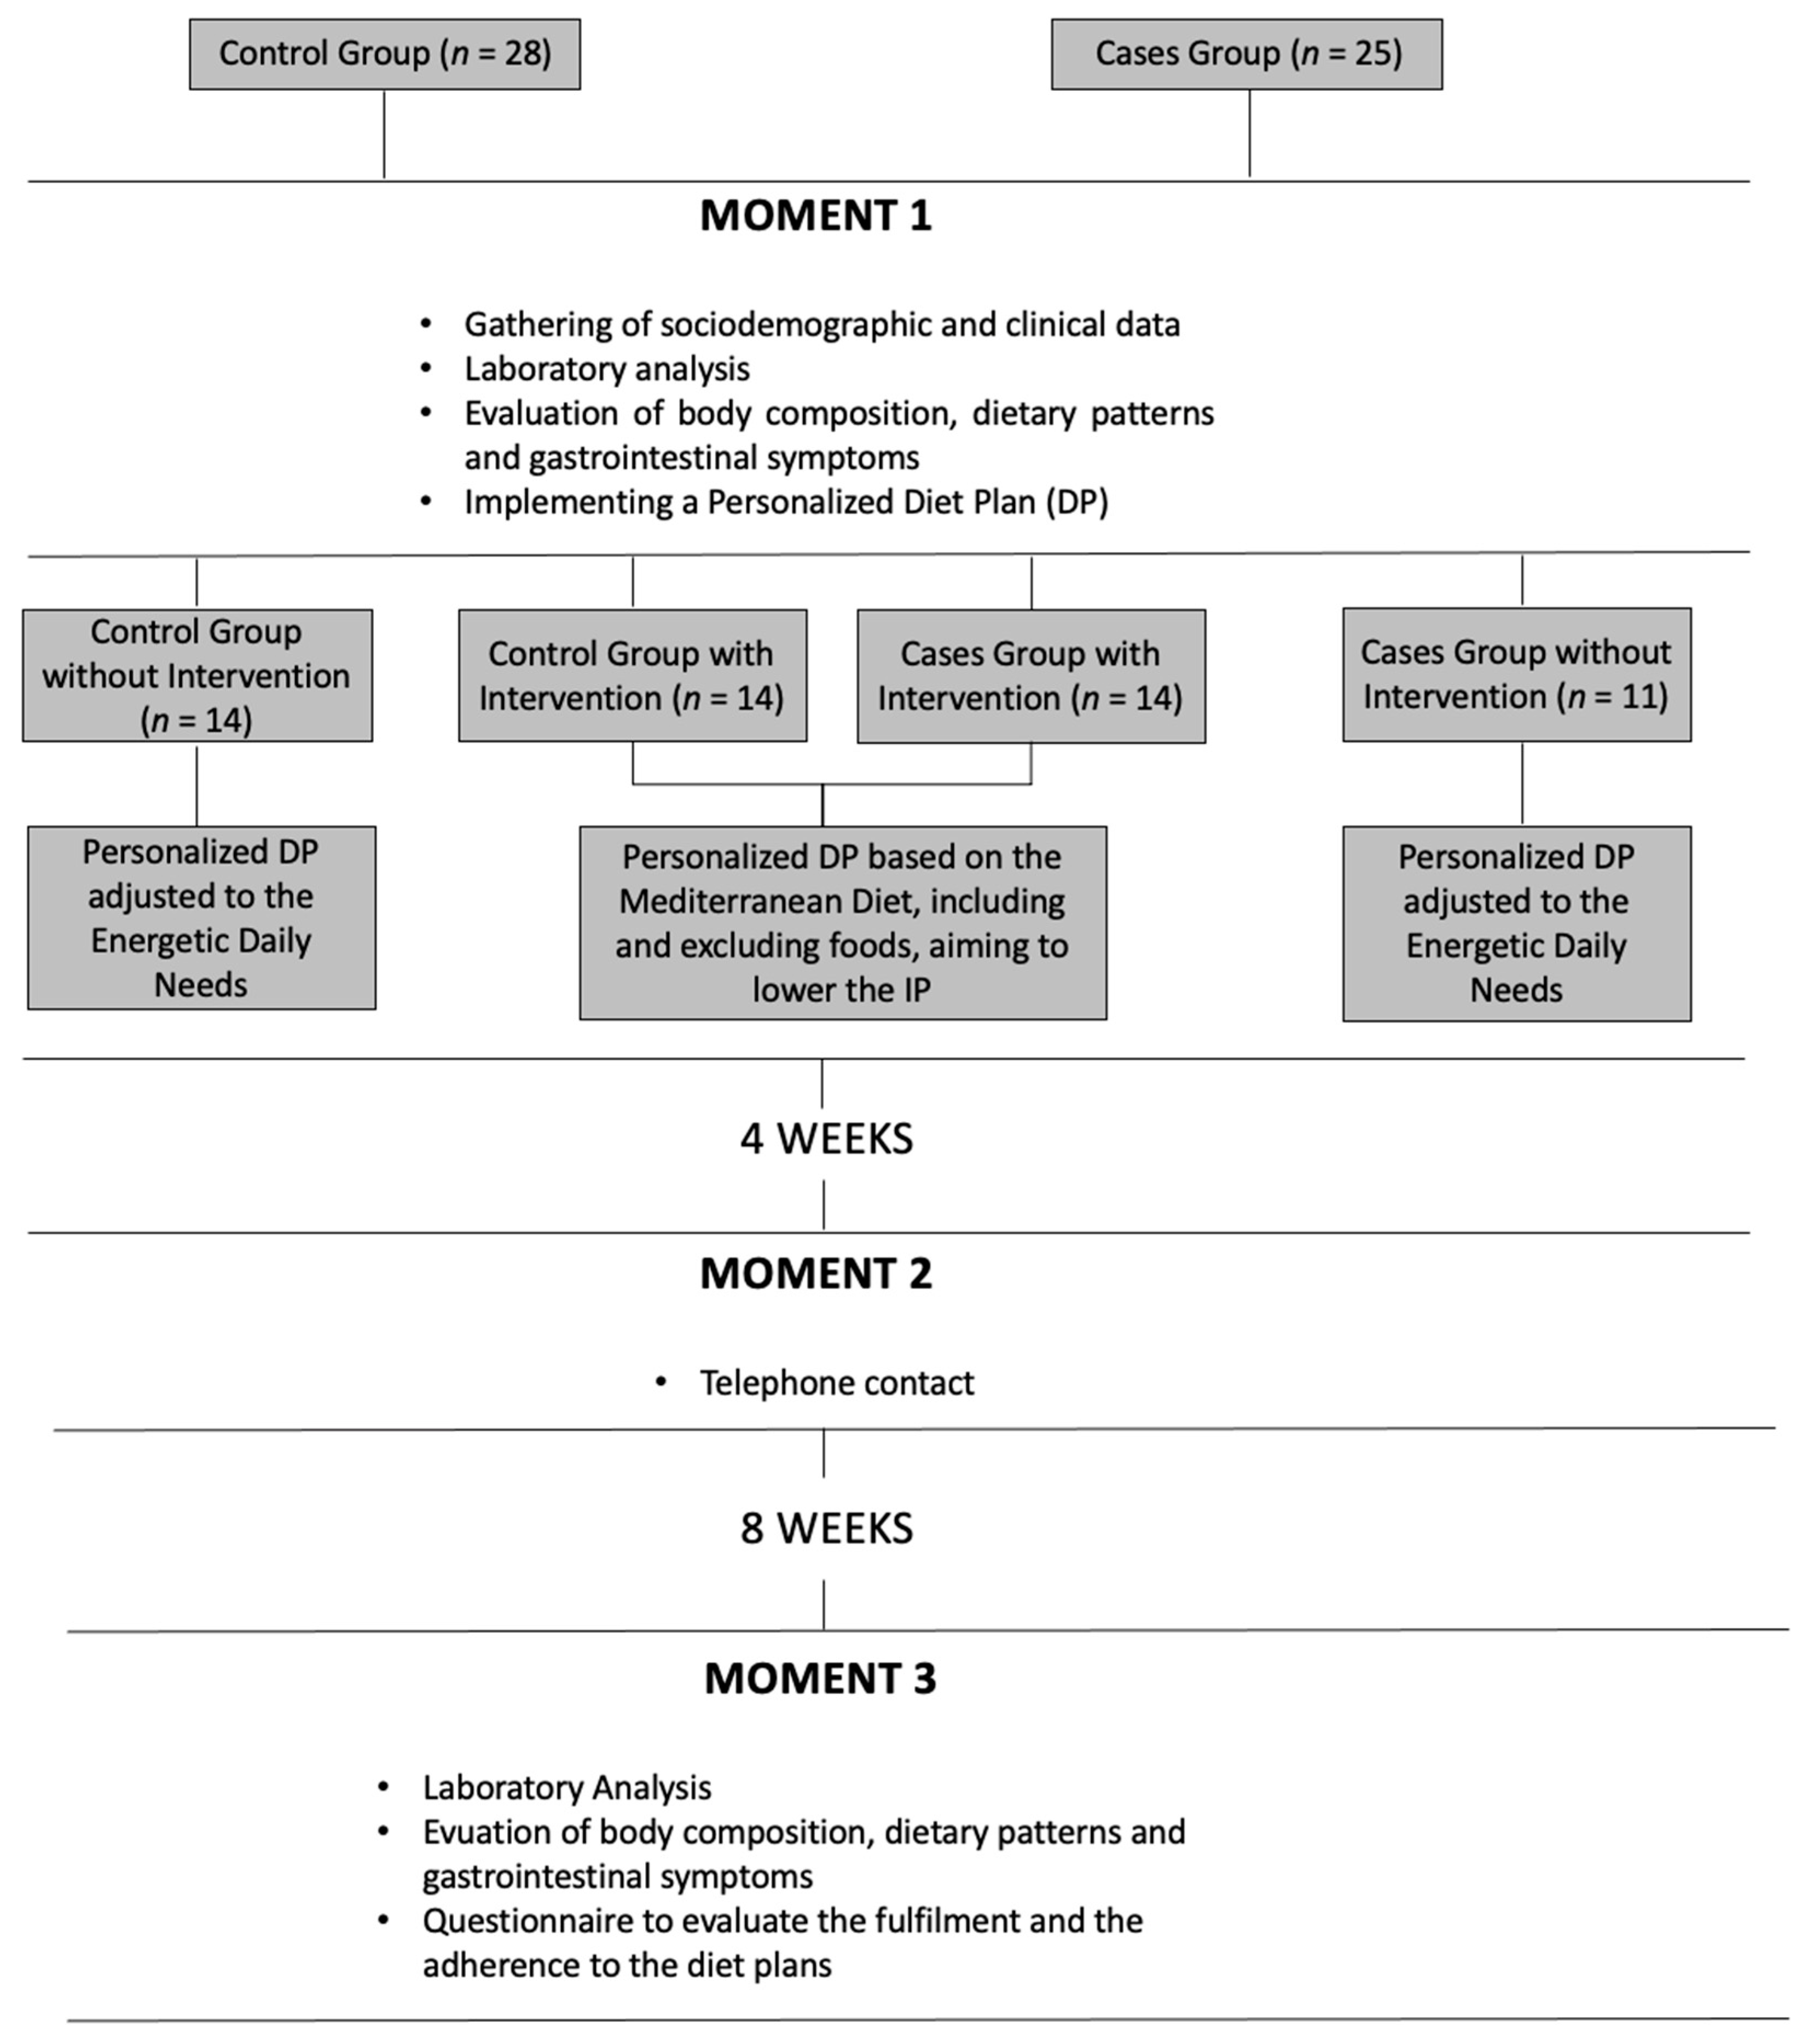
- Patients group (n = 25), in which we established as inclusion criteria the diagnosis of IBD (after clinical, endoscopic and histological evaluation) and age equal or superior to 18. The exclusion criteria were pregnancy/breastfeeding, rheumatoid arthritis, asthma, diabetes mellitus type 1 (DM1), celiac disease, human immunodeficiency virus (HIV), irritable bowel syndrome (IBS), hepatic steatosis, dyspepsia and body mass index (BMI) equal or superior to 30 kg/m2;
- -
- Control group (n = 28), with age equal or superior to 18 as inclusion criteria. As exclusion criteria, we considered: gastrointestinal pathologies, pregnancy/breastfeeding, rheumatoid arthritis, asthma, DM1, HIV and BMI equal or superior to 30 kg/m2
2.2. Study Design and Methodology
Initial Evaluation (M1)
- -
- The intake of gliadin was limited to 4 times per week and only on one of the 7 meals mentioned in the DP;
- -
- Alcohol intake limited to a maximum one dose (100–140 mL) intake per week;
- -
- All food with a high content of lipids and/or sugar were limited to a max intake of 1 to 2 times a month: all foods with more than 17.5 g of lipids or more than 5 g of saturated fat by 100 g of feed and more than 8.75 g of lipids or more than 2.5 g of saturated fat per 100 mL of beverages and/or more than 22.5 g of sugar per 100 g of feed or more than 11.25 g of sugar per 100 mL of beverage;
- -
- Foods having in their composition additives E407 (carrageenan) and E466 (cabroximetilcelulosis) were prohibited.
2.3. Statistical Analysis
3. Results
3.1. Participant Characteristics
3.2. Medication and Disease Activity Evaluation
3.3. Anthropometric Evaluation
3.4. Nutritional Intake
3.5. Food Patterns and Restrictions
3.6. Biochemical Evaluation
3.7. Gastrointestinal Symptomatology
3.8. Relation between Values of Serum Zonulin and Gastrointestinal Symptomatology, Anthropometric Evaluation and Clinical Variables
3.9. Diet Plan Adhesion and Satisfaction
4. Discussion
5. Conclusions
Author Contributions
Funding
Institutional Review Board Statement
Informed Consent Statement
Data Availability Statement
Conflicts of Interest
References
- Parian, A.M.; Mullin, G.E.; Langhorst, J.; Brown, A.C. Inflammatory Bowel Disease. Integr. Med. 2018, 347, 501–516.e8. [Google Scholar] [CrossRef]
- König, J.; Wells, J.; Cani, P.; Garcia-Rodenas, C.L.; Macdonald, T.; Mercenier, A.; Whyte, J.; Troost, F.; Brummer, R.-J. Human Intestinal Barrier Function in Health and Disease. Clin. Transl. Gastroenterol. 2016, 7, e196. [Google Scholar] [CrossRef]
- Leech, B.; Schloss, J.; Steel, A. Association between increased intestinal permeability and disease: A systematic review. Adv. Integr. Med. 2019, 6, 23–34. [Google Scholar] [CrossRef]
- Caviglia, G.P.; Dughera, F.; Ribaldone, D.G.; Rosso, C.; Abate, M.L.; Pellicano, R.; Bresso, F.; Smedile, A.; Saracco, G.M.; Astegiano, M. Serum zonulin in patients with inflammatory bowel disease: a pilot study. Minerva Med. 2019, 110, 95–100. [Google Scholar] [CrossRef] [PubMed]
- Mokkala, K.; Pellonperä, O.; Röytiö, H.; Pussinen, P.; Rönnemaa, T.; Laitinen, K. Increased intestinal permeability, measured by serum zonulin, is associated with metabolic risk markers in overweight pregnant women. Metabolism 2017, 69, 43–50. [Google Scholar] [CrossRef] [PubMed]
- Sapone, A.; De Magistris, L.; Pietzak, M.; Clemente, M.G.; Tripathi, A.; Cucca, F.; Lampis, R.; Kryszak, D.; Cartenì, M.; Generoso, M.; et al. Zonulin Upregulation Is Associated With Increased Gut Permeability in Subjects With Type 1 Diabetes and Their Relatives. Diabetes 2006, 55, 1443–1449. [Google Scholar] [CrossRef]
- Santis, S.E.; Ecavalcanti, E.; Emastronardi, M.; Ejirillo, E.; Chieppa, M. Nutritional Keys for Intestinal Barrier Modulation. Front. Immunol. 2015, 6, 612. [Google Scholar] [CrossRef] [PubMed]
- Levine, A.; Boneh, R.S.; Wine, E. Evolving role of diet in the pathogenesis and treatment of inflammatory bowel diseases. Gut 2018, 67, 1726–1738. [Google Scholar] [CrossRef]
- Liu, W.; Mi, S.; Ruan, Z.; Li, J.; Shu, X.; Yao, K.; Jiang, M.; Deng, Z.-Y. Dietary Tryptophan Enhanced the Expression of Tight Junction Protein ZO-1 in Intestine. J. Food Sci. 2017, 82, 562–567. [Google Scholar] [CrossRef]
- Mackie, A.; Rigby, N.; Harvey, P.; Bajka, B.; Lane, C.; Nr, N. Increasing dietary oat fibre decreases the permeability of intestinal mucus. J. Funct. Foods 2016, 26, 418–427. [Google Scholar] [CrossRef]
- Michielan, A.; D’Incà, R. Intestinal Permeability in Inflammatory Bowel Disease: Pathogenesis, Clinical Evaluation, and Therapy of Leaky Gut. Mediat. Inflamm. 2015, 2015, 390230. [Google Scholar] [CrossRef]
- Miyoshi, Y.; Tanabe, S.; Suzuki, X.T. Cellular zinc is required for intestinal epithelial barrier maintenance via the regulation of claudin-3 and occludin expression. Am. J. Physiol. Liver Physiol. 2018, 311, G105–G116. [Google Scholar] [CrossRef] [PubMed]
- Suzuki, T.; Hara, H. Quercetin Enhances Intestinal Barrier Function through the Assembly of Zonnula Occludens-2, Occludin, and Claudin-1 and the Expression of Claudin-4 in Caco-2 Cells 1. J. Nutr. Dis. 2009, 139, 965–974. [Google Scholar] [CrossRef]
- Uranga, A.; Abalo, R. Food, nutrients and nutraceuticals affecting the course of inflammatory bowel disease. Pharmacol. Rep. 2016, 68, 816–826. [Google Scholar] [CrossRef]
- Cardona, F.; Lacueva, M.C.A.; Tulipani, S.; Tinahones, F.J.; Queipo-Ortuño, M.I. Benefits of polyphenols on gut microbiota and implications in human health. J. Nutr. Biochem. 2013, 24, 1415–1422. [Google Scholar] [CrossRef] [PubMed]
- D’Archivio, M.; Filesi, C.; Varì, R.; Scazzocchio, B.; Masella, R. Bioavailability of the Polyphenols: Status and Controversies. Int. J. Mol. Sci. 2010, 11, 1321–1342. [Google Scholar] [CrossRef]
- Du, J.; Chen, Y.; Shi, Y.; Liu, T.; Cao, Y.; Tang, Y.; Ge, X.; Nie, H.; Zheng, C.; Li, Y.C. 1,25-Dihydroxyvitamin D Protects Intestinal Epithelial Barrier by Regulating the Myosin Light Chain Kinase Signaling Pathway. Inflamm. Bowel Dis. 2015, 21, 2495–2506. [Google Scholar] [CrossRef] [PubMed]
- Finamore, A.; Massimi, M.; Devirgiliis, L.C.; Mengheri, E. Zinc Deficiency Induces Membrane Barrier Damage and Increases Neutrophil Transmigration in Caco-2 Cells. J. Nutr. 2008, 138, 1664–1670. [Google Scholar] [CrossRef] [PubMed]
- Galligan, J.J. Beneficial actions of microbiota-derived tryptophan metabolites. Neurogastroenterol. Motil. 2018, 30, e13283. [Google Scholar] [CrossRef] [PubMed]
- Hallert, C.; Björck, I.; Nyman, M.; Pousette, A.; Grännö, C.; Svensson, H. Increasing Fecal Butyrate in Ulcerative Colitis Patients by Diet: Controlled Pilot Study. Inflamm. Bowel Dis. 2003, 9, 116–121. [Google Scholar] [CrossRef]
- Kong, J.; Zhang, Z.; Musch, M.W.; Ning, G.; Sun, J.; Hart, J.; Bissonnette, M.; Li, Y.C. Novel role of the vitamin D receptor in maintaining the integrity of the intestinal mucosal barrier. Am. J. Physiol. Liver Physiol. 2018, 294, G208–G216. [Google Scholar] [CrossRef] [PubMed]
- Limketkai, B.N.; Wolf, A.; Parian, A.M. Nutritional Interventions in the Patient with Inflammatory Bowel Disease. Gastroenterol. Clin. N. Am. 2018, 47, 155–177. [Google Scholar] [CrossRef]
- Vancamelbeke, M.; Vermeire, S. The intestinal barrier: a fundamental role in health and disease. Expert Rev. Gastroenterol. Hepatol. 2017, 11, 821–834. [Google Scholar] [CrossRef] [PubMed]
- Büning, C.; Geissler, N.; Prager, M.; Sturm, A.; Baumgart, D.C.; Büttner, J.; Bühner, S.; Haas, V.; Lochs, H. Increased small intestinal permeability in ulcerative colitis: Rather genetic than environmental and a risk factor for extensive disease? Inflamm. Bowel Dis. 2012, 18, 1932–1939. [Google Scholar] [CrossRef]
- Wei, S.C.; Yang-Yen, H.-F.; Tsao, P.-N.; Weng, M.-T.; Tung, C.-C.; Yu, L.C.-H.; Lai, L.-C.; Hsiao, J.-H.; Chuang, E.Y.; Shun, C.-T.; et al. SHANK3 Regulates Intestinal Barrier Function Through Modulating ZO-1 Expression Through the PKCε-dependent Pathway. Inflamm. Bowel Dis. 2017, 23, 1730–1740. [Google Scholar] [CrossRef]
- Teshima, C.W.; Goodman, K.J.; El-Kalla, M.; Turk, S.; El-Matary, W.; Valcheva, R.; Danchak, R.; Gordon, M.; Ho, P.; Mullins, A.; et al. Increased Intestinal Permeability in Relatives of Patients With Crohn’s Disease Is Not Associated With Small Bowel Ulcerations. Clin. Gastroenterol. Hepatol. 2017, 15, 1413–1418.e1. [Google Scholar] [CrossRef]
- Fasano, A. Leaky Gut and Autoimmune Diseases. Clin. Rev. Allergy Immunol. 2012, 42, 71–78. [Google Scholar] [CrossRef]
- Chang, J.; Leong, R.W.; Wasinger, V.C.; Ip, M.; Yang, M.; Phan, T.G. Impaired Intestinal Permeability Contributes to Ongoing Bowel Symptoms in Patients With Inflammatory Bowel Disease and Mucosal Healing. Gastroenterology 2017, 153, 723–731.e1. [Google Scholar] [CrossRef] [PubMed]
- Sturgeon, C.; Fasano, A. Zonulin, a regulator of epithelial and endothelial barrier functions, and its involvement in chronic inflammatory diseases. Tissue Barriers 2016, 4, e1251384. [Google Scholar] [CrossRef]
- A Gerova, V.; Stoynov, S.G.; Katsarov, D.S.; A Svinarov, D. Increased intestinal permeability in inflammatory bowel diseases assessed by iohexol test. World J. Gastroenterol. 2011, 17, 2211–2215. [Google Scholar] [CrossRef]
- Wyatt, J.; Vogelsang, H.; Hübl, W.; Waldhoer, T.; Lochs, H. Intestinal permeability and the prediction of relapse in Crohri’s disease. Lancet 1993, 341, 1437–1439. [Google Scholar] [CrossRef]
- Ukabam, S.; Clamp, J.; Cooper, B. Abnormal Small Intestinal Permeability to Sugars in Patients with Crohn’s Disease of the Terminal Ileum and Colon. Digestion 1983, 27, 70–74. [Google Scholar] [CrossRef]
- Hollander, D.; Vadheim, C.M.; Brettholz, E.; Petersen, G.M.; Delahunty, T.; Rotter, J.I. Increased Intestinal Permeability in Patients with Crohn’s Disease and Their Relatives. Ann. Intern. Med. 1986, 105, 883–885. [Google Scholar] [CrossRef] [PubMed]
- Malíčková, K.; Francová, I.; Lukáš, M.; Kolar, M.; Králíková, E.; Bortlík, M.; Ďuricová, D.; Štěpánková, L.; Zvolská, K.; Pánková, A.; et al. Fecal zonulin is elevated in Crohn’s disease and in cigarette smokers. Pract. Lab. Med. 2017, 9, 39–44. [Google Scholar] [CrossRef] [PubMed]
- Hanai, H.; Iida, T.; Takeuchi, K.; Watanabe, F.; Maruyama, Y.; Andoh, A.; Tsujikawa, T.; Fujiyama, Y.; Mitsuyama, K.; Sata, M.; et al. Curcumin Maintenance Therapy for Ulcerative Colitis: Randomized, Multicenter, Double-Blind, Placebo-Controlled Trial. Clin. Gastroenterol. Hepatol. 2006, 4, 1502–1506. [Google Scholar] [CrossRef]
- Wegh, C.A.M.; De Roos, N.M.; Hovenier, R.; Meijerink, J.; Der Vaart, I.B.-V.; Van Hemert, S.; Witteman, B.J.M. Intestinal Permeability Measured by Urinary Sucrose Excretion Correlates with Serum Zonulin and Faecal Calprotectin Concentrations in UC Patients in Remission. J. Nutr. Metab. 2019, 2019, 1–10. [Google Scholar] [CrossRef]
- Mourad, F.H.; Barada, K.A.; Saade, N.E. Impairment of Small Intestinal Function in Ulcerative Colitis: Role of Enteric Innervation. J. Crohn’s Colitis 2016, 11, 369–377. [Google Scholar] [CrossRef]
- Peeters, M.; Ghoos, Y.; Maes, B.; Hiele, M.; Geboes, K.; Vantrappen, G.; Rutgeerts, P. Increased permeability of macroscopically normal small bowel in Crohn’s disease. Dig. Dis. Sci. 1994, 39, 2170–2176. [Google Scholar] [CrossRef] [PubMed]
- Ajamian, M.; Steer, D.; Rosella, G.; Gibson, P.R. Serum zonulin as a marker of intestinal mucosal barrier function: May not be what it seems. PLoS ONE 2019, 14, e0210728. [Google Scholar] [CrossRef] [PubMed]
- Meerveld, B.G.-V. Intestinal barrier function in health and gastrointestinal disease: Review Article. Neurogastroenterol. Motil. 2012, 24, 889. [Google Scholar] [CrossRef]
- Ohlsson, B.; Orho-Melander, M.; Nilsson, P.M. Higher Levels of Serum Zonulin May Rather Be Associated with Increased Risk of Obesity and Hyperlipidemia, Than with Gastrointestinal Symptoms or Disease Manifestations. Int. J. Mol. Sci. 2017, 18, 582. [Google Scholar] [CrossRef] [PubMed]


| General Participant Characteristics | Cases N (%) | Controls N (%) | p Value | |||||||
|---|---|---|---|---|---|---|---|---|---|---|
| Gender | Female | 5 (20) | 5 (17.9) | 1.000 | ||||||
| Male | 20 (80) | 23 (82.1) | ||||||||
| Smoking habits | Yes | 3 (12) | 5 (17.9) | 0.708 | ||||||
| No | 23 (88) | 23 (82.1) | ||||||||
| Cases | Controls | |||||||||
| Average (±SD) | Median | IQR (Q25%–Q75%) | Range | Average (±SD) | Median | IQR (Q25%–Q75%) | Range | p Value | ||
| Age | 44.04 (±12.3) | 44 | 19.5 (34–53.5) | 47 | 48.32 (±12.4) | 51.5 | 19.25 (37.5–56.8) | 49 | 0.215 | |
| Weight (kg) | 77.9 (±11.1) | 78.5 | 12.95 (73.6–86.6) | 44.3 | 75.4 (±8.8) | 75.1 | 15 (68.4–83.3) | 33.4 | 0.359 | |
| BMI (kg/m2) | 25.8 (±2.9) | 25.3 | 5.35 (23.2–28.6) | 10.4 | 25.5 (±2.2) | 25.1 | 3.3 (23.7–27) | 7.3 | 0.640 | |
| Waist Circumference (cm) | Female | 78.6 (±10.4) | 72 | 17.5 (71.5–89) | 24 | 78.6 (±10.1) | 76 | 16.5 (71–87.5) | 26 | 1.000 |
| Male | 94.1 (±8.9) | 94.5 | 12.8 (89–101.8) | 33 | 90.7 (±7.1) | 90 | 10 (85–95) | 27 | 0.165 | |
| % Body Fat | Female | 31.9 (±8.6) | 28.6 | 16.35 (24.6–40.9) | 20 | 31.74 (±6.3) | 31.9 | 11.4 (26–37.4) | 16.3 | 0.974 |
| Male | 21.5 (±3.9) | 21.1 | 5.8 (19–24.8) | 15.3 | 20.13 (±4.2) | 20.2 | 4.5 (17.8–22.3) | 20.2 | 0.294 | |
| IBD | Medication and Activity Disease | CD (N = 13) N (%) | UC (N = 12) N (%) | ||
|---|---|---|---|---|---|
| M1 | M3 | M1 | M3 | ||
| Medication | Without medication | 1 (7.7) | 0 | 0 | 0 |
| 5-ASA | 4 (30.8) | 4 (30.8) | 6 (50) | 6 (50) | |
| Systemic steroids | 2 (15.4) | 2 (15.4) | 1 | 0 | |
| Anti-TNF-α | 1 (7.7) | 1 (7.7) | 0 | 0 | |
| 5-ASA + immunosuppressors | 2 (15.4) | 3 (23,1) | 2 (16.7) | 2 (16.7) | |
| 5-ASA + systemic steroids | 0 | 0 | 1 (8.3) | 1 (8.3) | |
| 5-ASA + anti-TNF-α | 1 (7.7) | 1 (7.7) | 1 (8.3) | 1 (8.3) | |
| 5-ASA + immunosuppressors + systemic steroids | 1 (7.7) | 1 (7.7) | 1 (8.3) | 1 (8.3) | |
| 5-ASA + imunossupressors + anti-TNF-α | 1 (7.7) | 1 (7.7) | 1 (8,3) | 1 (8.3) | |
| Disease activity | Remission | 13 (100) | 13 (100) | 9 (75) | 8 (66.7) |
| Mild | 0 | 0 | 3 (25) | 3 (25) | |
| Moderate | 0 | 0 | 0 | 1 (8.3) | |
| Anthropometric at M1 and after M3 | Cases with Intervention | p Value | Cases without Intervention | p Value | Control with Intervention | p Value | Control without Intervention | p Value | ||||
|---|---|---|---|---|---|---|---|---|---|---|---|---|
| Average ± SD | Average ± SD | Average ± SD | Average ± SD | |||||||||
| M1 | M3 | M1 | M3 | M1 | M3 | M1 | M3 | |||||
| Weight (kg) | 74.5 ± 12.2 | 72.6 ± 11.2 | 0.032 | 82.3 ± 8.1 | 81.6 ± 7.6 | 0.165 | 74.9 ± 5.2 | 72.9 ± 4.9 | 0.001 | 75.71 ± 12.0 | 74.52 ± 11.6 | 0.071 |
| BMI (kg/m2) | 24.9 ± 3.1 | 24.4 ± 2.8 | 0.039 | 26.9 ± 2.5 | 26.8 ± 2.5 | 0.626 | 24.9 ± 1.4 | 24.1 ± 1.3 | 0.001 | 26.3 ± 2.6 | 25.9 ± 2.5 | 0.08 |
| Waist circumference (cm) | 87.0 ± 11.9 | 83.6 ± 10.4 | 0.005 | 96.1 ± 7.4 | 95.1 ± 6.7 | 0.102 | 88.8 ± 6.2 | 86.0 ± 5.0 | 0.004 | 88.2 ± 11.5 | 85.5 ± 11.2 | 0.01 |
| % Body fat | 21.6 ± 4.6 | 21.1 ± 5.7 | 0.456 | 26 ± 7.9 | 25.4 ± 6.9 | 0.392 | 19.0 ± 4.7 | 18.2 ± 4.4 | 0.216 | 26.2 ± 6.2 | 25.7 ± 6.1 | 0.409 |
| Lean body mass (kg) | 58.3 ± 9.4 | 57.2 ± 9.2 | 0.023 | 60.8 ± 8.5 | 60.9 ± 8.1 | 0.84 | 60.7 ± 3.6 | 59.5 ± 3.7 | 0.001 | 55.6 ± 9.5 | 55.3 ± 9.7 | 0.213 |
| Macro and Micronutrients Intake between M1 and M3 | Cases with Intervention | p Value | Cases without Intervention | p Value | Control with Intervention | p Value | Control without Intervention | p Value | ||||
|---|---|---|---|---|---|---|---|---|---|---|---|---|
| Average ± SD | Average ± SD | Average ± SD | Average ± SD | |||||||||
| M1 | M3 | M1 | M3 | M1 | M3 | M1 | M3 | |||||
| Energy | 1989 ± 524 | 1855 ± 546 | 0.18 | 1866 ± 548 | 1851 ± 430 | 0.95 | 2473 ± 1003 | 2213 ± 686 | 0.15 | 1883 ± 553 | 1836 ± 509 | 0.86 |
| (kcal/day) | ||||||||||||
| Energy | 28 ± 9 | 26 ± 10 | 0.51 | 23 ± 6 | 23 ± 5 | 0.59 | 33 ± 14 | 30 ± 9 | 0.12 | 26 ± 10 | 25 ± 9 | 0.6 |
| (kcal/kg body weight) | ||||||||||||
| Proteins | 100.1 ± 30.5 | 93.7 ± 28.4 | 0.44 | 86.8 ± 31.9 | 101.6 ± 28.5 | 0.27 | 121.3 ± 38.4 | 112.2 ± 1.7 | 0.27 | 106.4 ± 30.0 | 105.6 ± 29.9 | 0.77 |
| g/day | ||||||||||||
| Proteins | 1.4 ± 0.5 | 1.3 ± 0.5 | 0.64 | 1.0 ± 0.3 | 1.2 ± 0.32 | 0.21 | 1.6 ± 0.6 | 1.5 ± 0.2 | 0.31 | 1.45 ± 0.5 | 1.5 ± 0.54 | 0.7 |
| g/kg | ||||||||||||
| Lipids (g/day) | 71.3 ± 28.8 | 55.5 ± 30.7 | 0.05 | 62.8 ± 33.5 | 60.8 ± 26.8 | 0.66 | 86.6 ± 45.6 | 72.8 ± 43.4 | 0.2 | 61.4 ± 28.1 | 60.7 ± 28.9 | 0.81 |
| Carbohydrates (g/day) | 223.7 ± 73.5 | 240.9 ± 64.2 | 0.39 | 230.6 ± 84.9 | 218.6 ± 49.1 | 0.63 | 256.4 ± 122.1 | 258.8 ± 91.5 | 0.85 | 201.1 ± 66.4 | 200.9 ± 59.2 | 0.62 |
| Alcohol (g/day) | 6.3 ± 15.7 | 0.4 ± 1.5 | 0.14 | 3.6 ± 6.6 | 2.7 ± 4.7 | 0.59 | 24.8 ± 26.3 | 4.4 ± 8.5 | 0.01 | 11.2 ± 14.8 | 8.8 ± 14.1 | 0.31 |
| Fiber (g/day) | 21.2 ± 10.3 | 30.1 ± 12.9 | 0.01 | 23.3 ± 9.7 | 22.2 ± 3.7 | 0.69 | 29.9 ± 9.4 | 30.7 ± 12.3 | 0.88 | 23.5 ± 8.8 | 23.2 ± 6.1 | 0.69 |
| Vitamin D (μg) | 4.0 ± 3.4 | 5.8 ± 7.9 | 0.68 | 3.5 ± 4.3 | 4.7 ± 4.8 | 0.25 | 6.8 ± 6.7 | 3.6 ± 4.4 | 0.38 | 6.6 ± 11.4 | 7.3 ± 14.1 | 0.7 |
| Vitamin B12 (μg) | 3.9 ± 1.9 | 3.7 ± 3.1 | 0.43 | 3.3 ± 2.2 | 4.3 ± 2.3 | 0.09 | 4.5 ± 2.1 | 3.7 ± 1.2 | 0.13 | 9.3 ± 20.1 | 3.4 ± 1.3 | 0.94 |
| Folic acid (μg) | 246.7 ± 134.5 | 266.2 ± 134.5 | 0.55 | 252.9 ± 83.4 | 237.5 ± 77.3 | 0.59 | 352.9 ± 209.5 | 259.4 ± 75.2 | 0.13 | 258 ± 111.7 | 271.3 ± 81.3 | 0.35 |
| Calcium (mg) | 696.6 ± 449.3 | 912 ± 279.4 | 0.09 | 741.5 ± 311 | 893.1 ± 327.7 | 0.04 | 1013.9 ± 404.7 | 1048 ± 402.1 | 0.99 | 924.2 ± 308.8 | 1020.80 ± 350.3 | 0.25 |
| Iron (mg) | 10.8 ± 4.1 | 9 ± 3.7 | 0.02 | 10.5 ± 3.2 | 10.2 ± 2.4 | 0.82 | 14.9 ± 5.7 | 11.7 ± 5.8 | 0.01 | 11.5 ± 4.4 | 10.1 ± 2.2 | 0.33 |
| Zinc (mg) | 10.8 ± 4.5 | 9.6 ± 4.5 | 0.28 | 9.6 ± 3.4 | 11.5 ± 3.8 | 0.23 | 14.8 ± 6 | 14.4 ± 3.5 | 0.54 | 11.1 ± 3.3 | 12.3 ± 3.1 | 0.17 |
| Tryptophan/60 (mg) | 18.1 ± 7.8 | 155 ± 5.9 | 0.17 | 16.3 ± 7 | 7 ± 15.5 | 0.23 | 23 ± 7.5 | 22 ± 3.3 | 0.43 | 20.1 ± 6.3 | 19.3 ± 4.7 | 0.96 |
| Analytical Parameters from M1 to M3 | IBD Patients with Intervention | p Value | IBD Patients without Intervention | p Value | Controls with Intervention | p Value | Controls without Intervention | p Value | ||||
|---|---|---|---|---|---|---|---|---|---|---|---|---|
| Average ± SD | Average ± SD | Average ± SD | Average ± SD | |||||||||
| M1 | M3 | M1 | M3 | M1 | M3 | M1 | M3 | |||||
| Iron (µg/dL) | 95.1 ± 33.8 | 113.3 ± 39.8 | 0.131 | 106 ± 35.8 | 98.9 ± 33.3 | 0.349 | 103.1 ± 32.9 | 96.2 ± 25.8 | 0.382 | 111.6 ± 28.5 | 110.4 ± 27.6 | 0.909 |
| Ferritin (ng/mL) | 148.1 ± 171.6 | 149.9 ± 166.5 | 0.9 | 152 ± 145 | 143.3 ± 114.1 | 0.721 | 262 ± 151.6 | 264.9 ± 146.9 | 0.279 | 187.3 ± 181.2 | 201.4 ± 185.0 | 0.463 |
| Folic acid (ng/mL) | 6.51 ± 3.4 | 8.1 ± 4.8 | 0.754 | 8.5 ± 5.1 | 9.58 ± 4.9 | 0.838 | 6.8 ± 2.3 | 6.0 ± 1.8 | 0.039 | 8.19 ± 4.2 | 6.8 ± 2.6 | 0.529 |
| Vitamin B12 (pg/mL) | 458.6 ± 115.8 | 462.0 ± 122.7 | 0.987 | 489.9 ± 123.7 | 410.3 ± 115.8 | 0.01 | 500 ± 133.9 | 463.5 ± 123.9 | 0.125 | 487.0 ± 160.6 | 440.3 ± 142.1 | 0.023 |
| CRP (mg/L) | 5.6 ± 13.7 | 1.8 ± 2.1 | 0.142 | 3.2 ± 2.6 | 2.6 ± 3.0 | 0.328 | 1.8 ± 4.6 | 0.6 ± 0.7 | 0.528 | 1.6 ± 1.3 | 1.4 ± 1.3 | 0.789 |
| Vitamin D (ng/mL) | 22.9 ± 7.9 | 33.3 ± 8.8 | 0.00 | 19.4 ± 10.5 | 29.7 ± 10.8 | 0.004 | 23.3 ± 6.4 | 29.7 ± 6.5 | 0.002 | 27.2 ± 5.6 | 35.7 ± 9.7 | 0.00 |
| Total calcium (mg/dL) | 9.6 ± 0.5 | 9.6 ± 0.5 | 0.53 | 9.7 ± 0.3 | 9.6 ± 0.4 | 0.607 | 9.6 ± 0.3 | 9.6 ± 0.2 | 0.339 | 9.7 ± 0.4 | 9.62 ± 0.4 | 0.671 |
| Calprotectin fecal (µg/g) | 470 ± 954.5 | 316 ± 764.5 | 0.47 | 438.6 ± 462.3 | 61.6 ± 49.5 | 0.075 | 32.9 ± 60.8 | 28.9 ± 31.9 | 0.071 | 24.5 ± 26.2 | 18.6 ± 37.9 | 0.456 |
| Zinc (µg/dL) | 90.2 ± 18.7 | 86.5 ± 19.4 | 0.51 | 92.6 ± 13.7 | 86.6 ± 12.1 | 0.325 | 101.2 ± 15.7 | 93.9 ± 11.9 | 0.148 | 95.2 ± 16.2 | 92.6 ± 13.7 | 0.523 |
| Zonulin (ng/mL × 20) | 41.2 ± 10.5 | 41.3 ± 6.1 | 0.987 | 61.0 ± 18.5 | 53.9 ± 17.6 | 0.265 | 41.7 ± 10.6 | 43.8 ± 5.7 | 0.515 | 44.4 ± 9.3 | 48.9 ± 7.9 | 0.435 |
| Symptoms | Evolution of Symptom Prevalence (%) | |||
|---|---|---|---|---|
| Cases with the Intervention (%M3–%M1) | Cases without Intervention (%M3–%M1) | Control with Intervention (%M3–%M1) | Control without Intervention (%M3–%M1) | |
| Abdominal pain | −21 | −19 | +9 | +9 |
| Abdominal distension | +21 | 0 | +2 | +18 |
| Constipation | +29 | +18 | −14 | −6 |
| Diarrhea | 0 | −19 | −6 | −6 |
| Flatulence | 0 | −9 | −2 | +21 |
| Heartburn/burning | −15 | −9 | −7 | −21 |
Publisher’s Note: MDPI stays neutral with regard to jurisdictional claims in published maps and institutional affiliations. |
© 2021 by the authors. Licensee MDPI, Basel, Switzerland. This article is an open access article distributed under the terms and conditions of the Creative Commons Attribution (CC BY) license (http://creativecommons.org/licenses/by/4.0/).
Share and Cite
Lacerda, J.F.; Lagos, A.C.; Carolino, E.; Silva-Herdade, A.S.; Silva, M.; Sousa Guerreiro, C. Functional Food Components, Intestinal Permeability and Inflammatory Markers in Patients with Inflammatory Bowel Disease. Nutrients 2021, 13, 642. https://doi.org/10.3390/nu13020642
Lacerda JF, Lagos AC, Carolino E, Silva-Herdade AS, Silva M, Sousa Guerreiro C. Functional Food Components, Intestinal Permeability and Inflammatory Markers in Patients with Inflammatory Bowel Disease. Nutrients. 2021; 13(2):642. https://doi.org/10.3390/nu13020642
Chicago/Turabian StyleLacerda, Joana Franco, Ana Catarina Lagos, Elisabete Carolino, Ana Santos Silva-Herdade, Manuel Silva, and Catarina Sousa Guerreiro. 2021. "Functional Food Components, Intestinal Permeability and Inflammatory Markers in Patients with Inflammatory Bowel Disease" Nutrients 13, no. 2: 642. https://doi.org/10.3390/nu13020642
APA StyleLacerda, J. F., Lagos, A. C., Carolino, E., Silva-Herdade, A. S., Silva, M., & Sousa Guerreiro, C. (2021). Functional Food Components, Intestinal Permeability and Inflammatory Markers in Patients with Inflammatory Bowel Disease. Nutrients, 13(2), 642. https://doi.org/10.3390/nu13020642