
Trends in Diet Quality and Related Sociodemographic, Health, and Occupational Characteristics among Workers in Spain: Results from Three Consecutive National Health Surveys (2006–2017)


Abstract
1. Introduction
2. Materials and Methods
2.1. Study Design, Data Source and Study Population
2.2. Variables
2.3. Procedure and Ethical Aspects
2.4. Statistical Analysis
3. Results
3.1. Sociodemographic, Occupational and Health-Related Variables
3.2. Food Consumption and Diet Quality
3.3. Association between Sociodemographic, Occupational, and Health-Related Variables and Diet Quality
4. Discussion
4.1. Strengths and Limitations
4.2. Implications for Research and Practice
5. Conclusions
Supplementary Materials
Author Contributions
Funding
Institutional Review Board Statement
Informed Consent Statement
Data Availability Statement
Acknowledgments
Conflicts of Interest
References
- GBD 2017 Risk Factor Collaborators. Global, regional, and national comparative risk assessment of 84 behavioural, environmental and occupational, and metabolic risks or clusters of risks for 195 countries and territories, 1990–2017: A systematic analysis for the Global Burden of Disease Study 2017. Lancet 2018, 392, 1923–1994. [Google Scholar] [CrossRef]
- GBD 2017 Diet Collaborators. Health effects of dietary risks in 195 countries, 1990–2017: A systematic analysis for the Global Burden of Disease Study 2017. Lancet 2019, 393, 1958–1972. [Google Scholar] [CrossRef]
- World Health Organization (WHO). Healthy Diet [Fact Sheet No394] 2015. Available online: https://www.who.int/en/news-room/fact-sheets/detail/healthy-diet (accessed on 1 October 2020).
- GBD 2016 Risk Factors Collaborators. Global, regional, and national comparative risk assessment of 84 behavioural, environmental and occupational, and metabolic risks or clusters of risks, 1990-2016: A systematic analysis for the Global Burden of Disease Study 2016. Lancet 2017, 390, 1345–1422. [Google Scholar] [CrossRef]
- Olmedo Requena, R.; González Donquiles, C.; Dávila Batista, V.; Romaguera, D.; Castelló, A.; Molina de la Torre, A.J.; Amiano, P.; Dierssen Sotos, T.; Guevara, M.; Fernández Tardón, G.; et al. Agreement among Mediterranean Diet Pattern Adherence Indexes: MCC-Spain Study. Nutrients 2019, 11, 488. [Google Scholar] [CrossRef]
- Passi, S.J. Prevention of non-communicable diseases by balanced nutrition: Population-specific effective public health approaches in developing countries. Curr. Diabetes Rev. 2017, 13, 461–476. [Google Scholar] [CrossRef]
- Aranceta Bartrina, J.; Partearroyo, T.; López Sobaler, A.M.; Ortega, R.M.; Varela Moreiras, G.; Serra Majem, L.; Pérez Rodrigo, C.; Collaborative Group for the Dietary Guidelines for the Spanish Population (SENC). Updating the Food-Based Dietary Guidelines for the Spanish population: The Spanish Society of Community Nutrition (SENC) Proposal. Nutrients 2019, 11, 2675. [Google Scholar] [CrossRef]
- Rodríguez Rodríguez, E.; Aparicio, A.; Aranceta Bartrina, J.; Gil, Á.; González Gross, M.; Serra Majem, L.; Varela Moreiras, G.; Ortega, R.M. Low adherence to dietary guidelines in Spain, especially in the overweight/obese population: The ANIBES study. J. Am. Coll. Nutr. 2017, 36, 240–247. [Google Scholar] [CrossRef]
- Abellán Alemán, J.; Zafrilla Rentero, M.P.; Montoro García, S.; Mulero, J.; Pérez Garrido, A.; Leal, M.; Guerrero, L.; Ramos, E.; Ruilope, L.M. Adherence to the “Mediterranean Diet” in Spain and its relationship with cardiovascular risk (DIMERICA study). Nutrients 2016, 8, 680. [Google Scholar] [CrossRef]
- Fransen, H.P.; Boer, J.M.A.; Beulens, J.W.J.; Ardine de Wit, G.; Bas Bueno de Mesquita, H.; Hoekstra, J.; May, A.M.; Peeters, P.H.M. Associations between lifestyle factors and an unhealthy diet. Eur. J. Public Health 2017, 27, 274–278. [Google Scholar] [CrossRef]
- McInerney, M.; Csizmadi, I.; Friedenreich, C.M.; Alaniz Uribe, F.; Nettel Aguirre, A.; McLaren, L.; Potestio, M.; Sandalack, B.; McCormack, G.R. Associations between the neighbourhood food environment, neighbourhood socioeconomic status, and diet quality: An observational study. BMC Public Health 2016, 16, 984. [Google Scholar] [CrossRef]
- Beck, K.L.; Jones, B.; Ullah, I.; McNaughton, S.A.; Haslett, S.J.; Stonehouse, W. Associations between dietary patterns, socio-demographic factors and anthropometric measurements in adult New Zealanders: An analysis of data from the 2008/09 New Zealand Adult Nutrition Survey. Eur. J. Nutr. 2018, 57, 1421–1433. [Google Scholar] [CrossRef]
- Martínez Lacoba, R.; Pardo García, I.; Amo Saus, E.; Escribano Sotos, F. Socioeconomic, demographic and lifestyle-related factors associated with unhealthy diet: A cross-sectional study of university students. BMC Public Health 2018, 18, 1241. [Google Scholar] [CrossRef]
- Peeters, A.; Blake, M.R.C. Socioeconomic inequalities in diet quality: From identifying the problem to implementing solutions. Curr. Nutr. Rep. 2016, 5, 150–159. [Google Scholar] [CrossRef]
- Kang, M.; Park, S.-Y.; Shvetsov, Y.B.; Wilkens, L.R.; Le Marchand, L.; Boushey, C.J.; Paik, H.-Y. Sex differences in sociodemographic and lifestyle factors associated with diet quality in a multiethnic population. Nutrition 2019, 66, 147–152. [Google Scholar] [CrossRef]
- Grech, A.; Sui, Z.; Siu, H.Y.; Zheng, M.; Allman-Farinelli, M.; Rangan, A. Socio-demographic determinants of diet quality in Australian adults using the validated healthy eating index for Australian adults (HEIFA-2013). Healthcare 2017, 5, 7. [Google Scholar] [CrossRef]
- Romeiro, A.C.T.; Curioni, C.C.; Bezerra, F.F.; Faerstein, E. Sociodemographic determinants of food consumption pattern: Pró-Saúde Study. Rev. Bras. Epidemiol. 2020, 23, e200090. [Google Scholar] [CrossRef]
- Pinto de Souza Fernandes, D.; Lopes Duarte, M.S.; Pessoa, M.C.; Castro Franceschini, S.C.; Queiroz Ribeiro, A. Evaluation of diet quality of the elderly and associated factors. Arch. Gerontol. Geriatr. 2017, 72, 174–180. [Google Scholar] [CrossRef]
- Wolfenden, L.; Goldman, S.; Stacey, F.G.; Grady, A.; Kingsland, M.; Williams, C.M.; Wiggers, J.; Milat, A.; Rissel, C.; Bauman, A.; et al. Strategies to improve the implementation of workplace-based policies or practices targeting tobacco, alcohol, diet, physical activity and obesity. Cochrane Database Syst. Rev. 2018, 11, CD012439. [Google Scholar] [CrossRef]
- Crizzle, A.M.; Bigelow, P.; Adams, D.; Gooderham, S.; Myers, A.M.; Thiffault, P. Health and wellness of long-haul truck and bus drivers: A systematic literature review and directions for future research. J. Transp. Health 2017, 7, 90–109. [Google Scholar] [CrossRef]
- Mohaddes Ardabili, H.; Sheikh Andalibi, M.S.; Safari, M.; Khakpour, S.; Tayefi, M.; Reza Moallem, S.; Fayaz, M.; Zarifian, A.; Saberi Karimian, M.; Khorasanchi, Z.; et al. A comparison of dietary intake between personnel of a gas processing company and a sample population of public employees from Mashhad. Clin. Nutr. ESPEN 2020, 38, 124–128. [Google Scholar] [CrossRef]
- Han, K.; Choi-Kwon, S.; Sug Kim, K. Poor dietary behaviors among hospital nurses in Seoul, South Korea. Appl. Nurs. Res. 2016, 30, 38–44. [Google Scholar] [CrossRef] [PubMed]
- Jeong, W.; Kyung Kim, Y.; Soyeon Oh, S.; Yoon, J.-H.; Park, E.-C. Association between presenteeism/absenteeism and well-being among Korean workers. J. Occup. Environ. Med. 2020, 62, 574–580. [Google Scholar] [CrossRef] [PubMed]
- Drewnowski, A. Impact of nutrition interventions and dietary nutrient density on productivity in the workplace. Nutr. Rev. 2020, 78, 215–224. [Google Scholar] [CrossRef]
- Nicholls, R.; Perry, L.; Duffield, C.; Gallagher, R.; Pierce, H. Barriers and facilitators to healthy eating for nurses in the workplace: An integrative review. J. Adv. Nurs. 2017, 73, 1051–1065. [Google Scholar] [CrossRef] [PubMed]
- Zorbas, C.; Palermo, C.; Chung, A.; Iguacel, I.; Peeters, A.; Bennett, R.; Backholer, K. Factors perceived to influence healthy eating: A systematic review and meta-ethnographic synthesis of the literature. Nutr. Rev. 2018, 76, 861–874. [Google Scholar] [CrossRef]
- World Health Organization (WHO). Sustainable Development Goals (SDGs). Available online: https://www.who.int/health-topics/sustainable-development-goals (accessed on 1 October 2020).
- Ministerio de Sanidad Servicios Sociales e Igualdad, Instituto Nacional de Estadística. Encuesta Europea de Salud en España ENSE 2006; Ministerio de Sanidad, Servicios Sociales e Igualdad: Madrid, Spain, 2007. Available online: https://www.mscbs.gob.es/estadEstudios/estadisticas/encuestaNacional/encuesta2006.htm (accessed on 20 October 2020).
- Ministerio de Sanidad Servicios Sociales e Igualdad, Instituto Nacional de Estadística. Encuesta Nacional de Salud España ENSE 2011/12; Ministerio de Sanidad, Servicios Sociales e Igualdad: Madrid, Spain, 2013. Available online: https://www.mscbs.gob.es/estadEstudios/estadisticas/encuestaNacional/encuesta2011.htm (accessed on 20 October 2020).
- Ministerio de Sanidad Servicios Sociales e Igualdad, Instituto Nacional de Estadística. Encuesta Nacional de Salud España ENSE 2017; Ministerio de Sanidad, Servicios Sociales e Igualdad: Madrid, Spain, 2018. Available online: https://www.mscbs.gob.es/estadEstudios/estadisticas/encuestaNacional/encuesta2017.htm (accessed on 20 October 2020).
- Norte Navarro, A.; Ortiz Moncada, R. Spanish diet quality according to the healthy eating index. Nutr. Hosp. 2011, 26, 330–336. [Google Scholar] [CrossRef]
- Kennedy, E.T.; Ohls, J.; Carlso, S.; Fleming, K. The Healthy Eating Index: Design and applications. J. Am. Diet Assoc. 1995, 95, 1103–1108. [Google Scholar] [CrossRef]
- Spanish Society of Community Nutrition (SSCN). Healthy Dietary Guidelines (2014). Available online: http://www.nutricioncomunitaria.org/es/otras-publicaciones (accessed on 20 October 2020).
- World Health Organization (WHO). Body Mass Index (BMI). Available online: http://www.euro.who.int/en/health-topics/disease-prevention/nutrition/a-healthy-lifestyle/body-mass-index-bmi (accessed on 20 October 2020).
- Goldberg, D.P.; Hillier, V.F. A scaled version of the General Health Questionnaire. Psychol. Med. 1979, 9, 139–145. [Google Scholar] [CrossRef]
- Goldberg, D.P.; Williams, P. Cuestionario de Salud General GHQ: Guía Para el Usuario de Las Distintas Versiones, 1st ed.; Masson: Barcelona, Spain, 1996. [Google Scholar]
- Sánchez López, M.P.; Dresch, V. The 12-Item General Health Questionnaire (GHQ-12): Reliability, external validity and factor structure in the Spanish population. Psicothema 2008, 20, 839–843. [Google Scholar]
- Goldberg, D.P.; Gater, R.; Sartorius, N.; Ustun, T.B.; Piccinelli, M.; Gureje, O.; Rutter, C. The validity of two versions of the GHQ in the WHO study of mental illness in general health care. Psychol. Med. 1997, 27, 191–197. [Google Scholar] [CrossRef]
- Broadhead, W.E.; Gehlbach, S.H.; Degruy, F.V.; Kaplan, B.H. The Duke-UNK functional social support questionnaire: Measurement of social support in family medicine patients. Med. Care 1988, 26, 709–723. [Google Scholar] [CrossRef]
- de la Revilla Ahumada, L.; Bailón, E.; de Dios Luna, J.; Delgado, A.; Prados, M.A.; Fleitas, L. Validación de una escala de apoyo social funcional para su uso en la consulta del médico de familia. Aten. Primaria 1991, 8, 688–692. [Google Scholar] [PubMed]
- Bellón Saameño, J.A.; Delgado Sánchez, A.; Luna del Castillo, J.D.; Lardelli Claret, P. Validity and reliability of the Duke-UNC-11 questionnaire of functional social support. Aten. Primaria 1996, 18, 153–156. [Google Scholar] [PubMed]
- Boletín Oficial del Estado (BOE). Real Decreto 1560/1992, de 18 de diciembre, por el que se aprueba la Clasificación Nacional de Actividades Económicas (CNAE-93). Available online: https://www.boe.es/buscar/doc.php?id=BOE-A-1992-28247 (accessed on 20 October 2020).
- Boletín Oficial del Estado (BOE). Real Decreto 475/2007, de 13 de abril, por el que se aprueba la Clasificación Nacional de Actividades Económicas 2009 (CNAE-2009). Available online: https://www.boe.es/buscar/doc.php?id=BOE-A-2007-8824 (accessed on 21 October 2020).
- Food and Agriculture Organization of the United Nations. Food-Based Dietary Guidelines—Spain. Available online: http://www.fao.org/nutrition/education/food-dietary-guidelines/regions/countries/spain/en/ (accessed on 25 January 2021).
- Food and Agriculture Organization of the United Nations. Food-Based Dietary Guidelines—Croatia. Available online: http://www.fao.org/nutrition/education/food-dietary-guidelines/regions/countries/croatia/en/ (accessed on 25 January 2021).
- Food and Agriculture Organization of the United Nations. Food-Based Dietary Guidelines—Portugal. Available online: http://www.fao.org/nutrition/education/food-dietary-guidelines/regions/countries/portugal/en/ (accessed on 25 January 2021).
- Pavičić Žeželj, S.; Kenđel Jovanović, G.; Dragaš Zubalj, N.; Mićović, V.; Sesar, Z. Associations between adherence to the Mediterranean diet and lifestyle assessed with the MEDLIFE Index among the working population. Int. J. Environ. Res. Public Health 2018, 15, 2126. [Google Scholar] [CrossRef] [PubMed]
- Gregório, M.J.; Rodrigues, A.M.; Eusébio, M.; Dinis Sousa, R.; Dias, S.; André, B.; Grønning, K.; Coelho, P.S.; Mendes, J.M.; Graça, P.; et al. Dietary patterns characterized by high meat consumption are associated with other unhealthy life styles and depression symptoms. Front. Nutr. 2017, 4, 25. [Google Scholar] [CrossRef]
- Food and Agriculture Organization of the United Nations. Food-Based Dietary Guidelines—Finland. Available online: http://www.fao.org/nutrition/education/food-dietary-guidelines/regions/countries/finland/en/ (accessed on 25 January 2021).
- Hemiö, K.; Puttonen, S.; Viitasalo, K.; Härmä, M.; Peltonen, M.; Lindström, J. Food and nutrient intake among workers with different shift systems. Occup. Environ. Med. 2015, 72, 513–520. [Google Scholar] [CrossRef] [PubMed]
- Silva, P.R.; Pereira, N.; Cupertino, L.; Farias, J. Critical analysis of the diet quality of the Brazilian population according to the Healthy Eating Index: A systematic review. Ciênc. Saúde Colectiva 2015, 20, 3907–3923. [Google Scholar] [CrossRef]
- Schäfer, A.A.; Grande, A.J.; Rabelo Quadra, M.; Meller, F.O. Consumo e comportamento alimentar de trabalhadores de uma universidade: Um estudo transversal. Alimentaçao e Nutriçao em Saúde Colectiva 2019, 14, 1–4. [Google Scholar] [CrossRef]
- Christofoletti, M.; Firpo del Duca, G.; Mendes Gerage, A.; Konrad, L.M.; Antunes de Oliveira, E.S.; Gomes de Barros, M.V.; Vinicius Nahas, M. Physical activity and food habits are associated with television time on weekends in Brazilian workers. Motriz Rev. Educ. Fis. 2019, 25, e101913. [Google Scholar] [CrossRef]
- Zeratsky, K.; McMahon, M.; Jenkins, S.M.; Clark, M. Meal planning program to reduce barriers and improve diet quality in worksite wellness center members. J Occup Environ Med. 2018, 60, 998–1004. [Google Scholar] [CrossRef]
- Mazzola, J.; Jackson, A.; Thiele, A. Obesity in the workplace: A systematic review of barriers and facilitators to healthy lifestyles. Occup. Health Sci. 2019, 3, 239–264. [Google Scholar] [CrossRef]
- Angulo Mota, N.; Aparicio Gómez, M.; Marco Ibáñez, M.; Sanjuán Sánchez, V. Nutrition at the workplace and health promotion activities: Systematic review. Med. Segur. Trab. 2018, 64, 200–216. [Google Scholar]
- Estrategia Española de Seguridad y Salud en el Trabajo 2007–2012 (INSST). Plan de Acción Para el Impulso y Ejecución de la Estrategia Española de Seguridad y Salud en el Trabajo 2007–2012. Available online: https://www.insst.es/documents/94886/96076/Estrategia+Espa%C3%B1ola+de+SST++2007-2019+y+planes+de+acci%C3%B3n/a1b9a7c1-c77d-4613-8a5f-5f7ec6fd4869 (accessed on 12 November 2020).
- Estrategia Española de Seguridad y Salud en el Trabajo 2015–2020 (INSST). Available online: https://www.insst.es/documents/94886/211340/ESTRATEGIA+SST+15_20.pdf/6ad555c4-d5d8-4ab5-8c27-f576e1cd6230 (accessed on 14 November 2020).
- Tamrakar, D.; Shrestha, A.; Rai, A.; Man Karmacharya, B.; Malik, V.; Mattei, J.; Spiegelman, D. Drivers of healthy eating in a workplace in Nepal: A qualitative study. BMJ Open 2020, 10, e031404. [Google Scholar] [CrossRef]
- Gibson, R.; Eriksen, R.; Singh, D.; Vergnaud, A.-C.; Heard, A.; Chan, Q.; Elliott, P.; Frost, G. A cross-sectional investigation into the occupational and socio-demographic characteristics of British police force employees reporting a dietary pattern associated with cardiometabolic risk: Findings from the Airwave Health Monitoring Study. Eur. J. Nutr. 2018, 57, 2913–2926. [Google Scholar] [CrossRef]
- Imamura, F.; Micha, R.; Khatibzadeh, S.; Fahimi, S.; Shi, P.; Powles, J.; Mozaffarian, D.; Global Burden of Diseases Nutrition and Chronic Diseases Expert Group (NutriCoDE). Dietary quality among men and women in 187 countries in 1990 and 2010: A systematic assessment. Lancet Glob. Health 2015, 3, e132–e142. [Google Scholar] [CrossRef]
- López Olmedo, N.; Popkin, B.M.; Smith Taillie, L. Association between socioeconomic status and diet quality in Mexican men and women: A cross-sectional study. PLoS ONE 2019, 14, e0224385. [Google Scholar] [CrossRef]
- Mehdi Abassi, M.; Sassi, S.; El Ati, J.; Ben Gharbia, H.; Delpeuch, F.; Traissac, P. Gender inequalities in diet quality and their socioeconomic patterning in a nutrition transition context in the Middle East and North Africa: A cross-sectional study in Tunisia. Nutr. J. 2019, 18, 18. [Google Scholar] [CrossRef] [PubMed]
- Jia, L.; Lu, H.; Wu, J.; Wang, X.; Wang, W.; Du, M.; Wang, P.; Du, S.; Su, Y.; Zhang, N. Association between diet quality and obesity indicators among the working-age adults in Inner Mongolia, Northern China: A cross-sectional study. BMC Public Health 2020, 20, 1165. [Google Scholar] [CrossRef]
- Kurotani, K.; Ishikawa-Takata, K.; Takimoto, H. Diet quality of Japanese adults with respect to age, sex, and income level in the National Health and Nutrition Survey, Japan. Public Health Nutr. 2020, 23, 821–832. [Google Scholar] [CrossRef]
- Roy, M.; Gaudreau, P.; Payette, H. A scoping review of anorexia of aging correlates and their relevance topopulation health interventions. Appetite 2016, 105, 688–699. [Google Scholar] [CrossRef] [PubMed]
- van den Heuvel, E.; Newbury, A.; Appleton, K.M. The psychology of nutrition with advancing age: Focus on food neophobia. Nutrients 2019, 11, 151. [Google Scholar] [CrossRef]
- Backholer, K.; Spencer, E.; Gearon, E.; Magliano, D.J.; McNaughton, S.A.; Shaw, J.E.; Peeters, A. The association between socio-economic position and diet quality in Australian adults. Public Health Nutr. 2016, 19, 477–485. [Google Scholar] [CrossRef]
- Davison, K.M.; Gondara, L. Comparison of mental health, food insecurity, and diet quality indicators between foreign-born immigrants of Canada and native-born Canadians. JHEN 2019, 16, 109–132. [Google Scholar] [CrossRef]
- Wieland, M.L.; Hanza, M.M.M.; Weis, J.A.; Meiers, S.J.; Patten, C.A.; Clark, M.M.; Sloan, J.A.; Novotny, P.J.; Njeru, J.W.; Abbenyi, A.; et al. Healthy immigrant families: Randomized controlled trial of a family-based nutrition and physical activity intervention. Am. J. Health Promot. 2018, 32, 473–484. [Google Scholar] [CrossRef] [PubMed]
- Carbonneau, E.; Lamarche, B.; Robitaille, J.; Provencher, V.; Desroches, S.; Vohl, M.-C.; Bégin, C.; Bélanger, M.; Couillard, C.; Pelletier, L.; et al. Social support, but not perceived food environment, is associated with diet quality in French-speaking Canadians from the PREDISE Study. Nutrients 2019, 11, 3030. [Google Scholar] [CrossRef] [PubMed]
- Torquati, L.; Kolbe-Alexander, T.; Pavey, T.; Persson, C.; Leveritt, M. Diet and physical activity behaviour in nurses: A qualitative study. Int. J. Health Promot. Educ. 2016, 54, 268–282. [Google Scholar] [CrossRef]
- Lange, D.; Corbett, J.; Knoll, N.; Schwarzer, R.; Lippke, S. Fruit and vegetable intake: The interplay of planning, social support, and sex. Int. J. Behav. Med. 2018, 25, 421–430. [Google Scholar] [CrossRef] [PubMed]
- Uchino, B.N.; Bowen, K.; Carlisle, M.; Birmingham, W. Psychological pathways linking social support to health outcomes: A visit with the “ghosts” of research past, present, and future. Soc. Sci. Med. 2012, 74, 949–957. [Google Scholar] [CrossRef]
- Farías, R.; Sepúlveda, A.; Chamorro, R. Impact of shift work on the eating pattern, physical activity and daytime sleepiness among Chilean healthcare workers. Saf. Health Work 2020, 11, 367–371. [Google Scholar] [CrossRef]
- Beebe, D.; Chang, J.J.; Kress, K.; Mattfeldt-Beman, M. Diet quality and sleep quality among day and night shift nurses. J. Nurs. Manag. 2017, 25, 549–557. [Google Scholar] [CrossRef]
- Geaney, F.; Fitzgerald, S.; Harrington, J.M.; Kelly, C.; Greiner, B.A.; Perry, I.J. Nutrition knowledge, diet quality and hypertension in a working population. Prev. Med. Rep. 2015, 2, 105–113. [Google Scholar] [CrossRef]
- Alkerwi, A.; Baydarlioglu, B.; Sauvageot, N.; Stranges, S.; Lemmens, P.; Shivappa, N.; Hébert, J.R. Smoking status is inversely associated with overall diet quality: Findings from the ORISCAV-LUX study. Clin. Nutr. 2017, 36, 1275–1282. [Google Scholar] [CrossRef] [PubMed]
- Haq, I.U.; Liu, Y.; Liu, M.; Xu, H.; Wang, H.; Liu, C.; Zeb, F.; Jiang, P.; Wu, X.; Tian, Y.; et al. Association of smoking-related knowledge, attitude, and practices (KAP) with nutritional status and diet quality: A cross-sectional study in China. Biomed. Res. Int. 2019, 2019, 5897478. [Google Scholar] [CrossRef]
- Ross MacLean, R.; Cowan, A.; Vernarelli, J.A. More to gain: Dietary energy density is related to smoking status in US adults. BMC Public Health 2018, 18, 365. [Google Scholar] [CrossRef] [PubMed]
- García Díaz, V.; Fernández Feito, A.; Arias, L.; Lana, A. Tobacco and alcohol consumption according to workday in Spain. Gac. Sanit. 2015, 29, 364–369. [Google Scholar] [CrossRef] [PubMed][Green Version]
- Schantz, A.D.; Bruk-Lee, V. Workplace social stressors, drug-alcohol-tobacco use, and coping strategies. J. Workplace Behav. Health 2016, 31, 222–241. [Google Scholar] [CrossRef]
- Miranda, H.; Gore, R.J.; Boyer, J.; Nobrega, S.; Punnett, L. Health behaviors and overweight in nursing home employees: Contribution of workplace stressors and implications for worksite health promotion. Sci. World J. 2015, 2015, 915359. [Google Scholar] [CrossRef]
- Richter, K.; Peter, L.; Rodenbeck, A.; Günter-Weess, H.; Riedel-Heller, S.G.; Hillemacher, T. Shiftwork and alcohol consumption: A systematic review of the literature. Eur. Addict. Res. 2020, 27, 1–7. [Google Scholar] [CrossRef]
- Sluik, D.; Bezemer, R.; Sierksma, A.; Feskens, E. Alcoholic beverage preference and dietary habits: A systematic literature review. Crit. Rev. Food Sci. Nutr. 2016, 56, 2370–2382. [Google Scholar] [CrossRef]
- Pavičić Žeželj, S.; Kenđel Jovanović, G.; Krešić, G. The association between the Mediterranean diet and high physical activity among the working population in Croatia. Med. Pract. 2019, 70, 169–176. [Google Scholar] [CrossRef]
- Joseph, R.J.; Alonso Alonso, M.; Bond, D.S.; Pascual Leone, A.; Blackburn, G.L. The neurocognitive connection between physical activity and eating behaviour. Obes. Rev. 2011, 12, 800–812. [Google Scholar] [CrossRef] [PubMed]
- Holtermann, A.; Krause, N.; van der Beek, A.J.; Straker, L. The physical activity paradox: Six reasons why occupational physical activity (OPA) does not confer the cardiovascular health benefits that leisure time physical activity does. Br. J. Sports Med. 2018, 52, 149–150. [Google Scholar] [CrossRef]
- Feig, E.H.; Levy, D.E.; McCurley, J.L.; Rimm, E.B.; Anderson, E.M.; Gelsomin, E.D.; Thorndike, A.N. Association of work-related and leisure-time physical activity with workplace food purchases, dietary quality, and health of hospital employees. BMC Public Health 2019, 19, 1583. [Google Scholar] [CrossRef]
- Kong, J.-S.; Min, K.-B.; Min, J.-Y. Temporary workers’ skipping of meals and eating alone in South Korea: The Korean National Health and Nutrition Examination Survey for 2013–2016. Int. J. Environ. Res. Public Health 2019, 16, 2319. [Google Scholar] [CrossRef]
- Vahid Shahidi, F.; De Moortel, D.; Muntaner, C.; Davis, O.; Siddiqi, A. Do flexicurity policies protect workers from the adverse health consequences of temporary employment? A cross-national comparative analysis. SSM. Popul. Health 2016, 2, 674–682. [Google Scholar] [CrossRef]
- Kwon, K.; Park, J.B.; Lee, K.-J.; Cho, Y.-S. Association between employment status and self-rated health: Korean working conditions survey. Ann. Occup. Environ. Med. 2016, 28, 43. [Google Scholar] [CrossRef] [PubMed]
- Quinlan, M. The Effects of Non-Standard Forms of Employment on Worker Health and Safety, 1st ed.; International Labour Office: Geneva, Switzerland, 2015. [Google Scholar]
- Tanaka, R.; Tsuji, M.; Tsuchiya, T.; Kawamoto, T. Association between work-related factors and diet: A review of the literature. Workplace Health Saf. 2019, 67, 137–145. [Google Scholar] [CrossRef]
- Julià, M.; Belvis, F.; Vives, A.; Tarafa, G.; Benach, J. Informal employees in the European Union: Working conditions, employment precariousness and health. J. Public Health 2019, 41, e141–e151. [Google Scholar] [CrossRef]
- Instituto Nacional de Estadística (INE). Distribución Porcentual de Los Activos por Sector Económico y Provincia. Available online: https://www.ine.es/jaxiT3/Datos.htm?t=3994#!tabs-tabla (accessed on 20 November 2020).
- Sorensen, G.; Stoddard, A.; Hammond, S.K.; Hebert, J.R.; Avrunin, J.S.; Ockene, J.K. Double jeopardy: Workplace hazards and behavioral risks for craftspersons and laborers. Am. J. Health Promot. 1996, 10, 355–363. [Google Scholar] [CrossRef]
- Qaim, M.; Sibhatu, K.T. On the Link between Production Diversity and Dietary Quality in Smallholder Farm Households. In Hidden Hunger: Strategies to Improve Nutrition Quality; Biesalski, H.K., Birner, R., Eds.; Karger Publishers: Basel, Switzerland, 2018; Volume 118, pp. 102–111. [Google Scholar]
- Vieira Souza, R.; Aguiar Sarmento, R.; Carnevale de Almeida, J.; Canuto, R. The effect of shift work on eating habits: A systematic review. Scand. J. Work Environ. Health 2019, 45, 7–21. [Google Scholar] [CrossRef]
- Proper, K.I.; van de Langenberg, D.; Rodenburg, W.; Vermeulen, R.C.H.; van der Beek, A.J.; van Steeg, H.; van Kerkhof, L.W.M. The relationship between shift work and metabolic risk factors: A systematic review of longitudinal studies. Am. J. Prev. Med. 2016, 50, e147–e157. [Google Scholar] [CrossRef]
- Sun, M.; Feng, W.; Wang, F.; Li, P.; Li, Z.; Li, M.; Tse, G.; Vlaanderen, J.; Vermeulen, R.; Tse, L.A. Meta-analysis on shift work and risks of specific obesity types. Obes. Rev. 2018, 19, 28–40. [Google Scholar] [CrossRef]
- Okumus, B.; Chaulagain, S.; Giritlioglu, I. Examining the impacts of job stress and job satisfaction on hotel employees’ eating behavior. J. Hosp. Mark. Manag. 2019, 28, 558–575. [Google Scholar] [CrossRef]
- Grant, N.; Wardle, J.; Steptoe, A. The relationship between life satisfaction and health behavior: A cross-cultural analysis of young adults. Int. J. Behav. Med. 2009, 16, 259–268. [Google Scholar] [CrossRef] [PubMed]
- Bongers, P.; de Graaff, A.; Jansen, A. “Emotional” does not even start to cover it: Generalization of overeating in emotional eaters. Appetite 2016, 96, 611–616. [Google Scholar] [CrossRef] [PubMed]
- Cardi, V.; Leppanen, J.; Treasure, J. The effects of negative and positive mood induction on eating behaviour: A meta-analysis of laboratory studies in the healthy population and eating and weight disorders. Neurosci. Biobehav. Rev. 2015, 57, 299–309. [Google Scholar] [CrossRef]
- Hann, C.S.; Rock, C.L.; King, I.; Drewnowski, A. Validation of de Healthy Eating Index with use of plasma biomarkers in a clinical sample of women. Am. J. Clin. Nutr. 2001, 74, 479–486. [Google Scholar] [CrossRef]
- Weinstein, S.J.; Vogt, T.M.; Gerrior, S.A. Healthy Eating Index scores are associated with blood nutrient concentrations in the Third National Health and Nutrition Examination Survey. J. Am. Diet. Assoc. 2004, 104, 576–584. [Google Scholar] [CrossRef]


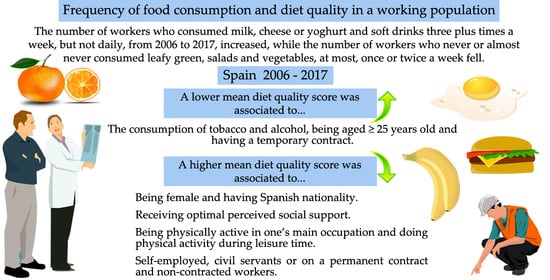
| Variables | 2006 | 2011 | 2017 | B | R2 | p-Value |
|---|---|---|---|---|---|---|
| n = 11,068 (%) | n = 7497 (%) | n = 8890 (%) | ||||
| Frequency of consumption of bread or grains | ||||||
| Never or hardly ever/<1 time per week/1–2 times per week | 751 (6.79%) | 632 (8.43%) | 631 (7.10%) | 1.59 | 0.45 | 0.52 |
| ≥3 times per week 1 | 526 (4.75%) | 629 (8.39%) | 761 (8.56%) | 6.68 | 0.74 | 0.34 |
| Daily | 9791 (88.46%) | 6236 (83.18%) | 7498 (84.34%) | −8.01 | 0.49 | 0.5 |
| Frequency of consumption of leafy greens, salads and vegetables | ||||||
| Never or hardly ever/<1 time per week/1–2 times per week | 2622 (23.70%) | 1296 (17.28%) | 1017 (11.43%) | −0.78 | 0.95 | <0.001 |
| ≥3 times per week 1 | 3806 (34.39%) | 2611 (34.83%) | 4217 (47.44%) | 24.08 | 0.82 | 0.28 |
| Daily | 4640 (41.92%) | 3590 (47.89%) | 3656 (41.12%) | −2.6 | 0.03 | 0.9 |
| Frequency of fresh fruit (excluding juices) consumption | ||||||
| Never or hardly ever/<1 time per week/1–2 times per week | 2191 (19.80%) | 1448 (19.31%) | 1267 (14.25%) | −1.07 | 0.83 | 0.27 |
| ≥3 times per week 1 | 1648 (14.89%) | 1472 (19.63%) | 2020 (22.72%) | 13.99 | 0.97 | 0.11 |
| Daily | 7229 (65.31%) | 4577 (61.05%) | 56.03 (63.03%) | −4.44 | 0.24 | 0.67 |
| Frequency of consumption of dairy products (milk, cheese, yoghurt) | ||||||
| Never or hardly ever/<1 time per week/1–2 times per week | 596 (5.38%) | 565 (7.54%) | 766 (8.62%) | 1.16 | 0.95 | 0.15 |
| ≥3 times per week 1 | 463 (4.18%) | 531 (7.08%) | 870 (9.79%) | 10.15 | 0.99 | 0.04 |
| Daily | 10,009 (90.43%) | 6401 (85.38%) | 7254 (81.60%) | −16.89 | 0.98 | 0.09 |
| Frequency of meat (chicken, beef, pork, lamb, etc.) consumption | ||||||
| Never or hardly ever/<1 time per week/1–2 times per week | 2651 (23.95%) | 2276 (30.36%) | 2304 (25.92%) | 0.36 | 0.52 | 0.49 |
| ≥3 times per week 1 | 6317 (57.07%) | 4444 (59.28%) | 5682 (63.91%) | 12.00 | 0.98 | 0.09 |
| Daily | 2100 (18.97%) | 777 (10.36%) | 904 (10.17%) | −15.71 | 0.72 | 0.35 |
| Frequency of legume consumption | ||||||
| Never or hardly ever/<1 time per week/1–2 times per week | 8225 (74.31%) | 5848 (78.00%) | 6761 (76.05%) | 1.27 | 0.18 | 0.72 |
| ≥3 times per week 1 | 2500 (22.59%) | 1563 (20.85%) | 2069 (23.27%) | 1.25 | 0.1 | 0.79 |
| Daily | 343 (3.10%) | 86 (1.15%) | 60 (0.67%) | −4.37 | 0.86 | 0.25 |
| Frequency of consumption of cold meats and cuts | ||||||
| Never or hardly ever/<1 time per week/1–2 times per week | 6240 (56.38%) | 4523 (60.33%) | 4354 (48.98%) | -0.51 | 0.92 | 0.18 |
| ≥3 times per week 1 | 2575 (23.27%) | 1793 (23.92%) | 3183 (35.80%) | 23.19 | 0.83 | 0.27 |
| Daily | 2253 (20.36%) | 1181 (15.75%) | 1353 (15.22%) | -9.31 | 0.78 | 0.31 |
| Frequency of consumption of sweets (biscuits, pastries, jams, cereals with sugar, sweets, etc.) | ||||||
| Never or hardly ever/<1 time per week/1–2 times per week | 5730 (51.77%) | 4141 (55.24%) | 4493 (50.54%) | −0.86 | 0.24 | 0.67 |
| ≥3 times per week 1 | 1414 (12.78%) | 1111 (14.82%) | 2087 (23.48%) | 19.71 | 0.92 | 0.19 |
| Daily | 3924 (35.45%) | 2245 (29.95%) | 2310 (25.98%) | −17.49 | 0.98 | 0.09 |
| Frequency of consumption of soft drinks with sugar | ||||||
| Never or hardly ever/<1 time per week/1–2 times per week | 8125 (73.41%) | 5835 (77.83%) | 7110 (79.98%) | 0.31 | 0.66 | 0.4 |
| ≥3 times per week 1 | 1061 (9.59%) | 745 (9.94%) | 932 (10.48%) | 1.53 | 0.98 | 0.04 |
| Daily | 1882 (17.00%) | 917 (12.23%) | 848 (9.54%) | −13.61 | 0.96 | 0.13 |
| Diet quality | ||||||
| Poor diet quality | 520 (4.70%) | 143 (1.91%) | 204 (2.29%) | −4.25 | 0.58 | 0.45 |
| Improvable diet quality | 8008 (72.35%) | 4616 (61.57%) | 6800 (76.49%) | 8.27 | 0.1 | 0.79 |
| Good diet quality | 2540 (22.95%) | 2738 (36.52%) | 1886 (21.21%) | −5.03 | 0.02 | 0.9 |
| Variables | Mean (SD) | Univariate Analysis | Adjusted Analysis | ||||
|---|---|---|---|---|---|---|---|
| B | β | p-Value | B | β | p-Value | ||
| Gender | |||||||
| Man | 71.48 (11.02) | Reference | Reference | Reference | Reference | ||
| Woman | 74.57 (10.65) | 3.09 | 0.14 | <0.001 | 2.96 | 0.14 | <0.001 |
| Age group (years) | |||||||
| 16–24 | 64.05 (12.21) | Reference | Reference | Reference | Reference | ||
| 25–44 | 56.84 (10.94) | −7.21 | −0.33 | <0.001 | −6.27 | −0.29 | <0.001 |
| 45–64 | 52.02 (9.77) | −12.03 | −0.54 | <0.001 | −10.71 | −0.48 | <0.001 |
| Educational level | |||||||
| No education | 72.82 (11.30) | Reference | Reference | ||||
| Primary | 72.37 (11.32) | −0.45 | −0.01 | 0.35 | |||
| Secondary or professional training | 72.19 (11.15) | −0.63 | −0.03 | 0.16 | |||
| University | 74.86 (10.04) | 2.04 | 0.08 | <0.001 | |||
| Marital status | |||||||
| Single | 70.24 (11.61) | Reference | Reference | ||||
| Married | 74.07 (10.43) | 3.83 | 0.17 | 0.07 | |||
| Widowed | 76.62 (9.89) | 6.38 | 0.07 | 0.15 | |||
| Separated/Divorced | 73.91 (10.63) | 3.67 | 0.09 | 0.23 | |||
| Citizenship | |||||||
| Foreigner | 69.82 (11.15) | Reference | Reference | Reference | Reference | ||
| Spanish | 70.06 (10.89) | 0.24 | 0.09 | <0.001 | 1.56 | 0.04 | <0.001 |
| Town size | |||||||
| <10,000 inhabitants | 73.05 (10.69) | Reference | Reference | ||||
| 10,000–100,000 inhabitants | 71.77 (11.00) | −1.28 | −0.11 | 0.09 | |||
| >100,000 inhabitants | 73.36 (11.05) | 0.31 | 0.01 | 0.19 | |||
| Body Mass Index | |||||||
| Normal weight | 69.35 (11.85) | Reference | Reference | ||||
| Underweight | 65.71 (11.05) | −3.64 | −0.04 | 0.59 | |||
| Overweight | 69.28 (10.67) | −0.07 | −0.003 | 0.83 | |||
| Obese | 69.31 (11.15) | −0.04 | −0.001 | 0.38 | |||
| Ongoing tobacco use | |||||||
| No | 74.18 (10.46) | Reference | Reference | Reference | Reference | ||
| Yes | 70.51 (11.48) | −3.67 | −0.16 | <0.001 | −2.62 | −0.11 | <0.001 |
| Alcohol consumption in the last12 months | |||||||
| No | 73.56 (11.17) | Reference | Reference | Reference | Reference | ||
| Yes | 72.67 (10.84) | −0.89 | −0.04 | <0.001 | −5.17 | −0.02 | <0.001 |
| Physical activity as main activity | |||||||
| No | 70.95 (11.26) | Reference | Reference | Reference | Reference | ||
| Yes | 73.54 (10.79) | 2.59 | 0.09 | <0.001 | 1.17 | 0.05 | <0.001 |
| Leisure-time physical activity | |||||||
| No | 71.23 (11.25) | Reference | Reference | Reference | Reference | ||
| Yes | 74.07 (10.60) | 2.84 | 0.13 | <0.001 | 2.39 | 0.11 | <0.001 |
| Perceived social support | |||||||
| Sub-optimal social support | 70.36 (11.94) | Reference | Reference | Reference | Reference | ||
| Optimal social support | 73.02 (10.91) | 2.66 | 0.04 | <0.001 | 2.03 | 0.03 | <0.001 |
| Common mental disorders | |||||||
| Absence of common mental disorders | 72.71 (11.71) | Reference | Reference | ||||
| Presence of common mental disorders | 72.99 (10.82) | 0.28 | 0.009 | 0.14 | |||
| Sector of economy | |||||||
| Tertiary | 73.59 (10.84) | Reference | Reference | ||||
| Secondary | 72.15 (10.63) | −1.44 | −0.6 | <0.001 | |||
| Primary | 74.55 (11.13) | 0.96 | 0.04 | <0.01 | |||
| Type of contract | |||||||
| Ongoing contract | 72.90 (10.84) | Reference | Reference | Reference | Reference | ||
| Without contract | 76.84 (10.67) | 3.94 | 0.06 | <0.001 | 1.12 | 0.02 | 0.01 |
| Self-employed | 75.09 (9.80) | 2.19 | 0.08 | <0.001 | 0.76 | 0.03 | <0.01 |
| Temporary contract | 67.13 (11.45) | −5.77 | −0.2 | <0.001 | −2.3 | −0.08 | <0.001 |
| Civil servant or permanent contract | 76.03 (12.10) | 3.13 | 0.14 | <0.001 | 1.35 | 0.06 | <0.001 |
| Type of working day | |||||||
| Irregular | 72.65 (11.08) | Reference | Reference | ||||
| Regular | 73.38 (10.74) | 0.73 | 0.03 | <0.001 | |||
| Work-related stress | |||||||
| None or low | 73.05 (11.27) | Reference | Reference | ||||
| Moderate | 73.02 (10.79) | −0.03 | −0.001 | 0.87 | |||
| High | 72.70 (11.12) | −0.35 | −0.01 | 0.1 | |||
| Job satisfaction | |||||||
| None or low | 71.40 (11.73) | Reference | Reference | ||||
| Moderate | 72.36 (10.80) | 0.96 | 0.04 | 0.36 | |||
| High | 73.59 (10.96) | 2.19 | 0.1 | <0.01 | |||
Publisher’s Note: MDPI stays neutral with regard to jurisdictional claims in published maps and institutional affiliations. |
© 2021 by the authors. Licensee MDPI, Basel, Switzerland. This article is an open access article distributed under the terms and conditions of the Creative Commons Attribution (CC BY) license (http://creativecommons.org/licenses/by/4.0/).
Share and Cite
Portero de la Cruz, S.; Cebrino, J. Trends in Diet Quality and Related Sociodemographic, Health, and Occupational Characteristics among Workers in Spain: Results from Three Consecutive National Health Surveys (2006–2017). Nutrients 2021, 13, 522. https://doi.org/10.3390/nu13020522
Portero de la Cruz S, Cebrino J. Trends in Diet Quality and Related Sociodemographic, Health, and Occupational Characteristics among Workers in Spain: Results from Three Consecutive National Health Surveys (2006–2017). Nutrients. 2021; 13(2):522. https://doi.org/10.3390/nu13020522
Chicago/Turabian StylePortero de la Cruz, Silvia, and Jesús Cebrino. 2021. "Trends in Diet Quality and Related Sociodemographic, Health, and Occupational Characteristics among Workers in Spain: Results from Three Consecutive National Health Surveys (2006–2017)" Nutrients 13, no. 2: 522. https://doi.org/10.3390/nu13020522
APA StylePortero de la Cruz, S., & Cebrino, J. (2021). Trends in Diet Quality and Related Sociodemographic, Health, and Occupational Characteristics among Workers in Spain: Results from Three Consecutive National Health Surveys (2006–2017). Nutrients, 13(2), 522. https://doi.org/10.3390/nu13020522