
Effect of Vitamin D Supplementation on Glycemic Control in Prediabetes: A Meta-Analysis


Abstract
:1. Introduction
2. Materials and Methods
2.1. Literature Search
2.2. Selection of Studies
- (1)
- Population: adults (≥18 years) with prediabetes. Prediabetes criteria [8,9]: (1) IFG: fasting blood glucose (FBG) 6.1–6.9 mmol/L (World Health Organization (WHO)) or 5.6–6.9 mmol/L (American Diabetes Association (ADA)); or (2) IGT: 2h oral glucose tolerance test plasma glucose (2h-PG) 7.8–11.0 mmol/L during an oral glucose tolerance test; or (3) hemoglobin A1c (HbA1c) 5.7–6.4% (ADA).
- (2)
- Intervention: treatment with vitamin D or analogue supplements orally, regardless of the types, dosages, durations, or routines, either with or without calcium (Ca).
- (3)
- Comparison intervention: placebo or nothing.
- (4)
- RCT design.
- (5)
- Eligible studies must have reported at least one of the following coprimary outcomes of interest as defined by the investigators: body mass index (BMI), FBG, 2h-PG, HbA1c, insulin resistance by homeostasis model assessment (HOMA-IR), homeostasis model assessment of β-cell function (HOMA-B), and fasting insulin (FINS). Available sample size, mean and standard deviation (SD) of relevant indexes or data were provided so that mean and SD could be calculated.
- (6)
- Written in English or Chinese.
- (1)
- Animal studies, case reports, reviews, or abstracts.
- (2)
- Repeated or overlapped publication.
- (3)
- Trials of participants with diabetes.
- (4)
- Duplicated publications; only the first publication reporting related outcomes was included.
2.3. Data Extraction and Risk of Bias Assessment
2.4. Statistical Analysis
3. Results
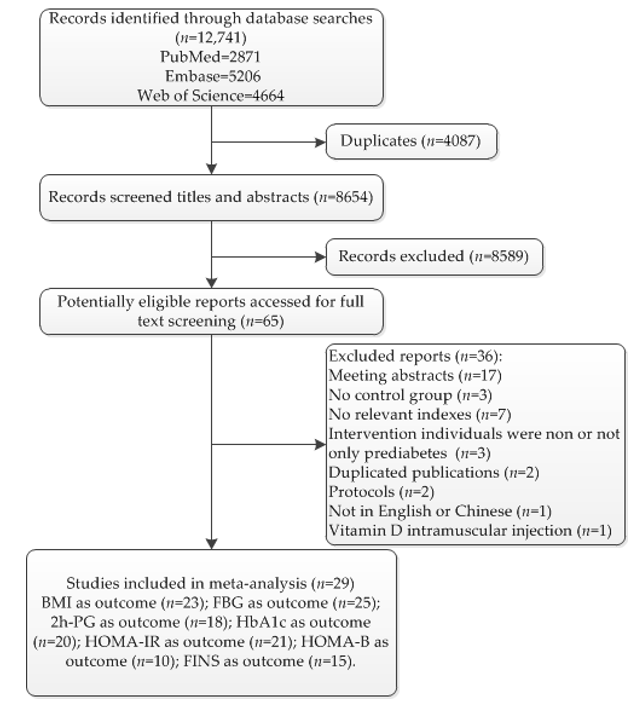
3.1. Literature Search
3.2. Study Characteristics
3.3. Risk of Bias
3.4. Main Analysis
3.4.1. BMI
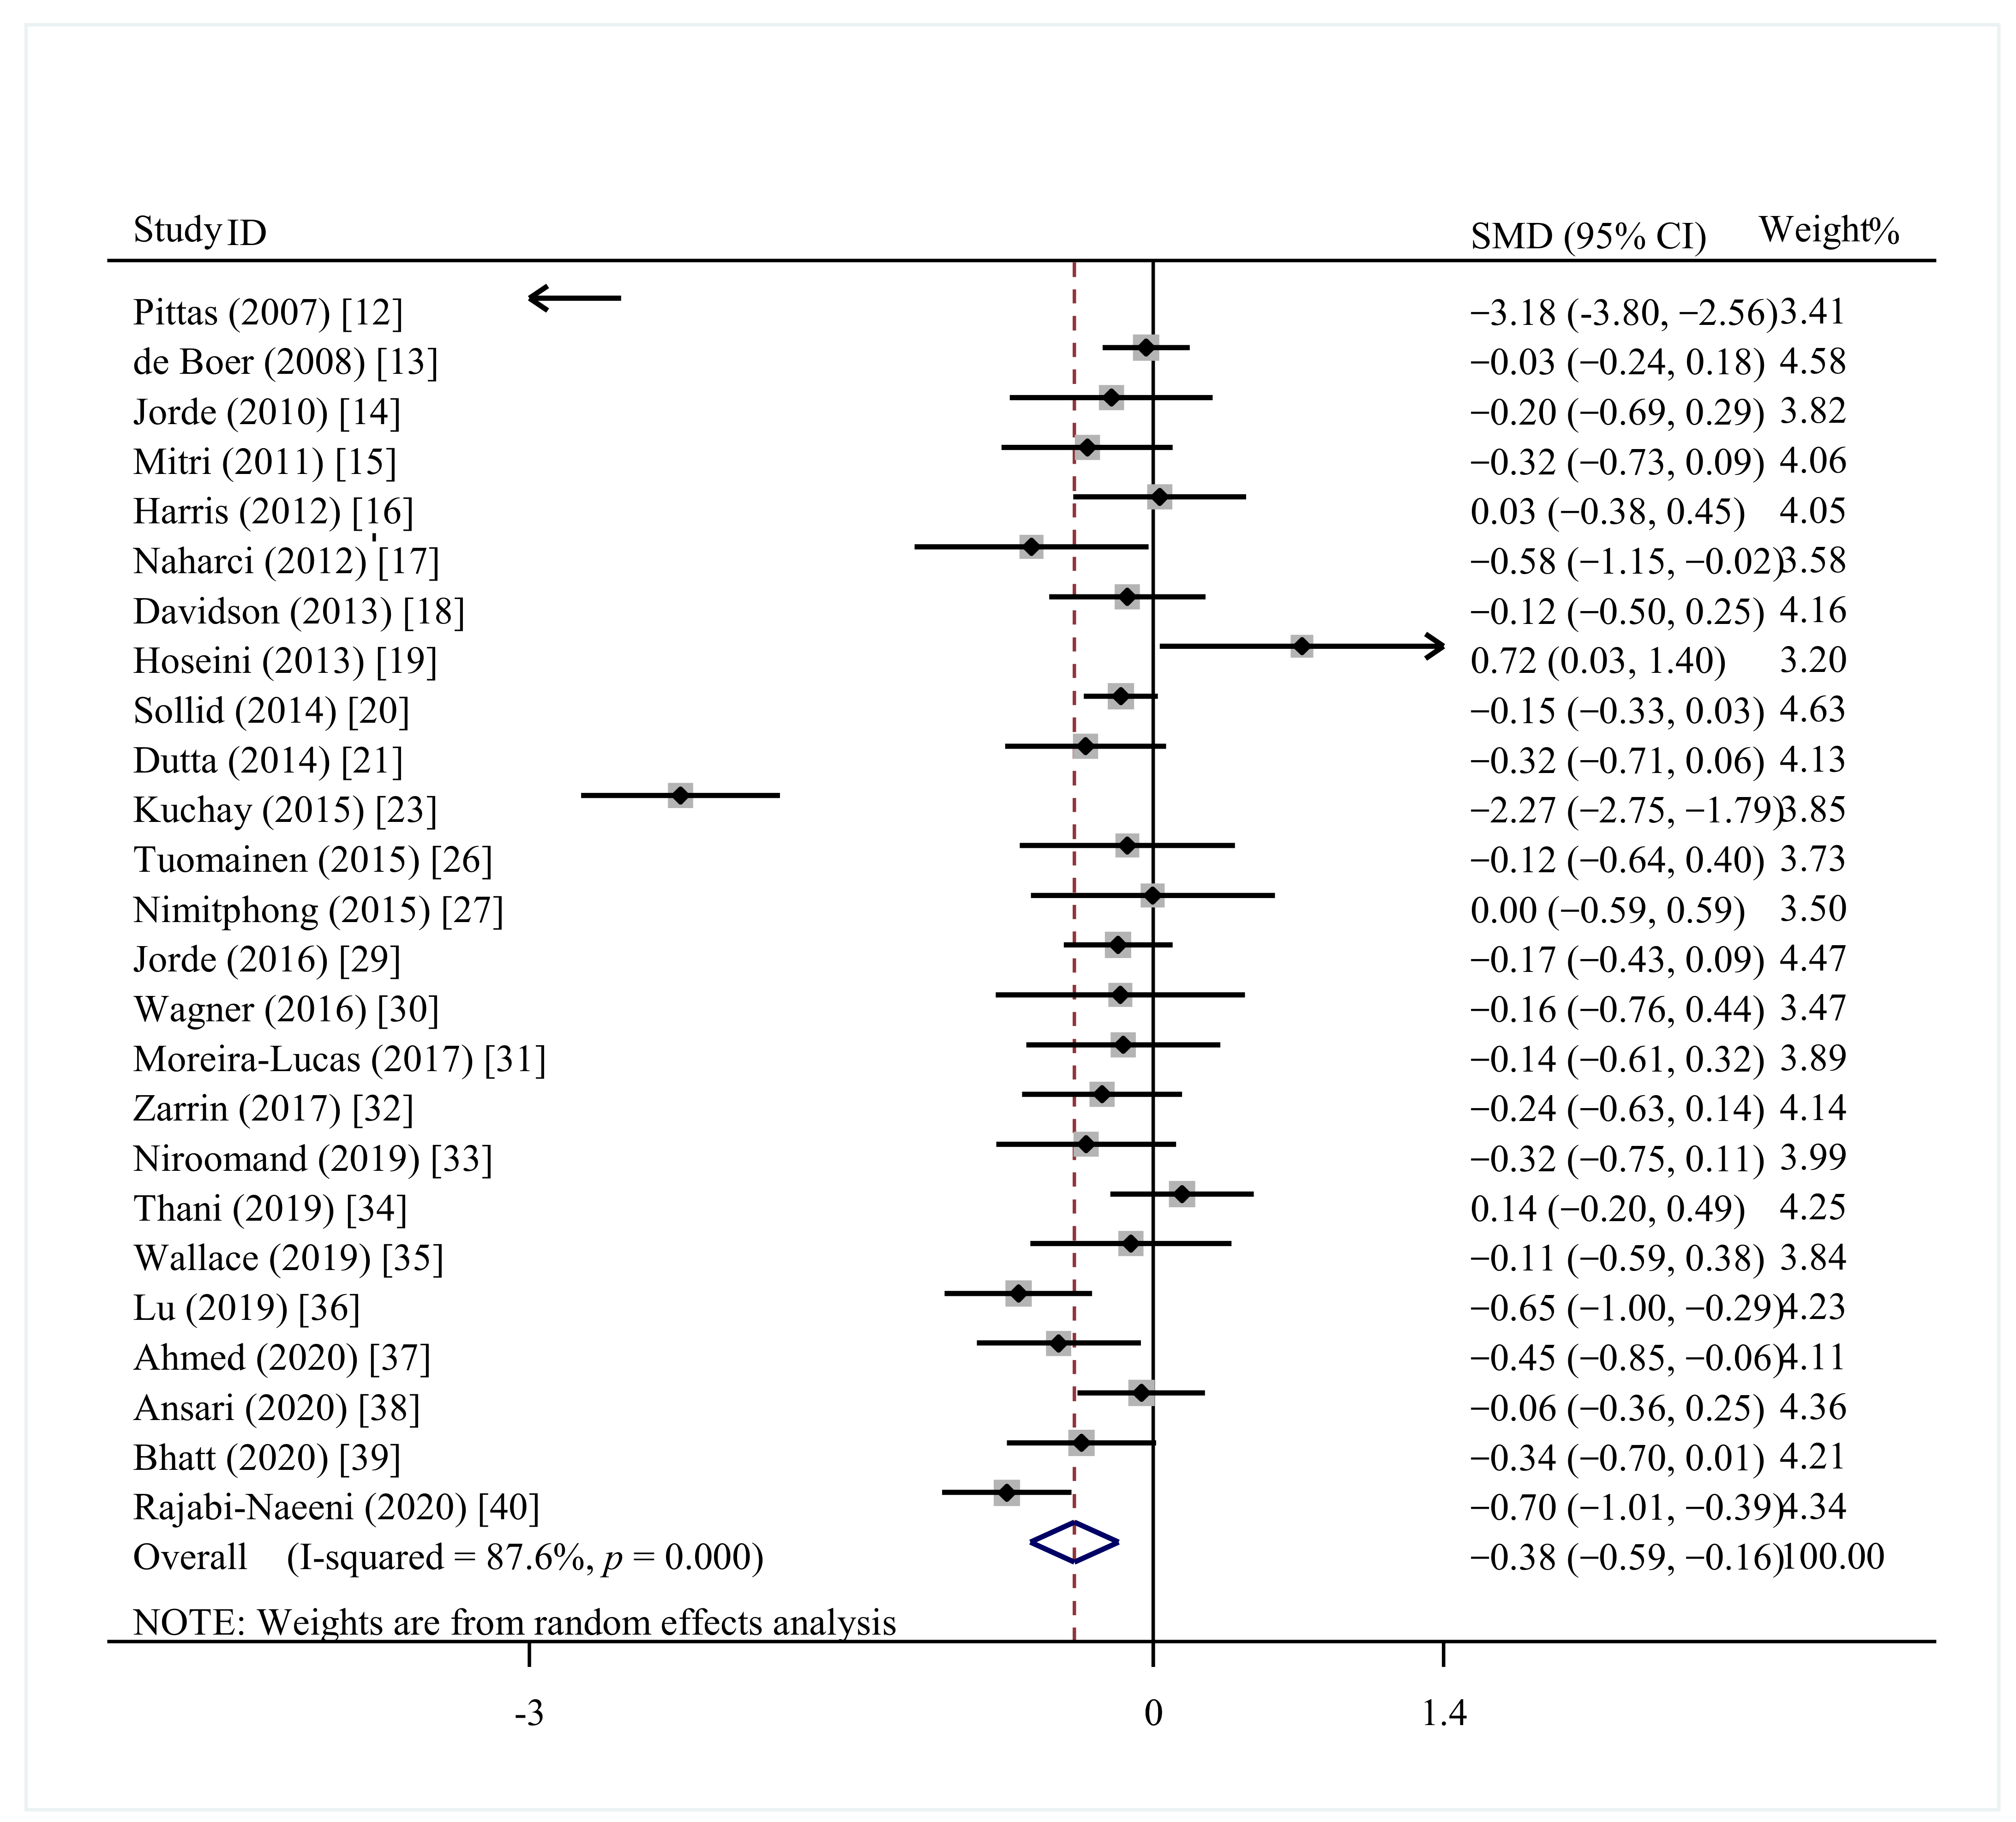
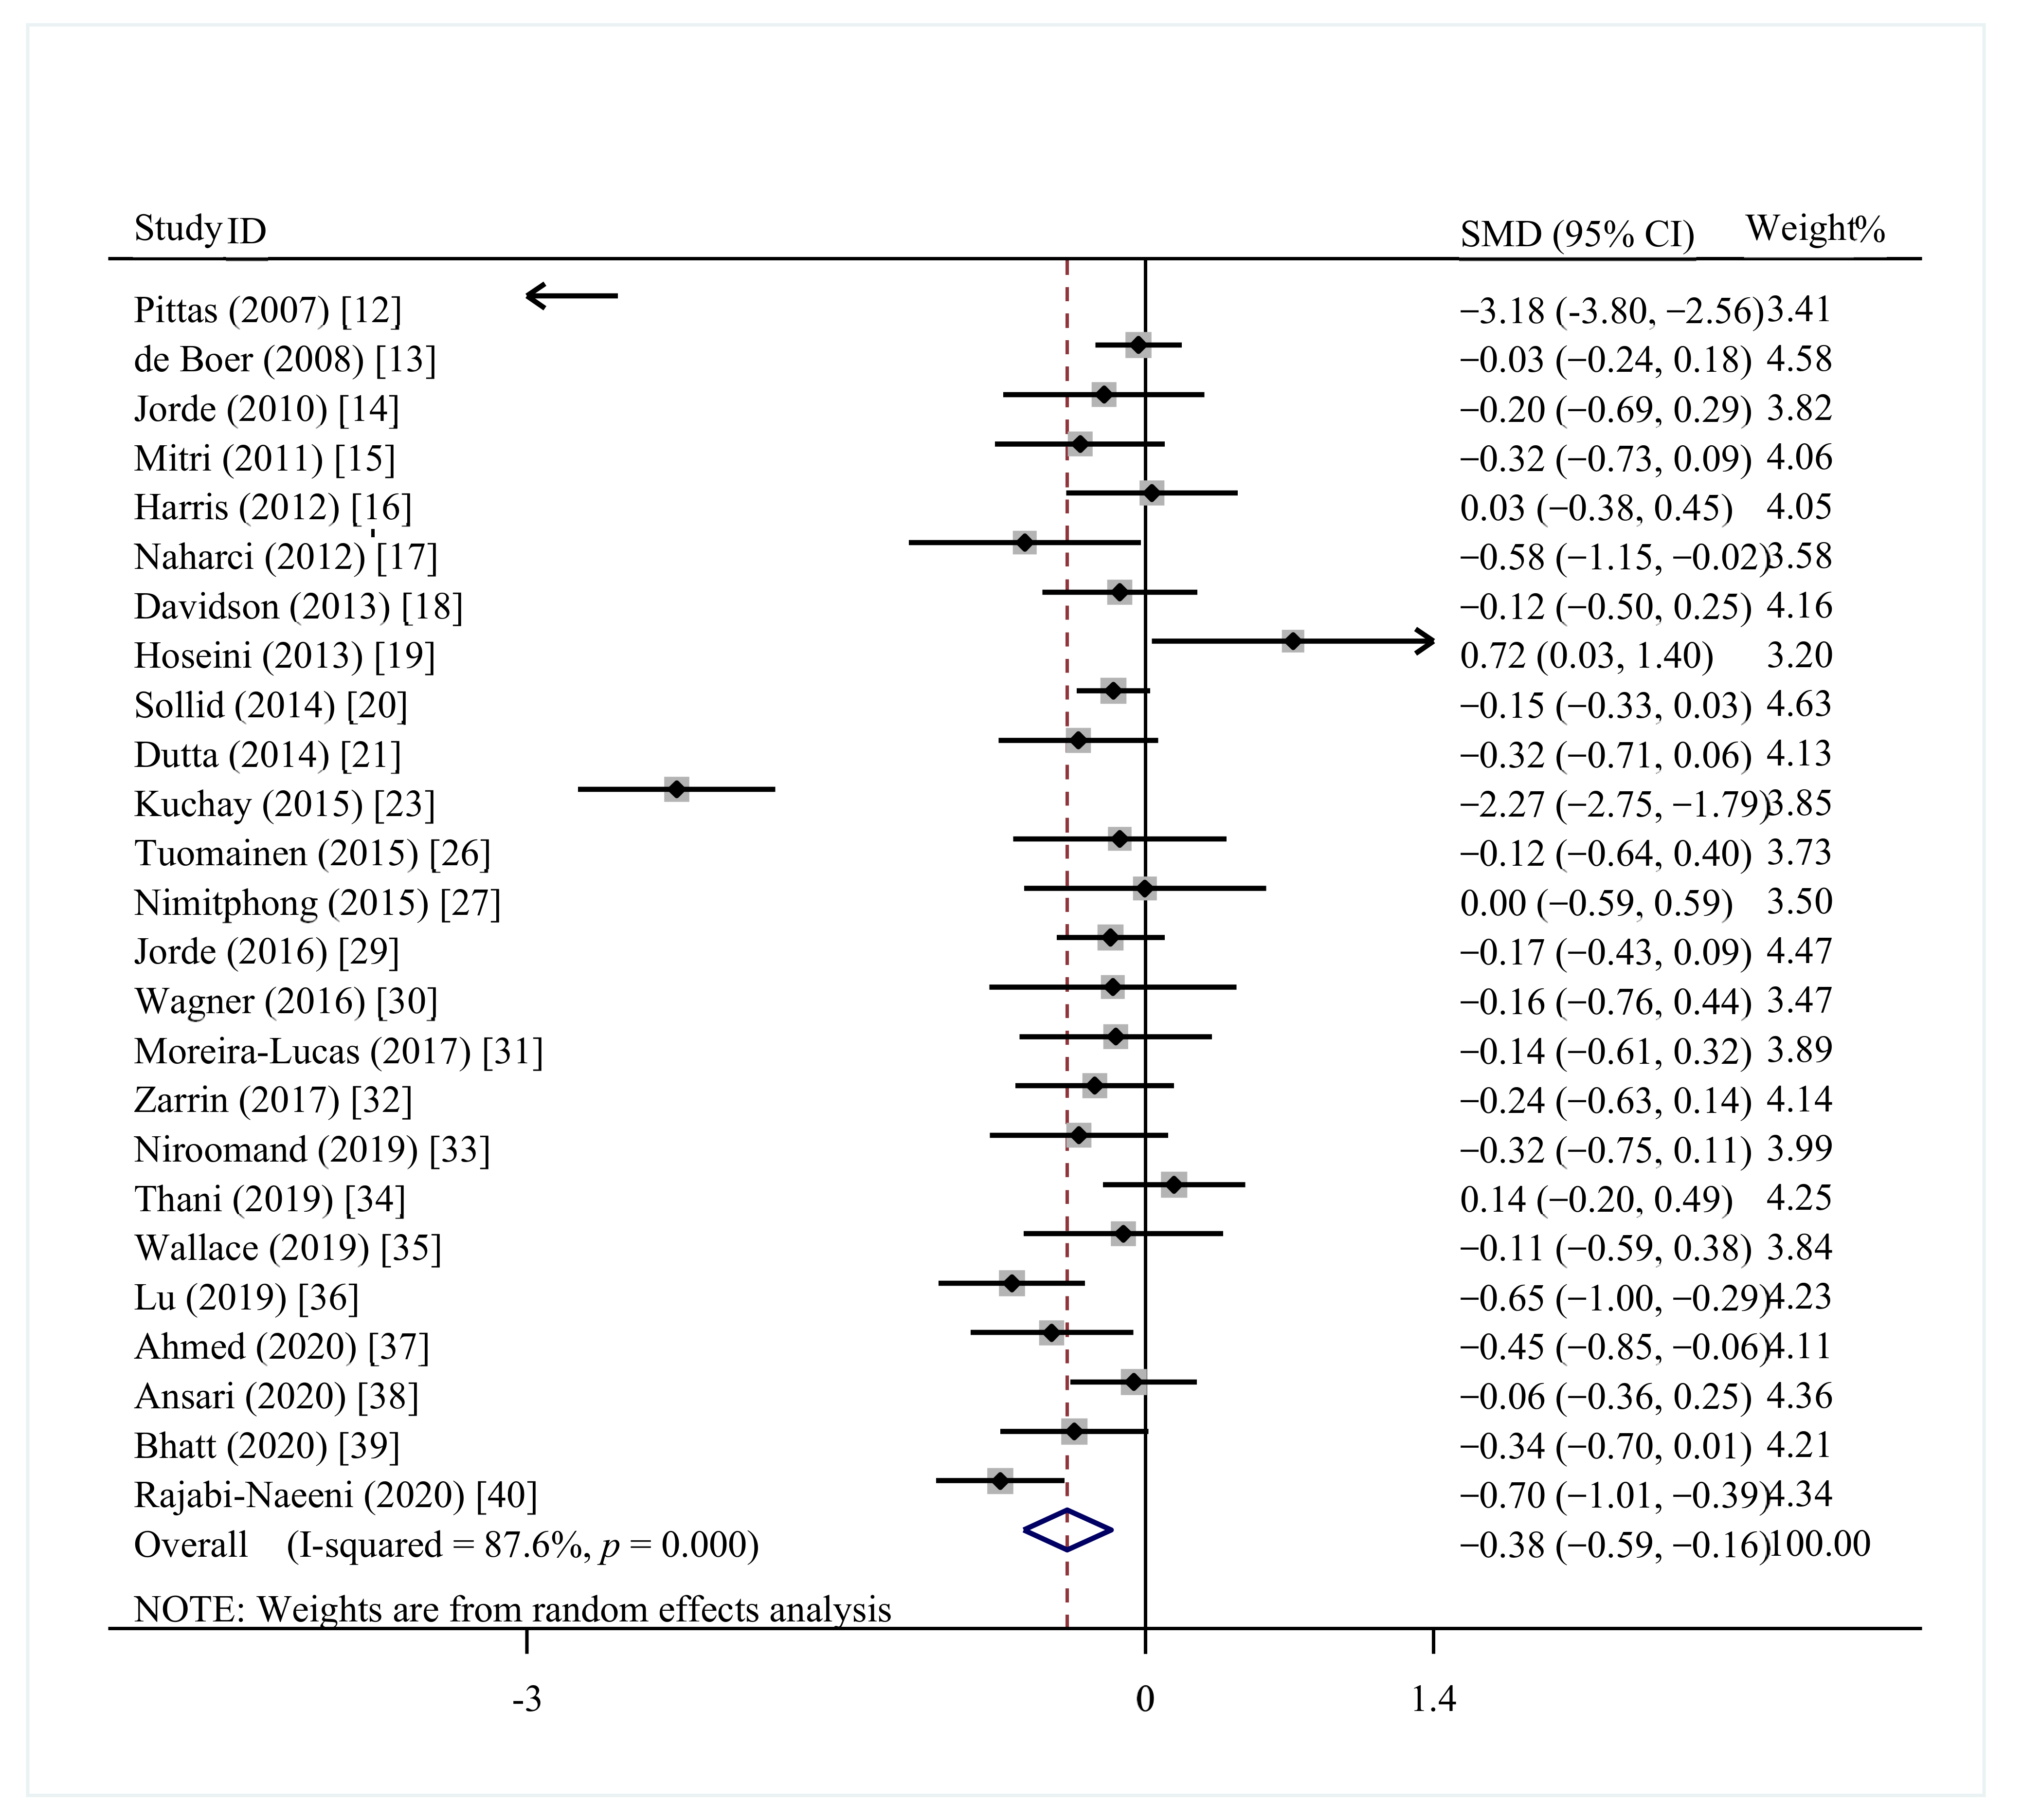
3.4.2. FBG
3.4.3. 2h-PG
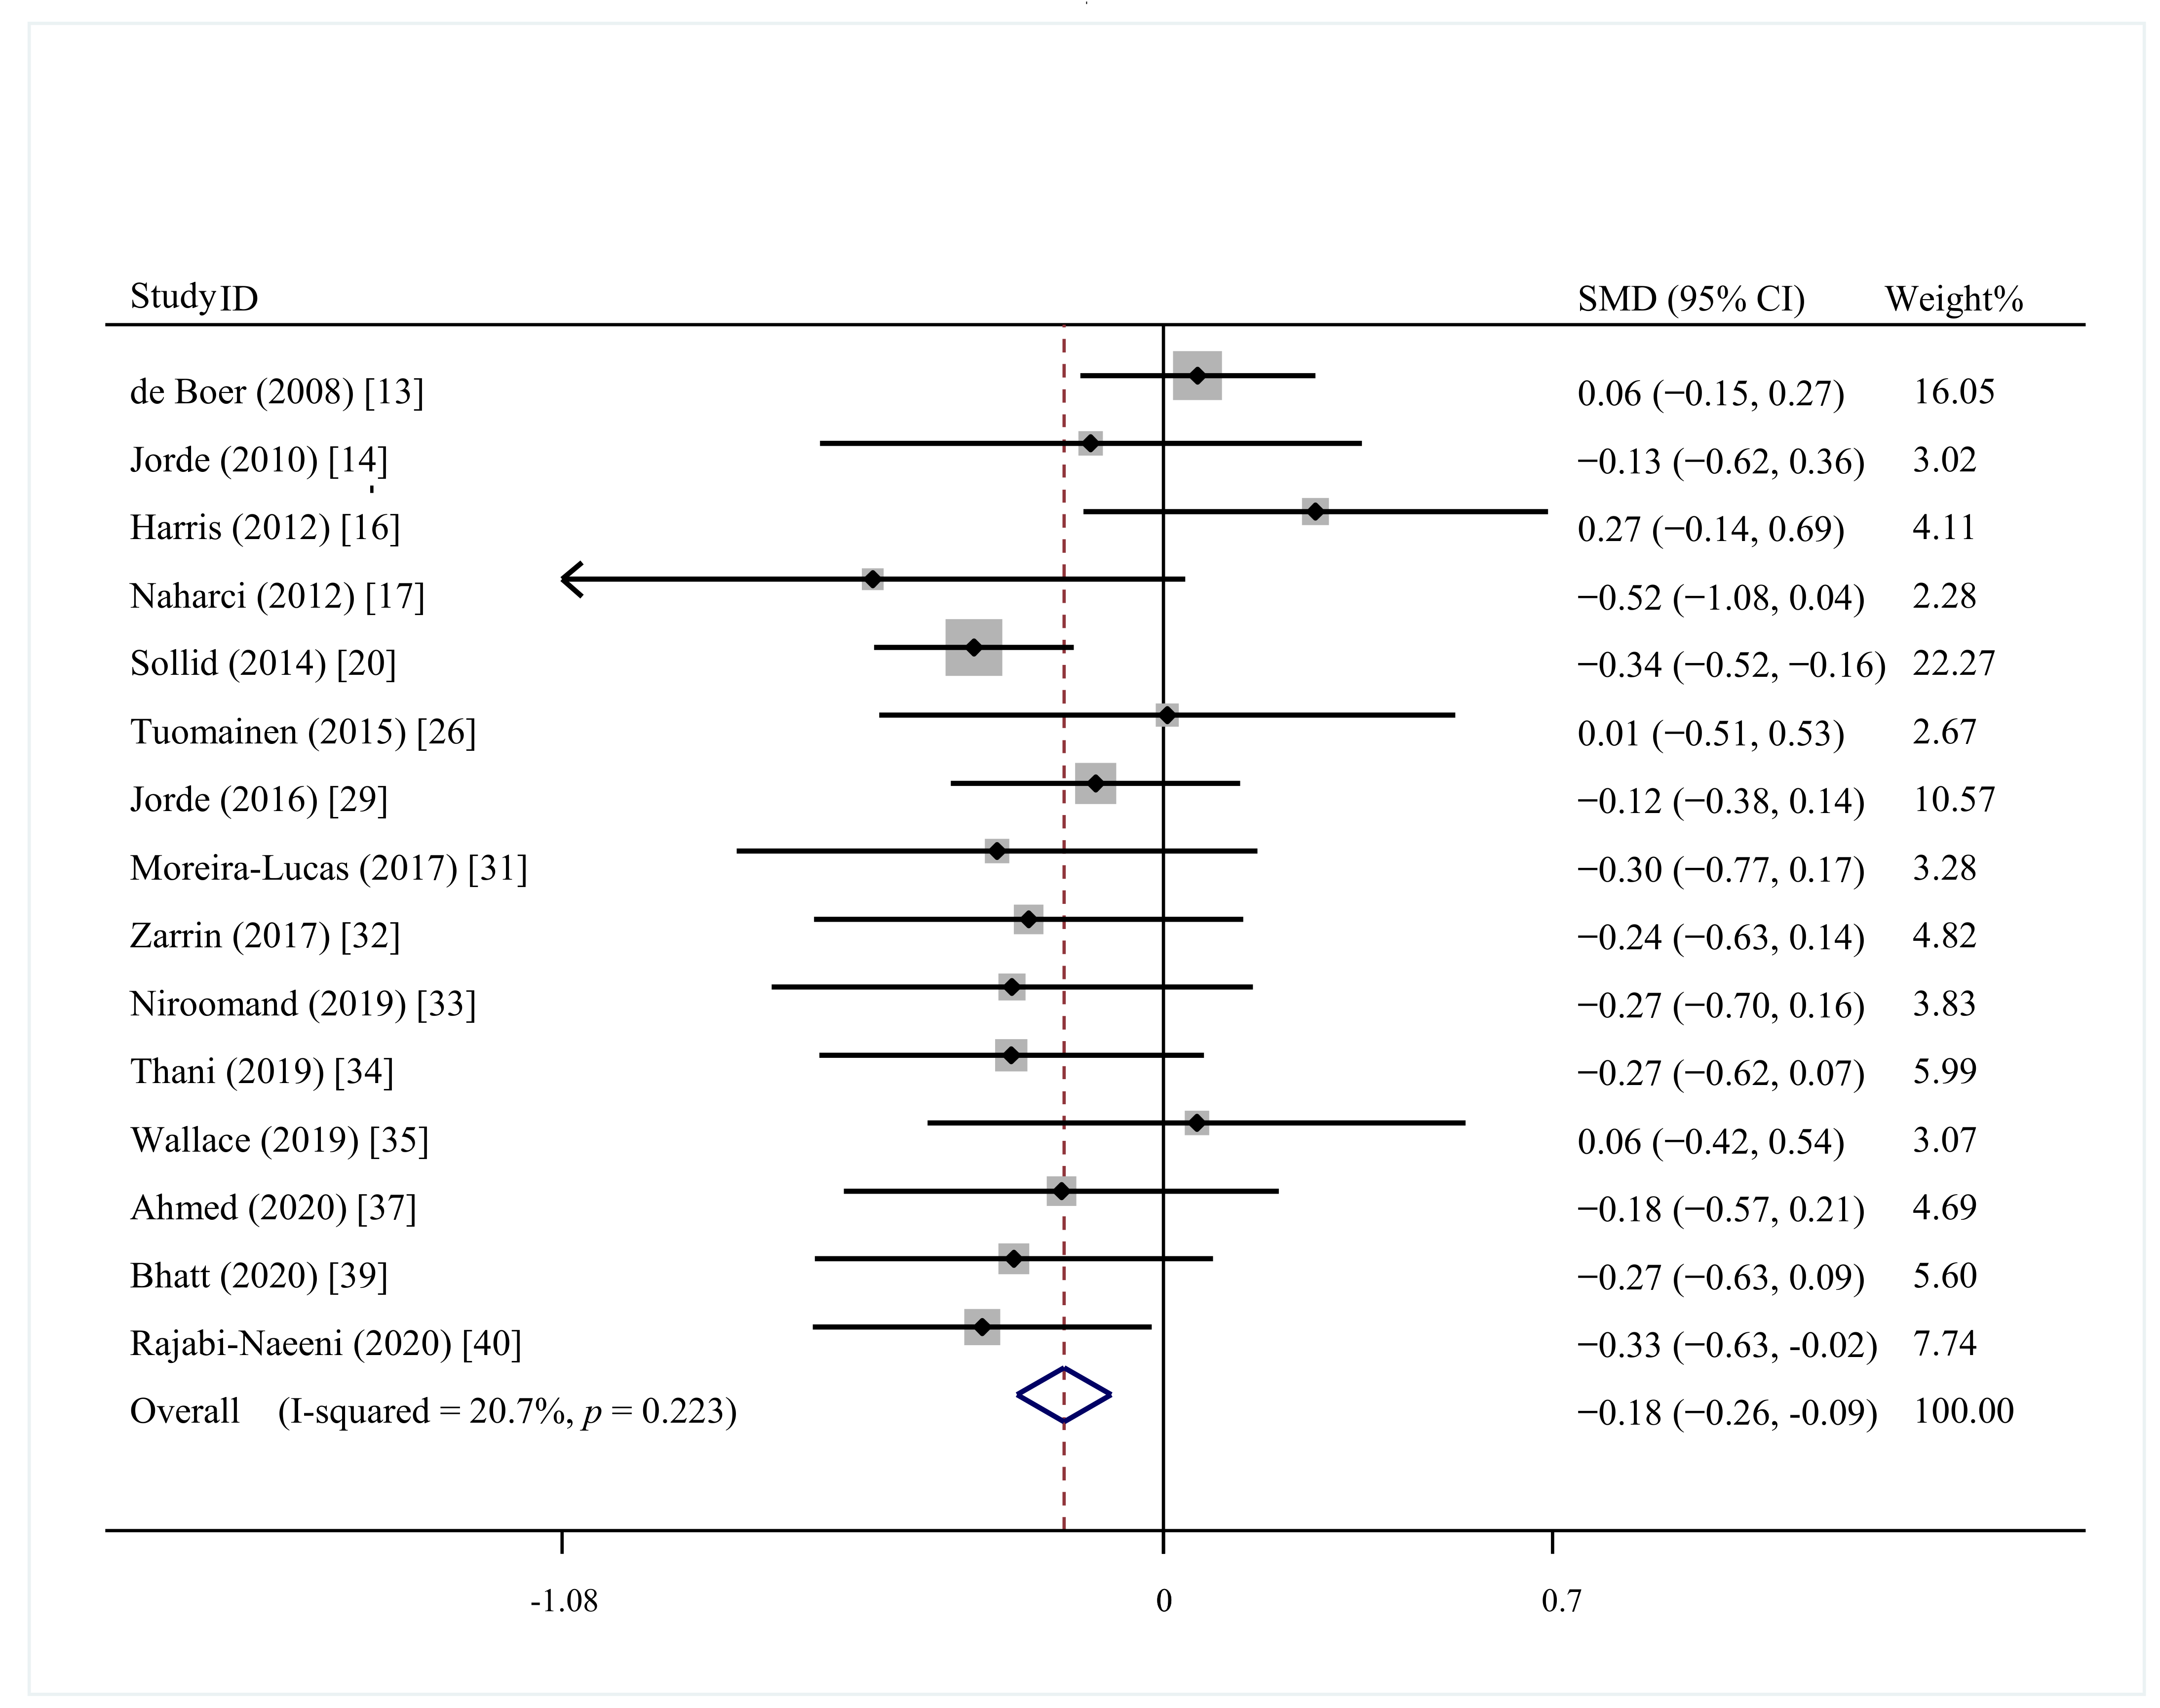
3.4.4. HbA1c
3.4.5. HOMA-IR
3.4.6. HOMA-B
3.4.7. FINS
3.5. Meta-Regression
3.6. Sensitivity Analysis
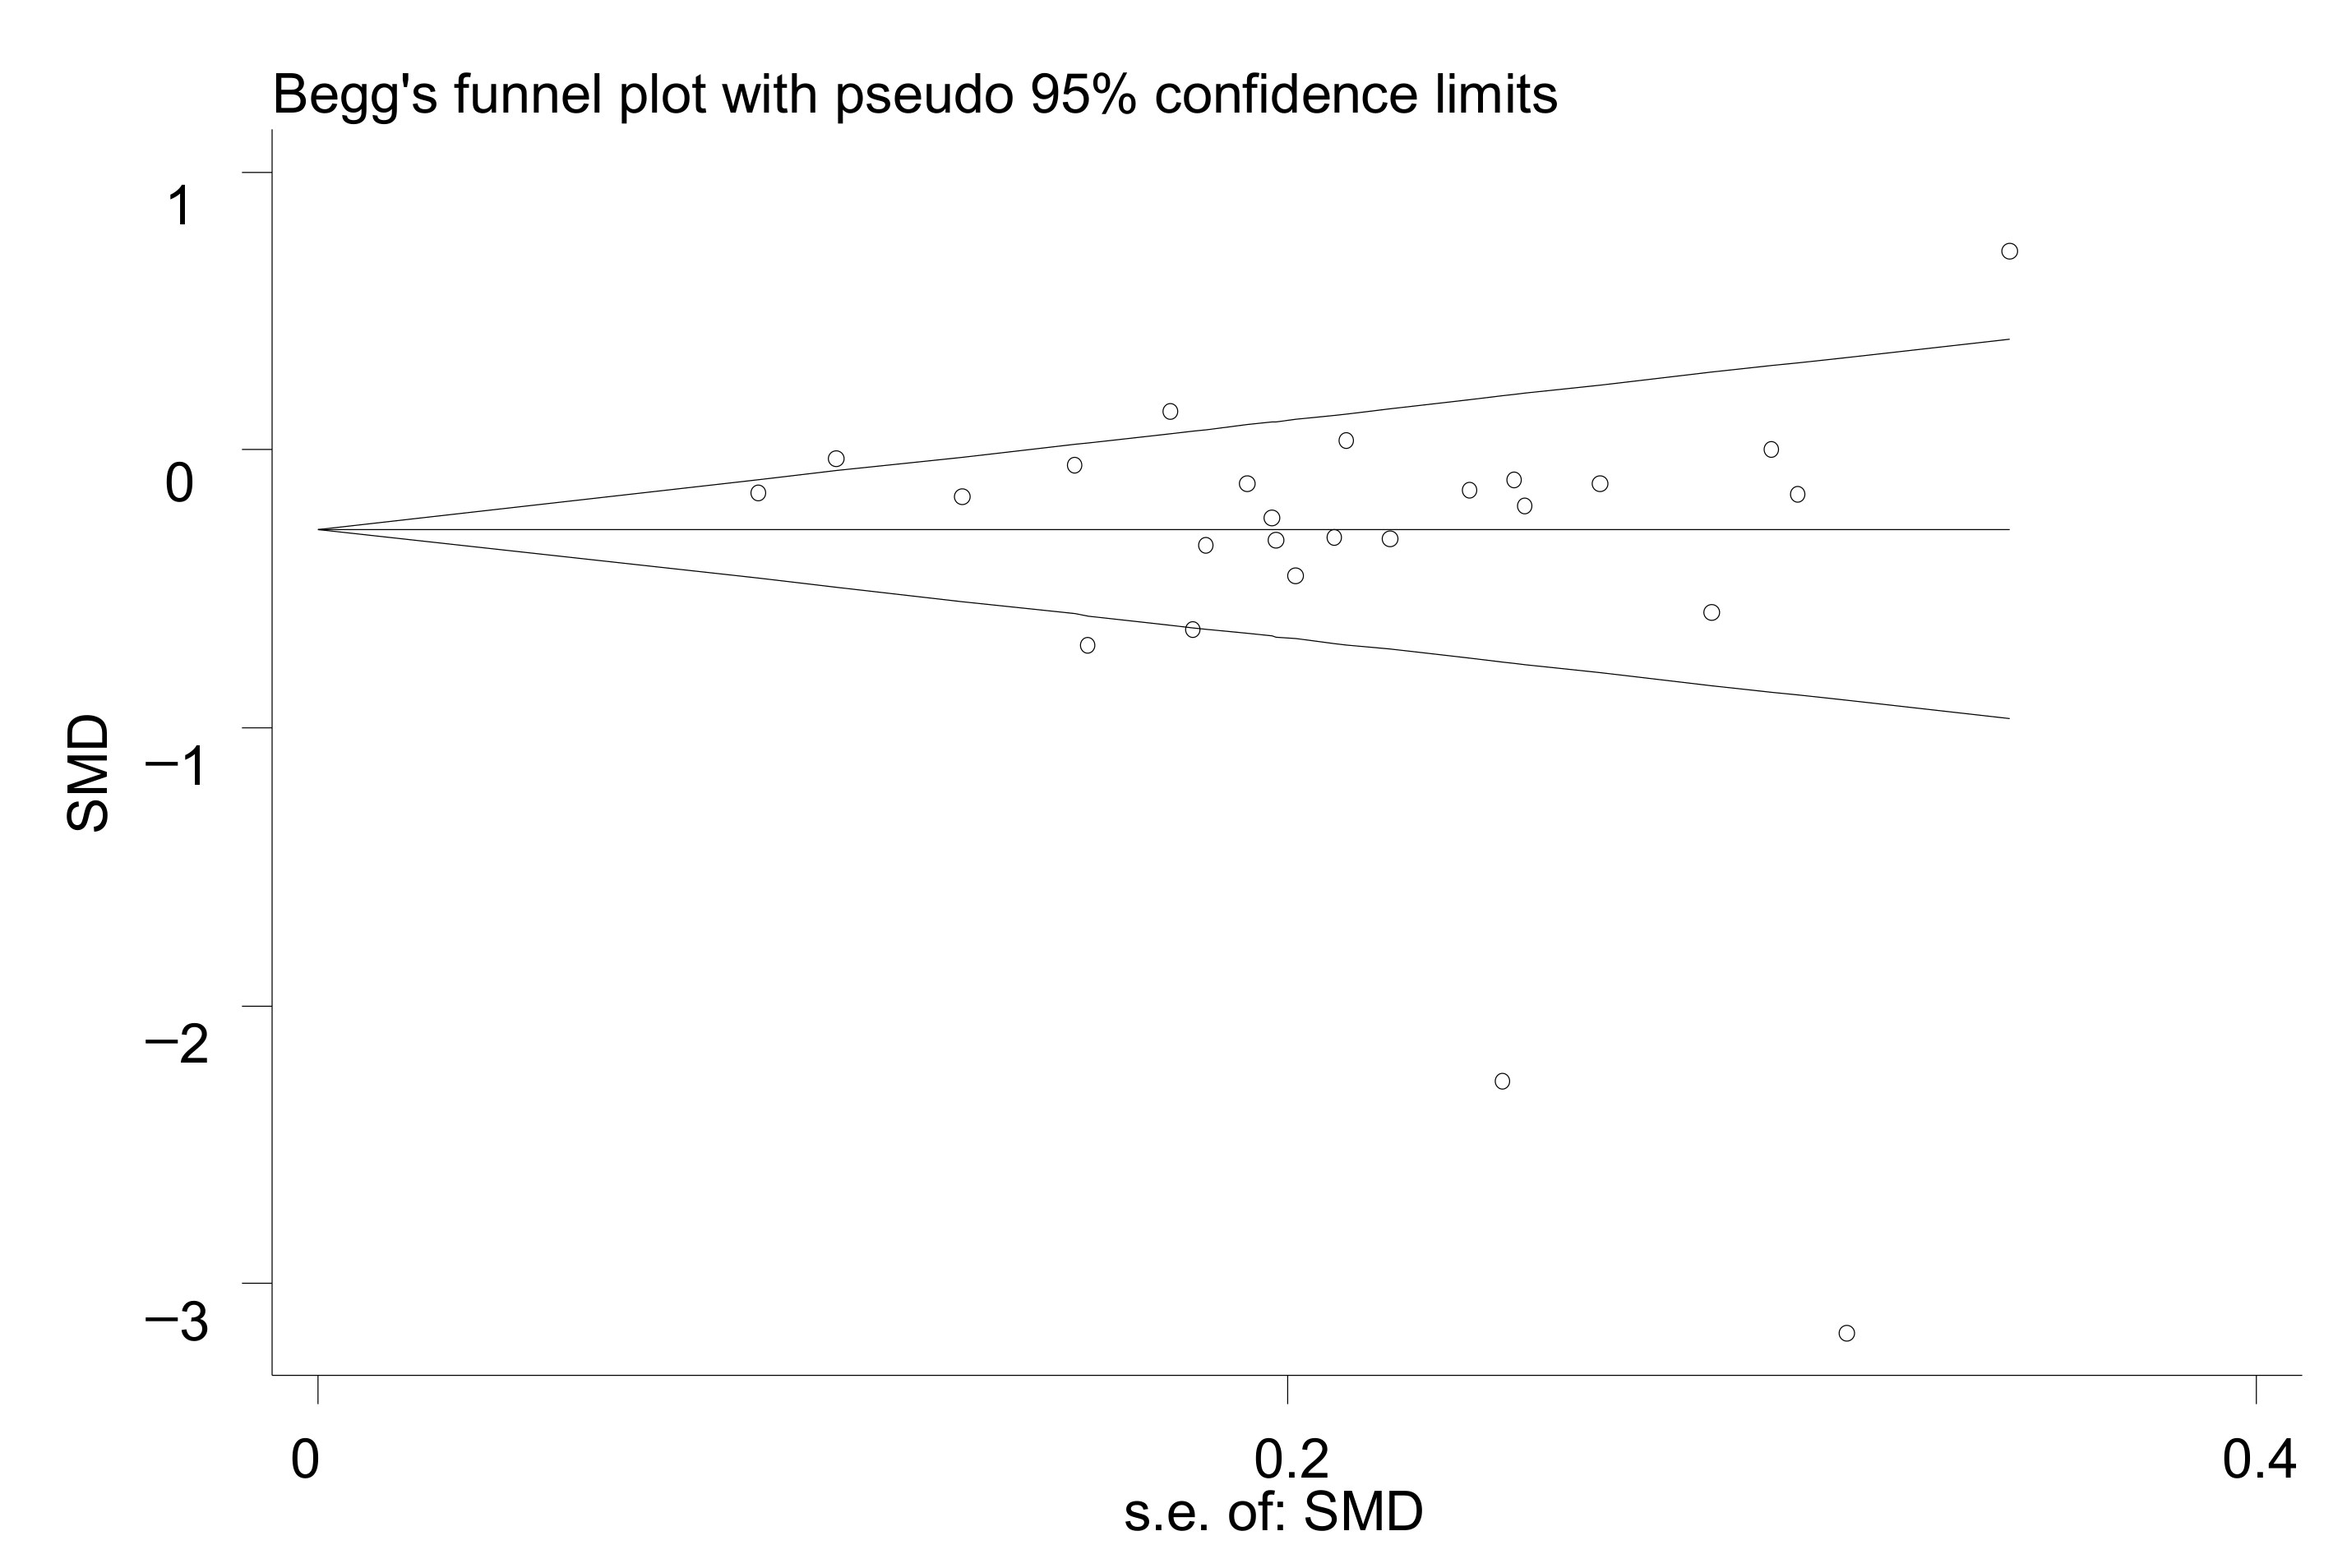
3.7. Publication Bias
4. Discussion
5. Conclusions
Supplementary Materials
Author Contributions
Funding
Data Availability Statement
Conflicts of Interest
References
- Saeedi, P.; Petersohn, I.; Salpea, P.; Malanda, B.; Karuranga, S.; Unwin, N.; Colagiuri, S.; Guariguata, L.; Motala, A.A.; Ogurtsova, K.; et al. Global and regional diabetes prevalence estimates for 2019 and projections for 2030 and 2045: Results from the International Diabetes Federation Diabetes Atlas, 9(th) edition. Diabetes Res. Clin. Pract. 2019, 157, 107843. [Google Scholar] [CrossRef] [PubMed] [Green Version]
- Tabak, A.G.; Herder, C.; Rathmann, W.; Brunner, E.J.; Kivimaki, M. Prediabetes: A high-risk state for diabetes development. Lancet 2012, 379, 2279–2290. [Google Scholar] [CrossRef] [Green Version]
- Lim, S.; Kim, M.J.; Choi, S.H.; Shin, C.S.; Park, K.S.; Jang, H.C.; Billings, L.K.; Meigs, J.B. Association of vitamin D deficiency with incidence of type 2 diabetes in high-risk Asian subjects. Am. J. Clin. Nutr. 2013, 97, 524–530. [Google Scholar] [CrossRef] [PubMed] [Green Version]
- Dhas, Y.; Banerjee, J.; Damle, G.; Mishra, N. Association of vitamin D deficiency with insulin resistance in middle-aged type 2 diabetics. Clin. Chim. Acta 2019, 492, 95–101. [Google Scholar] [CrossRef] [PubMed]
- Gao, Y.; Zheng, T.; Ran, X.; Ren, Y.; Chen, T.; Zhong, L.; Yan, D.; Yan, F.; Wu, Q.; Tian, H. Vitamin D and Incidence of Prediabetes or Type 2 Diabetes: A Four-Year Follow-Up Community-Based Study. Dis. Markers 2018, 2018, 1926308. [Google Scholar] [CrossRef] [PubMed] [Green Version]
- Yu, L.; Zhai, Y.; Shen, S. Association between vitamin D and prediabetes: A PRISMA-compliant meta-analysis. Medicine 2020, 99, e19034. [Google Scholar] [CrossRef]
- Poolsup, N.; Suksomboon, N.; Plordplong, N. Effect of vitamin D supplementation on insulin resistance and glycaemic control in prediabetes: A systematic review and meta-analysis. Diabet. Med. 2016, 33, 290–299. [Google Scholar] [CrossRef]
- American Diabetes, A. 2. Classification and Diagnosis of Diabetes: Standards of Medical Care in Diabetes-2020. Diabetes Care 2020, 43, S14–S31. [Google Scholar] [CrossRef] [PubMed] [Green Version]
- Consultation, W.I. Definition and Diagnosis of Diabetes and Intermediate Hyperglycaemia; World Health Organization: Geneva, Switzerland, 2006. [Google Scholar]
- Higgins, J.P.; Altman, D.G.; Gotzsche, P.C.; Juni, P.; Moher, D.; Oxman, A.D.; Savovic, J.; Schulz, K.F.; Weeks, L.; Sterne, J.A.; et al. The Cochrane Collaboration’s tool for assessing risk of bias in randomised trials. BMJ 2011, 343, d5928. [Google Scholar] [CrossRef] [PubMed] [Green Version]
- Borenstein, M.; Hedges, L.V.; Higgins, J.P.; Rothstein, H.R. A basic introduction to fixed-effect and random-effects models for meta-analysis. Res. Synth. Methods 2010, 1, 97–111. [Google Scholar] [CrossRef] [PubMed]
- Pittas, A.G.; Harris, S.S.; Stark, P.C.; Dawson-Hughes, B. The effects of calcium and vitamin D supplementation on blood glucose and markers of inflammation in nondiabetic adults. Diabetes Care 2007, 30, 980–986. [Google Scholar] [CrossRef] [PubMed] [Green Version]
- De Boer, I.H.; Tinker, L.F.; Connelly, S.; Curb, J.D.; Howard, B.V.; Kestenbaum, B.; Larson, J.C.; Manson, J.E.; Margolis, K.L.; Siscovick, D.S.; et al. Calcium plus vitamin D supplementation and the risk of incident diabetes in the Women’s Health Initiative. Diabetes Care 2008, 31, 701–707. [Google Scholar] [CrossRef] [PubMed] [Green Version]
- Jorde, R.; Sneve, M.; Torjesen, P.; Figenschau, Y. No improvement in cardiovascular risk factors in overweight and obese subjects after supplementation with vitamin D3 for 1 year. J. Intern. Med. 2010, 267, 462–472. [Google Scholar] [CrossRef] [PubMed]
- Mitri, J.; Dawson-Hughes, B.; Hu, F.B.; Pittas, A.G. Effects of vitamin D and calcium supplementation on pancreatic beta cell function, insulin sensitivity, and glycemia in adults at high risk of diabetes: The Calcium and Vitamin D for Diabetes Mellitus (CaDDM) randomized controlled trial. Am. J. Clin. Nutr. 2011, 94, 486–494. [Google Scholar] [CrossRef] [PubMed] [Green Version]
- Harris, S.S.; Pittas, A.G.; Palermo, N.J. A randomized, placebo-controlled trial of vitamin D supplementation to improve glycaemia in overweight and obese African Americans. Diabetes Obes. Metab. 2012, 14, 789–794. [Google Scholar] [CrossRef] [PubMed]
- Naharci, I.; Bozoglu, E.; Kocak, N.; Doganci, S.; Doruk, H.; Serdar, M. Effect of vitamin D on insulin sensitivity in elderly patients with impaired fasting glucose. Geriatr. Gerontol. Int. 2012, 12, 454–460. [Google Scholar] [CrossRef] [PubMed]
- Davidson, M.B.; Duran, P.; Lee, M.L.; Friedman, T.C. High-dose vitamin D supplementation in people with prediabetes and hypovitaminosis D. Diabetes Care 2013, 36, 260–266. [Google Scholar] [CrossRef] [Green Version]
- Hoseini, S.A.; Aminorroaya, A.; Iraj, B.; Amini, M. The effects of oral vitamin D on insulin resistance in pre-diabetic patients. J. Res. Med. Sci. 2013, 18, 47–51. [Google Scholar]
- Sollid, S.T.; Hutchinson, M.Y.; Fuskevag, O.M.; Figenschau, Y.; Joakimsen, R.M.; Schirmer, H.; Njolstad, I.; Svartberg, J.; Kamycheva, E.; Jorde, R. No effect of high-dose vitamin D supplementation on glycemic status or cardiovascular risk factors in subjects with prediabetes. Diabetes Care 2014, 37, 2123–2131. [Google Scholar] [CrossRef] [Green Version]
- Dutta, D.; Mondal, S.A.; Choudhuri, S.; Maisnam, I.; Hasanoor Reza, A.H.; Bhattacharya, B.; Chowdhury, S.; Mukhopadhyay, S. Vitamin-D supplementation in prediabetes reduced progression to type 2 diabetes and was associated with decreased insulin resistance and systemic inflammation: An open label randomized prospective study from Eastern India. Diabetes Res. Clin. Pract. 2014, 103, e18–e23. [Google Scholar] [CrossRef] [PubMed]
- Oosterwerff, M.M.; Eekhoff, E.M.; Van Schoor, N.M.; Boeke, A.J.; Nanayakkara, P.; Meijnen, R.; Knol, D.L.; Kramer, M.H.; Lips, P. Effect of moderate-dose vitamin D supplementation on insulin sensitivity in vitamin D-deficient non-Western immigrants in the Netherlands: A randomized placebo-controlled trial. Am. J. Clin. Nutr. 2014, 100, 152–160. [Google Scholar] [CrossRef] [PubMed]
- Kuchay, M.S.; Laway, B.A.; Bashir, M.I.; Wani, A.I.; Misgar, R.A.; Shah, Z.A. Effect of Vitamin D supplementation on glycemic parameters and progression of prediabetes to diabetes: A 1-year, open-label randomized study. Indian J. Endocrinol. Metab. 2015, 19, 387–392. [Google Scholar] [PubMed]
- Barengolts, E.; Manickam, B.; Eisenberg, Y.; Akbar, A.; Kukreja, S.; Ciubotaru, I. Effect of High-Dose Vitamin D Repletion on Glycemic Control in African-American Males with Prediabetes and Hypovitaminosis D. Endocr. Pract. 2015, 21, 604–612. [Google Scholar] [CrossRef] [PubMed] [Green Version]
- Didriksen, A.; Burild, A.; Jakobsen, J.; Fuskevag, O.M.; Jorde, R. Vitamin D3 increases in abdominal subcutaneous fat tissue after supplementation with vitamin D3. Eur. J. Endocrinol. 2015, 172, 235–241. [Google Scholar] [CrossRef] [PubMed] [Green Version]
- Tuomainen, T.P.; Virtanen, J.K.; Voutilainen, S.; Nurmi, T.; Mursu, J.; de Mello, V.D.; Schwab, U.; Hakumaki, M.; Pulkki, K.; Uusitupa, M. Glucose Metabolism Effects of Vitamin D in Prediabetes: The VitDmet Randomized Placebo-Controlled Supplementation Study. J. Diabetes Res. 2015, 2015, 672653. [Google Scholar] [CrossRef] [PubMed]
- Nimitphong, H.; Samittarucksa, R.; Saetung, S.; Bhirommuang, N.; Chailurkit, L.O.; Ongphiphadhanakul, B. The Effect of Vitamin D Supplementation on Metabolic Phenotypes in Thais with Prediabetes. J. Med. Assoc. Thai. 2015, 98, 1169–1178. [Google Scholar]
- Forouhi, N.G.; Menon, R.K.; Sharp, S.J.; Mannan, N.; Timms, P.M.; Martineau, A.R.; Rickard, A.P.; Boucher, B.J.; Chowdhury, T.A.; Griffiths, C.J.; et al. Effects of vitamin D2 or D3 supplementation on glycaemic control and cardiometabolic risk among people at risk of type 2 diabetes: Results of a randomized double-blind placebo-controlled trial. Diabetes Obes. Metab. 2016, 18, 392–400. [Google Scholar] [CrossRef] [Green Version]
- Jorde, R.; Sollid, S.T.; Svartberg, J.; Schirmer, H.; Joakimsen, R.M.; Njolstad, I.; Fuskevag, O.M.; Figenschau, Y.; Hutchinson, M.Y. Vitamin D 20,000 IU per Week for Five Years Does Not Prevent Progression From Prediabetes to Diabetes. J. Clin. Endocrinol. Metab. 2016, 101, 1647–1655. [Google Scholar] [CrossRef] [PubMed] [Green Version]
- Wagner, H.; Alvarsson, M.; Mannheimer, B.; Degerblad, M.; Ostenson, C.G. No Effect of High-Dose Vitamin D Treatment on beta-Cell Function, Insulin Sensitivity, or Glucose Homeostasis in Subjects With Abnormal Glucose Tolerance: A Randomized Clinical Trial. Diabetes Care 2016, 39, 345–352. [Google Scholar] [CrossRef] [Green Version]
- Moreira-Lucas, T.S.; Duncan, A.M.; Rabasa-Lhoret, R.; Vieth, R.; Gibbs, A.L.; Badawi, A.; Wolever, T.M. Effect of vitamin D supplementation on oral glucose tolerance in individuals with low vitamin D status and increased risk for developing type 2 diabetes (EVIDENCE): A double-blind, randomized, placebo-controlled clinical trial. Diabetes Obes. Metab. 2017, 19, 133–141. [Google Scholar] [CrossRef]
- Zarrin, R.; Ayremlou, P.; Ghassemi, F. The Effect of Vitamin D Supplementation on the Glycemic Status and the Percentage of Body Fat Mass in Adults with Prediabetes: A Randomized Clinical Trial. Iran. Red Crescent Med. J. 2017, 19, e41718. [Google Scholar] [CrossRef] [Green Version]
- Niroomand, M.; Fotouhi, A.; Irannejad, N.; Hosseinpanah, F. Does high-dose vitamin D supplementation impact insulin resistance and risk of development of diabetes in patients with pre-diabetes? A double-blind randomized clinical trial. Diabetes Res. Clin. Pract. 2019, 148, 1–9. [Google Scholar] [CrossRef] [PubMed]
- Al Thani, M.; Sadoun, E.; Sofroniou, A.; Jayyousi, A.; Baagar, K.A.M.; Al Hammaq, A.; Vinodson, B.; Akram, H.; Bhatti, Z.S.; Nasser, H.S.; et al. The effect of vitamin D supplementation on the glycemic control of pre-diabetic Qatari patients in a randomized control trial. BMC Nutr. 2019, 5, 46. [Google Scholar] [CrossRef] [PubMed] [Green Version]
- Wallace, H.J.; Holmes, L.; Ennis, C.N.; Cardwell, C.R.; Woodside, J.V.; Young, I.S.; Bell, P.M.; Hunter, S.J.; McKinley, M.C. Effect of vitamin D3 supplementation on insulin resistance and beta-cell function in prediabetes: A double-blind, randomized, placebo-controlled trial. Am. J. Clin. Nutr. 2019, 110, 1138–1147. [Google Scholar] [CrossRef] [PubMed]
- Lu, J.; Liu, Y.; Zhang, J.; Lou, P.; Liu, Y.; Zhou, Y. Effect of vitamin D intervention on the outcome of glucose metabolism in patients with impaired glucose regulation. Chin. J. Clin. Nutr. 2019, 27, 349–353. [Google Scholar]
- Ahmed, M.M.; Zingade, U.S.; Badaam, K.M. Effect of Vitamin D3 Supplementation on Insulin Sensitivity in Prediabetes With Hypovitaminosis D: A Randomized Placebo-Controlled Trial. Cureus 2020, 12, e12009. [Google Scholar] [CrossRef]
- Ansari, M.G.A.; Sabico, S.; Clerici, M.; Khattak, M.N.K.; Wani, K.; Al-Musharaf, S.; Amer, O.E.; Alokail, M.S.; Al-Daghri, N.M. Vitamin D Supplementation Is Associated with Increased Glutathione Peroxidase-1 Levels in Arab Adults with Prediabetes. Antioxidants 2020, 9, 118. [Google Scholar] [CrossRef] [Green Version]
- Bhatt, S.P.; Misra, A.; Pandey, R.M.; Upadhyay, A.D.; Gulati, S.; Singh, N. Vitamin D Supplementation in Overweight/obese Asian Indian Women with Prediabetes Reduces Glycemic Measures and Truncal Subcutaneous Fat: A 78 Weeks Randomized Placebo-Controlled Trial (PREVENT-WIN Trial). Sci Rep. 2020, 10, 220. [Google Scholar] [CrossRef] [PubMed] [Green Version]
- Rajabi-Naeeni, M.; Dolatian, M.; Qorbani, M.; Vaezi, A.A. The effect of omega-3 and vitamin D co-supplementation on glycemic control and lipid profiles in reproductive-aged women with pre-diabetes and hypovitaminosis D: A randomized controlled trial. Diabetol. Metab. Syndr. 2020, 12, 41. [Google Scholar] [CrossRef] [PubMed]
- Gopal-Kothandapani, J.S.; Evans, L.F.; Walsh, J.S.; Gossiel, F.; Rigby, A.S.; Eastell, R.; Bishop, N.J. Effect of vitamin D supplementation on free and total vitamin D: A comparison of Asians and Caucasians. Clin. Endocrinol. 2019, 90, 222–231. [Google Scholar] [CrossRef] [PubMed]
- Jones, P.; Lucock, M.; Chaplin, G.; Jablonski, N.G.; Veysey, M.; Scarlett, C.; Beckett, E. Distribution of variants in multiple vitamin D-related loci (DHCR7/NADSYN1, GC, CYP2R1, CYP11A1, CYP24A1, VDR, RXRalpha and RXRgamma) vary between European, East-Asian and Sub-Saharan African-ancestry populations. Genes Nutr. 2020, 15, 5. [Google Scholar] [CrossRef] [PubMed] [Green Version]
- Elkum, N.; Alkayal, F.; Noronha, F.; Ali, M.M.; Melhem, M.; Al-Arouj, M.; Bennakhi, A.; Behbehani, K.; Alsmadi, O.; Abubaker, J. Vitamin D insufficiency in Arabs and South Asians positively associates with polymorphisms in GC and CYP2R1 genes. PLoS ONE 2014, 9, e113102. [Google Scholar]
- Lu, L.; Sheng, H.; Li, H.; Gan, W.; Liu, C.; Zhu, J.; Loos, R.J.; Lin, X. Associations between common variants in GC and DHCR7/NADSYN1 and vitamin D concentration in Chinese Hans. Hum. Genet. 2012, 131, 505–512. [Google Scholar] [CrossRef] [PubMed]
- Rivera-Paredez, B.; Macias, N.; Martinez-Aguilar, M.M.; Hidalgo-Bravo, A.; Flores, M.; Quezada-Sanchez, A.D.; Denova-Gutierrez, E.; Cid, M.; Martinez-Hernandez, A.; Orozco, L.; et al. Association between Vitamin D Deficiency and Single Nucleotide Polymorphisms in the Vitamin D Receptor and GC Genes and Analysis of Their Distribution in Mexican Postmenopausal Women. Nutrients 2018, 10, 1175. [Google Scholar] [CrossRef] [Green Version]
- Angel, B.; Lera, L.; Marquez, C.; Albala, C. The association of VDR polymorphisms and type 2 diabetes in older people living in community in Santiago de Chile. Nutr. Diabetes 2018, 8, 31. [Google Scholar] [CrossRef] [PubMed] [Green Version]
- Rodrigues, K.F.; Pietrani, N.T.; Bosco, A.A.; de Sousa, M.C.R.; Silva, I.F.O.; Silveira, J.N.; Gomes, K.B. Lower Vitamin D Levels, but Not VDR Polymorphisms, Influence Type 2 Diabetes Mellitus in Brazilian Population Independently of Obesity. Medicina 2019, 55, 188. [Google Scholar] [CrossRef] [PubMed] [Green Version]
- Rajan, S.; Weishaar, T.; Keller, B. Weight and skin colour as predictors of vitamin D status: Results of an epidemiological investigation using nationally representative data. Public Health Nutr. 2017, 20, 1857–1864. [Google Scholar] [CrossRef] [Green Version]
- Weishaar, T.; Rajan, S.; Keller, B. Probability of Vitamin D Deficiency by Body Weight and Race/Ethnicity. J. Am. Board Fam. Med. 2016, 29, 226–232. [Google Scholar] [CrossRef] [Green Version]
- Krul-Poel, Y.H.; Ter Wee, M.M.; Lips, P.; Simsek, S. Management of endocrine disease: The effect of vitamin D supplementation on glycaemic control in patients with type 2 diabetes mellitus: A systematic review and meta-analysis. Eur. J. Endocrinol. 2017, 176, R1–R14. [Google Scholar] [CrossRef] [PubMed] [Green Version]
- Li, X.; Liu, Y.; Zheng, Y.; Wang, P.; Zhang, Y. The Effect of Vitamin D Supplementation on Glycemic Control in Type 2 Diabetes Patients: A Systematic Review and Meta-Analysis. Nutrients 2018, 10, 375. [Google Scholar] [CrossRef] [PubMed] [Green Version]
- Busquets-Cortes, C.; Bennasar-Veny, M.; Lopez-Gonzalez, A.A.; Fresneda, S.; Abbate, M.; Yanez, A.M. Utility of Fatty Liver Index to predict reversion to normoglycemia in people with prediabetes. PLoS ONE 2021, 16, e0249221. [Google Scholar] [CrossRef] [PubMed]
- Pojednic, R.M.; Trussler, E.M.; Navon, J.D.; Lemire, S.C.; Siu, E.C.; Metallinos-Katsaras, E.S. Vitamin D deficiency associated with risk of prediabetes among older adults: Data from the National Health and Nutrition Examination Survey (NHANES), 2007–2012. Diabetes Metab. Res. Rev. 2021, e3499. [Google Scholar] [CrossRef] [PubMed]
- Nakamura, K.; Hui, S.P.; Ukawa, S.; Okada, E.; Nakagawa, T.; Imae, A.; Okabe, H.; Chen, Z.; Miura, Y.; Chiba, H.; et al. Serum 25-hydroxyvitamin D3 Levels and Diabetes in a Japanese Population: The DOSANCO Health Study. J. Epidemiol. 2021. [Google Scholar] [CrossRef] [PubMed]
- Schleu, M.F.; Barreto-Duarte, B.; Arriaga, M.B.; Araujo-Pereira, M.; Ladeia, A.M.; Andrade, B.B.; Lima, M.L. Lower Levels of Vitamin D Are Associated with an Increase in Insulin Resistance in Obese Brazilian Women. Nutrients 2021, 13, 2979. [Google Scholar] [CrossRef] [PubMed]
- Zhao, H.; Zheng, C.; Zhang, M.; Chen, S. The relationship between vitamin D status and islet function in patients with type 2 diabetes mellitus. BMC Endocr. Disord. 2021, 21, 203. [Google Scholar] [CrossRef] [PubMed]
- Engelman, C.D.; Meyers, K.J.; Iyengar, S.K.; Liu, Z.; Karki, C.K.; Igo, R.P., Jr.; Truitt, B.; Robinson, J.; Sarto, G.E.; Wallace, R.; et al. Vitamin D intake and season modify the effects of the GC and CYP2R1 genes on 25-hydroxyvitamin D concentrations. J. Nutr. 2013, 143, 17–26. [Google Scholar] [CrossRef] [PubMed] [Green Version]
- Signorello, L.B.; Shi, J.; Cai, Q.; Zheng, W.; Williams, S.M.; Long, J.; Cohen, S.S.; Li, G.; Hollis, B.W.; Smith, J.R.; et al. Common variation in vitamin D pathway genes predicts circulating 25-hydroxyvitamin D Levels among African Americans. PLoS ONE 2011, 6, e28623. [Google Scholar] [CrossRef] [PubMed] [Green Version]
- Su, M.; Chen, X.; Chen, Y.; Wang, C.; Li, S.; Ying, X.; Xiao, T.; Wang, N.; Jiang, Q.; Fu, C. UCP2 and UCP3 variants and gene-environment interaction associated with prediabetes and T2DM in a rural population: A case control study in China. BMC Med. Genet. 2018, 19, 43. [Google Scholar] [CrossRef] [Green Version]


| Study | Year | Country | Participants | N(I/C) | Age (Years) | Intervention | Control | Duration Period | Outcomes |
|---|---|---|---|---|---|---|---|---|---|
| Pittas et al. [12] | 2007 | USA | IFG | 45/47 | I: 71.1 ± 0.7 C: 71.3 ± 0.8 | VD3 700 IU/day + Ca 500 mg/day | placebo | 3 years | ①②⑤ |
| de Boer et al. [13] | 2008 | USA | IFG | 172/178 | NA | VD3 400 IU/day + Ca 1000 mg/day | placebo | 7 years | ②⑤⑦ |
| Jorde et al. [14] | 2010 | Norway | Prediabetes | 34/31 | NA | VD3 20,000 or 40,000 IU/week + Ca 500 mg/day | placebo + Ca 500 mg/day | 1 year | ①②③④⑤⑦ |
| Mitri et al. [15] | 2011 | USA | Prediabetes | 46/46 | I: 57 ± 9.59 C: 58 ± 9.60 | VD3 2000 IU/day + Ca 800 mg/day or Ca-placebo | VD-placebo + Ca 800 mg/day or Ca-placebo | 16 weeks | ②③④ |
| Harris et al. [16] | 2012 | USA | Prediabetes | 43/46 | I: 71.1 ± 0.7 C: 56.3 ± 12.3 | VD3 4000 IU/day + Ca 600 mg/day | placebo + Ca 600 mg/day | 12 weeks | ②③④⑤⑦ |
| Naharci et al. [17] | 2012 | Turkey | IFG | 28/23 | I: 75.1 ± 7.3 C: 76.1 ± 5.4 | VD insufficient: VD3 800 IU/day + Ca 1000 mg/day VD normal: VD3 400 IU/day + Ca 600 mg/day | nothing | 4.7 ± 2.5 months | ①②⑤⑦ |
| Davidson et al. [18] | 2013 | USA | Prediabetes | 56/53 | NA | VD3 88,865 IU/week (range 64,731–13,4446 IU/week) | placebo | 1 year | ①②③④⑤⑥ |
| Hoseini et al. [19] | 2013 | Iran | Prediabetes | 21/15 | I: 46.3 ± 6.5 C: 48.9 ± 6.1 | VD 50,000 IU/week or every other week + Ca 500 mg/day | Ca 500 mg/day | 12 weeks | ②④⑤⑥ |
| Sollid et al. [20] | 2014 | Norway | Prediabetes | 242/242 | NA | VD3 20,000 IU/week | placebo | 1 years | ①②③④⑤⑦ |
| Dutta et al. [21] | 2014 | India | Prediabetes | 55/49 | NA | VD3 60,000 IU/week for 8 weeks, then 60,000 IU/month + Ca 500 mg/day | Ca 500 mg/day | I: 28.2 ± 8.83 months C: 29.15 ± 7.69 months | ①②③④⑤⑥ |
| Oosterwerff et al. [22] | 2014 | Netherlands | Prediabetes | 65/65 | NA | VD3 1200 IU/day + Ca 500 | placebo + Ca 500 mg/day | 16 months | ①⑤ |
| mg/day | |||||||||
| Kuchay et al. [23] | 2015 | India | Prediabetes | 56/55 | NA | VD3 60,000 IU/week for 4 weeks and then 60,000 IU/month | nothing | 1 year | ①②③④ |
| Barengolts et al. [24] | 2015 | USA | Prediabetes | 87/86 | I: 58.2 ± 6.0 C: 59.8 ± 6.0 | VD2 50,000 IU/week | placebo | 1 year | ④ |
| Didriksen et al. [25] | 2015 | Norway | IFG | 18/11 | I: 60.8 ± 9.33 C: 62.0 ± 9.41 | VD3 20,000 IU/week | placebo | 3–5 years | ①④ |
| Tuomainen et al. [26] | 2015 | Finland | Prediabetes | 45/21 | NA | VD3 1600/3200 IU/day | placebo | 5 months | ①②③④⑤⑥⑦ |
| Nimitphong et al. [27] | 2015 | Thailand | Prediabetes | 29/18 | I: 61.8 ± 9.7 C: 57.9 ± 13.3 | VD2 20,000 IU/week or VD3 15,000 IU/week | nothing | 3 months | ①②③④⑤⑥ |
| Forouhi et al. [28] | 2016 | UK | Prediabetes | 210/111 | NA | VD2 100,000 IU/month or VD3 100,000 IU/month | placebo | 4 months | ①④ |
| Jorde et al. [29] | 2016 | Norway | Prediabetes | 116/111 | NA | VD3 20,000 IU/week | placebo | 5 years | ①②③④⑤⑦ |
| Wagner et al. [30] | 2016 | Sweden | Prediabetes | 21/22 | I:66.52 ± 4.29 C: 66.71 ± 3.01 | VD3 30,000 IU/week | placebo | 8 weeks | ①②③④ |
| Moreira-Lucas et al. [31] | 2017 | Canada | IFG | 35/36 | I: 49.1 ± 13.9 C: 45.6 ± 14.3 | VD3 28,000 IU/week | placebo | 24 weeks | ①②③④⑥⑦ |
| Zarrin et al. [32] | 2017 | Iran | Prediabetes | 51/53 | I: 48.11 ± 7.6 C: 48.43 ± 7.7 | VD3 1000 IU/day | placebo | 3 months | ①②④⑤⑦ |
| Niroomand et al. [33] | 2019 | Iran | Prediabetes | 43/40 | NA | VD3 50,000 IU/week for 3 months and then 50,000 IU/month | placebo | 6 months | ①②③⑤⑦ |
| Thani et al. [34] | 2019 | Qatar | Prediabetes | 57/75 | I: 45.51 ± 8.96 C: 44.89 ± 8.88 | VD3 30,000 IU/week | placebo | 6 months | ①②③④⑤⑥⑦ |
| Wallace et al. [35] | 2019 | UK | Prediabetes | 35/31 | I: 52.4 ± 2.0 C: 54.0 ± 1.7 | VD3 3000 IU/day | placebo | 26 weeks | ①②③④⑤⑥⑦ |
| Lu et al. [36] | 2019 | China | Prediabetes | 64/65 | I: 59.29 ± 6.07 C: 59.41 ± 9.10 | VD 400 IU/day | nothing | 1 year | ①②③⑤⑥ |
| Ahmed et al. [37] | 2020 | India | Prediabetes | 52/49 | I: 41.1 ± 8 C: 41.6 ± 7 | VD3 60,000 IU/week | placebo | 12 weeks | ①②③④⑤⑦ |
| Ansari et al. [38] | 2020 | Italy | Prediabetes | 146/57 | NA | VD3 50,000 IU/week for 2 months, then twice a month for the next 2 months, followed by 1000 IU/day for the last 2 months | nothing | 6 months | ② |
| Bhatt et al. [39] | 2020 | India | Prediabetes | 61/60 | NA | VD3 60,000 IU/week + CaCO3 1 gm/day | placebo + CaCO3 1 gm/day | 78 weeks | ①②③⑤⑦ |
| Rajabi-Naeeni et al. [40] | 2020 | Iran | Prediabetes | 84/84 | I: 39.46 ± 6.91 C: 40.82 ± 7.19 | VD3 60,000 IU/2 weeks + omega-3 1000 mg twice/day or not | omega-3 1000 mg twice/day or omega-3 placebo + VD3 placebo | 8 weeks | ①②⑤⑥⑦ |
| Subgroup | BMI | FBG | 2h-PG | HbA1c | |||||||||||
|---|---|---|---|---|---|---|---|---|---|---|---|---|---|---|---|
| n | SMD (95%CI) | p | n | SMD (95%CI) | p | n | SMD (95%CI) | p | n | SMD (95%CI) | p | ||||
| Continent | |||||||||||||||
| Asia | 11 | 0.06 (−0.38, 0.49) | 0.796 | 12 | −0.43 (−0.77, −0.10) | 0.012 | 8 | −0.25 (−0.45, −0.04) | 0.019 | 7 | −0.30 (−0.45, −0.14) | 0.007 | |||
| Europe | 9 | 0.04 (−0.28, 0.35) | 0.814 | 7 | −0.14 (−0.26, −0.02) | 0.020 | 6 | 0.13 (−0.09, 0.35) | 0.252 | 8 | −0.04 (−0.15, 0.07) | 0.478 | |||
| America | 3 | −0.25 (−0.59, 0.09) | 0.146 | 6 | −0.59 (−1.26, 0.08) | 0.083 | 4 | −0.06 (−0.27, 0.15) | 0.577 | 5 | −0.20 (−0.37, −0.03) | 0.020 | |||
| VD supplementation | |||||||||||||||
| VD vs. placebo | 13 | −0.09 (−0.28, 0.09) | 0.317 | 11 | −0.16 (−0.26, −0.06) | 0.002 | 10 | −0.04 (−0.19, 0.11) | 0.618 | 13 | −0.10 (−0.19, −0.01) | 0.035 | |||
| VD + Ca/omage-3 vs. Ca/omage-3 | 6 | −0.07 (−0.64, 0.50) | 0.809 | 7 | −0.23 (−0.5, 0.04) | 0.098 | 5 | −0.05 (−0.32, 0.23) | 0.744 | 5 | −0.19 (−0.39, 0.01) | 0.069 | |||
| VD + Ca vs. placebo | 1 | −0.59 (−1.00, −0.17) | 0.006 | 2 | −1.59 (−4.67, 1.49) | 0.312 | — | — | — | — | — | — | |||
| VD vs. nothing | 3 | 0.81 (−0.27, 1.90) | 0.142 | 5 | −0.71 (−1.48, 0.06) | 0.069 | 3 | −0.22 (−0.77, 0.32) | 0.420 | 2 | −0.60 (−0.93, −0.27) | <0.001 | |||
| Duration | |||||||||||||||
| ≥1 year | 13 | 0.10 (−0.25, 0.45) | 0.571 | 15 | −0.51 (−0.85, −0.18) | 0.003 | 11 | −0.11 (−0.28, 0.06) | 0.208 | 13 | −0.19 (−0.29, −0.09) | <0.001 | |||
| <1 year | 10 | −0.12 (−0.40, 0.17) | 0.420 | 10 | −0.16 (−0.28, −0.04) | 0.010 | 7 | −0.02 (−0.28, 0.24) | 0.882 | 7 | −0.06 (−0.19, 0.07) | 0.348 | |||
| Baseline 25 (OH)D | |||||||||||||||
| <50 nmol/L | 12 | 0.00 (−0.35, 0.36) | 0.980 | 13 | −0.36 (−0.66, −0.07) | 0.017 | 10 | −0.23 (−0.39, −0.06) | 0.007 | 10 | −0.22 (−0.34, −0.09) | 0.001 | |||
| ≥50 nmol/L | 10 | −0.16 (−0.36, 0.04) | 0.120 | 10 | −0.41 (−0.81, −0.01) | 0.044 | 7 | 0.13 (−0.07, 0.33) | 0.213 | 10 | −0.09 (−0.19, 0.01) | 0.089 | |||
| Type | |||||||||||||||
| 1 | — | — | — | — | — | — | — | — | — | — | — | — | |||
| 2 | — | — | — | — | — | — | — | — | — | — | — | — | |||
| Biospecimen | |||||||||||||||
| Serum | — | — | — | 5 | −0.42 (−0.67, −0.16) | 0.002 | 3 | −0.01 (−0.15, 0.12) | 0.849 | — | — | — | |||
| Plasma | — | — | — | 15 | −0.43 (−0.85, −0.01) | 0.044 | 13 | −0.06 (−0.27, 0.15) | 0.598 | — | — | — | |||
| Unclear | — | — | — | 5 | −0.14 (−0.28, −0.01) | 0.038 | 2 | −0.20 (−0.47, 0.06) | 0.128 | — | — | — | |||
| Subgroup | HOMA-IR | HOMA-B | FINS | ||||||||||||
| n | SMD (95%CI) | p | n | SMD (95%CI) | p | n | SMD (95%CI) | p | |||||||
| Continent | |||||||||||||||
| Asia | 11 | 0.08 (−0.55, 0.72) | 0.799 | 6 | 0.22 (−0.23, 0.67) | 0.347 | 7 | −0.28 (−0.43,−0.14) | <0.001 | ||||||
| Europe | 6 | −0.17 (−0.55, 0.20) | 0.361 | 2 | 0.20 (−0.16, 0.55) | 0.278 | 5 | −0.22 (−0.35, −0.09) | 0.001 | ||||||
| America | 4 | −0.75 (−1.84, 0.33) | 0.172 | 2 | 0.20 (−0.09, 0.50) | 0.175 | 3 | 0.05 (−0.13, 0.22) | 0.584 | ||||||
| VD supplementation | |||||||||||||||
| VD vs. placebo | 9 | −0.23 (−0.46, 0.00) | 0.054 | 5 | 0.05 (−0.24, 0.34) | 0.718 | 9 | −0.23 (−0.34, −0.13) | <0.001 | ||||||
| VD + Ca/omage-3 vs. Ca/omage-3 | 7 | 0.60 (−0.28, 1.49) | 0.181 | 3 | 0.39 (−0.32, 1.10) | 0.286 | 4 | −0.16 (−0.35, 0.03) | 0.093 | ||||||
| VD + Ca vs. placebo | 2 | −1.62 (−4.94, 1.69) | 0.337 | — | — | — | 1 | 0.06 (−0.15, 0.27) | 0.564 | ||||||
| VD vs. nothing | 3 | −0.75 (−1.67, 0.17) | 0.110 | 2 | 0.31 (−0.57, 1.18) | 0.492 | 1 | −0.52 (−1.08, 0.04) | 0.069 | ||||||
| Duration | |||||||||||||||
| ≥1 year | 13 | −0.44 (−0.81, −0.06) | 0.023 | 7 | 0.34 (0.01, 0.66) | 0.041 | 8 | −0.16 (−0.26, −0.05) | 0.004 | ||||||
| <1 year | 8 | 0.35 (−0.42, 1.12) | 0.374 | 3 | −0.23 (−0.49, 0.03) | 0.084 | 7 | −0.22 (−0.36, −0.08) | 0.003 | ||||||
| Baseline 25 (OH)D | |||||||||||||||
| <50 nmol/L | 10 | 0.29 (−0.31, 0.89) | 0.346 | 4 | −0.06 (−0.34, 0.23) | 0.688 | 9 | −0.19 (−0.33, −0.05) | 0.008 | ||||||
| ≥50 nmol/L | 9 | −0.50 (−0.96, −0.03) | 0.035 | 5 | 0.27 (−0.16, 0.71) | 0.214 | 5 | −0.25 (−0.38, −0.13) | <0.001 | ||||||
| Type | |||||||||||||||
| 1 | 18 | −0.16 (−0.56, 0.24) | 0.441 | 6 | 0.35 (−0.08, 0.78) | 0.109 | — | — | — | ||||||
| 2 | 3 | −0.13 (−0.41, 0.14) | 0.335 | 4 | −0.03 (−0.27, 0.20) | 0.795 | — | — | — | ||||||
| Biospecimen | |||||||||||||||
| Serum | — | — | — | — | — | — | 12 | −0.23 (−0.33, −0.13) | <0.001 | ||||||
| Plasma | — | — | — | — | — | — | 2 | −0.19 (−0.47, 0.10) | 0.205 | ||||||
| Unclear | — | — | — | — | — | — | 1 | 0.06 (−0.15, 0.27) | 0.564 | ||||||
Publisher’s Note: MDPI stays neutral with regard to jurisdictional claims in published maps and institutional affiliations. |
© 2021 by the authors. Licensee MDPI, Basel, Switzerland. This article is an open access article distributed under the terms and conditions of the Creative Commons Attribution (CC BY) license (https://creativecommons.org/licenses/by/4.0/).
Share and Cite
Zhang, Y.; Xue, Y.; Zhang, D.; Liu, Y.; Xu, Z.; Gao, J.; Li, W.; Li, X. Effect of Vitamin D Supplementation on Glycemic Control in Prediabetes: A Meta-Analysis. Nutrients 2021, 13, 4464. https://doi.org/10.3390/nu13124464
Zhang Y, Xue Y, Zhang D, Liu Y, Xu Z, Gao J, Li W, Li X. Effect of Vitamin D Supplementation on Glycemic Control in Prediabetes: A Meta-Analysis. Nutrients. 2021; 13(12):4464. https://doi.org/10.3390/nu13124464
Chicago/Turabian StyleZhang, Yujing, Yuan Xue, Dongdong Zhang, Yaping Liu, Ze Xu, Jiaojiao Gao, Wenjie Li, and Xing Li. 2021. "Effect of Vitamin D Supplementation on Glycemic Control in Prediabetes: A Meta-Analysis" Nutrients 13, no. 12: 4464. https://doi.org/10.3390/nu13124464
APA StyleZhang, Y., Xue, Y., Zhang, D., Liu, Y., Xu, Z., Gao, J., Li, W., & Li, X. (2021). Effect of Vitamin D Supplementation on Glycemic Control in Prediabetes: A Meta-Analysis. Nutrients, 13(12), 4464. https://doi.org/10.3390/nu13124464