
Effects of Different Allotments of Avocados on the Nutritional Status of Families: A Cluster Randomized Controlled Trial

 , ,
, ,
Abstract
1. Introduction
2. Materials and Methods
2.1. Study Design and Population
2.2. Setting, Recruitment, Consent, and Randomization
2.3. Intervention
2.4. Measurements
2.5. Outcomes
2.6. Intervention Adherence
2.7. Statistical Analyses
3. Results
4. Discussion
5. Conclusions
Supplementary Materials
Author Contributions
Funding
Institutional Review Board Statement
Informed Consent Statement
Data Availability Statement
Acknowledgments
Conflicts of Interest
Correction Statement
References
- Estruch, R.; Ros, E.; Salas-Salvadó, J.; Covas, M.-I.; Corella, D.; Arós, F.; Gómez-Gracia, E.; Ruiz-Gutiérrez, V.; Fiol, M.; Lapetra, J.; et al. Primary Prevention of Cardiovascular Disease with a Mediterranean Diet. N. Engl. J. Med. 2013, 368, 1279–1290. [Google Scholar] [CrossRef] [PubMed]
- Salas-Salvadó, J.; Bulló, M.; Babio, N.; Martínez-González, M.Á.; Ibarrola-Jurado, N.; Basora, J.; Estruch, R.; Covas, M.I.; Corella, D.; Arós, F.; et al. Reduction in the incidence of type 2 diabetes with the mediterranean diet: Results of the PREDIMED-Reus nutrition intervention randomized trial. Diabetes Care 2011, 34, 14–19. [Google Scholar] [CrossRef] [PubMed]
- The DASH Diet. Dietary Approaches to Stop Hypertension. Lippincotts Prim. Care Pract. 1998, 2, 536–538. [Google Scholar]
- Hinderliter, A.L.; Babyak, M.A.; Sherwood, A.; Blumenthal, J.A. The DASH diet and insulin sensitivity. Curr. Hypertens. Rep. 2011, 13, 67–73. [Google Scholar] [CrossRef]
- Huang, T.; Yang, B.; Zheng, J.; Li, G.; Wahlqvist, M.L.; Li, D. Cardiovascular Disease Mortality and Cancer Incidence in Vegetarians: A Meta-Analysis and Systematic Review. Ann. Nutr. Metab. 2012, 60, 233–240. [Google Scholar] [CrossRef]
- Aune, D.; Giovannucci, E.; Boffetta, P.; Fadnes, L.T.; Keum, N.N.; Norat, T.; Greenwood, D.C.; Riboli, E.; Vatten, L.J.; Tonstad, S. Fruit and vegetable intake and the risk of cardiovascular disease, total cancer and all-cause mortality-A systematic review and dose-response meta-analysis of prospective studies. Int. J. Epidemiol. 2017, 46, 1029–1056. [Google Scholar] [CrossRef]
- U.S. Department of Health and Human Services; U.S. Department of Agriculture. 2015–2020 Dietary Guidelines for Americans. Available online: http://health.gov/dietaryguidelines/2015/guidelines/ (accessed on 7 February 2019).
- U.S. Department of Agriculture and Agricultural Research Service. Average Intakes by Age-Sex Group, Healthy U.S.-Style Food Patterns, Which Vary Ased on Age, Sex, and Activity Level, for Recommended Intakes and Limits. What We Eat in America, NHANES 2007–2010. 2010. Available online: https://www.ars.usda.gov/ARSUserFiles/80400530/pdf/0910/Table_1_NIN_GEN_09.pdf (accessed on 21 April 2021).
- Hales, C.M.; Carroll, M.D.; Fryar, C.D.; Ogden, C.L. Prevalence of Obesity among Adults and Youth: United States, 2015–2016 Key Findings Data; National Health and Nutrition Examination Survey: Hyattsville, MD, USA, 2017. Available online: https://www.cdc.gov/nchs/data/databriefs/db288_table.pdf#1 (accessed on 22 January 2020).
- U.S. Department of Agriculture ARS. Nutrient Intakes from Food and Beverages: Mean Amounts Consumed per Individual, by Race/Ethnicity and Age, What We Eat in America, NHANES 2017–2018. 2020. Available online: https://www.ars.usda.gov/ARSUserFiles/80400530/pdf/1718/Table_2_NIN_RAC_17.pdf (accessed on 20 April 2021).
- Dixon, L.B. Differences in Energy, Nutrient, and Food Intakes in a US Sample of Mexican-American Women and Men: Findings from the Third National Health and Nutrition Examination Survey, 1988–1994. Am. J. Epidemiol. 2000, 152, 548–557. [Google Scholar] [CrossRef]
- U.S. Census Bureau. Profile America Facts for Features: 2018 Hispanic Heritage Month; Washington, DC, USA, 2018. Available online: https://www.census.gov/content/dam/Census/newsroom/facts-for-features/2018/hispanic-heritage-fff.pdf (accessed on 21 April 2021).
- Dreher, M.L.; Davenport, A.J. Hass avocado composition and potential health effects. Crit. Rev. Food Sci. Nutr. 2013, 53, 738–750. [Google Scholar] [CrossRef]
- Carranza-Madrigal, J.; Herrera-Abarca, J.E.; Alvizouri-Munoz, M.; Alvarado-Jimenez, M.R.; Chavez-Carbajal, F. Effects of a vegetarian diet vs. a vegetarian diet enriched with avocado in hypercholesterolemic patients. Arch. Med. Res. 1997, 28, 537–541. [Google Scholar]
- Lerman-Garber, I.; Ichazo-Cerro, S.; Zamora-González, J.; Cardoso-Saldaña, G.; Posadas-Romero, C. Effect of a high-monounsaturated fat diet enriched with avocado in NIDDM patients. Diabetes Care 1994, 17, 311–315. [Google Scholar] [CrossRef]
- Colquhoun, D.M.; Moores, D.; Somerset, S.M.; Humphries, J.A. Comparison of the effects on lipoproteins and apolipoproteins of a diet high in monounsaturated fatty acids, enriched with avocado, and a high-carbohydrate diet. Am. J. Clin. Nutr. 1992, 56, 671–677. [Google Scholar] [CrossRef] [PubMed]
- Alvizouri-Munoz, M.; Carranza-Madrigal, J.; Herrera-Abarca, J.E.; Chavez-Carbajal, F.; Amezcua-Gastelum, J.L. Effects of avocado as a source of monounsaturated fatty acids on plasma lipid levels. Arch. Med. Res. 1992, 23, 163–167. [Google Scholar] [PubMed]
- Wang, L.; Bordi, P.L.; Fleming, J.A.; Hill, A.M.; Kris-Etherton, P.M. Effect of a moderate fat diet with and without avocados on lipoprotein particle number, size and subclasses in overweight and obese adults: A randomized, controlled trial. J. Am. Heart Assoc. 2015, 4, e001355. [Google Scholar] [CrossRef] [PubMed]
- Centers for Disease Control and Prevention (CDC). Vital Signs: Leading Causes of Death, Prevalence of Diseases and Risk Factors, and Use of Health Services Among Hispanics in the United States—2009–2013. MMWR Morb. Mortal. Wkly. Rep. 2015, 64, 469–478. [Google Scholar]
- Rodriguez, C.J.; Allison, M.; Daviglus, M.L.; Isasi, C.R.; Keller, C.; Leira, E.C.; Palaniappan, L.; Piña, I.L.; Ramirez, S.M.; Rodriguez, B.; et al. Status of Cardiovascular Disease and Stroke in Hispanics/Latinos in the United States. A Science Advisory from the American Heart Association. Circulation 2014, 130, 593–625. [Google Scholar] [CrossRef] [PubMed]
- World Health Organization. Global Physical Activity Questionnaire (GPAQ). Available online: http://www.who.int/chp/steps/GPAQ/en/index.html (accessed on 20 July 2019).
- WHO Expert Committee on Physical Status. Physical status: The use and interpretation of anthropometry. Report of a WHO Expert Committee. World Health Organ. Tech. Rep. Ser. 1995, 854, 1–452. [Google Scholar]
- Kristal, A.R.; Kolar, A.S.; Fisher, J.L.; Plascak, J.J.; Stumbo, P.J.; Weiss, R.; Paskett, E.D. Evaluation of web-based, self-administered, graphical food frequency questionnaire. J. Acad. Nutr. Diet. 2014, 114, 613–621. [Google Scholar] [CrossRef] [PubMed]
- Viocare, I. VioScreen—VIOCARE®. Available online: https://www.viocare.com/vioscreen.html (accessed on 20 July 2019).
- Deierlein, A.L.; Bihuniak, J.D.; Nagi, E.; Litvak, J.; Victoria, C.; Braune, T.; Weiss, R.; Parekh, N. Development of a technology-assisted food frequency questionnaire for elementary and middle school children: Findings from a pilot study. Nutrients 2019, 11, 1103. [Google Scholar] [CrossRef] [PubMed]
- National Cancer Institute. HEI Scoring Algorithm. Available online: https://epi.grants.cancer.gov/hei/hei-scoring-method.html (accessed on 29 October 2020).
- Heiss, G.; Snyder, M.L.; Teng, Y.; Schneiderman, N.; Llabre, M.M.; Cowie, C.; Carnethon, M.; Kaplan, R.; Giachello, A.; Gallo, L.C.; et al. Prevalence of metabolic syndrome among Hispanics/Latinos of diverse background: The Hispanic Community Health Study/Study of Latinos. Diabetes Care 2014, 37, 2391–2399. [Google Scholar] [CrossRef] [PubMed]
- Wien, M.; Haddad, E.; Oda, K.; Sabaté, J. A randomized 3×3 crossover study to evaluate the effect of Hass avocado intake on post-ingestive satiety, glucose and insulin levels, and subsequent energy intake in overweight adults. Nutr. J. 2013, 12, 155. [Google Scholar] [CrossRef] [PubMed]
- Burton-Freeman, B. Dietary Fiber and Energy Regulation. J. Nutr. 2000, 130, 272S–275S. [Google Scholar] [CrossRef]
- Gentilcore, D.; Chaikomin, R.; Jones, K.; Russo, A.; Feinle-Bisset, C.; Wishart, J.M.; Rayner, C.K.; Horowitz, M. Effects of fat on gastric emptying of and the glycemic, insulin, and incretin responses to a carbohydrate meal in type 2 diabetes. J. Clin. Endocrinol. Metab. 2006, 91, 2062–2067. [Google Scholar] [CrossRef]
- Maljaars, J.; Romeyn, E.A.; Haddeman, E.; Peters, H.P.; Masclee, A.A. Effect of fat saturation on satiety, hormone release, and food intake. Am. J. Clin. Nutr. 2009, 89, 1019–1024. [Google Scholar] [CrossRef]
- Zhu, L.; Huang, Y.; Edirisinghe, I.; Park, E.; Burton-Freeman, B. Using the avocado to test the satiety effects of a fat-fiber combination in place of carbohydrate energy in a breakfast meal in overweight and obese men and women: A randomized clinical trial. Nutrients 2019, 11, 952. [Google Scholar] [CrossRef] [PubMed]
- Siega-Riz, A.M.; Sotres-Alvarez, D.; Ayala, G.X.; Ginsberg, M.; Himes, J.H.; Liu, K.; Loria, C.M.; Mossavar-Rahmani, Y.; Rock, C.L.; Rodriguez, B.; et al. Food-group and nutrient-density intakes by Hispanic and Latino backgrounds in the Hispanic Community Health Study/Study of Latinos. Am. J. Clin. Nutr. 2014, 99, 1487–1498. [Google Scholar] [CrossRef] [PubMed]
- Fulgoni Iii, V.L.; Dreher, M.; Davenport, A.J. Avocado consumption is associated with better diet quality and nutrient intake, and lower metabolic syndrome risk in US adults: Results from the National Health and Nutrition Examination Survey (NHANES) 2001–2008. Nutr. J. 2013, 12, 1. Available online: http://www.nutritionj.com/content/12/1/1 (accessed on 7 March 2017). [CrossRef] [PubMed]
- Heskey, C.; Oda, K.; Sabaté, J. Avocado intake, and longitudinal weight and body mass index changes in an adult cohort. Nutrients 2019, 11, 691. [Google Scholar] [CrossRef]
- Peou, S.; Milliard-Hasting, B.; Shah, S.A. Impact of avocado-enriched diets on plasma lipoproteins: A meta-analysis. J. Clin. Lipidol. 2016, 10, 161–171. [Google Scholar] [CrossRef]
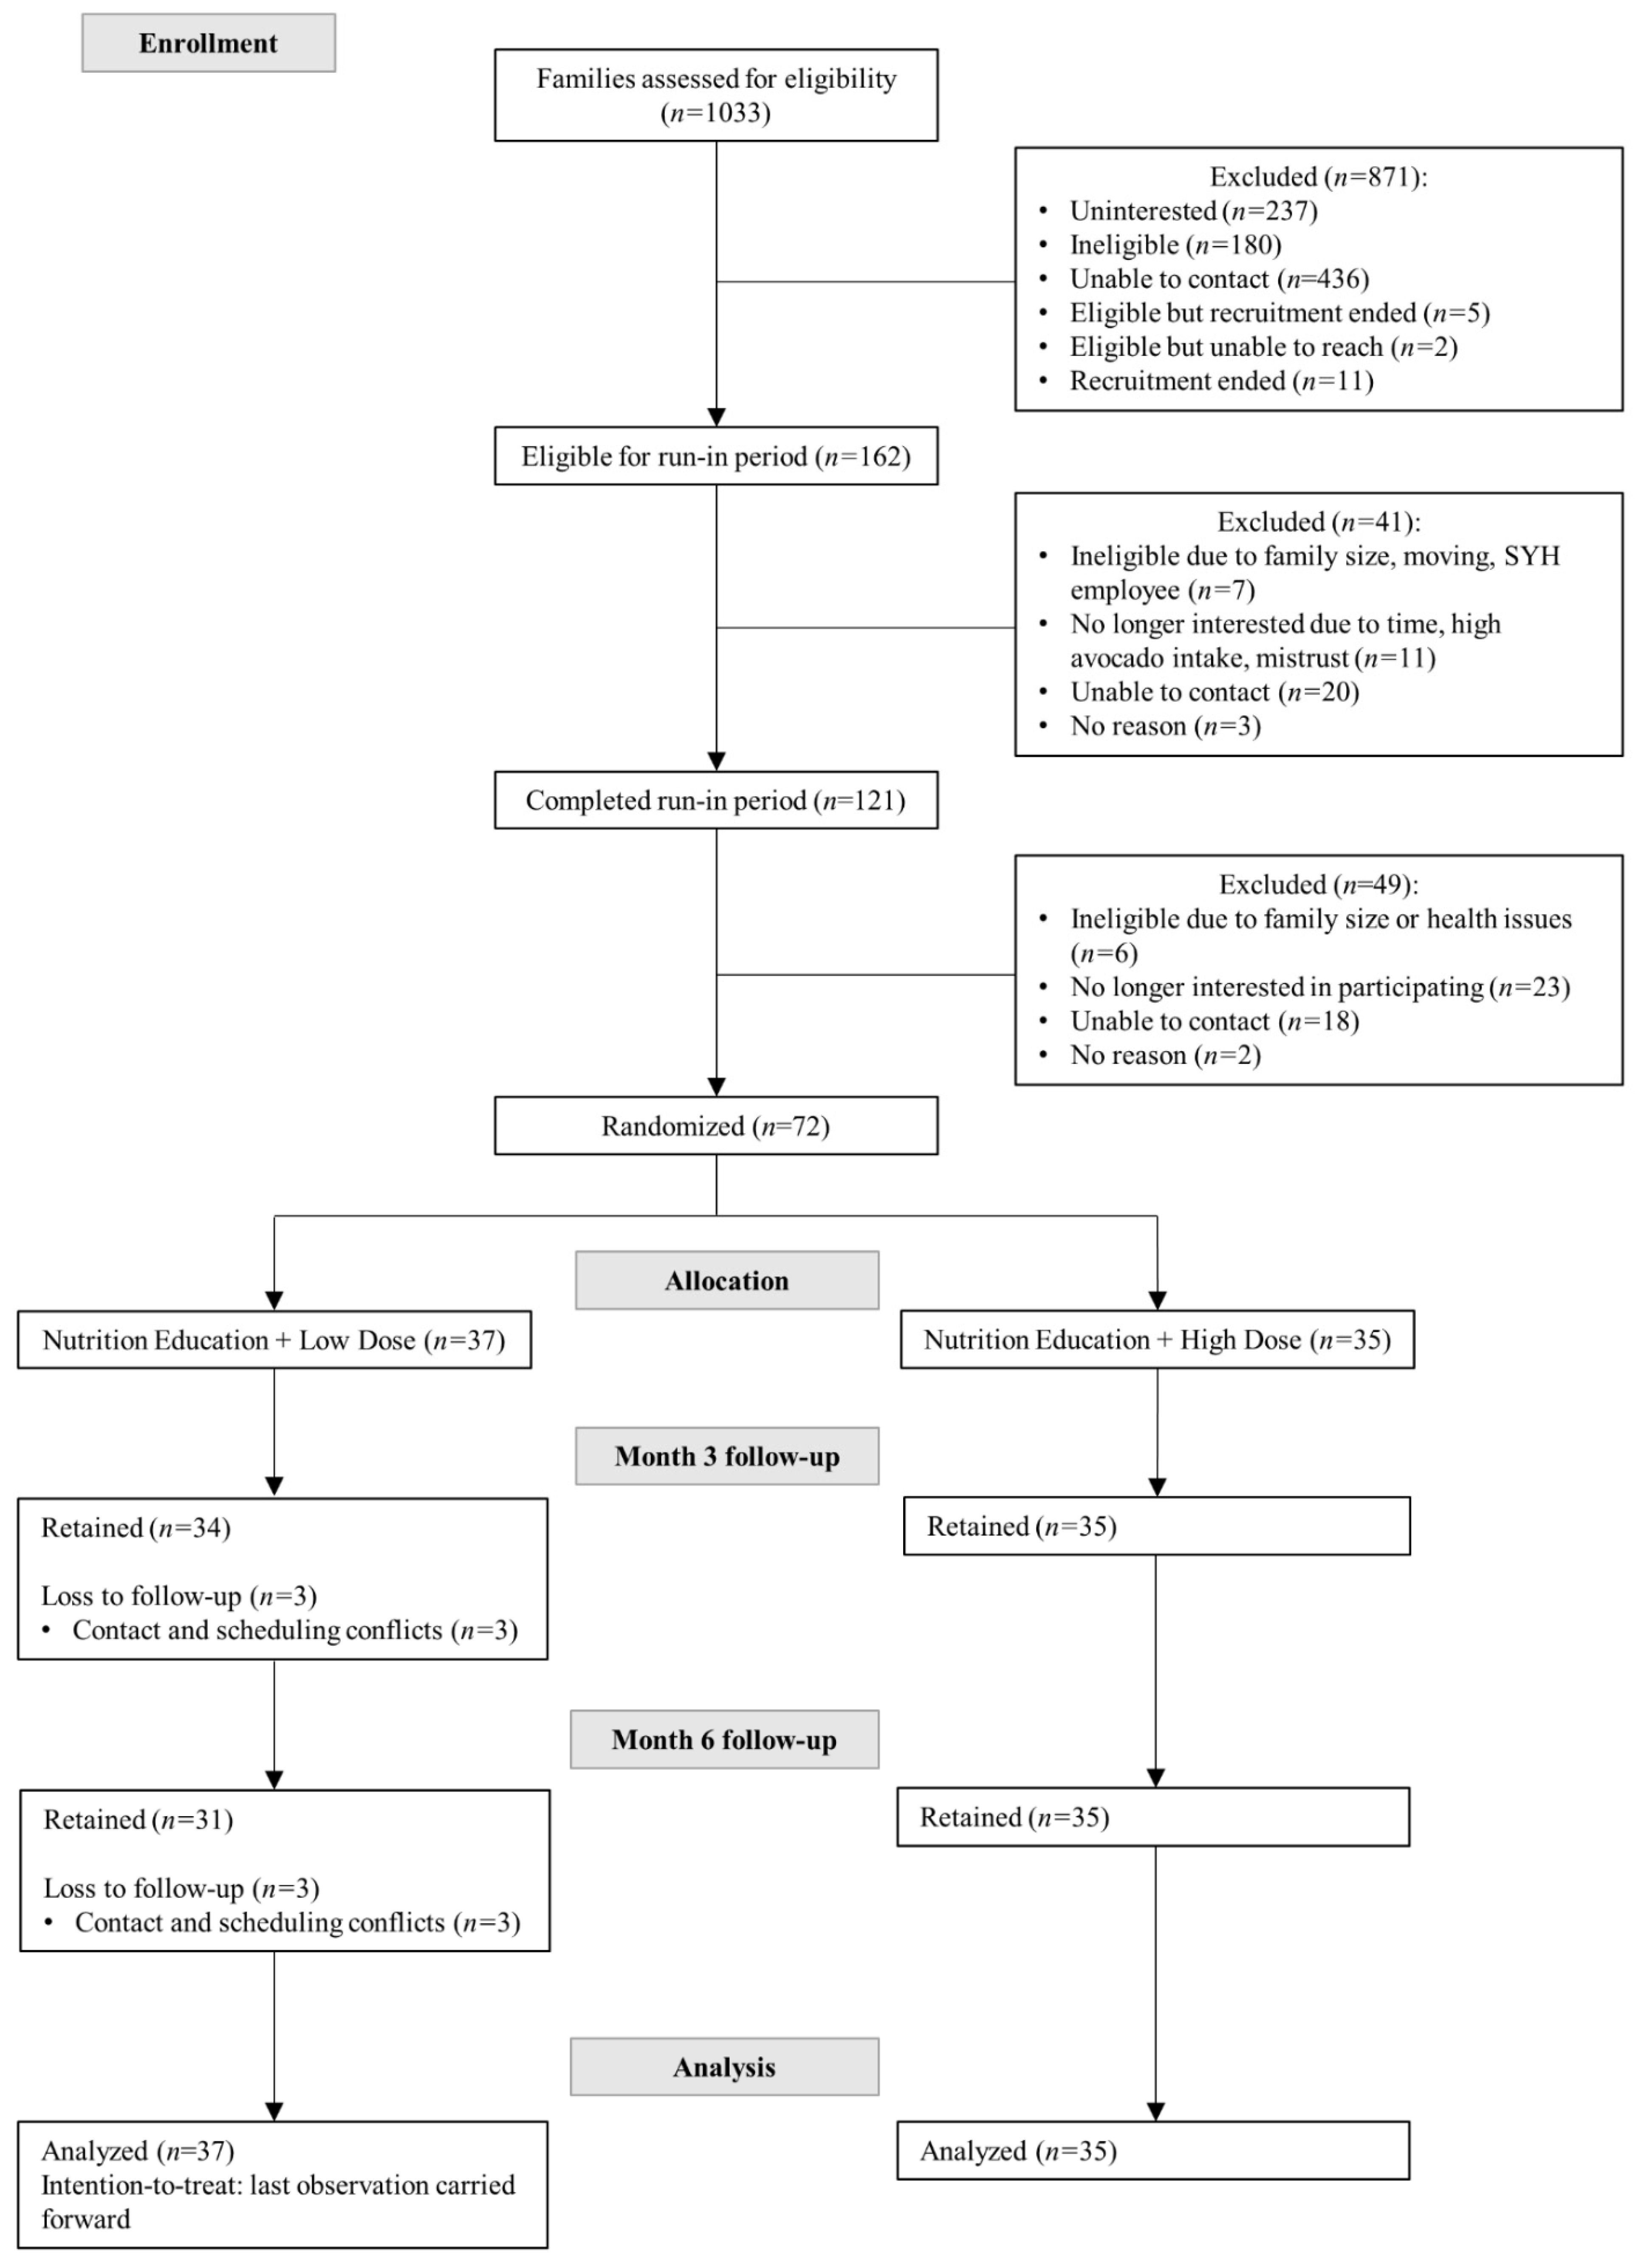

| Characteristic | Low Avocado Allotment (n = 37 Families) | High Avocado Allotment (n = 35 Families) | ||
|---|---|---|---|---|
| Family | ||||
| Total number of participants | 118 | 113 | ||
| N | % | N | % | |
| Female | ||||
| Head of household 1 | 36 | 97.3 | 35 | 100 |
| Non-head of household adult 2 | 13 | 35.1 | 15 | 46.9 |
| Adolescent 3 | 9 | 69.2 | 13 | 72.2 |
| Child 4 | 12 | 40.0 | 17 | 60.7 |
| Family income in US less than $30,000 dollars/year | 15 | 40.5 | 19 | 54.3 |
| Mean | SD | Mean | SD | |
| Average family size | 3 | 0.5 | 3 | 0.5 |
| Age, years | ||||
| Head of household | 46.5 | 11.3 | 44.5 | 8.4 |
| Non-head of household adult | 44.4 | 19.5 | 38.0 | 18.3 |
| Adolescent | 16.0 | 1.0 | 15.6 | 1.4 |
| Child | 9.0 | 2.1 | 9.4 | 2.2 |
| Head of household | ||||
| Mean | SD | Mean | SD | |
| Years lived in the United States | 16.5 | 12.6 | 17.7 | 12.9 |
| N | % | N | % | |
| Country of birth, Mexico | 32 | 86.5 | 28 | 80.0 |
| Heritage, Mexican | 36 | 97.3 | 34 | 97.1 |
| Marital status | ||||
| Married or cohabitation | 27 | 73.0 | 25 | 71.5 |
| Separated, divorced, or widowed | 7 | 18.9 | 7 | 20.1 |
| Single | 3 | 8.1 | 3 | 8.6 |
| Highest level of education achieved | ||||
| High school | 9 | 24.3 | 10 | 28.6 |
| Trade school or Associate’s degree | 9 | 24.3 | 11 | 31.4 |
| Bachelor’s degree or above | 8 | 21.6 | 8 | 22.9 |
| No diploma | 4 | 10.8 | 3 | 8.6 |
| Other | 7 | 18.9 | 3 | 8.6 |
| Country where highest level of education was completed | ||||
| United States or other | 11 | 29.7 | 16 | 45.8 |
| Mexico | 26 | 70.3 | 19 | 54.3 |
| Employment status | ||||
| Employed for wages | 9 | 24.3 | 10 | 28.6 |
| Self-employed | 4 | 10.8 | 3 | 8.6 |
| Homemaker | 18 | 48.7 | 14 | 40.0 |
| Other | 6 | 16.2 | 8 | 22.9 |
| Family dietary intake | ||||
| Nutrients | ||||
| Total energy intake, kcal | 6574.4 | 2287.9 | 7321.5 | 4406.0 |
| Carbohydrate, % total energy | 51.8 | 3.9 | 51.2 | 5.6 |
| Protein, % total energy | 16.0 | 1.7 | 16.5 | 2.4 |
| Fat, % total energy | 33.8 | 3.4 | 33.3 | 4.6 |
| Carbohydrate, g | 851.2 | 302.3 | 947.2 | 599.8 |
| Dietary fiber, g | 82.0 | 28.9 | 89.8 | 49.0 |
| Protein, g | 260.8 | 90.3 | 295.5 | 170.1 |
| Animal origin, g | 158.6 | 65.1 | 176.6 | 112.6 |
| Vegetable origin, g | 102.2 | 33.4 | 118.9 | 76.7 |
| Fat, g | 247.9 | 92.0 | 268.7 | 162.9 |
| Saturated fat, g | 80.4 | 32.7 | 84.1 | 55.2 |
| Monounsaturated fat, g | 94.9 | 36.1 | 103.3 | 62.9 |
| Polyunsaturated fat, g | 52.5 | 19.2 | 59.4 | 34.9 |
| Calcium, mg | 3781.6 | 1202.0 | 4116.5 | 2577.1 |
| Magnesium, mg | 1137.5 | 367.9 | 1281.9 | 683.1 |
| Sodium, mg | 13,017.5 | 5502.9 | 13,793.6 | 8245.0 |
| Potassium, mg | 10,159.2 | 3346.3 | 11,374.3 | 6104.7 |
| Iron, mg | 51.1 | 16.6 | 61.7 | 39.3 |
| Vitamin C, mg | 446.9 | 158.7 | 514.4 | 318.3 |
| Vitamin D, mcg | 23.3 | 9.0 | 25.5 | 18.1 |
| Vitamin E, IU | 53.9 | 21.3 | 60.9 | 41.5 |
| Folate, mcg | 858.1 | 288.4 | 967.6 | 551.1 |
| HEI 2015 score, average range 0–300 (~3 members per household) | 208.5 | 31.4 | 216.1 | 44.8 |
| Head of household | 70.9 | 8.7 | 71.0 | 6.7 |
| Non-Head of Household | 64.1 | 9.1 | 64.0 | 9.5 |
| Adolescents | 59.1 | 9.8 | 66.6 | 12.1 |
| Children | 63.1 | 9.4 | 65.5 | 11.5 |
| Food Groups | ||||
| Fruit, cup equivalents | 5.13 | 2.44 | 5.24 | 3.07 |
| Vegetables, cup equivalents | 5.41 | 2.32 | 6.38 | 3.87 |
| Greens, cup equivalents | 3.84 | 1.74 | 4.50 | 2.71 |
| Legumes, cup equivalents | 0.81 | 0.61 | 0.83 | 0.62 |
| Dairy, cup equivalents | 6.51 | 2.93 | 6.73 | 4.98 |
| Nuts, ounce equivalents | 1.59 | 1.37 | 2.05 | 3.29 |
| Whole grains, ounce equivalents | 4.97 | 3.01 | 5.41 | 3.62 |
| Refined grains, ounce equivalents | 19.55 | 9.10 | 22.37 | 16.45 |
| Processed meat, ounce equivalents | 1.85 | 1.14 | 2.35 | 2.40 |
| Chicken and eggs, ounce equivalents | 5.48 | 2.86 | 6.09 | 3.98 |
| Fish, ounce equivalents | 2.57 | 2.10 | 2.77 | 2.61 |
| Beef, ounce equivalents | 3.04 | 2.65 | 3.61 | 3.50 |
| Sugar, teaspoon equivalents | 35.34 | 20.89 | 37.92 | 32.67 |
| Oils, g | 76.42 | 32.69 | 82.16 | 49.66 |
| Soymilk, cup equivalents | 0.15 | 0.47 | 0.29 | 0.92 |
| Soy, ounce equivalents | 0.87 | 1.68 | 1.51 | 3.77 |
| Characteristic | Low Avocado Allotment (n = 37 Families) | High Avocado Allotment (n = 35 Families) | ||
|---|---|---|---|---|
| Mean | SD | Mean | SD | |
| Body mass index, kg/m2 | ||||
| Head of household 1 | 30.6 | 6.1 | 30.5 | 6.2 |
| Non-head of household adult 2 | 31.7 | 6.2 | 28.6 | 6.9 |
| Waist-to-height ratio, cm | ||||
| Adolescent 3 | 0.5 | 0.1 | 0.5 | 0.1 |
| Child 4 | 0.5 | 0.1 | 0.5 | 0.1 |
| Waist circumference, cm | ||||
| Head of household | ||||
| Female | 93.2 | 13.4 | 95.0 | 12.7 |
| Non-Head of household adult | ||||
| Female | 102.7 | 15.2 | 84.3 | 14.1 |
| Male | 103.8 | 11.1 | 99.1 | 14.3 |
| Adolescent | ||||
| Female | 78.3 | 14.7 | 82.5 | 10.3 |
| Male | 73.4 | 13.3 | 81.5 | 14.7 |
| Child | ||||
| Female | 65.6 | 10.5 | 68.5 | 15.9 |
| Male | 66.2 | 13.4 | 67.5 | 7.8 |
| Systolic blood pressure, mmHg | ||||
| Head of household | 116.9 | 15.8 | 111.5 | 15.7 |
| Non-head of household adult | 122.6 | 16.0 | 122.4 | 21.2 |
| Adolescent | 108.9 | 8.2 | 109.7 | 8.2 |
| Child | 98.3 | 7.9 | 100.4 | 7.7 |
| Diastolic blood pressure, mmHg | ||||
| Head of household | 73.4 | 12.3 | 69.4 | 8.8 |
| Non-head of household adult | 71.8 | 10.3 | 73.2 | 9.3 |
| Adolescent | 62.7 | 9.8 | 65.9 | 6.3 |
| Child | 58.5 | 8.0 | 61.3 | 9.6 |
| MVPA, minutes/week | ||||
| Head of household | 593.9 | 672.9 | 582.9 | 649.8 |
| Non-head of household adult | 1200.4 | 1444.1 | 724.8 | 980.9 |
| Adolescent | 656.8 | 660.2 | 424.6 | 397.2 |
| Child | 240.2 | 304.1 | 428.8 | 625.3 |
| Free fatty acids, mg/dL | ||||
| Head of household | 0.5 | 0.2 | 0.4 | 0.2 |
| Non-head of household adult 5 | 0.5 | 0.2 | 0.4 | 0.2 |
| RBC magnesium, mg/dL | ||||
| Head of household 1 | 6.2 | 1.1 | 5.5 | 0.6 |
| Non-head of household adult 6 | 5.6 | 0.4 | 5.3 | 0.5 |
| Lipids, mg/dL | ||||
| Total cholesterol | ||||
| Head of household 1 | 189.2 | 40.8 | 188.7 | 32.9 |
| Non-head of household adult 5 | 185.5 | 39.5 | 180.3 | 33.0 |
| HDL cholesterol | ||||
| Head of household 1 | 52.7 | 15.0 | 49.9 | 10.8 |
| Non-head of household adult 5 | 44.8 | 11.9 | 51.8 | 15.6 |
| LDL cholesterol | ||||
| Head of household 1 | 111.4 | 37.4 | 112.1 | 27.1 |
| Non-head of household adult 7 | 112.3 | 38.4 | 105.9 | 33.2 |
| VLDL cholesterol | ||||
| Head of household 1 | 23.8 | 10.6 | 26. | 14.9 |
| Non-head of household adult 7 | 27.1 | 11.5 | 22.7 | 9.2 |
| Triglycerides | ||||
| Head of household 1 | 138.5 | 130.5 | 142.8 | 95.8 |
| Non-head of household adult 5 | 163.8 | 109.0 | 113.1 | 46.2 |
| Glucose, mg/dL 5 | ||||
| Head of household 1 | 102.3 | 38.3 | 103.5 | 30.4 |
| Non-head of household adult | 122.0 | 53.3 | 92.3 | 10.0 |
| Insulin, microIU/mL (uIU/mL) | ||||
| Head of household 1 | 14.2 | 8.9 | 17.2 | 16.9 |
| Non-head of household adult | 15.7 | 8.8 | 15.1 | 10.4 |
| HOMA-IR | ||||
| Head of household1 | 3.7 | 0.4 | 4.6 | 0.8 |
| Non-head of household adult | 5.1 | 0.8 | 3.4 | 0.6 |
| Hemoglobin A1c% 5 | ||||
| Head of household 1 | 5.9 | 1.2 | 5.7 | 1.0 |
| Non-head of household adult | 6.5 | 1.7 | 5.4 | 0.4 |
| C-reactive protein, mg/L | ||||
| Head of household 1 | 3.9 | 4.5 | 2.9 | 2.8 |
| Non-head of household adult 5 | 4.2 | 9.0 | 3.9 | 4.0 |
| Within-Group Differences | Between-Group Difference | p-Value 1 | |||||
|---|---|---|---|---|---|---|---|
| Low Avocado Allotment | High Avocado Allotment | ||||||
| (n = 37) | (n = 35) | ||||||
| Mean | (95% CI) | Mean | (95% CI) | Mean | (95% CI) | ||
| Total energy intake, kcal | |||||||
| Difference at 3 months | −372.9 | −918.0, 172.3 | −1650.1 | −2706.2, −593.9 | 1277.2 | 102.7, 2451.7 | 0.04 |
| Difference at 6 months | −259.0 | −958.0, 440.0 | −2143.1 | −3286.5, −999.8 | 1884.1 | 562.8, 3205.4 | 0.01 |
| Carbohydrate, g | |||||||
| Difference at 3 months | −90.6 | −166.9, −14.2 | −244.2 | −388.0, −100.4 | 153.6 | −3.8, 311.1 | 0.06 |
| Difference at 3 months 2 | −113.7 | −196.7, −30.7 | −219.7 | −305.0, −134.3 | 106.0 | −13.4, 225.4 | 0.08 |
| Difference at 6 months | −64.8 | −159.4, 29.7 | −285.1 | −431.9, −138.4 | 220.3 | 50.7, 389.9 | 0.01 |
| Difference at 6 months 2 | −91.0 | −176.9, −5.0 | −257.5 | −345.9, −169.1 | 166.6 | 42.9, 290.2 | 0.01 |
| Dietary fiber, g | |||||||
| Difference at 3 months | −8.5 | −15.2, −1.7 | −6.8 | −17.9, 4.4 | −1.7 | −14.4, 11.0 | 0.79 |
| Difference at 3 months 2 | −10.1 | −17.3, −2.9 | −5.0 | −12.5, 2.4 | −5.1 | −15.5, 5.3 | 0.33 |
| Difference at 6 months | −5.1 | −14.2, 3.9 | −14.3 | −27.0, −1.6 | 9.2 | −6.0, 24.3 | 0.23 |
| Difference at 6 months 2 | −7.0 | −15.8, 1.7 | −12.3 | −21.3, 3.3 | 5.2 | −7.4, 17.9 | 0.41 |
| Protein, g | |||||||
| Difference at 3 months | −11.3 | −34.4, 11.8 | −59.4 | 102.2, −16.5 | 48.1 | 0.9, 95.2 | 0.05 |
| Difference at 3 months 2 | −17.3 | −44.4, 9.8 | −53.0 | −80.9, −25.1 | 35.7 | −3.4, 74.7 | 0.07 |
| Difference at 6 months | −1.2 | −32.6, 30.2 | −91.1 | −134.5, −47.7 | 89.9 | 37.8, 142.1 | 0.001 |
| Difference at 6 months 2 | −8.0 | −37.7, 21.8 | −83.9 | −114.6, −53.3 | −6.0 | −33.1, 118.8 | 0.001 |
| Animal origin, g | |||||||
| Difference at 3 months | −1.9 | −18.1, 14.3 | −36.1 | −65.8, −6.4 | 34.2 | 1.5, 67.0 | 0.04 |
| Difference at 3 months 2 | −5.5 | −25.5, 14.6 | −32.3 | −53.0, −11.7 | 26.8 | −2.0, −55.7 | 0.07 |
| Difference at 6 months | 5.0 | −15.9, 26.0 | −56.3 | −85.7, −26.8 | 61.3 | −26.1, 96.5 | 0.001 |
| Difference at 6 months 2 | 1.2 | −20.4, 22.9 | −52.3 | −74.6, −30.0 | 53.5 | 22.3, 84.7 | 0.001 |
| Vegetable origin, g | |||||||
| Difference at 3 months | −9.4 | −19.0, 0.2 | −23.3 | −40.3, −6.2 | 13.9 | −5.1, 32.8 | 0.15 |
| Difference at 3 months 2 | −11.9 | −22.7, −1.0 | −20.7 | −31.9, −9.5 | 8.8 | −6.8, 24.5 | 0.26 |
| Difference at 6 months | −6.2 | −18.8, 6.4 | −34.8 | −53.5, −16.2 | 28.6 | 6.8, 50.5 | 0.01 |
| Difference at 6 months 2 | −9.2 | −21.3, 2.9 | −31.7 | −44.1, −19.2 | 22.5 | 5.1, 39.9 | 0.01 |
| Fat, g | |||||||
| Difference at 3 months | −9.6 | −32.3, 13.0 | −44.0 | −84.4, −3.7 | 34.4 | −10.4, 79.2 | 0.13 |
| Difference at 3 months 2 | −16.0 | −40.4, 8.5 | −37.4 | −62.6, −12.2 | 21.5 | −13.7, 56.7 | 0.23 |
| Difference at 6 months | −7.7 | −34.2, 18.8 | −66.0 | −113.7, −18.3 | 58.3 | 5.5, 111.1 | 0.03 |
| Difference at 6 months 2 | −15.3 | −43.6, 13.0 | −58.0 | −87.1, −28.9 | 42.7 | 1.9, 83.4 | 0.04 |
| MUFA, g | |||||||
| Difference at 3 months | −3.8 | −12.4, 4.8 | −9.7 | −24.1, 4.8 | 5.8 | −10.4, 22.1 | 0.48 |
| Difference at 3 months 2 | −6.0 | −15.1, 3.0 | −7.3 | −16.6, 2.0 | 1.3 | −11.7, 14.3 | 0.84 |
| Difference at 6 months | −3.4 | −13.7, 6.9 | −17.8 | −37.1, 1.5 | 14.4 | −6.7, 35.5 | 0.18 |
| Difference at 6 months 2 | −6.4 | −17.9, 5.2 | −14.7 | −26.6, −2.8 | 8.3 | −8.3, 25.0 | 0.32 |
| PUFA, g | |||||||
| Difference at 3 months | −1.2 | −6.6, 4.2 | −12.6 | −21.7, −3.5 | 11.4 | 1.2, 21.7 | 0.03 |
| Difference at 3 months 2 | −2.4 | −8.5, 3.6 | −11.3 | −17.5, 5.1 | 8.8 | 0.2, 17.5 | 0.05 |
| Difference at 6 months | −1.5 | −7.3, 4.4 | −17.1 | −27.2, −7.1 | 15.7 | 4.4, 26.9 | 0.01 |
| Difference at 6 months 2 | −3.0 | −9.2, 3.2 | −15.5 | −21.9, 9.1 | 12.5 | 3.5, 21.4 | 0.01 |
| Saturated fat, g | |||||||
| Difference at 3 months | −4.0 | −12.3, 4.4 | −19.0 | −33.8, −4.2 | 15.0 | −1.5, 31.5 | 0.07 |
| Difference at 3 months 2 | −6.3 | −15.3, 2.7 | −16.5 | −25.8, −7.3 | 10.3 | −2.7, 23.2 | 0.12 |
| Difference at 6 months | −2.8 | −12.3, 6.8 | −26.5 | −42.4, −10.7 | 23.8 | 5.8, 41.7 | 0.01 |
| Difference at 6 months 2 | −5.3 | −15.1, 4.5 | −23.9 | −33.9, −13.8 | 18.6 | 4.5, 32.6 | 0.01 |
| Calcium, mg | |||||||
| Difference at 3 months | −259.7 | −676.2, 156.9 | −871.5 | −1432.0, −310.9 | 611.8 | −69.0, 1292.6 | 0.08 |
| Difference at 3 months 2 | −318.0 | −760.4, 124.5 | −809.8 | −1264.8, −354.9 | 491.9 | −144.6, 1128.3 | 0.13 |
| Difference at 6 months | −265.2 | −703.3, 172.9 | −1302.0 | −1904.2, −699.8 | 1036.8 | 311.2, −1762.4 | 0.01 |
| Difference at 6 months 2 | −353.1 | −781.3, 75.1 | −1209.1 | −1649.4, −768.7 | 856.0 | 240.0, −1472.0 | 0.01 |
| Magnesium, mg | |||||||
| Difference at 3 months | −94.2 | −180.9, −7.6 | −197.6 | −341.9, 53.4 | 103.4 | −59.8, 266.6 | 0.21 |
| Difference at 3 months 2 | −115.3 | −208.7, −21.9 | −175.3 | −271.4, −79.3 | 60.0 | −74.4, 194.4 | 0.38 |
| Difference at 6 months | −59.4 | −163.0, 44.2 | −339.5 | −505.5, −173.5 | 280.2 | 90.2, 470.1 | 0.004 |
| Difference at 6 months 2 | −86.6 | −188.8, 15.7 | −310.8 | −415.9, −205.7 | 224.2 | 77.2, 371.3 | 0.003 |
| Sodium, mg | |||||||
| Difference at 3 months | −1582.8 | −3194.7, 29.2 | −2436.8 | −4460.0, −413.7 | 854.1 | −1672.7, 3380.8 | 0.50 |
| Difference at 3 months 2 | −1919.2 | −3342.8, −495.6 | −2081.2 | −3545.1, −617.2 | 161.9 | −1886.0, 2209.9 | 0.88 |
| Difference at 6 months | −737.8 | −2618.0, 1142.4 | −3402.0 | −5340.0, −1464.1 | 2664.3 | 11.7, 5316.8 | 0.05 |
| Difference at 6 months 2 | −1105.2 | −2564.6, 354.1 | −3013.6 | −4514.3, −1512.9 | 1908.4 | −191.1, 4007.8 | 0.07 |
| Potassium, mg | |||||||
| Difference at 3 months | −678.8 | −1476.3, 118.6 | −1000.6 | −2299.6, 298.4 | 321.8 | −1156.9, 1800.5 | 0.67 |
| Difference at 3 months 2 | −848.8 | −1739.7, 42.1 | −820.9 | −1737.0, 95.2 | −27.9 | −1309.5, 1253.7 | 0.97 |
| Difference at 6 months | −324.3 | −1291.1, 642.6 | −2189.6 | −3554.1, −825.1 | 1865.4 | 237.0, −3493.7 | 0.03 |
| Difference at 6 months 2 | −534.2 | −1467.6, 399.3 | −1967.7 | −2927.6, −1007.8 | 1433.5 | 90.7, −2776.4 | 0.04 |
| Iron, mg | |||||||
| Difference at 3 months | −5.5 | −10.9, 0.1 | −16.9 | −26.1, −7.7 | 11.4 | 1.1, 21.7 | 0.03 |
| Difference at 3 months 2 | −6.9 | −12.6, −1.2 | −15.4 | −21.3, −9.6 | 8.5 | 0.3, 16.7 | 0.04 |
| Difference at 6 months | −4.6 | −10.9, 1.6 | −21.6 | −31.9, −11.4 | 17.0 | 5.4, 28.6 | 0.01 |
| Difference at 6 months 2 | −6.2 | −12.7, 0.4 | −20.0 | −26.7, −13.2 | 13.8 | 4.4, 23.2 | 0.01 |
| Vitamin C, mg | |||||||
| Difference at 3 months | −36.2 | −92.9, 20.5 | −7.3 | −92.6, 78.1 | −29.0 | −128.5, 70.6 | 0.56 |
| Difference at 3 months 2 | −42.0 | −109.7, 25.6 | −1.1 | −70.6, 68.5 | −41.0 | −138.3, 56.3 | 0.40 |
| Difference at 6 months | 3.1 | −76.4, 82.7 | −46.9 | −142.4, 48.5 | −50.0 | −172.2, 72.1 | 0.42 |
| Difference at 6 months 2 | −4.1 | −86.6, 78.3 | −39.3 | −124.0, 45.6 | 35.1 | −83.5, 153.7 | 0.56 |
| Vitamin D, mcg | |||||||
| Difference at 3 months | −0.6 | −3.6, 2.5 | −4.2 | −9.6, 1.1 | 3.7 | −2.3, 9.7 | 0.23 |
| Difference at 3 months 2 | −1.0 | −5.0, 3.0 | −3.8 | −7.9, 0.3 | 2.8 | −2.9, 8.6 | 0.33 |
| Difference at 6 months | −1.1 | −3.8, 1.5 | −8.7 | −12.6, −4.7 | 7.5 | 2.9, 12.2 | 0.002 |
| Difference at 6 months 2 | −1.6 | −4.6, 1.4 | −8.2 | −11.3, 5.1 | 6.7 | 2.4, 11.0 | 0.003 |
| Vitamin E, IU | |||||||
| Difference at 3 months | −7.0 | −13.7, −0.3 | −5.2 | −15.2, 4.7 | −1.8 | −13.4, 9.9 | 0.76 |
| Difference at 3 months 2 | −7.8 | −15.6, 0.1 | −4.4 | −12.5, 3.6 | −3.3 | −14.6, 7.9 | 0.56 |
| Difference at 6 months | −5.2 | −12.2, 1.8 | −13.6 | −26.4, −0.9 | 8.4 | −5.6, 22.5 | 0.24 |
| Difference at 6 months 2 | −6.4 | −15.5, 2.7 | −12.3 | −21.7, 2.9 | 5.9 | −7.2, 19.1 | 0.37 |
| Folate, mcg | |||||||
| Difference at 3 months | −59.1 | −136.0, 17.7 | −21.4 | −140.9, 98.0 | −37.7 | −175.6, 100.2 | 0.59 |
| Difference at 3 months 2 | −74.3 | −158.7, 10.0 | −5.4 | −92.1, 81.4 | −68.9 | −190.3, 52.4 | 0.26 |
| Difference at 6 months | −41.0 | −131.2, 49.2 | −106.6 | −250.8, 37.6 | 65.6 | −99.4, 230.7 | 0.43 |
| Difference at 6 months 2 | −61.7 | −157.6, 34.3 | −84.7 | −183.4, 13.9 | 23.1 | −115.0, 161.1 | 0.74 |
| HEI-2015 family score | |||||||
| Difference at 3 months | 4.8 | −0.3, 9.9 | 7.5 | 0.4, 14.6 | −2.7 | −11.2, 5.8 | 0.53 |
| Difference at 3 months 2 | 5.6 | 0.1, 11.1 | 6.7 | 1.0, 12.4 | −1.1 | −9.1, 6.8 | 0.77 |
| Difference at 6 months | 0.0 | −6.4, 6.4 | 8.0 | 0.9, 15.1 | −8.0 | −17.4, 1.4 | 0.09 |
| Difference at 6 months 2 | 0.4 | −6.1, 6.9 | 7.6 | 0.9, 14.3 | −7.2 | −16.6, 2.1 | 0.13 |
| Within-Group Differences | Between-Group Difference | p-Value 1 | |||||
|---|---|---|---|---|---|---|---|
| Low Avocado Allotment | High Avocado Allotment | ||||||
| (n = 37) | (n = 35) | ||||||
| Mean | 95% CI | Mean | 95% CI | Mean | 95% CI | ||
| Fruit, cup equivalents | |||||||
| Difference at 3 months | −0.3 | −0.8, 0.3 | 0.7 | −0.2, 1.6 | −1.0 | −2.0, 0.1 | 0.07 |
| Difference at 3 months 2 | −0.3 | −1.0, 0.5 | 0.7 | −0.0, 1.5 | −1.0 | −2.1, 0.0 | 0.06 |
| Difference at 6 months | −0.3 | −1.0, 0.4 | 0.3 | −0.6, 1.2 | −0.6 | −1.7, 0.6 | 0.32 |
| Difference at 6 months 2 | −0.4 | −1.1, 0.4 | 0.4 | −0.4, 1.1 | −0.7 | −1.8, 0.4 | 0.20 |
| Vegetables, cup equivalents | |||||||
| Difference at 3 months | −0.2 | −0.8, 0.5 | 0.2 | −0.6, 1.0 | −0.4 | −1.4, 0.7 | 0.49 |
| Difference at 3 months 2 | −0.2 | −0.9, 0.5 | 0.2 | −0.5, 1.0 | −0.5 | −1.5, 0.5 | 0.37 |
| Difference at 6 months | −0.1 | −0.9, 0.7 | −0.4 | −1.5, 0.6 | 0.3 | −0.9, 1.6 | 0.61 |
| Difference at 6 months 2 | −0.2 | −1.0, 0.7 | −0.4 | −1.2, 0.5 | 0.2 | −1.1, 1.4 | 0.77 |
| Greens, cup equivalents | |||||||
| Difference at 3 months | −0.1 | −0.5, 0.4 | 0.2 | −0.5, 0.9 | −0.2 | −1.1, 0.6 | 0.57 |
| Difference at 3 months 2 | −0.1 | −0.7, 0.5 | 0.2 | −0.4, 0.8 | −0.3 | −1.1, 0.5 | 0.47 |
| Difference at 6 months | 0.0 | −0.6, 0.6 | −0.3 | −1.0, 0.5 | 0.3 | −0.7, 1.2 | 0.55 |
| Difference at 6 months 2 | −0.0 | −0.7, 0.6 | −0.2 | −0.9, 0.5 | 0.2 | −0.7, 1.1 | 0.68 |
| Legumes, cup equivalents | |||||||
| Difference at 3 months | −0.2 | −0.4, −0.1 | 0.2 | −0.4, 0.0 | 0.0 | −0.3, 0.2 | 0.92 |
| Difference at 3 months 2 | −0.2 | −0.4, −0.0 | −0.2 | −0.4, 0.0 | 0.0 | −0.3, 0.2 | 0.77 |
| Difference at 6 months | −0.1 | −0.3, 0.1 | −0.3 | −0.5, −0.1 | 0.2 | −0.1, 0.5 | 0.20 |
| Difference at 6 months 2 | −0.1 | −0.3, 0.1 | −0.3 | −0.5, −0.1 | 0.2 | −0.1, 0.4 | 0.29 |
| Dairy, cup equivalents | |||||||
| Difference at 3 months | −0.3 | −1.2, 0.6 | −1.4 | −2.7, −0.2 | 1.1 | −0.4, 2.7 | 0.15 |
| Difference at 3 months 2 | −0.4 | −1.4, 0.7 | −1.3 | −2.4, −0.3 | 1.0 | −0.5, 2.5 | 0.21 |
| Difference at 6 months | −0.3 | −1.3, 0.7 | −2.3 | −3.5, −1.1 | 2.0 | 0.5, 3.5 | 0.01 |
| Difference at 6 months 2 | −0.4 | −1.4, 0.6 | −2.2 | −3.2, −1.2 | 1.8 | 0.3, 3.2 | 0.02 |
| Nuts, ounce equivalents | |||||||
| Difference at 3 months | −0.3 | −0.8, 0.1 | −0.5 | −1.3, 0.4 | 0.1 | −0.8, 1.1 | 0.78 |
| Difference at 3 months 2 | −0.3 | −0.9, 0.4 | −0.5 | −1.2, 0.2 | 0.2 | −0.7, 1.1 | 0.64 |
| Difference at 6 months | −0.3 | −0.9, 0.3 | −1.0 | −2.1, 0.1 | 0.7 | −0.5, 1.9 | 0.26 |
| Difference at 6 months 2 | −0.4 | −1.2, 0.4 | −0.9 | −1.7, −0.1 | 0.5 | −0.6, 1.7 | 0.37 |
| Whole grains, ounce equivalents | |||||||
| Difference at 3 months | −0.2 | −1.1, 0.7 | −1.5 | −2.2, −0.7 | 1.3 | 0.1, 2.5 | 0.04 |
| Difference at 3 months 2 | −0.3 | −1.1, 0.5 | −1.4 | −2.1, 0.6 | 1.0 | −0.1, 2.1 | 0.06 |
| Difference at 6 months | −0.6 | −1.6, 0.5 | −1.9 | −3.1, −0.7 | 1.3 | −0.2, 2.9 | 0.09 |
| Difference at 6 months 2 | −0.7 | −1.7, 0.3 | −1.7 | −2.8, 0.7 | 1.0 | −0.4, 2.5 | 0.15 |
| Refined grains, ounce equivalents | |||||||
| Difference at 3 months | −2.4 | −4.9, 0.1 | −8.5 | −13.4, −3.7 | 6.1 | 0.7, 11.5 | 0.03 |
| Difference at 3 months 2 | −3.1 | −6.0, −0.2 | −7.7 | −10.7, −4.7 | 4.6 | 0.4, 8.8 | 0.03 |
| Difference at 6 months | −0.6 | −4.4, 3.2 | −9.2 | −13.2, −5.2 | 8.5 | 3.1, 13.9 | 0.002 |
| Difference at 6 months 2 | −1.4 | 4.4, 1.6 | −8.4 | −11.5, −5.3 | 7.0 | 2.7, 11.3 | 0.002 |
| Processed meats, ounce equivalents | |||||||
| Difference at 3 months | −0.0 | −0.4, 0.4 | −0.7 | −1.4, 0.0 | 0.6 | −0.2, 1.4 | 0.11 |
| Difference at 3 months 2 | −0.1 | −0.6, 0.4 | −0.6 | −1.1, −0.1 | 0.5 | −0.2, 1.2 | 0.18 |
| Difference at 6 months | 0.1 | −0.4, 0.6 | −0.7 | −1.6, 0.1 | 0.9 | −0.1, 1.8 | 0.07 |
| Difference at 6 months 2 | 0.1 | −0.6, 0.7 | −0.7 | −1.3, −0.0 | 0.7 | −0.2, 1.6 | 0.11 |
| Chicken and eggs, ounce equivalents | |||||||
| Difference at 3 months | −0.2 | −0.9, 0.4 | −1.4 | −2.5, 0.3 | 1.2 | −0.1, 2.5 | 0.06 |
| Difference at 3 months 2 | −0.3 | −1.1, 0.5 | −1.3 | −2.2, −0.5 | 1.0 | −0.2, 2.2 | 0.09 |
| Difference at 6 months | 0.8 | −0.5, 2.1 | −1.6 | −2.9, −0.3 | 2.4 | 0.6, 4.2 | 0.01 |
| Difference at 6 months 2 | 0.7 | −0.6, 1.9 | −1.5 | −2.8, −0.2 | 2.2 | 0.4, 4.0 | 0.02 |
| Fish, ounce equivalents | |||||||
| Difference at 3 months | 0.4 | −0.5, 1.4 | −0.2 | −0.4, −2.6 | 0.6 | −0.6, 1.9 | 0.32 |
| Difference at 3 months 2 | 0.4 | −0.5, 1.2 | −0.1 | −1.0, 0.8 | 0.5 | −0.8, 1.7 | 0.47 |
| Difference at 6 months | 0.3 | −0.3, 0.9 | −0.5 | −1.3, 0.2 | 0.8 | −0.1, 1.8 | 0.09 |
| Difference at 6 months 2 | 0.3 | −0.4, 0.9 | −0.5 | −1.2, 0.2 | 0.7 | −0.2, 1.7 | 0.13 |
| Red meat, ounce equivalents | |||||||
| Difference at 3 months | −0.0 | −0.6, 0.6 | −0.6 | −1.9, 0.7 | 0.6 | −0.8, 2.0 | 0.38 |
| Difference at 3 months 2 | −0.1 | −1.0, 0.7 | −0.5 | −1.4, 0.4 | 0.4 | −0.9, 1.6 | 0.58 |
| Difference at 6 months | −0.1 | −0.6, 0.5 | −1.5 | −2.6, −0.5 | 1.4 | 0.3, 2.6 | 0.02 |
| Difference at 6 months 2 | −0.2 | −0.9, 0.5 | −1.4 | −2.1, −0.7 | 1.2 | −0.2, 2.2 | 0.02 |
| Sugar, teaspoon equivalents | |||||||
| Difference at 3 months | −4.7 | −9.7, 0.4 | −14.5 | −24.5, −4.6 | 9.9 | −1.2, 20.9 | 0.08 |
| Difference at 3 months 2 | −6.0 | −12.4, 0.4 | −13.2 | −19.7, −6.6 | 7.2 | −2.0, 16.4 | 0.13 |
| Difference at 6 months | −5.0 | −9.4, −0.6 | −12.0 | −21.6, −2.4 | 7.0 | −3.5, 17.5 | 0.19 |
| Difference at 6 months 2 | −6.4 | −12.1, −0.6 | −10.6 | −16.5, −4.7 | 4.2 | −4.1, 12.5 | 0.31 |
| Oils, g | |||||||
| Difference at 3 months | −0.8 | −9.6, 8.1 | −16.4 | −30.0, −2.9 | 15.7 | −0.3, 31.6 | 0.05 |
| Difference at 3 months 2 | −1.9 | −12.4, 8.6 | −15.2 | −26.0, −4.5 | 13.3 | −1.7, 28.4 | 0.09 |
| Difference at 6 months | −7.8 | −16.8, 1.3 | −22.8 | −38.8, −6.7 | 15.0 | −3.2, 33.2 | 0.10 |
| Difference at 6 months 2 | −10.0 | −20.5, 0.6 | −20.5 | −31.3, −9.7 | 10.5 | −4.6, 25.6 | 0.17 |
| Soymilk, cup equivalents | |||||||
| Difference at 3 months | 0.1 | −0.1, 0.3 | 0.2 | 0.1, 0.4 | −0.1 | −0.4, 0.1 | 0.34 |
| Difference at 3 months 2 | 0.1 | −0.1, 0.3 | 0.2 | 0.0, 0.4 | −0.1 | −0.4, 0.2 | 0.39 |
| Difference at 6 months | −0.1 | −0.3, 0.1 | −0.0 | −0.3, 0.3 | −0.1 | −0.4, 0.3 | 0.77 |
| Difference at 6 months 2 | −0.1 | −0.3, 0.2 | −0.0 | −0.4, 0.2 | −0.1 | −0.4, 0.3 | 0.76 |
| Soy, ounce equivalents | |||||||
| Difference at 3 months | 0.3 | −0.2, 0.7 | 0.4 | −0.0, 0.8 | −0.1 | −0.7, 0.5 | 0.67 |
| Difference at 3 months 2 | 0.3 | −0.2, 0.7 | 0.4 | −0.1, 0.8 | −0.1 | −0.7, 0.5 | 0.68 |
| Difference at 6 months | −0.1 | −0.6, 0.4 | −0.3 | −1.0, 0.4 | 0.2 | −0.7, 1.0 | 0.67 |
| Difference at 6 months 2 | −0.1 | −0.7, 0.5 | −0.3 | −0.9, 0.3 | 0.2 | −0.7, 1.0 | 0.69 |
| Within-Group Difference | Between-Group Difference | p-Value 1 | |||||
|---|---|---|---|---|---|---|---|
| Low Avocado Allotment (n = 37 Families) | High Avocado Allotment (n = 35 Families) | ||||||
| Mean | 95% CI | Mean | 95% CI | Mean | 95% CI | ||
| Body mass index, kg/m2 | |||||||
| All adults 2 | |||||||
| Difference at 3 months | 0.3 | −0.2, 0.8 | −0.1 | −0.7, 0.4 | −0.4 | −1.2, 0.3 | 0.27 |
| Difference at 6 months | −0.1 | −0.4, 0.2 | −0.01 | −0.7, 0.7 | 0.1 | −0.7, 0.9 | 0.77 |
| Head of household 3 | |||||||
| Difference at 3 months | −0.1 | −0.4, 0.3 | −0.1 | −0.6, 0.3 | −0.1 | −0.5, 0.6 | 0.79 |
| Difference at 6 months | −0.4 | −0.9, 0.1 | 0.1 | −0.9, 1.1 | −0.5 | −1.6, 0.6 | 0.37 |
| Non-head of household adult 4 | |||||||
| Difference at 3 months | 0.7 | −0.3, 1.6 | −0.1 | −1.2, 1.0 | 0.8 | −0.7, 2.2 | 0.29 |
| Difference at 6 months | 0.1 | −0.3, 0.5 | −0.2 | −1.2, 0.9 | 0.3 | −0.9, 1.4 | 0.62 |
| Waist-to-height ratio, cm | |||||||
| Adolescent 5 | |||||||
| Difference at 3 months | 0.01 | −0.01, 0.02 | 0.01 | −0.01, 0.03 | 0.003 | −0.03, 0.02 | 0.83 |
| Difference at 6 months | 0.01 | −0.01, 0.03 | 0 | −0.02, 0.02 | 0.01 | −0.02, 0.04 | 0.46 |
| Child 6 | |||||||
| Difference at 3 months | 0 | −0.01, 0.01 | 0.01 | −0.01, 0.03 | −0.01 | −0.03, 0.01 | 0.30 |
| Difference at 6 months | 0.01 | −0.01, 0.02 | 0.01 | −0.003, 0.03 | −0.004 | −0.02, 0.01 | 0.68 |
| Waist circumference, cm | |||||||
| All adults 2 | |||||||
| Female | |||||||
| Difference at 3 months | 0.8 | −1.1, 2.7 | 0.7 | −1.3, 2.8 | −0.05 | −2.8, 2.7 | 0.97 |
| Difference at 6 months | 0.6 | −1.4, 2.5 | 1.2 | −0.5, 2.9 | 0.7 | −1.9, 3.2 | 0.60 |
| Male | |||||||
| Difference at 3 months | −0.3 | −2.3, 1.6 | 2.0 | −0.02, 4.1 | 2.4 | −0.5, 5.2 | 0.10 |
| Difference at 6 months | 1.7 | −0.6, 3.9 | 2.7 | −0.6, 6.0 | 1.0 | −2.7, 4.8 | 0.57 |
| Head of household 3 | |||||||
| Difference at 3 months | 1.3 | −0.8, 3.5 | 1.1 | −1.2, 3.4 | 0.2 | −2.9, 3.3 | 0.89 |
| Difference at 6 months | 1.3 | −0.7, 3.4 | 1.0 | −1.1, 3.2 | 0.3 | −2.6, 3.2 | 0.85 |
| Non-head of household adult 4 | |||||||
| Female | |||||||
| Difference at 3 months | −0.7 | −5.2, 3.7 | −0.1 | −4.7, 4.4 | −0.6 | −6.7, 5.5 | 0.85 |
| Difference at 6 months | −1.7 | −6.8, 3.3 | 1.5 | −1.7, 4.8 | −3.3 | −8.8, 2.3 | 0.24 |
| Male | |||||||
| Difference at 3 months | −0.3 | −2.3, 1.6 | 2.0 | −0.02, 4.1 | 2.3 | −5.2, 0.5 | 0.10 |
| Difference at 6 months | 1.7 | −0.6, 3.9 | 2.7 | −0.6, 6.0 | −1.0 | −4.8, 2.7 | 0.57 |
| Adolescent 5 | |||||||
| Female | |||||||
| Difference at 3 months | 0.9 | −2.1, 4.0 | 0.5 | −4.0, 5.1 | −0.4 | −6.1, 5.3 | 0.88 |
| Difference at 6 months | 1.7 | −3.0, 6.5 | −0.5 | −4.7, 3.6 | −2.3 | −8.2, 3.7 | 0.44 |
| Male | |||||||
| Difference at 3 months | 0.6 | −2.9, 4.1 | 4.1 | −2.5, 10.7 | 3.5 | −2.7, 9.7 | 0.23 |
| Difference at 6 months | 2.8 | −0.9, 6.5 | 2.3 | −3.3, 7.9 | −0.5 | −6.0, 5.0 | 0.84 |
| Child 6 | |||||||
| Girl | |||||||
| Difference at 3 months | −0.5 | −3.6, 2.5 | 2.8 | −0.2, 5.8 | 3.3 | −0.9, 7.5 | 0.12 |
| Difference at 6 months | 0.3 | −3.4, 4.1 | 3.2 | 0.7, 5.6 | 2.8 | −1.2, 6.9 | 0.16 |
| Boy | |||||||
| Difference at 3 months | 1.6 | −0.1, 3.3 | 1.4 | −2.2, 4.9 | −0.2 | −3.5, 3.1 | 0.89 |
| Difference at 6 months | 3.3 | 1.3, 5.4 | 3.2 | −0.6, 7.0 | −0.2 | −3.9, 3.6 | 0.93 |
| Systolic blood pressure, mmHg | |||||||
| All adults 2 | |||||||
| Difference at 3 months | −2.7 | −5.7, 0.3 | −1.1 | −4.0, 1.7 | 1.5 | −2.6, 5.7 | 0.46 |
| Difference at 6 months | −5.5 | −8.5, −2.6 | 0.3 | −2.3, 3.0 | 5.9 | 1.9, 9.8 | 0.004 |
| Head of household 3 | |||||||
| Difference at 3 months | −2.6 | −7.0, 1.7 | −2.1 | −6.2, 1.9 | −0.5 | −6.4, 5.4 | 0.87 |
| Difference at 6 months | −4.8 | −9.1, −0.5 | 0.8 | −3.2, 4.9 | −5.6 | 11.5, 0.2 | 0.06 |
| Non-head of household adult 4 | |||||||
| Difference at 3 months | −2.7 | −7.0, 1.6 | −0.03 | −4.3, 4.2 | −2.7 | −8.6, 3.3 | 0.37 |
| Difference at 6 months | −6.2 | −10.4, 2.1 | −0.2 | −3.9, 3.4 | −6.0 | −11.5, −0.5 | 0.03 |
| Adolescent 5 | |||||||
| Difference at 3 months | −1.7 | −5.3, 1.9 | −1.4 | −5.1, 2.3 | 0.3 | −4.8, 5.4 | 0.90 |
| Difference at 6 months | −2.1 | −5.7, 1.6 | −0.9 | −4.7, 2.8 | 1.1 | −4.0, 6.3 | 0.66 |
| Child 6 | |||||||
| Difference at 3 months | −1.3 | −4.6, 2.1 | 0.4 | −2.0, 2.9 | 1.7 | −2.3, 5.7 | 0.40 |
| Difference at 6 months | −0.1 | −3.2, 3.0 | 2.6 | −0.8, 6.1 | 2.7 | −1.8, 7.3 | 0.23 |
| Diastolic blood pressure, mmHg | |||||||
| All adults 2 | |||||||
| Difference at 3 months | −0.9 | −3.0, 1.3 | −0.8 | −2.7, 1.1 | 0.1 | −2.8, 2.9 | 0.96 |
| Difference at 6 months | −1.8 | −3.8, 0.2 | −0.2 | −2.0, 1.6 | 1.6 | −1.1, 4.3 | 0.24 |
| Head of household 3 | |||||||
| Difference at 3 months | −2.4 | −5.2, 0.4 | −1.2 | −3.8, 1.4 | −1.2 | −5.0, 2.6 | 0.54 |
| Difference at 6 months | −3.5 | −6.3, −0.6 | 0.7 | −2.4, 3.8 | −4.2 | −8.4, −0.1 | 0.05 |
| Non-head of household adult 4 | |||||||
| Difference at 3 months | 0.7 | −2.6, 4.0 | −0.3 | −3.2, 2.6 | 1.0 | −3.4, 5.4 | 0.65 |
| Difference at 6 months | −0.1 | −2.8, 2.6 | −1.2 | −3.1, 0.7 | 1.1 | −2.2, 4.3 | 0.51 |
| Adolescent 5 | |||||||
| Difference at 3 months | 0.7 | −2.4, 3.9 | −2.1 | −5.5, 1.4 | −2.8 | −7.4, 1.8 | 0.23 |
| Difference at 6 months | 0.8 | −3.1, 4.7 | −0.8 | −4.7, 3.1 | −1.6 | −7.0, 3.8 | 0.54 |
| Child 6 | |||||||
| Difference at 3 months | −2.9 | −6.1, 0.4 | −2.1 | −5.3, 1.1 | 0.8 | −3.7, 5.3 | 0.73 |
| Difference at 6 months | −2.9 | −5.3, −0.6 | −0.8 | −5.0, 3.5 | 2.2 | −2.6, 6.9 | 0.37 |
| Within-Group Difference | Between-Group Difference | p-Value 1 | |||||
|---|---|---|---|---|---|---|---|
| Low Avocado Allotment (n = 60) | High Avocado Allotment (n = 53) | ||||||
| Mean | 95% CI | Mean | 95% CI | Mean | 95% CI | ||
| Free fatty acids, mg/dL | |||||||
| All adults 2 | |||||||
| Difference at 3 months | −0.02 | −0.05, 0.02 | −0.002 | −0.03, 0.03 | 0.01 | −0.03, 0.06 | 0.56 |
| Difference at 6 months | −0.02 | −0.06, 0.02 | 0.01 | −0.05, 0.07 | 0.03 | −0.04, 0.10 | 0.42 |
| Head of household 3 | |||||||
| Difference at 3 months | 0.01 | −0.04, 0.05 | 0 | −0.03, 0.03 | 0.01 | −0.04, 0.06 | 0.83 |
| Difference at 6 months | −0.04 | −0.09, 0.02 | 0.01 | −0.07, 0.09 | −0.04 | −0.14, 0.05 | 0.37 |
| Non-head of household adult 4 | |||||||
| Difference at 3 months | −0.05 | 0.10, −0.01 | −0.01 | −0.07, 0.06 | −0.04 | −0.13, 0.04 | 0.33 |
| Difference at 6 months | 0.004 | −0.06, 0.07 | 0.01 | 0.08, 0.10 | −0.01 | −0.12, 0.10 | 0.90 |
| Red blood cell magnesium 5, mg/dL | |||||||
| All adults 2 | |||||||
| Difference at 3 months | −0.26 | −0.41, −0.11 | 0.07 | −0.13, 0.28 | 0.33 | 0.08, 0.59 | 0.01 |
| Difference at 6 months | −0.27 | −0.49, −0.06 | 0.08 | −0.10, 0.26 | 0.36 | 0.09, 0.62 | 0.01 |
| Head of household 3 | |||||||
| Difference at 3 months | −0.36 | −0.59, −0.13 | −0.03 | −0.37, 0.32 | −0.34 | −0.71, 0.04 | 0.08 |
| Difference at 6 months | −0.40 | −0.78, −0.02 | 0.06 | −0.27, 0.40 | −0.46 | −0.92, −0.0005 | 0.05 |
| Non-head of household adult 4 | |||||||
| Difference at 3 months | −0.14 | −0.37, 0.09 | 0.15 | −0.15, 0.45 | −0.29 | −0.67, 0.09 | 0.12 |
| Difference at 6 months | −0.13 | −0.34, 0.08 | 0.10 | −0.15, 0.35 | −0.23 | −0.55, 0.09 | 0.15 |
| Lipids, mg/dL | |||||||
| total cholesterol | |||||||
| All adults 2 | |||||||
| Difference at 3 months | −1.6 | −8.5, 5.2 | −3.6 | −11.3, 4.1 | −2.0 | −12.1, 8.2 | 0.70 |
| Difference at 6 months | −7.5 | −14.7, −0.3 | −9.0 | −16.1, −1.8 | −1.5 | −11.6, 8.6 | 0.77 |
| Head of household 3 | |||||||
| Difference at 3 months | −1.2 | −11.1, 8.8 | −3.5 | −14.3, 7.3 | 2.4 | −12.0, 16.7 | 0.75 |
| Difference at 6 months | −9.6 | −19.3, 0.1 | −6.3 | −15.9, 3.4 | −3.4 | −16.8, 10.1 | 0.62 |
| Non-head of household adult 4 | |||||||
| Difference at 3 months | −2.4 | −11.4, 6.6 | −3.7 | −4.9, 20.6 | 1.3 | −11.9, 14.5 | 0.84 |
| Difference at 6 months | −4.0 | −15.2, 7.2 | −14.2 | −24.6, −3.8 | 10.2 | −4.9, 25.4 | 0.18 |
| HDL cholesterol | |||||||
| All adults 2 | |||||||
| Difference at 3 months | 0.9 | −1.0, 2.7 | −1.5 | −3.4, 0.5 | −2.3 | −5.0, 0.4 | 0.09 |
| Difference at 6 months | −0.3 | −2.0, 1.4 | −2.3 | −4.0, −0.5 | −1.9 | −4.4, 0.5 | 0.12 |
| Head of household 3 | |||||||
| Difference at 3 months | −0.1 | −2.2, 2.1 | −1.2 | −3.8, 1.4 | 1.1 | −2.2, 4.4 | 0.50 |
| Difference at 6 months | −1.2 | −3.4, 1.1 | −1.1 | −2.7, 0.6 | 0.1 | −2.9, 2.7 | 0.94 |
| Non-head of household adult 4 | |||||||
| Difference at 3 months | 2.3 | −1.3, 5.9 | −2.0 | −4.9, 0.9 | 4.3 | −0.4, 9.0 | 0.07 |
| Difference at 6 months | 1.0 | −1.8, 3.8 | −4.6 | −8.7, −0.5 | 5.6 | 0.9, 10.3 | 0.02 |
| LDL cholesterol 6 | |||||||
| All adults 2 | |||||||
| Difference at 3 months | −1.5 | −7.4, 4.4 | −2.9 | −9.2, 3.4 | −1.5 | −10.0, 7.0 | 0.73 |
| Difference at 6 months | −8.0 | −14.5, −1.4 | −6.3 | −11.7, −1.0 | 1.7 | −6.8, 10.1 | 0.70 |
| Head of household 3 | |||||||
| Difference at 3 months | −1.8 | −11.0, 7.5 | −3.2 | −11.4, 5.0 | 1.5 | −10.8, 13.7 | 0.81 |
| Difference at 6 months | −9.9 | −18.9, −0.8 | −5.2 | −12.1, 1.6 | −4.7 | −15.9, 6.6 | 0.41 |
| Non-head of household adult 4 | |||||||
| Difference at 3 months | −1.0 | −4.6, 2.6 | −2.4 | −13.1, 8.2 | 1.4 | −9.6, 12.5 | 0.79 |
| Difference at 6 months | −4.8 | −14.3, 4.8 | −8.4 | −17.9, 1.0 | 3.7 | −9.4, 16.7 | 0.57 |
| Very low LDL cholesterol 6 | |||||||
| All adults 2 | |||||||
| Difference at 3 months | 0.2 | −1.9, 2.3 | 0.7 | −2.7, 4.1 | 0.5 | −3.4, 4.5 | 0.80 |
| Difference at 6 months | 1.0 | −1.1, 3.1 | −0.1 | −3.7, 3.5 | −1.1 | −5.2, 3.0 | 0.60 |
| Head of household 3 | |||||||
| Difference at 3 months | 0.7 | −1.5, 2.9 | 0.7 | −4.0, 5.4 | −0.01 | −5.2, 5.2 | 0.99 |
| Difference at 6 months | 1.2 | −1.8, 4.1 | 0.5 | −4.7, 5.7 | 0.7 | −5.2, 6.6 | 0.81 |
| Non-head of household adult 4 | |||||||
| Difference at 3 months | −0.7 | −5.3, 4.0 | 0.7 | −3.8, 5.3 | −1.4 | −7.7, 4.9 | 0.66 |
| Difference at 6 months | 0.7 | −2.2, 3.7 | −1.2 | −5.1, 2.7 | 1.9 | −2.8, 6.5 | 0.42 |
| Triglycerides | |||||||
| All adults 2 | |||||||
| Difference at 3 months | 3.4 | −16.7, 23.4 | 3.1 | −13.6, 19.8 | −0.2 | −26.5, 26.0 | 0.99 |
| Difference at 6 months | 1.2 | −11.1, 13.6 | −3.0 | −25.1, 19.2 | −4.2 | −29.4, 21.0 | 0.74 |
| Head of household 3 | |||||||
| Difference at 3 months | 9.7 | −7.1, 26.5 | 2.5 | −20.7, 25.6 | 7.2 | −20.6, 35.1 | 0.61 |
| Difference at 6 months | 5.5 | −8.8, 19.9 | −1.5 | −34.3, 31.2 | 7.1 | −28.3, 42.4 | 0.69 |
| Non-head of household adult 4 | |||||||
| Difference at 3 months | −6.8 | −53.9, 40.3 | 4.4 | −18.7, 27.5 | −11.2 | −62.6, 40.2 | 0.66 |
| Difference at 6 months | −5.7 | −29.6, 18.2 | −5.7 | −25.6, 14.1 | 0.03 | −31.3, 31.3 | 0.99 |
| Glucose, mg/dL | |||||||
| All adults 2 | |||||||
| Difference at 3 months | −4.0 | −12.3, 4.4 | −3.9 | −7.2, −0.5 | 0.1 | −8.8, 9.0 | 0.98 |
| Difference at 6 months | −3.6 | −9.9, 2.8 | −3.7 | −7.8, 0.4 | −0.1 | −7.6, 7.4 | 0.97 |
| Head of household 3 | |||||||
| Difference at 3 months | 0.5 | −10.9, 11.9 | −6.8 | −11.1, −2.5 | 7.3 | −4.8, 19.5 | 0.23 |
| Difference at 6 months | −3.3 | −11.7, 5.1 | −5.5 | −11.4, 0.5 | 2.2 | −8.0, 12.3 | 0.67 |
| Non-head of household adult 4 | |||||||
| Difference at 3 months | −11.2 | −23.4, 0.8 | 1.8 | −2.5, 6.2 | −13.1 | −25.7, 0.4 | 0.04 |
| Difference at 6 months | −4.0 | −14.5, 6.5 | −0.2 | −3.9, 3.5 | −3.8 | −14.8, 7.2 | 0.49 |
| Insulin, microIU/mL (uIU/mL) | |||||||
| All adults 2 | |||||||
| Difference at 3 months | 1.6 | −1.3, 4.4 | 1.4 | −4.1, 6.8 | −0.2 | −5.9, 6.3 | 0.95 |
| Difference at 6 months | 1.0 | −0.7, 2.6 | 1.5 | −3.4, 6.3 | 0.5 | −4.6, 5.5 | 0.85 |
| Head of household 3 | |||||||
| Difference at 3 months | 2.2 | −2.2, 6.6 | 0.2 | −7.4, 7.8 | 2.0 | −6.7, 10.7 | 0.64 |
| Difference at 6 months | 1.0 | −1.0, 2.9 | −0.6 | −4.6, 3.5 | 1.5 | −2.9, 6.0 | 0.49 |
| Non-head of household adult 4 | |||||||
| Difference at 3 months | 0.5 | −2.0, 2.9 | 3.7 | −3.3, 10.6 | −3.2 | −10.5, 4.1 | 0.37 |
| Difference at 6 months | 1.0 | −2.1, 4.1 | 5.4 | −7.1, 17.9 | −4.4 | −17.2, 8.4 | 0.48 |
| HOMA-IR | |||||||
| All adults 2 | |||||||
| Difference at 3 months | 0.2 | −0.6, 1.0 | 0.2 | −1.2, 1.6 | 0.05 | −1.6, 1.6 | 0.95 |
| Difference at 6 months | 0.1 | −0.4, 0.5 | 0.4 | −1.0, 1.7 | 0.3 | −1.1, 1.7 | 0.64 |
| Head of household 3 | |||||||
| Difference at 3 months | 0.6 | −0.6, 1.8 | −0.2 | −2.1, 1.8 | 0.7 | −1.5, 3.0 | 0.52 |
| Difference at 6 months | 0.2 | −0.3, 0.6 | −0.2 | −1.4, 0.9 | 0.4 | −0.8, 1.6 | 0.49 |
| Non-head of household adult 4 | |||||||
| Difference at 3 months | −0.5 | −1.4, 0.4 | 0.9 | −0.7, 2.6 | −1.4 | −3.3, 0.4 | 0.12 |
| Difference at 6 months | −0.1 | −1.1, 0.8 | 1.6 | −1.9, 5.1 | −1.7 | −5.3, 1.9 | 0.33 |
| Hemoglobin A1c, % | |||||||
| All adults 2 | |||||||
| Difference at 3 months | 0.003 | −0.12, 0.13 | −0.01 | −0.08, 0.05 | −0.02 | −0.16, 0.12 | 0.81 |
| Difference at 6 months | −0.03 | −0.17, 0.10 | −0.06 | −0.14, 0.01 | −0.03 | −0.18, 0.12 | 0.67 |
| Head of household 3 | |||||||
| Difference at 3 months | 0.07 | −0.11, 0.25 | −0.02 | −0.09, 0.05 | 0.09 | −0.10, 0.29 | 0.34 |
| Difference at 6 months | 0 | −0.18, 0.18 | −0.09 | −0.19, 0.01 | 0.09 | −0.12, 0.30 | 0.40 |
| Non-head of household adult 4 | |||||||
| Difference at 3 months | −0.11 | −0.26, 0.04 | 0 | −0.15, 0.15 | −0.11 | −0.32, 0.10 | 0.30 |
| Difference at 6 months | −0.08 | −0.29, 0.12 | −0.02 | −0.10, 0.07 | −0.07 | −0.28, 0.15 | 0.54 |
| C-reactive protein, mg/L | |||||||
| All adults 2 | |||||||
| Difference at 3 months | −0.5 | −1.6, 0.7 | −0.2 | −0.6, 0.3 | 0.3 | −0.9, 1.6 | 0.58 |
| Difference at 6 months | −0.5 | −1.5, 0.6 | −0.4 | −0.9, 0.1 | 0.1 | −1.1, 1.2 | 0.88 |
| Head of household 3 | |||||||
| Difference at 3 months | −0.4 | −1.1, 0.3 | 0.1 | −0.5, 0.6 | −0.5 | −1.4, 0.5 | 0.32 |
| Difference at 6 months | −0.2 | −0.9, 0.5 | −0.2 | −0.6, 0.3 | −0.02 | −0.9, 0.8 | 0.95 |
| Non-head of household adult 4 | |||||||
| Difference at 3 months | −0.7 | −3.5, 2.2 | −0.6 | −1.5, 0.3 | −0.1 | −3.0, 2.9 | 0.97 |
| Difference at 6 months | −0.9 | −3.5, 1.7 | −0.8 | −1.9, 0.2 | −0.1 | −2.9, 2.7 | 0.94 |
| Within-Group Difference | Between-Group Difference | p-Value 2 | |||||
|---|---|---|---|---|---|---|---|
| Low Avocado Allotment 1 | High Avocado Allotment 1 | ||||||
| Mean | 95% CI | Mean | 95% CI | Mean | 95% CI | ||
| Total energy intake, kcal | |||||||
| Difference at 3 months | −267.1 | −1132.8, 598.6 | −1784.8 | −2637.6, −932.1 | −1517.7 | −2759.3, −276.2 | 0.02 |
| Difference at 6 months | 34.0 | −980.0, 1048.1 | −2209.8 | −3163.0, −1256.4 | −2243.8 | −3647.6, −839.9 | 0.002 |
| Carbohydrate, g | |||||||
| Difference at 3 months | −83.1 | −202.3, 36.2 | −259.2 | −376.7, −141.8 | −176.2 | −347.2, −5.2 | 0.04 |
| Difference at 3 months 3 | −128.2 | −217.7, −38.7 | −215.4 | −303.5, −127.2 | −87.1 | −216.6, 42.3 | 0.18 |
| Difference at 6 months | −35.3 | −168.2, 97.6 | −293.8 | −418.8, −168.8 | −258.5 | −442.6, −74.4 | 0.01 |
| Difference at 6 months 3 | −78.5 | −173.0, 16.0 | −255.6 | −344.3, −166.8 | −177.1 | −308.6, −45.6 | 0.01 |
| Dietary fiber, g | |||||||
| Difference at 3 months | −8.7 | −18.3, 1.0 | −7.3 | −16.8, 2.2 | 1.4 | −12.5, 15.2 | 0.84 |
| Difference at 3 months 3 | −12.0 | −19.8, −4.2 | −4.1 | −11.8, 3.6 | 7.9 | −3.4, 19.2 | 0.17 |
| Difference at 6 months | −2.8 | −14.8, 9.1 | −14.6 | −25.9, −3.4 | −11.8 | −28.3, 4.8 | 0.16 |
| Difference at 6 months 3 | −6.0 | −15.9, 3.8 | −11.8 | −21.0, −2.6 | −5.8 | −19.5, 7.9 | 0.40 |
| Protein, g | |||||||
| Difference at 3 months | −8.4 | −44.3, 27.5 | −63.1 | −98.4, −27.8 | −54.7 | −106.1, −3.3 | 0.04 |
| Difference at 3 months 3 | −20.1 | −49.8, 9.7 | −51.8 | −81.1, −22.5 | −31.7 | −74.7, 11.3 | 0.15 |
| Difference at 6 months | 14.2 | −25.8, 54.3 | −94.5 | −132.2, −56.9 | −108.7 | −164.2, −53.3 | <0.001 |
| Difference at 6 months 3 | 3.2 | −29.2, 35.6 | −84.8 | −115.3, −54.3 | −88.0 | −133.2, −42.9 | <0.001 |
| Animal origin, g | |||||||
| Difference at 3 months | 1.0 | −23.9, 25.8 | −39.0 | −63.5, −14.5 | −40.0 | −75.6, −4.3 | 0.03 |
| Difference at 3 months 3 | −5.8 | −27.9, 16.3 | −32.4 | −54.2, −10.6 | −26.6 | −58.5, 5.4 | 0.10 |
| Difference at 6 months | 16.3 | −10.6, 43.3 | −58.8 | −84.2, −33.5 | −75.2 | −112.5, −37.9 | <0.001 |
| Difference at 6 months 3 | 10.3 | −13.5, 34.1 | −53.5 | −75.9, −31.1 | −63.8 | −97.0, −30.7 | <0.001 |
| Vegetable origin, g | |||||||
| Difference at 3 months | −9.4 | −23.9, 5.1 | −24.1 | −38.4, −9.8 | −14.7 | −35.5, 6.1 | 0.16 |
| Difference at 3 months 3 | −14.2 | −26.1, −2.4 | −19.4 | −31.0, −7.7 | −5.1 | −22.3, 12.0 | 0.55 |
| Difference at 6 months | −2.1 | −19.3, 15.1 | −35.7 | −51.8, −19.5 | −33.6 | −57.3, −9.8 | 0.01 |
| Difference at 6 months 3 | −7.1 | −20.6, 6.4 | −31.3 | −43.9, −18.6 | −24.2 | −42.9, 5.4 | 0.01 |
| Fat, g | |||||||
| Difference at 3 months | −4.1 | −37.6, 29.5 | −50.3 | −83.3, −17.2 | −46.2 | −94.3, 1.9 | 0.06 |
| Difference at 3 months 3 | −15.9 | −42.4, 10.6 | −38.8 | −64.8, −12.7 | −22.8 | −61.1, 15.5 | 0.24 |
| Difference at 6 months | 3.8 | −37.7, 45.3 | −68.1 | −107.2, −29.1 | −72.0 | −129.4, −14.5 | 0.02 |
| Difference at 6 months 3 | −8.8 | −40.1, 22.6 | −57.0 | −86.4, −27.5 | −48.2 | −91.8, −4.5 | 0.03 |
| MUFA, g | |||||||
| Difference at 3 months | −1.7 | −13.8, 10.4 | −12.0 | −24.0, −0.1 | −10.3 | −27.7, 7.0 | 0.24 |
| Difference at 3 months 3 | −5.9 | −15.6, 3.9 | −8.0 | −17.6, 1.6 | −2.1 | −16.2, 12.0 | 0.76 |
| Difference at 6 months | −0.1 | −16.9, 16.8 | −18.3 | −34.1, −2.5 | −18.3 | −41.6, 5.0 | 0.12 |
| Difference at 6 months 3 | −5.0 | −18.1, 8.1 | −14.0 | −26.2, −1.7 | −9.0 | −27.2, 9.2 | 0.33 |
| PUFA, g | |||||||
| Difference at 3 months | 0.2 | −7.5, 7.9 | −14.0 | −21.6, −6.5 | −14.2 | −25.3, −3.2 | 0.01 |
| Difference at 3 months 3 | −2.2 | −8.7, 4.4 | −11.8 | −18.2, −5.3 | −9.6 | −19.1, −0.1 | 0.05 |
| Difference at 6 months | 0.2 | −8.8, 9.2 | −17.5 | −26.0, −9.1 | −17.7 | −30.1, −5.2 | 0.01 |
| Difference at 6 months 3 | −2.4 | −9.5, 4.7 | −15.2 | −21.9, −8.6 | −12.8 | −22.7, −3.0 | 0.01 |
| Saturated fat, g | |||||||
| Difference at 3 months | −2.2 | −14.6, 10.2 | −21.1 | −33.3, −8.9 | −18.9 | −36.7, −1.2 | 0.04 |
| Difference at 3 months 3 | −6.6 | −16.3, 3.2 | −16.8 | −26.4, −7.2 | −10.3 | −24.4, 3.9 | 0.15 |
| Difference at 6 months | 2.7 | −11.0, 16.4 | −27.7 | −40.5, −14.7 | −30.3 | −49.2, −11.3 | 0.002 |
| Difference at 6 months 3 | −1.5 | −11.8, 8.9 | −23.9 | −33.6, −14.2 | −22.4 | −36.8, −8.0 | 0.003 |
| Calcium, mg | |||||||
| Difference at 3 months | −218.9 | −735.5, 297.6 | −933.3 | −1442.1, −424.5 | −714.3 | −1455.2, 26.5 | 0.06 |
| Difference at 3 months 3 | −329.9 | −815.5, 155.7 | −825.5 | −1303.7, 347.3 | −495.6 | −1197.7, 206.5 | 0.16 |
| Difference at 6 months | −39.8 | −577.5, 498.0 | −1379.8 | −1885.4, −874.3 | −1340.0 | −2084.5, −595.6 | <0.001 |
| Difference at 6 months 3 | −178.7 | −627.9, 270.4 | −1256.8 | −1678.7, −834.8 | −1078.0 | −1703.3, −452.8 | 0.001 |
| Magnesium, mg | |||||||
| Difference at 3 months | −89.0 | −212.9, 35.0 | −210.8 | −332.9, −88.7 | −121.8 | −299.6, 56.0 | 0.18 |
| Difference at 3 months 3 | −130.2 | −231.8, −28.7 | −170.7 | −270.7, −70.7 | −40.5 | −187.3, 106.3 | 0.58 |
| Difference at 6 months | −20.3 | −168.3, 127.6 | −348.7 | −487.8, −209.6 | −328.4 | −533.2, −123.6 | 0.002 |
| Difference at 6 months 3 | −65.0 | −177.3, 47.3 | −309.2 | −414.7, −203.7 | −244.1 | −400.5, −87.8 | 0.003 |
| Sodium, mg | |||||||
| Difference at 3 months | −1692.8 | −3626.8, 241.3 | −2465.6 | −4370.6, −560.6 | −772.9 | −3546.5, 2000.8 | 0.58 |
| Difference at 3 months 3 | −2373.2 | −3906.0, −840.4 | −1804.6 | −3314.0, −295.2 | 568.6 | −1647.7, 2784.9 | 0.61 |
| Difference at 6 months | −364.5 | −2454.3, 1725.4 | −3414.9 | −5379.6, −1450.2 | −3050.5 | −5943.8, −157.2 | 0.04 |
| Difference at 6 months 3 | −978.9 | −2597.2, 639.4 | −2870.7 | −4391.0, −1350.4 | −1891.7 | −4144.6, 361.1 | 0.10 |
| Potassium, mg | |||||||
| Difference at 3 months | −625.7 | −1751.1, 499.8 | −1110.4 | −2219.0, −1.9 | −484.8 | −2098.7, 1129.2 | 0.55 |
| Difference at 3 months 3 | −957.1 | −1931.7, 17.6 | −788.5 | −1748.2, 171.3 | 168.6 | −1240.7, 1577.9 | 0.81 |
| Difference at 6 months | 59.1 | −1201.0, 1319.2 | −2259.0 | −3443.6, −1074.4 | −2318.1 | −4062.6, −573.6 | 0.01 |
| Difference at 6 monthsc | −284.1 | −1308.4, 740.2 | −1955.0 | −2917.3, −992.7 | −1670.9 | −3096.8, −245.0 | 0.02 |
| Iron, mg | |||||||
| Difference at 3 months | −5.4 | −13.3, 2.5 | −17.5 | −25.2, −9.7 | −12.0 | −23.3, −0.8 | 0.04 |
| Difference at 3 months 3 | −8.2 | −14.4, −2.1 | −14.7 | −20.8, −8.7 | −6.5 | −15.4, 2.4 | 0.15 |
| Difference at 6 months | −2.3 | −11.4, 6.7 | −22.6 | −31.1, −14.1 | −20.2 | −32.7, −7.7 | 0.002 |
| Difference at 6 months 3 | −4.9 | −12.1, 2.4 | −20.3 | −27.1, −13.5 | −15.4 | −25.5, −5.4 | 0.003 |
| Vitamin C, mg | |||||||
| Difference at 3 months | −41.8 | −118.1, 34.5 | −4.9 | −80.0, 70.2 | 36.9 | −72.5, 146.3 | 0.50 |
| Difference at 3 months 3 | −54.0 | −128.4, 20.4 | 7.0 | −66.3, 80.2 | 61.0 | −46.6, 168.5 | 0.26 |
| Difference at 6 months | 11.7 | −85.9, 109.3 | −43.7 | −135.5, 48.0 | −55.4 | −190.5, 79.7 | 0.42 |
| Difference at 6 months 3 | −1.0 | −95.9, 93.9 | −32.5 | −121.6, 56.7 | −31.4 | −163.6, 100.7 | 0.64 |
| Vitamin D, mcg | |||||||
| Difference at 3 months | −0.2 | −4.8, 4.4 | −4.6 | −9.1, −0.1 | −4.4 | −11.0, 2.2 | 0.18 |
| Difference at 3 months 3 | −1.0 | −5.4, 3.4 | −3.9 | −8.2, 0.5 | −2.9 | −9.3, 3.5 | 0.37 |
| Difference at 6 months | −0.1 | −3.8, 3.5 | −9.0 | −12.4, −5.6 | −8.9 | −13.9, −3.9 | 0.001 |
| Difference at 6 months 3 | −0.8 | −4.2, 2.6 | −8.4 | −11.6, −5.3 | −7.6 | −12.2, −2.9 | 0.002 |
| Vitamin E, IU | |||||||
| Difference at 3 months | −7.5 | −16.4, 1.4 | −5.4 | −14.2, 3.4 | 2.1 | −10.7, 14.8 | 0.75 |
| Difference at 3 months 3 | −9.0 | −17.6, −0.4 | −3.9 | −12.4, 4.6 | 5.1 | −7.3, 17.5 | 0.42 |
| Difference at 6 months | −5.0 | −16.4, 6.3 | −13.9 | −24.6, 3.2 | −8.9 | −24.6, 6.9 | 0.27 |
| Difference at 6 months 3 | −7.1 | −17.7, 3.5 | −12.1 | −22.1, −2.1 | −5.0 | −19.8, 9.8 | 0.50 |
| Folate, mcg | |||||||
| Difference at 3 months | −53.8 | −158.8, 51.2 | −31.7 | −135.1, 71.7 | 22.1 | −128.4, 172.7 | 0.77 |
| Difference at 3 months 3 | −83.3 | −175.8, 9.1 | −3.0 | −94.0, 88.0 | 80.4 | −53.3, 214.0 | 0.23 |
| Difference at 6 months | −9.6 | −138.5, 119.4 | −107.8 | −229.0, 13.4 | −98.2 | −276.7, 80.3 | 0.28 |
| Difference at 6 months 3 | −44.1 | −149.9, 61.7 | −77.3 | −176.7, 22.2 | −33.2 | −180.5, 114.1 | 0.65 |
| HEI−2015 family score | |||||||
| Difference at 3 months | 5.4 | 1.1, 11.8 | 7.4 | 1.0, 13.8 | −2.0 | −11.9, 7.2 | 0.66 |
| Difference at 3 months 3 | 6.8 | 0.8, 12.8 | 6.0 | 6.0, 11.9 | 0.8 | −7.8, 9.4 | 0.85 |
| Difference at 6 months | −0.6 | −7.8, 6.7 | 7.6 | 0.8, 14.4 | −8.2 | −18.1, 1.8 | 0.11 |
| Difference at 6 months 3 | 0.02 | −7.2, 7.0 | 7.1 | 0.3, 13.9 | −7.1 | −17.0, 2.9 | 0.16 |
| Within-Group Difference | Between-Group Difference | p-Value 2 | |||||
|---|---|---|---|---|---|---|---|
| Low Avocado Allotment 1 | High Avocado Allotment 1 | ||||||
| Mean | 95% CI | Mean | 95% CI | Mean | 95% CI | ||
| Fruit, cup equivalents | |||||||
| Difference at 3 months | −0.3 | −1.0, 0.5 | 0.7 | −0.1, 1.5 | −1.0 | −2.1, 0.2 | 0.09 |
| Difference at 3 months 3 | −0.3 | −1.1, 0.5 | 0.7 | −0.1, 1.5 | −1.0 | −2.2, 0.1 | 0.08 |
| Difference at 6 months | −0.2 | −1.1, 0.7 | 0.3 | −0.6, 1.1 | −0.5 | −1.7, 0.7 | 0.42 |
| Difference at 6 months 3 | −0.3 | −1.2, 0.5 | 0.4 | −0.4, 1.2 | −0.7 | −1.9, 0.5 | 0.23 |
| Vegetables, cup equivalents | |||||||
| Difference at 3 months | −0.2 | −0.9, 0.6 | 0.2 | −0.6, 0.9 | −0.3 | −1.4, 0.8 | 0.55 |
| Difference at 3 months 3 | −0.2 | −1.0, 0.5 | 0.3 | −0.5, 1.0 | −0.5 | −1.6, 0.6 | 0.36 |
| Difference at 6 months | 0.0 | −1.0, 1.0 | −0.4 | −1.4, 0.5 | 0.4 | −1.0, 1.8 | 0.57 |
| Difference at 6 months 3 | −0.1 | −1.1, 0.9 | −0.3 | −1.3, 0.6 | 0.2 | −1.2, 1.6 | 0.79 |
| Greens, cup equivalents | |||||||
| Difference at 3 months | −0.1 | −0.7, 0.6 | 0.2 | −0.5, 0.8 | −0.2 | −1.1, 0.7 | 0.63 |
| Difference at 3 months 3 | −0.1 | −0.7, 0.5 | 0.2 | −0.4, 0.8 | −0.3 | −1.2, 0.6 | 0.48 |
| Difference at 6 months | 0.1 | −0.7, 0.8 | −0.3 | −1.0, 0.5 | 0.4 | −0.7, 1.4 | 0.50 |
| Difference at 6 months 3 | 0.0 | −0.7, 0.8 | −0.2 | −0.9, 0.5 | 0.2 | −0.8, 1.2 | 0.67 |
| Legumes, cup equivalents | |||||||
| Difference at 3 months | −0.2 | −0.4, 0.0 | −0.2 | −0.4, 0.0 | −0.1 | −0.3, 0.2 | 0.66 |
| Difference at 3 months 3 | −0.3 | −0.4, −0.1 | −0.2 | −0.3, 0.0 | −0.1 | −0.4, 0.2 | 0.42 |
| Difference at 6 months | 0.0 | −0.2, 0.2 | −0.3 | −0.5, −0.1 | 0.3 | 0.0, 0.6 | 0.05 |
| Difference at 6 months 3 | 0.0 | −0.2, 0.2 | −0.3 | −0.5, −0.1 | 0.2 | 0.0, 0.5 | 0.08 |
| Dairy, cup equivalents | |||||||
| Difference at 3 months | −0.2 | −1.4, 0.9 | −1.5 | −2.6, −0.4 | 1.3 | −0.4, 2.9 | 0.12 |
| Difference at 3 months 3 | −0.4 | −1.5, 0.8 | −1.4 | −2.5, −0.2 | 1.0 | −0.6, 2.7 | 0.22 |
| Difference at 6 months | 0.1 | −1.0, 1.3 | −2.4 | −3.4, −1.3 | 2.5 | 1.0, 4.1 | 0.002 |
| Difference at 6 months 3 | 0.0 | −1.1, 1.0 | −2.2 | −3.2, −1.2 | 2.2 | 0.7, 3.7 | 0.004 |
| Nuts, ounce equivalents | |||||||
| Difference at 3 months | −0.2 | −0.9, 0.5 | −0.6 | −1.3, 0.1 | 0.3 | −0.6, 1.3 | 0.47 |
| Difference at 3 months 3 | −0.3 | −1.0, 0.4 | −0.5 | −1.2, 0.2 | 0.2 | −0.7, 1.2 | 0.64 |
| Difference at 6 months | −0.3 | −1.2, 0.7 | −1.0 | −1.9, 2.1 | 0.8 | −0.6, 2.1 | 0.25 |
| Difference at 6 months 3 | −0.4 | −1.3, 0.5 | −0.9 | −1.8, −0.1 | 0.5 | −0.8, 1.8 | 0.42 |
| Whole grains, ounce equivalents | |||||||
| Difference at 3 months | −0.1 | −1.0, 0.8 | −1.6 | −2.4, −0.7 | 1.4 | 0.1, 2.7 | 0.03 |
| Difference at 3 months 3 | −0.3 | −1.2, 0.5 | −1.4 | −2.2, −0.5 | 1.0 | −0.2, 2.2 | 0.09 |
| Difference at 6 months | −0.6 | −1.8, 0.7 | −1.9 | −3.1, −0.8 | 1.4 | −0.3, 3.0 | 0.11 |
| Difference at 6 months 3 | −0.8 | −1.9, 0.4 | −1.7 | −2.8, −0.7 | 1.0 | −0.6, 2.5 | 0.23 |
| Refined grains, ounce equivalents | |||||||
| Difference at 3 months | −2.4 | −6.4, 1.6 | −8.7 | −12.6, −4.7 | 6.3 | 0.5, 12.0 | 0.03 |
| Difference at 3 months 3 | −3.8 | −6.9, −0.6 | −7.4 | −10.5, −4.3 | 3.6 | −0.9, 8.1 | 0.12 |
| Difference at 6 months | 0.4 | −3.8, 4.6 | −9.2 | −13.2, −5.3 | 9.6 | 3.8, 15.4 | 0.002 |
| Difference at 6 months 3 | −0.8 | −4.0, 2.5 | −8.2 | −11.3, −5.2 | 7.4 | 2.9, 11.9 | 0.002 |
| Processed meats, ounce equivalents | |||||||
| Difference at 3 months | 0.0 | −0.6, 0.6 | −0.7 | −1.3, −0.1 | 0.7 | −0.2, 1.6 | 0.11 |
| Difference at 3 months 3 | −0.2 | −0.7, 0.4 | −0.6 | −1.1, 0.0 | 0.4 | −0.4, 1.2 | 0.27 |
| Difference at 6 months | 0.2 | −0.5, 0.9 | −0.8 | −1.5, −0.1 | 1.0 | 0.0, 2.0 | 0.06 |
| Difference at 6 months 3 | 0.1 | −0.6, 0.8 | −0.7 | −1.4, 0.0 | 0.8 | −0.2, 1.8 | 0.11 |
| Chicken and eggs, ounce equivalents | |||||||
| Difference at 3 months | −0.2 | −1.1, 0.8 | −1.5 | −2.4, −0.5 | 1.3 | −0.1, 2.6 | 0.06 |
| Difference at 3 months 3 | −0.3 | −1.2, 0.6 | −1.3 | −2.2, −0.4 | 1.0 | −0.3, 2.3 | 0.14 |
| Difference at 6 months | 1.1 | −0.3, 2.5 | −1.6 | −2.9, −0.2 | 2.7 | 0.7, 4.7 | 0.01 |
| Difference at 6 months 3 | 1.0 | −0.5, 2.4 | −1.5 | −2.8, −0.1 | 2.5 | 0.5, 4.4 | 0.02 |
| Fish, ounce equivalents | |||||||
| Difference at 3 months | 0.5 | −0.5, 1.5 | −0.2 | −1.2, 0.8 | 0.7 | −0.7, 2.1 | 0.32 |
| Difference at 3 months 3 | −0.3 | −0.6, 1.3 | −0.1 | −1.0, 0.9 | 0.4 | −1.0, 1.7 | 0.58 |
| Difference at 6 months | 0.3 | −0.4, 1.1 | −0.5 | −1.3, 0.2 | 0.9 | −0.2, 1.9 | 0.11 |
| Difference at 6 months 3 | 0.2 | −0.5, 1.0 | −0.5 | −1.2, 0.3 | 0.7 | −0.4, 1.6 | 0.19 |
| Red meat, ounce equivalents | |||||||
| Difference at 3 months | 0.1 | −1.0 1.0 | −0.7 | −1.7, 0.3 | 0.7 | −0.7, 2.2 | 0.32 |
| Difference at 3 months 3 | −0.2 | −1.1, 0.8 | −0.5 | −1.4, 0.5 | 0.3 | −1.1, 1.7 | 0.67 |
| Difference at 6 months | 0.2 | −0.7, 1.0 | −1.6 | −2.4, −0.7 | 1.7 | −0.5, 2.9 | 0.01 |
| Difference at 6 months 3 | 0.0 | −0.8, 0.8 | −1.4 | −2.1, −0.7 | 1.4 | −0.3, 2.5 | 0.01 |
| Sugar, teaspoon equivalents | |||||||
| Difference at 3 months | −4.2 | −12.3, 3.9 | −15.4 | −23.4, −7.5 | 11.2 | −0.3, 22.8 | 0.06 |
| Difference at 3 months 3 | −6.6 | −13.4, 0.3 | −13.1 | −19.9, −6.4 | 6.6 | −3.3, 16.4) | 0.19 |
| Difference at 6 months | −4.9 | −13.1, 3.2 | −12.2 | −19.8, −4.5 | 7.2 | −4.0, 18.5 | 0.20 |
| Difference at 6 months 3 | −7.1 | −13.6, −0.5 | −10.3 | −16.4, −4.1 | 3.2 | −5.8, 12.2 | 0.48 |
| Oils, g | |||||||
| Difference at 3 months | 1.6 | −9.9. 13.1 | −18.7 | −30.1, 7.4 | 20.3 | 3.9, 36.7 | 0.02 |
| Difference at 3 months 3 | −0.3 | −11.4, 10.9 | −16.9 | −27.9, −6.0 | 16.7 | −0.6, 32.7 | 0.04 |
| Difference at 6 months | −8.4 | −22.7, 5.9 | −23.1 | −36.5, −9.7 | 14.7 | −5.0, 34.4 | 0.14 |
| Difference at 6 months 3 | −11.8 | −23.8, 0.2 | −20.1 | −31.3, −8.8 | 8.3 | −8.3, 24.8 | 0.32 |
| Soymilk, cup equivalents | |||||||
| Difference at 3 months | 0.1 | −0.1 to −0.3 | 0.2 | 0.0, 0.4 | −0.1 | −0.4, 0.2 | 0.59 |
| Difference at 3 months 3 | 0.1 | −0.1 to 0.3 | 0.3 | 0.0, 0.4 | −0.1 | −0.4, 0.3 | 0.73 |
| Difference at 6 months | −0.1 | −0.4 to 0.2 | 0.0 | −0.3, 0.2 | −0.1 | −0.4, 0.3 | 0.80 |
| Difference at 6 months 3 | −0.1 | −0.4 to 0.2 | 0.0 | −0.3, 0.3 | −0.1 | −0.5, 0.4 | 0.78 |
| Soy, ounce equivalents | |||||||
| Difference at 3 months | 0.3 | −0.1 to 0.8 | 0.3 | −0.2, 0.8 | 0.0 | −0.7 to 0.6 | 0.98 |
| Difference at 3 months 3 | 0.3 | −0.1 to 0.8 | 0.3 | −0.1, 0.8 | 0.0 | −0.7 to 0.7 | 0.98 |
| Difference at 6 months | −0.1 | −0.8 to 0.6 | −0.3 | −0.9, 0.4 | 0.2 | −0.8 to 1.1 | 0.71 |
| Difference at 6 months 3 | −0.1 | −0.8 to 0.6 | −0.3 | −0.9, 0.4 | 0.2 | −0.8 to 1.1 | 0.74 |
Publisher’s Note: MDPI stays neutral with regard to jurisdictional claims in published maps and institutional affiliations. |
© 2021 by the authors. Licensee MDPI, Basel, Switzerland. This article is an open access article distributed under the terms and conditions of the Creative Commons Attribution (CC BY) license (https://creativecommons.org/licenses/by/4.0/).
Share and Cite
Pacheco, L.S.; Bradley, R.D.; Denenberg, J.O.; Anderson, C.A.M.; Allison, M.A. Effects of Different Allotments of Avocados on the Nutritional Status of Families: A Cluster Randomized Controlled Trial. Nutrients 2021, 13, 4021. https://doi.org/10.3390/nu13114021
Pacheco LS, Bradley RD, Denenberg JO, Anderson CAM, Allison MA. Effects of Different Allotments of Avocados on the Nutritional Status of Families: A Cluster Randomized Controlled Trial. Nutrients. 2021; 13(11):4021. https://doi.org/10.3390/nu13114021
Chicago/Turabian StylePacheco, Lorena S., Ryan D. Bradley, Julie O. Denenberg, Cheryl A. M. Anderson, and Matthew A. Allison. 2021. "Effects of Different Allotments of Avocados on the Nutritional Status of Families: A Cluster Randomized Controlled Trial" Nutrients 13, no. 11: 4021. https://doi.org/10.3390/nu13114021
APA StylePacheco, L. S., Bradley, R. D., Denenberg, J. O., Anderson, C. A. M., & Allison, M. A. (2021). Effects of Different Allotments of Avocados on the Nutritional Status of Families: A Cluster Randomized Controlled Trial. Nutrients, 13(11), 4021. https://doi.org/10.3390/nu13114021