Abstract
The EAT-Lancet Commission has proposed a model diet to improve the health of human beings and that of the planet. Recently, we proposed the Planetary Health Diet Index (PHDI) to assess adherence of the population to this model diet. In this study, we aimed to evaluate adherence to the PHDI and obesity outcomes using baseline data from 14,515 participants in the Brazilian Longitudinal Study of Adult Health (ELSA-Brasil). The dietary data were assessed using a 114-item FFQ. Body mass index (BMI) and waist circumference (WC) were both used continuously and categorized. Linear and multinomial regression models adjusted for potential confounding factors were performed to assess the relationship between adherence to PHDI and outcomes. An inverse association was observed between adherence to PHDI and obesity indicators. Individuals with high adherence to the PHDI had lower BMI (β−0.50 95% CI−0.73:−0.27) and WC (β−1.70 95% CI−2.28:−1.12) values. They were also 24% less likely to be overweight (OR 0.76 95% CI 0.67:0.85) or obese (OR 0.76 95% CI 0.65:0.88), and they were 14% and 27% less likely to have increased WC (OR 0.86 95% CI 0.75:0.98) or substantially increased WC (OR 0.73 95% CI 0.64:0.83) than those with lower adherence. Our results showed that higher adherence to the PHDI may decrease obesity indicators.
1. Introduction
Early in 2019, the EAT-Lancet Commission on “Healthy Diets from Sustainable Food Systems” (EAT-Lancet) published a scientific report on sustainable diets and proposed a healthy reference diet for human and planetary health, called the "planetary health diet" (PHD) [1]. The recommendations of this reference diet are based on human health impacts and the environmental impacts related to the food system. Briefly, this diet is focused on a predominant consumption of vegetables, fruits, whole grains, legumes, nuts, and unsaturated oils, includes a low-to-moderate consumption of seafood and poultry, and includes no or a low consumption of red meat, processed meat, added sugar, refined grains, and starchy vegetables [1].
The EAT-Lancet report estimates that following the recommendations for a healthy and sustainable diet could prevent 11 million deaths per year [1]. The proposed reference diet has been debated in scientific research [2] and it has been studied as a model for healthy and sustainable food intake in the context of local food cultures [3,4]. In addition, some authors have also compared the EAT-Lancet diet with the recommendations for a healthy diet in the US [5] and with the food consumption of the Indian population [6]. In terms of cost, the EAT-Lancet diet is affordable, except for the inhabitants of low–middle income countries, where it would cost around 89% of household income per capita [7,8].
The main purpose of the EAT-Lancet diet is to improve the health of the population and the planet, and for that, the report confirms that this reference diet is nutritionally balanced and has a low environmental impact. However, one study noted that adopting the PHD on a global scale would have different impacts on greenhouse gas emissions (GHGE) [9]. Studies that assess adherence to the EAT-Lancet recommendations in different scenarios and countries are of interest, and some initiatives to assess adherence to the EAT-Lancet recommendations have been proposed. The first was the EAT-Lancet diet score, which considers 14 food groups in a binary score and was inversely associated with ischemia heart disease and diabetes [10]. However, this index uses a binary score, which does not allow an accurate assessment of the adherence to the EAT-Lancet recommendations; in addition, it does not include all intermediate values and interchangeable groups, as proposed in the EAT-Lancet report itself [11].
Consequently, we recently proposed the Planetary Health Diet Index (PHDI), which consists of 16 components that score proportionally and consider all EAT-Lancet food groups in addition caloric density [12]. PHDI scores were associated with higher overall dietary quality and lower GHGE emission, in addition to differences according to sex, age, smoking status, and physical activity. [12]. However, the PHDI has not yet been tested in terms of associations with health outcomes. Thus, in this study, we aimed to assess the relationship between adherence to the EAT-Lancet recommendations assessed according to PHDI and obesity outcomes, as it is one of the main public health issues worldwide and an established associated factor in the development of non-communicable chronic diseases, such as diabetes and cardiovascular disease [13,14,15]. To achieve this purpose, we used data from the Brazilian Longitudinal Study of Adult Health (ELSA-Brasil), a well-established ongoing cohort study in Brazil.
2. Materials and Methods
2.1. Study Design
This study is a cross-sectional analysis of the baseline data from ELSA-Brasil, a multicenter and ongoing cohort study conducted in six Brazilian cities (São Paulo, Rio de Janeiro, Salvador, Porto Alegre, Belo Horizonte and Vitoria) from three major Brazilian regions (Northeast, Southeast, and South). The study design and data collection were described previously [16,17,18,19]. Briefly, ELSA-Brasil enrolled 15,105 civil servants from five universities and one research institute, with the following exclusion criteria: current or recent (4 months prior to the first interview) pregnancy, intention to quit working at the institution in the near future, severe cognitive or communication impairments, and, if retired, residence outside of a study center. Baseline data from ELSA-Brasil were collected between August 2008 and December 2010. ELSA-Brasil was approved by the research ethics committees of all the research centers. All the participants volunteered and signed an informed consent form. For the present analysis, we disregarded participants without food consumption, anthropometric, or covariates data; thus, the final sample for analysis included 14,515 individuals (Figure 1).
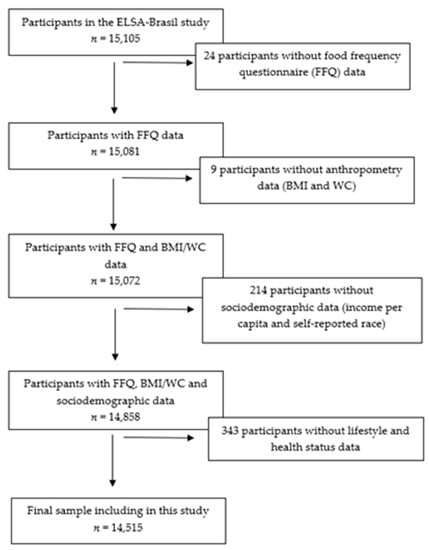
Figure 1.
Flow chart of the sample included in the study process. ELSA-Brasil, 2008–2010.
2.2. Diet Assessment
Food consumption was assessed using a previously developed and validated semi-quantitative FFQ with 114 food items [20,21]. This FFQ comprised the past 12 months and the questions were structured into three sections: (1) food products/food preparation; (2) measures of consumed products; and (3) consumption frequencies with eight response options (more than 3 times a day, 2–3 times a day, once a day, 5–6 times a week, 2–4 times a week, once a week, 1–3 times a month, and never/almost never).
The daily consumption of each FFQ item (in g/day) was obtained by multiplying the portion size by the corresponding frequency. The food measurements were then converted into nutrient intake using the United States Department of Agriculture (USDA) Food Composition Database, except when its values were outside the range of 80% to 120% of those described in the Brazilian Table of Food Composition, where the latter reference was used.
2.3. Planetary Health Diet Index
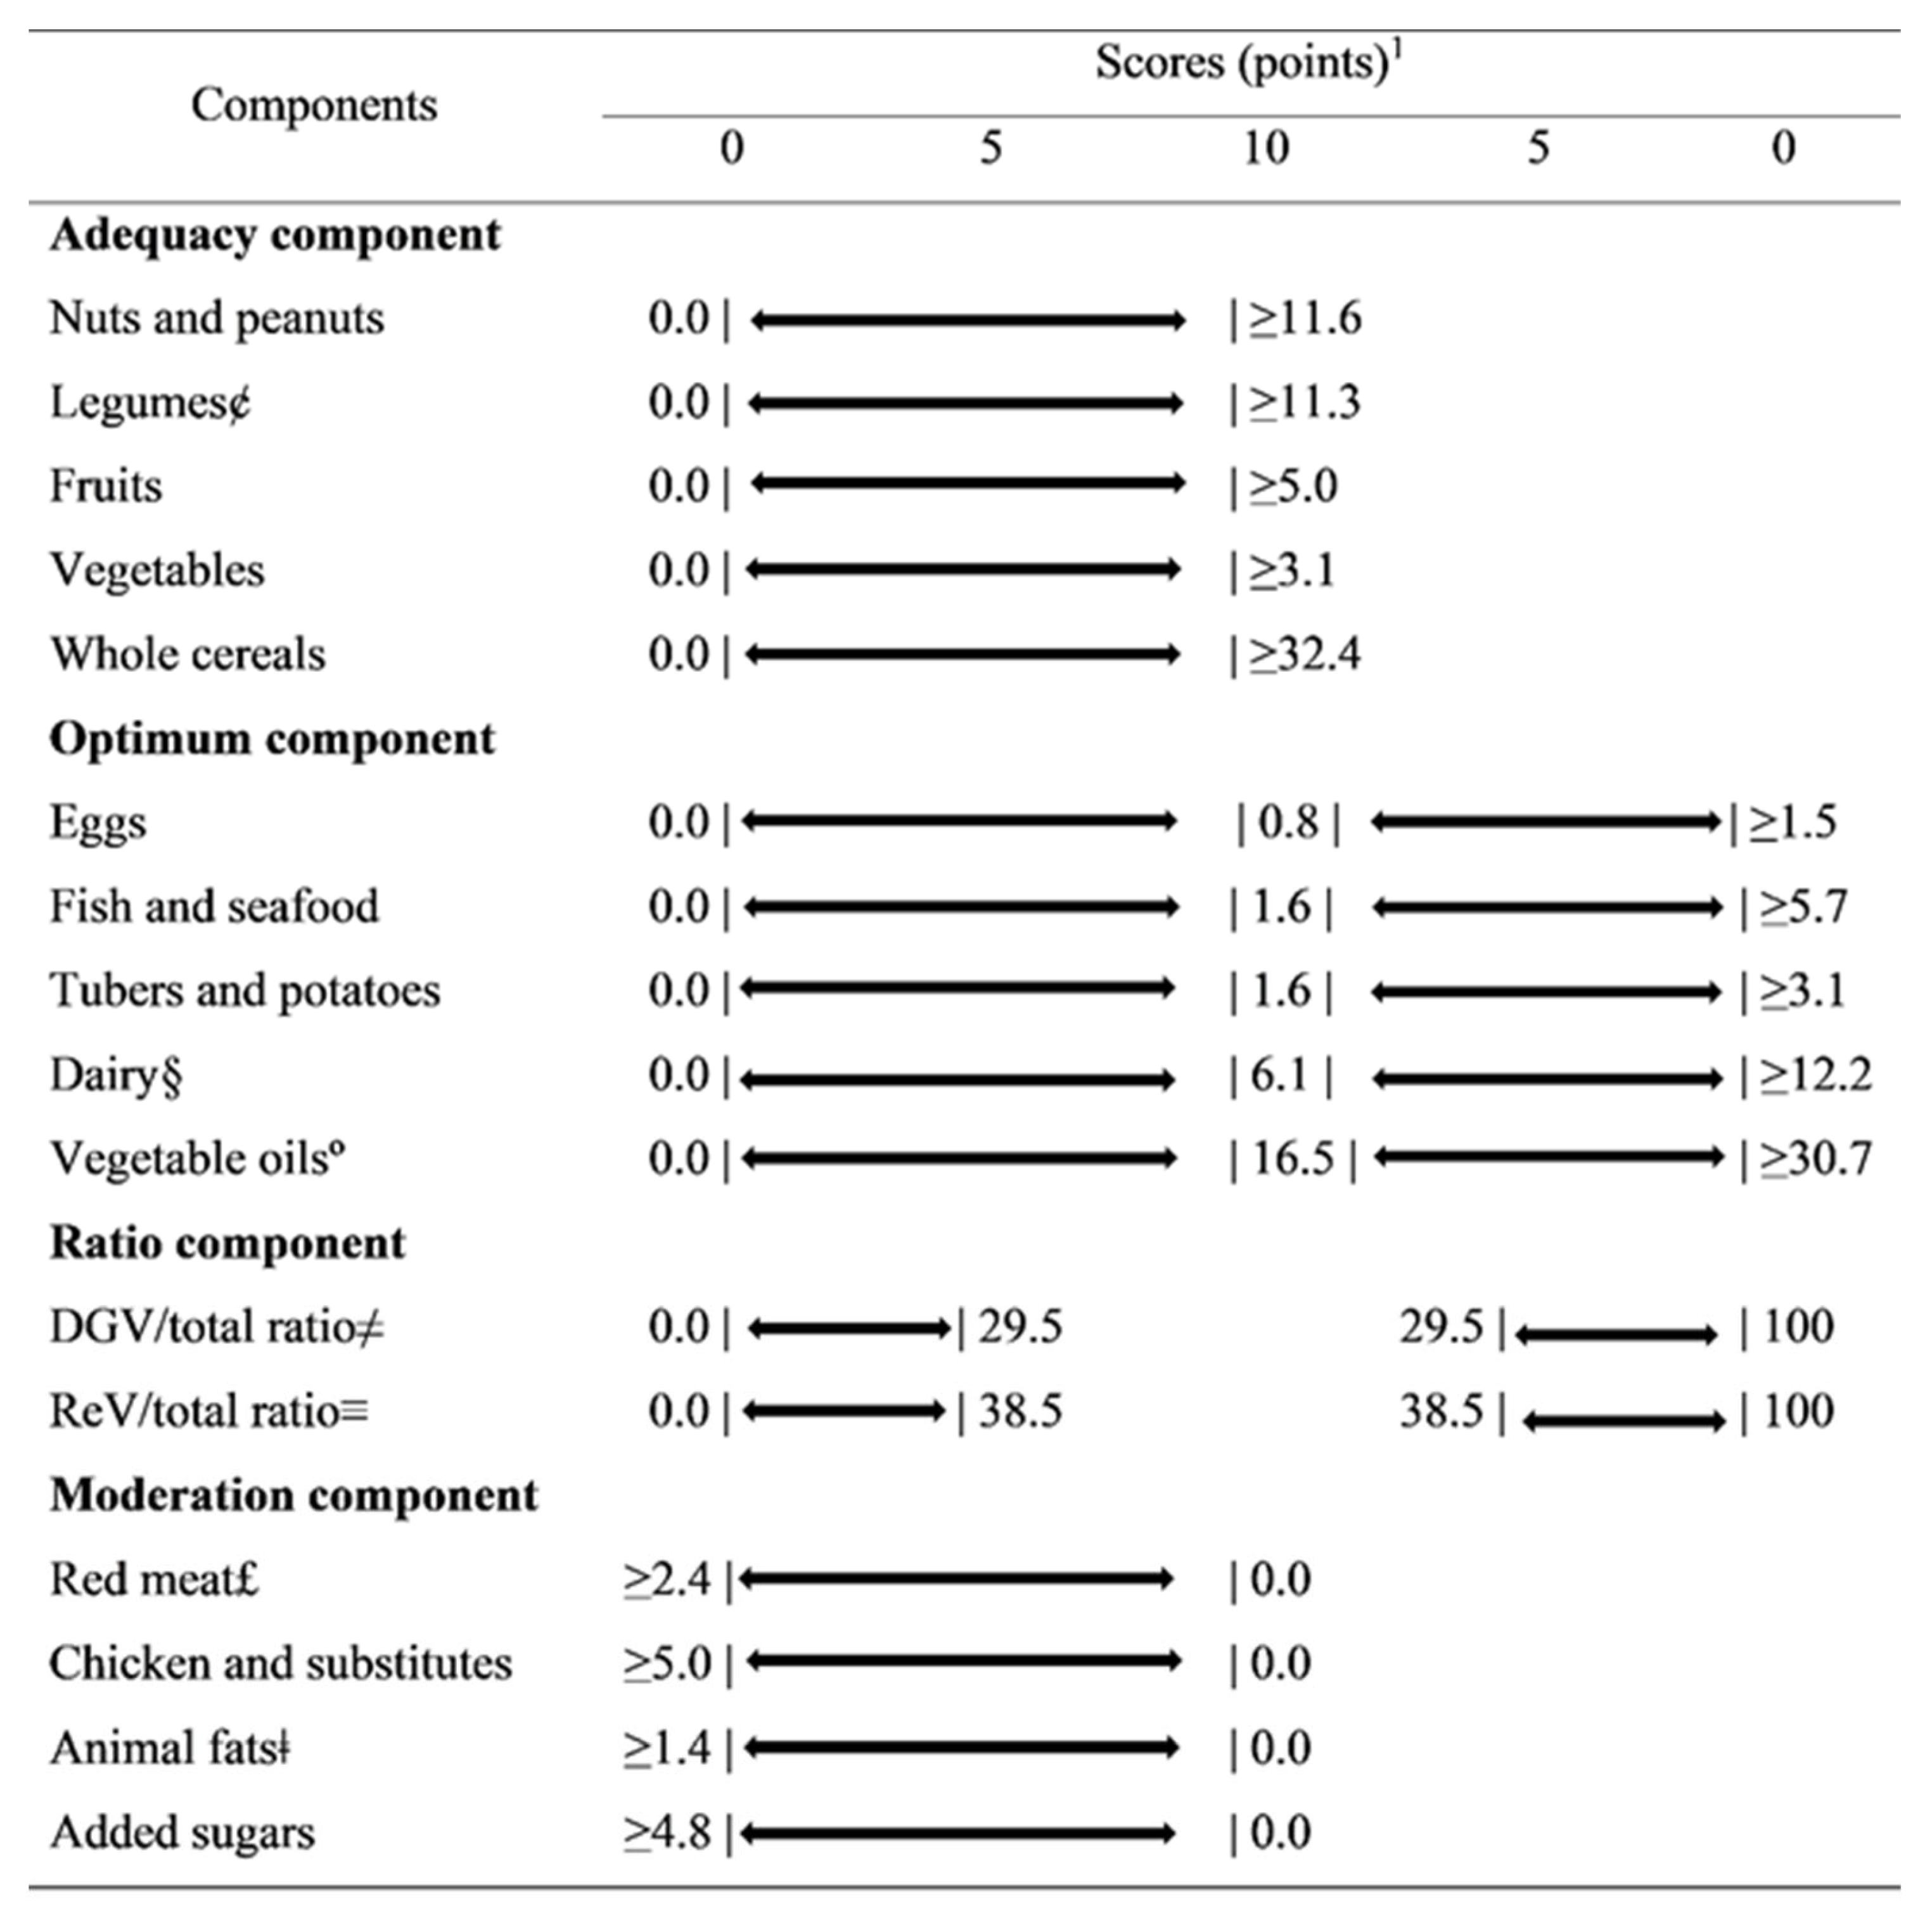
The Planetary Health Diet Index (PHDI) is based on the recommendations of the reference diet proposed by the EAT-Lancet Commission [1]. Its development and validation process were described previously [12]. Briefly, PHDI is a calorie-based index, since the ranges and midpoints proposed for each food group in the EAT-Lancet report are calculated as their energetic contribution to the reference diet, which makes it possible to assess adherence to EAT-Lancet recommendations regardless of the amount of calories consumed [12]. The index has 16 components, divided into 4 categories: (1) adequacy components (nuts and peanuts, legumes, fruits, total vegetables, and whole cereals); (2) optimum components (eggs, dairy products, fish and seafood, tubers and potatoes and vegetable oils); (3) ratio components (dark green vegetables/total vegetables and red and orange vegetables/total vegetables) and (4) moderation components (red meat, chickens and substitutes, animal fats and added sugars).
Each one of the 16 components can score proportionally between 0 and 5 or 10 points. The components in the adequacy, optimum and moderation categories can reach a maximum of 10 points, while the ratio components can score a maximum of 5 points, resulting in a total score from 0 to 150 points. More information regarding the cutoff points and scoring criteria can be obtained from Cacau et al. [12]. Figure 2 presents the PHDI components, cut-off points and scoring criteria. Table S1 shows examples of the foods and ingredients included in the PHDI components.
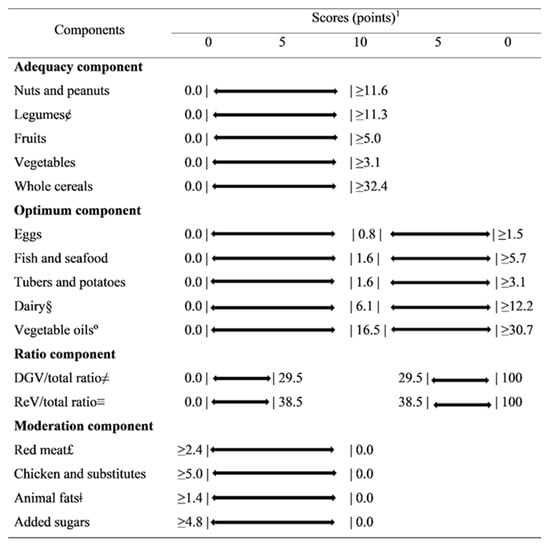
Figure 2.
Planetary Health Diet Index components, standards for scoring (caloric densities) and corresponding points values. 1 All values expressed as caloric densities from the reference diet proposed by the EAT-Lancet Commission. The bars represent the limits. £ Red meat: beef, lamb and pork. ¢ Legumes: beans and soy. § Dairy: excluding dairy fats. ° Unsaturated oils: including palm oil. ≠ DGV/total ratio: ratio between the energy intake of dark green vegetables (numerator) and the total of vegetables (denominator) multiplied by 10. ≡ ReV/total ratio: ratio between the energy intake of red and orange vegetables (numerator) and the total of vegetables (denominator) multiplied by 10. ǂ Animal fat: lard, tallow and dairy fats. DGV/total ratio: dark green vegetable/total ratio. ReV/total ratio: red vegetable/total ratio.
2.4. Outcome’s Assessment
The anthropometric measures of weight, height, and waist circumference (WC) were obtained using international criteria and standards techniques [18]. The body weight was measured with the subject barefoot, fasted, and wearing a standard uniform over their underwear. An electronic scale (Toledo®, model 2096PP) was used, with a capacity of 200 kg and a precision of 50 g. The height was measured with a wall stadiometer (Seca®, Hamburg, BRD) with a precision of 1 mm, attached to the wall, with the individual in a supine position, barefoot, leaning their head, buttocks, and heels against the wall and staring in the horizontal plane. The WC was measured with the participant fasted and with an empty bladder, standing upright, breathing normally, with their feet together, part of their standard uniform lifted, and with their arms crossed in front of their chest. The measurement was taken at the midpoint between the crest and the lower edge of the costal arch, using an inextensible tape.
The Body Mass Index (BMI) was calculated as weight (kg) divided by squared height (m2) [18]. The BMI and WC were treated as continuous variables and used to generate measures of obesity and abdominal obesity, respectively. BMI values <25 kg/m2 were considered adequate, ≥25 kg/m2 to <30 kg/m2 was considered overweight, and ≥30 kg/m2 as obesity [22]. A WC <80 cm for women and <94 cm for men was classified as adequate, ≥80 cm to <88 cm for women and ≥94 cm to 102 cm for men as increased WC, and ≥88 cm for women and ≥102 cm for men as an indicator of substantially increased risk [22].
2.5. Covariates
Each participant was interviewed at his or her workplace and visited the research center for clinical examinations, according to standard protocols. These interviews focused on sociodemographic characteristics, which were obtained using a general questionnaire [16]. The sociodemographic characteristics used were: sex, age, self-reported race and income per capita. The participants were classified according to sex (men and women) and according to age, as adults (34–59 years) and elderly (≥60 years). Self-reported race was classified as white, brown, black or other (Asian and Indigenous), according to previous ELSA-Brasil studies [17,18]. The self-reported income per capita was calculated as the total family monthly income divided by the number of family members, and the result then divided into terciles.
Smoking was stratified by nonsmokers, ex-smokers, and current smokers. Alcohol consumption was dichotomized into yes or no based on excessive alcohol consumption (those with an ethanol consumption ≥210 and ≥140 g/week, for men and women, respectively) [17,23]. The levels of physical activity during leisure time were classified as low, moderate, or vigorous, according to the International Physical Activity Questionnaire (≥150 min/week of moderate activity or ≥75 min/week of vigorous activity) [24].
Hypertension was defined as the reported use of medications to treat hypertension, a systolic blood pressure ≥140 mmHg, or a diastolic blood pressure ≥90 mmHg [19]. Diabetes was defined as a medical history of diabetes mellitus, the reported use of medications to treat diabetes mellitus, a fasting serum glucose >126 mg/dl, HbA1c levels 6.5%, or a 2 h oral glucose tolerance test >200 mg/dl [19]. Dyslipidemia was defined as the reported use of lipid-lowering treatment or an LDL cholesterol level >130 mg/dl [19].
2.6. Statistical Analysis
We compared the baseline characteristics of the participants according to quintiles of the PHDI scores. We calculated means and standard deviations (SD) or percentages for each variable across the quintiles. ANOVA or Pearson's chi-square tests were used to assess the statistical significance of differences between means or proportions, respectively.
Multiple linear regression models were used to assess the associations between PHDI scores and BMI and WC, respectively. Multiple multinomial logistic regression models were used to determine associations between the PHDI scores and the categories of BMI and WC. We used the PHDI scores, both categorized into quintiles and continuous (increase of 10 points in the total PHDI score), as explanatory variables. All the models were presented as age-adjusted models and fully adjusted models with sex, self-reported race, per capita family income, smoking, sporadic alcohol intake, diabetes, hypertension, dyslipidemia, total energy intake and dietary changes in the last six months, in addition to the age adjustment. We performed a sensitivity analysis excluding individuals below p1 and above p99 for total energy intake, as under- or over-reporters, respectively.
All the statistical analyses were performed using STATA® (Statistical Software for Professionals, College Station, TX, USA), version 14.2 and the p-value <0.05 was considered statistically significant.
3. Results
The baseline characteristics of the participants, according to the quintiles of the PHDI scores, are summarized in Table 1. Those with a higher PHDI (fifth quintile, Q5) were more likely to be elderly, white, or of other race, non-smokers, with a higher per capita income, no excessive alcohol consumption, higher physical activity levels, diabetes, hypertension, and lower total energy intake. The PHDI quintiles were also directly associated with lower BMI and WC values and lower prevalence of obesity and abdominal obesity.

Table 1.
Baseline characteristics of participants according to quintiles of the Planetary Health Diet Index. ELSA-Brasil, 2008–2010.
Table 2 presents crude and adjusted analyses of the continuous association between the quintiles of PHDI scores and BMI and WC. According to the fully adjusted analyses, the subjects with the higher PHDI scores (5th quintile, 5Q) demonstrated values of −0.50 kg/m2 for BMI (95%CI−0.73:−0.27) and −1.70 cm (95% CI−2.28:−1.12) for WC, when compared to individuals in the first quintile. An overall significant linear trend was observed for the association between the quintiles of the PHDI scores and the two outcomes (p < 0.001), even with the non-significance of some terciles. In addition, there was a decrease of −0.15 kg/m2 (95% CI−0.21:−0.08) in the BMI and −0.52 cm (95% CI−0.68:−0.36) in the WC for each 10-point increase in the PHDI score in the fully adjusted models.
Table 2.
Multiple linear regression of the association between the Planetary Health Diet Index and obesity indicators. ELSA-Brasil, 2008–2010.
The multinomial regression models suggested that higher PHDI scores (5th quintile, 5Q) were associated with a lower likelihood of obesity when compared with those in the first quintile (Table 3). The subjects with the higher PHDI scores were 24% less likely to be overweight (95% CI 0.67:0.85) or obese (95% CI 0.65:0.88) in the fully adjusted models. Similar results were found for abdominal obesity (Table 4), with those with higher PHDI scores being 14% and 27% likely to have increased abdominal obesity (95% CI 0.75:0.98) and substantially increased abdominal obesity (95%CI 0.64:0.83), respectively. In the fully adjusted model, a 10-point increase in PHDI score was associated with a 7% lower likelihood of being overweight (95% CI 0.90:0.97) and an 8% lower likelihood of obesity (95% CI 0.88:0.96) (Table 3), and with a 5% lower likelihood of having increased abdominal obesity (95% CI 0.92:0.99) and a 9% lower likelihood of having substantially increased abdominal obesity (95% CI 0.87:0.94) (Table 4). A significant linear trend was observed for the association between the quintiles of the PHDI scores and being overweight (p < 0.001), obesity (p < 0.001), and substantially increased abdominal obesity (p < 0.001).
Table 3.
Multiple multinomial logistic regression between Planetary Health Diet Index and overweight and obesity. ELSA-Brasil, 2008–2010.
Table 4.
Multiple multinomial logistic regression between Planetary Health Diet Index and overweight and obesity. ELSA-Brasil, 2008–2010.
In the sensitivity analysis, excluding individuals below p1 and above p99 from total energy intake had little effect on the magnitude of the associations, keeping the same directions for the associations between obesity and PHDI (Tables S2–S4).
4. Discussion
This is the first study to assess the association of a dietary caloric density index that scores gradually to assess adherence to EAT-Lancet recommendations with obesity outcomes. As a result, we observed an inverse association between adherence to EAT-Lancet recommendations–evaluated by higher scores on the planetary health diet index (PHDI)–and obesity indicators assessed by BMI and WC, both continuously and categorized, in participants from a large multicentric ongoing cohort study in Brazil. In our previous study, with the same population, we observed that higher PHDI scores were associated with higher overall dietary quality and lower GHGE emissions [12]. These results suggested that the EAT-Lancet [1] recommendations for a healthy and sustainable diet can be beneficial both for the environment and for human health, as they are associated with a lower risk of being overweight or obese, both of which are important factors associated with other chronic diseases, such as diabetes and cardiovascular diseases.
Few studies evaluated the association between healthy and sustainable diets and obesity and, as far as we know, only two studies evaluated the relationship between the EAT-Lancet recommendations and obesity indicators [10,25]. Shamah-Levy et al. [25] proposed an index based on the EAT-Lancet recommendations. Briefly, this index features 13 components that consider the percentage of energy from the EAT-Lancet cutoff points and uses an overall score from 0 to 13 points. In an analysis with a representative sample of 11,506 Mexican adults aged 20 to 59 years and of both genders, Shamah-Levy et al. [25] observed a lower prevalence of excess weight and obesity in individuals with ≥9 points in the index. After statistical adjustments, men with ≥9 points on the index were 14.3% less likely to be obese.
In another study, which evaluated 46,069 participants enrolled throughout the UK, in the European Prospective Investigation into Cancer and Nutrition (EPIC)-Oxford study, Knuppel et al. [10] observed a decrease of 1.4 kg/m2 in the BMI of individuals with ≥12 points on the EAT-Lancet diet score, a binary index that features14 components expressed in grams. These results are similar to those found in our study. However, the two indices mentioned use a binary scoring system and do not allow a better distribution of the population's adherence to dietary recommendations [26]. The PHDI uses a gradual scoring system, in addition to being a caloric density index [12]. In this way, the PHDI allows a more adequate distinction between the degrees of adherence of individuals, favoring an interpersonal distribution and a more refined association with the outcomes evaluated.
In addition to the aforementioned studies, which evaluated the relationship between obesity indicators and EAT-Lancet-based indices, there was a population-based study, carried out by Seconda et al. [27], which assessed the relationship between the Sustainable Diet Index (SDI) and excess weight and obesity in French adults participating in the NutriNet-Santé study. The SDI is an index that features four sub-indices (nutritional, environmental, economic, and food practices), which are scored from 1 to 5 points, resulting in an overall SDI score of 4 to 20 points. As a result, the authors observed that lower SDI scores were associated with a higher risk of obesity and being overweight, when compared to individuals with higher SDI scores [27].
Despite the limited number of studies evaluating the relationship between the EAT-Lancet recommendations or adherence to sustainable diets and obesity, there are studies that relate diets considered sustainable, such as the Mediterranean diet [28,29,30] and the DASH diet [31], with a lower risk of being overweight or obese [32,33,34]. Furthermore, following a plant-based diet can be healthy and sustainable as it tends to create lower GHGE emissions [31,35], as well as being associated with a lower risk of obesity. A prospective study [36] that evaluated a Plant-Based Dietary Index (PDI) with obesity, suggested that the consumption of more plant-based foods and limiting animal-based diets might reduce the risk of obesity [36].
However, despite the promising results, we observed that most of the population evaluated only achieved half of the possible points on the PHDI (0 to 150 points, mean population score: 60.4 points), indicating that this population had a low adherence to the recommendations for a healthy and sustainable diet [12]. A possible explanation for this may be the higher consumption of red meat by the Brazilian population [37,38]. In addition, low scores were reported in the nuts and whole grains groups, indicating low consumption of these foods [12]. However, even with the population reaching only half of the possible points, those individuals who demonstrated a higher adherence to the PHDI were less likely to be overweight or obese, indicating that following a healthy and sustainable diet can be beneficial to human health, in addition to planetary health.
Our study featured some strengths, such as its use of a validated index that associated higher overall dietary quality and lower GHGE emissions. In addition, we used data from a well-established multicenter cohort study in Brazil, which followed strict data collection and processing protocols. However, some limitations may be noted as well. For instance, these results must be considered within the context of the study design. This was a cross-sectional analysis, which can evaluate association, but not causality. In addition, food consumption was assessed using an FFQ, an instrument that, despite being one of the most commonly used methods in epidemiological studies for evaluating the relationship between diet and health outcomes, still features some limitations, such as the finitude of its foods list and dietary misreporting bias. ELSA-Brasil is designed to assess risk factors and associations with cardiovascular diseases and diabetes, but it is not a population-based study, despite being a multicenter study from six different Brazilian cities across three major Brazilian regions. However, this characteristic allowed the inclusion of a population whose ethnic and social diversity was similar to that of heterogeneous populations, mainly of middle income, who live in large cities in Brazil. Thus, our external validity can be extended to urban centers with similar characteristics inside and outside Brazil.
In conclusion, we observed that higher PHDI scores were inversely associated with excess weight and obesity, as measured by both BMI and WC. These results demonstrate that the recommendations for a healthy and sustainable diet proposed by the EAT-Lancet have beneficial effects on human health, as they decrease the likelihood of being overweight or obese, which are risk factors for non-communicable chronic diseases, such as diabetes and cardiovascular disease. Furthermore, these results can offer important support for public policy planning and guidelines on the benefits of healthy and sustainable diets, with an emphasis on the proposal by the EAT-Lancet Commission.
Supplementary Materials
The following Supplementary Materials are available online at https://www.mdpi.com/article/10.3390/nu13113691/s1. Table S1. Foods and ingredients included in the PHDI components; Table S2. Multiple linear regression of the association between the Planetary Health Diet Index and obesity indicators without under and overreporting of energy intake. ELSA-Brasil, 2008–2010; Table S3. Multiple multinomial logistic regression between Planetary Health Diet Index and excess weight and obesity without under- and over-reporting of energy intake. ELSA-Brasil, 2008–2010; Table S4. Multiple multinomial logistic regression between Planetary Health Diet Index and abdominal obesity without under- and over-reporting of energy intake. ELSA-Brasil, 2008–2010.
Author Contributions
Conceptualization, L.T.C., L.A.M. and D.M.M.; methodology, L.T.C.; formal analysis, L.T.C.; investigation, L.T.C.; resources, I.M.B. and P.A.L.; data curation, L.T.C.; writing—original draft preparation, L.T.C.; writing—review and editing, L.T.C., I.M.B., A.C.G., L.O.C., P.A.L., L.A.M. and D.M.M.; visualization, L.T.C.; supervision, L.A.M. and D.M.M.; project administration, L.A.M. and D.M.M. All authors have read and agreed to the published version of the manuscript.
Funding
The ELSA-Brasil baseline study was supported by the Brazilian Ministry of Health (Science and Technology Department) and the Brazilian Ministry of Science and Technology and National Research Council grants 01 06 0010.00 RS, 01 06 0212.00 BA, 01 06 0300.00 ES, 01 06 0278.00 MG, 01 06 0115.00 SP and 01 06 0071.00 RJ). The research center of São Paulo was also supported by the São Paulo Research Foundation (FAPESP; grant 2011/12256-4). Leandro Teixeira Cacau received a doctoral scholarship (grant number 2019/13424-0) and a research internship abroad scholarship (grant number 2020/12326-1) from the Sao Paulo Research Foundation (FAPESP). No funding agencies had a role in the study design, data collection, analysis, decision to publish, or preparation of the article.
Institutional Review Board Statement
This study was conducted according to the guidelines laid down in the Declaration of Helsinki, and all procedures involving study participants were approved by the research ethics committees of all research centers. The present study was also approved by the research ethics committee of the School of Public Health of the University of São Paulo (number 3.970.703).
Informed Consent Statement
All participants volunteered and signed an informed consent form.
Conflicts of Interest
The authors declare no conflict of interest.
References
- Willett, W.; Rockström, J.; Loken, B.; Springmann, M.; Lang, T.; Vermeulen, S.; Garnett, T.; Tilman, D.; DeClerck, F.; Wood, A.; et al. Food in the Anthropocene: The EAT-Lancet Commission on healthy diets from sustainable food systems. Lancet 2019, 393, 447–492. [Google Scholar] [CrossRef]
- Springmann, M.; Afshin, A.; Rivera, J.A.; Wang, D.D.; Willett, W. The Benefits of the EAT-Lancet Commission’s Dietary Recommendations Are Significant and Robust. J. Nutr. 2020, 150, 2837–2838. [Google Scholar] [CrossRef] [PubMed]
- Tucci, M.; Martini, D.; Del Bo, C.; Marino, M.; Battezzati, A.; Bertoli, S.; Porrini, M.; Riso, P. An Italian-Mediterranean Dietary Pattern Developed Based on the EAT-Lancet Reference Diet (EAT-IT): A Nutritional Evaluation. Foods 2021, 10, 558. [Google Scholar] [CrossRef]
- Lassen, A.D.; Christensen, L.M.; Trolle, E. Development of a Danish Adapted Healthy Plant-Based Diet Based on the EAT-Lancet Reference Diet. Nutrients 2020, 12, 738. [Google Scholar] [CrossRef] [Green Version]
- Blackstone, N.T.; Conrad, Z. Comparing the Recommended Eating Patterns of the EAT-Lancet Commission and Dietary Guidelines for Americans: Implications for Sustainable Nutrition. Curr. Dev. Nutr. 2020, 4, nzaa015. [Google Scholar] [CrossRef] [Green Version]
- Sharma, M.; Kishore, A.; Roy, D.; Joshi, K. A comparison of the Indian diet with the EAT-Lancet reference diet. BMC Public Health 2020, 20, 812. [Google Scholar] [CrossRef]
- Drewnowski, A. Analysing the affordability of the EAT-Lancet diet. Lancet. Glob. Health 2020, 8, e6–e7. [Google Scholar] [CrossRef]
- Hirvonen, K.; Bai, Y.; Headey, D.; Masters, W.A. Affordability of the EAT-Lancet reference diet: A global analysis. Lancet. Glob. Health 2020, 8, e59–e66. [Google Scholar] [CrossRef] [Green Version]
- Semba, R.D.; de Pee, S.; Kim, B.; McKenzie, S.; Nachman, K.; Bloem, M.W. Adoption of the ‘planetary health diet’ has different impacts on countries’ greenhouse gas emissions. Nat. Food 2020, 1, 481–484. [Google Scholar] [CrossRef]
- Knuppel, A.; Papier, K.; Key, T.J.; Travis, R.C. EAT-Lancet score and major health outcomes: The EPIC-Oxford study. Lancet 2019, 394, 213–214. [Google Scholar] [CrossRef] [Green Version]
- Harcombe, Z. This is not the EAT-Lancet Diet. Lancet 2020, 395, 271–272. [Google Scholar] [CrossRef] [Green Version]
- Cacau, L.T.; De Carli, E.; de Carvalho, A.M.; Lotufo, P.A.; Moreno, L.A.; Bensenor, I.M.; Marchioni, D.M. Development and Validation of an Index Based on EAT-Lancet Recommendations: The Planetary Health Diet Index. Nutrients 2021, 13, 1698. [Google Scholar] [CrossRef]
- Chooi, Y.C.; Ding, C.; Magkos, F. The epidemiology of obesity. Metab. Clin. Exp. 2019, 92, 6–10. [Google Scholar] [CrossRef] [Green Version]
- Singh, G.M.; Danaei, G.; Farzadfar, F.; Stevens, G.A.; Woodward, M.; Wormser, D.; Kaptoge, S.; Whitlock, G.; Qiao, Q.; Lewington, S.; et al. The age-specific quantitative effects of metabolic risk factors on cardiovascular diseases and diabetes: A pooled analysis. PLoS ONE 2013, 8, e65174. [Google Scholar] [CrossRef] [PubMed]
- Afshin, A.; Forouzanfar, M.H.; Reitsma, M.B.; Sur, P.; Estep, K.; Lee, A.; Marczak, L.; Mokdad, A.H.; Moradi-Lakeh, M.; Naghavi, M.; et al. Health Effects of Overweight and Obesity in 195 Countries over 25 Years. New Engl. J. Med. 2017, 377, 13–27. [Google Scholar] [CrossRef] [PubMed]
- Bensenor, I.M.; Griep, R.H.; Pinto, K.A.; Faria, C.P.d.; Felisbino-Mendes, M.; Caetano, E.I.; Albuquerque, L.d.S.; Schmidt, M.I. Rotinas de organização de exames e entrevistas no centro de investigação ELSA-Brasil. Rev. De Saude Publica 2013, 47, 37–47. [Google Scholar] [CrossRef] [Green Version]
- Schmidt, M.I.; Duncan, B.B.; Mill, J.G.; Lotufo, P.A.; Chor, D.; Barreto, S.M.; Aquino, E.M.; Passos, V.M.A.; Matos, S.M.; Molina, M.d.C.B.; et al. Cohort Profile: Longitudinal Study of Adult Health (ELSA-Brasil). Int. J. Epidemiol. 2014, 44, 68–75. [Google Scholar] [CrossRef] [PubMed] [Green Version]
- Aquino, E.M.; Barreto, S.M.; Bensenor, I.M.; Carvalho, M.S.; Chor, D.; Duncan, B.B.; Lotufo, P.A.; Mill, J.G.; Molina Mdel, C.; Mota, E.L.; et al. Brazilian Longitudinal Study of Adult Health (ELSA-Brasil): Objectives and design. Am. J. Epidemiol. 2012, 175, 315–324. [Google Scholar] [CrossRef] [Green Version]
- Mill, J.G.; Pinto, K.; Griep, R.H.; Goulart, A.; Foppa, M.; Lotufo, P.A.; Maestri, M.K.; Ribeiro, A.L.; Andreão, R.V.; Dantas, E.M.; et al. Aferições e exames clínicos realizados nos participantes do ELSA-Brasil. Rev. De Saude Publica 2013, 47, 54–62. [Google Scholar] [CrossRef]
- Molina, M.d.C.B.; Benseñor, I.M.; Cardoso, L.d.O.; Velasquez-Melendez, G.; Drehmer, M.; Pereira, T.S.S.; Faria, C.P.d.; Melere, C.; Manato, L.; Gomes, A.L.C.; et al. Reprodutibilidade e validade relativa do Questionário de Frequência Alimentar do ELSA-Brasil. Cad. De Saúde Pública 2013, 29, 379–389. [Google Scholar] [CrossRef]
- Molina, M.d.C.B.; Faria, C.P.d.; Cardoso, L.d.O.; Drehmer, M.; Velasquez-Meléndez, J.G.; Gomes, A.L.C.; Melere, C.; Diniz, M.d.F.H.S.; Sichieri, R.; Benseñor, I.J.M. Diet assessment in the Brazilian Longitudinal Study of Adult Health (ELSA-Brasil): Development of a food frequency questionnaire. Rev. De Nutr. 2013, 26, 167–176. [Google Scholar] [CrossRef] [Green Version]
- World Health Organization. Obesity: Preventing and Managing the Global Epidemic: Report of a WHO Consultation on Obesity, Geneva, 3–5 June 1997; World Health Organization: Geneva, Switzerland, 1998. [Google Scholar]
- Piccinelli, M.; Tessari, E.; Bortolomasi, M.; Piasere, O.; Semenzin, M.; Garzotto, N.; Tansella, M. Efficacy of the alcohol use disorders identification test as a screening tool for hazardous alcohol intake and related disorders in primary care: A validity study. BMJ 1997, 314, 420–424. [Google Scholar] [CrossRef] [Green Version]
- Craig, C.L.; Marshall, A.L.; Sjöström, M.; Bauman, A.E.; Booth, M.L.; Ainsworth, B.E.; Pratt, M.; Ekelund, U.; Yngve, A.; Sallis, J.F.; et al. International physical activity questionnaire: 12-country reliability and validity. Med. Sci. Sports Exerc. 2003, 35, 1381–1395. [Google Scholar] [CrossRef] [Green Version]
- Shamah-Levy, T.; Gaona-Pineda, E.B.; Mundo-Rosas, V.; Méndez Gómez-Humarán, I.; Rodríguez-Ramírez, S. Asociación de un índice de dieta saludable y sostenible con sobrepeso y obesidad en adultos mexicanos. Salud Pública México 2020, 62, 745–753. [Google Scholar] [CrossRef]
- Burggraf, C.; Teuber, R.; Brosig, S.; Meier, T. Review of a priori dietary quality indices in relation to their construction criteria. Nutr. Rev. 2018, 76, 747–764. [Google Scholar] [CrossRef] [PubMed] [Green Version]
- Seconda, L.; Egnell, M.; Julia, C.; Touvier, M.; Hercberg, S.; Pointereau, P.; Lairon, D.; Allès, B.; Kesse-Guyot, E. Association between sustainable dietary patterns and body weight, overweight, and obesity risk in the NutriNet-Santé prospective cohort. Am. J. Clin. Nutr. 2020, 112, 138–149. [Google Scholar] [CrossRef]
- Burlingame, B.; Dernini, S. Sustainable diets: The Mediterranean diet as an example. Public Health Nutr. 2011, 14, 2285–2287. [Google Scholar] [CrossRef] [Green Version]
- Dernini, S.; Berry, E.M.; Serra-Majem, L.; La Vecchia, C.; Capone, R.; Medina, F.X.; Aranceta-Bartrina, J.; Belahsen, R.; Burlingame, B.; Calabrese, G.; et al. Med Diet 4.0: The Mediterranean diet with four sustainable benefits. Public Health Nutr. 2017, 20, 1322–1330. [Google Scholar] [CrossRef] [PubMed]
- Germani, A.; Vitiello, V.; Giusti, A.M.; Pinto, A.; Donini, L.M.; del Balzo, V. Environmental and economic sustainability of the Mediterranean Diet. Int. J. Food Sci. Nutr. 2014, 65, 1008–1012. [Google Scholar] [CrossRef] [PubMed]
- Nelson, M.E.; Hamm, M.W.; Hu, F.B.; Abrams, S.A.; Griffin, T.S. Alignment of Healthy Dietary Patterns and Environmental Sustainability: A Systematic Review. Adv. Nutr. 2016, 7, 1005–1025. [Google Scholar] [CrossRef] [Green Version]
- Shatwan, I.M.; Alhinai, E.A.; Alawadhi, B.; Surendran, S.; Aljefree, N.M.; Almoraie, N.M. High Adherence to the Mediterranean Diet Is Associated with a Reduced Risk of Obesity among Adults in Gulf Countries. Nutrients 2021, 13, 995. [Google Scholar] [CrossRef] [PubMed]
- D’Innocenzo, S.; Biagi, C.; Lanari, M. Obesity and the Mediterranean Diet: A Review of Evidence of the Role and Sustainability of the Mediterranean Diet. Nutrients 2019, 11, 1306. [Google Scholar] [CrossRef] [PubMed] [Green Version]
- Soltani, S.; Shirani, F.; Chitsazi, M.J.; Salehi-Abargouei, A. The effect of dietary approaches to stop hypertension (DASH) diet on weight and body composition in adults: A systematic review and meta-analysis of randomized controlled clinical trials. Obes. Rev. 2016, 17, 442–454. [Google Scholar] [CrossRef]
- Fresán, U.; Sabaté, J. Vegetarian Diets: Planetary Health and Its Alignment with Human Health. Adv. Nutr. 2019, 10, S380–S388. [Google Scholar] [CrossRef] [PubMed] [Green Version]
- Wang, Y.B.; Shivappa, N.; Hébert, J.R.; Page, A.J.; Gill, T.K.; Melaku, Y.A. Association between Dietary Inflammatory Index, Dietary Patterns, Plant-Based Dietary Index and the Risk of Obesity. Nutrients 2021, 13, 1536. [Google Scholar] [CrossRef]
- Carvalho, A.M.d.; César, C.L.G.; Fisberg, R.M.; Marchioni, D.M.L. Excessive meat consumption in Brazil: Diet quality and environmental impacts. Public Health Nutr. 2012, 16, 1893–1899. [Google Scholar] [CrossRef] [Green Version]
- Carvalho, A.M.d.; Selem, S.S.a.d.C.; Miranda, A.M.; Marchioni, D.M. Excessive red and processed meat intake: Relations with health and environment in Brazil. Br. J. Nutr. 2016, 115, 2011–2016. [Google Scholar] [CrossRef] [Green Version]

Publisher’s Note: MDPI stays neutral with regard to jurisdictional claims in published maps and institutional affiliations. |
© 2021 by the authors. Licensee MDPI, Basel, Switzerland. This article is an open access article distributed under the terms and conditions of the Creative Commons Attribution (CC BY) license (https://creativecommons.org/licenses/by/4.0/).