
The iMPROVE Study; Design, Dietary Patterns, and Development of a Lifestyle Index in Overweight and Obese Greek Adults

 ,
,  ,
,  ,
, 
Abstract
:1. Introduction
2. Materials and Methods
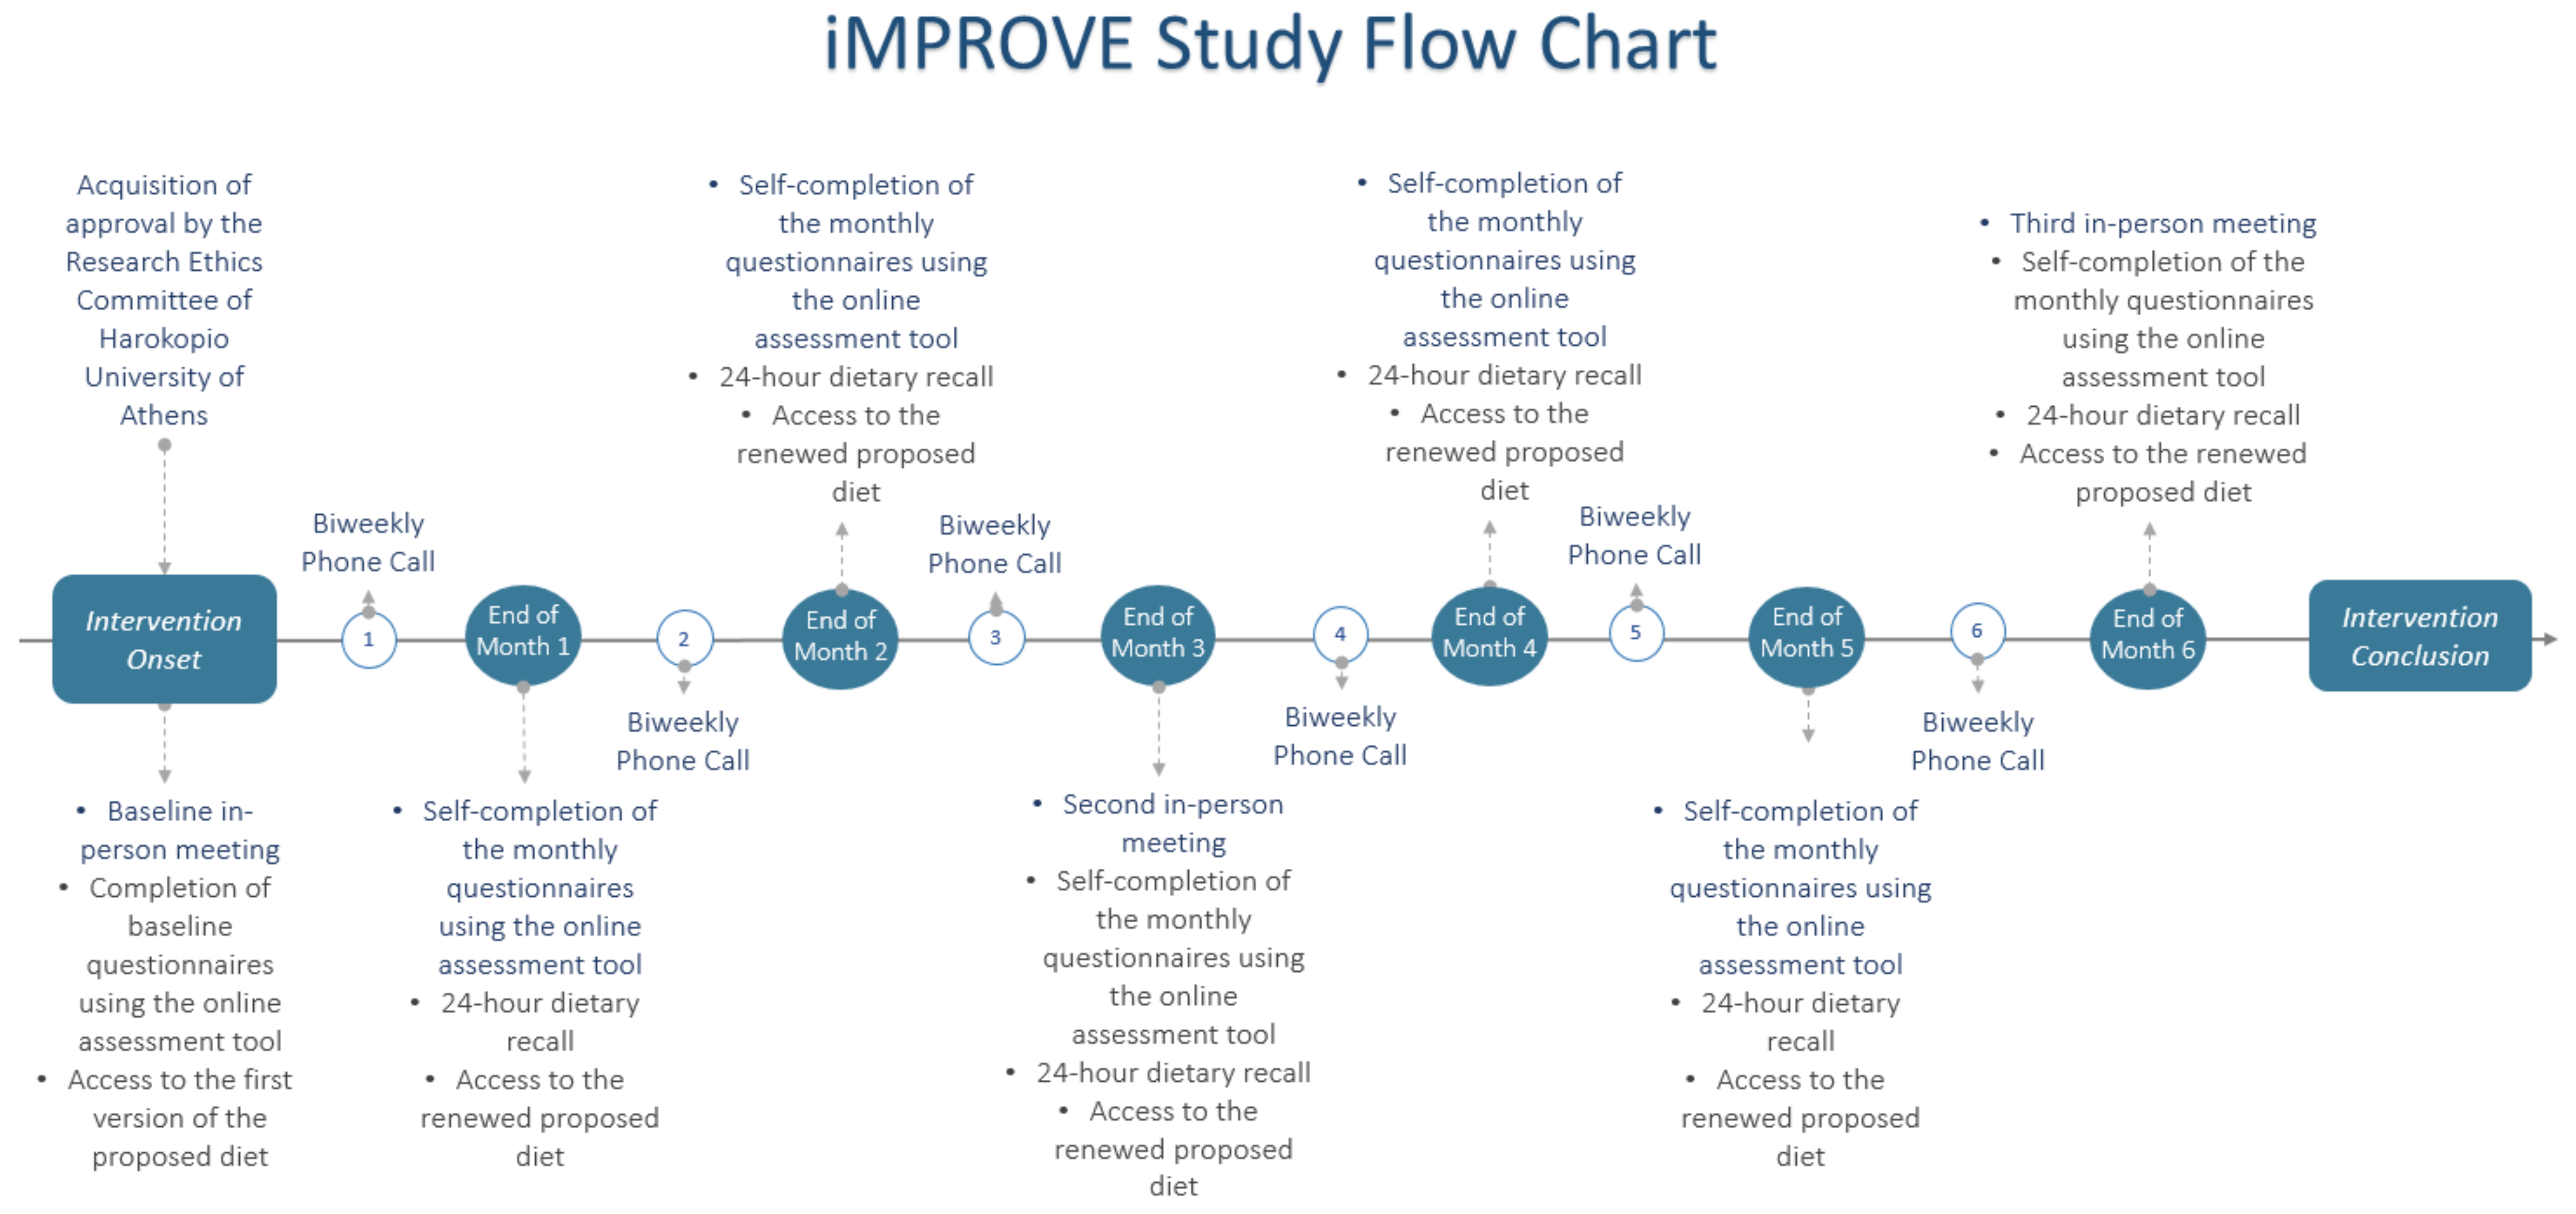
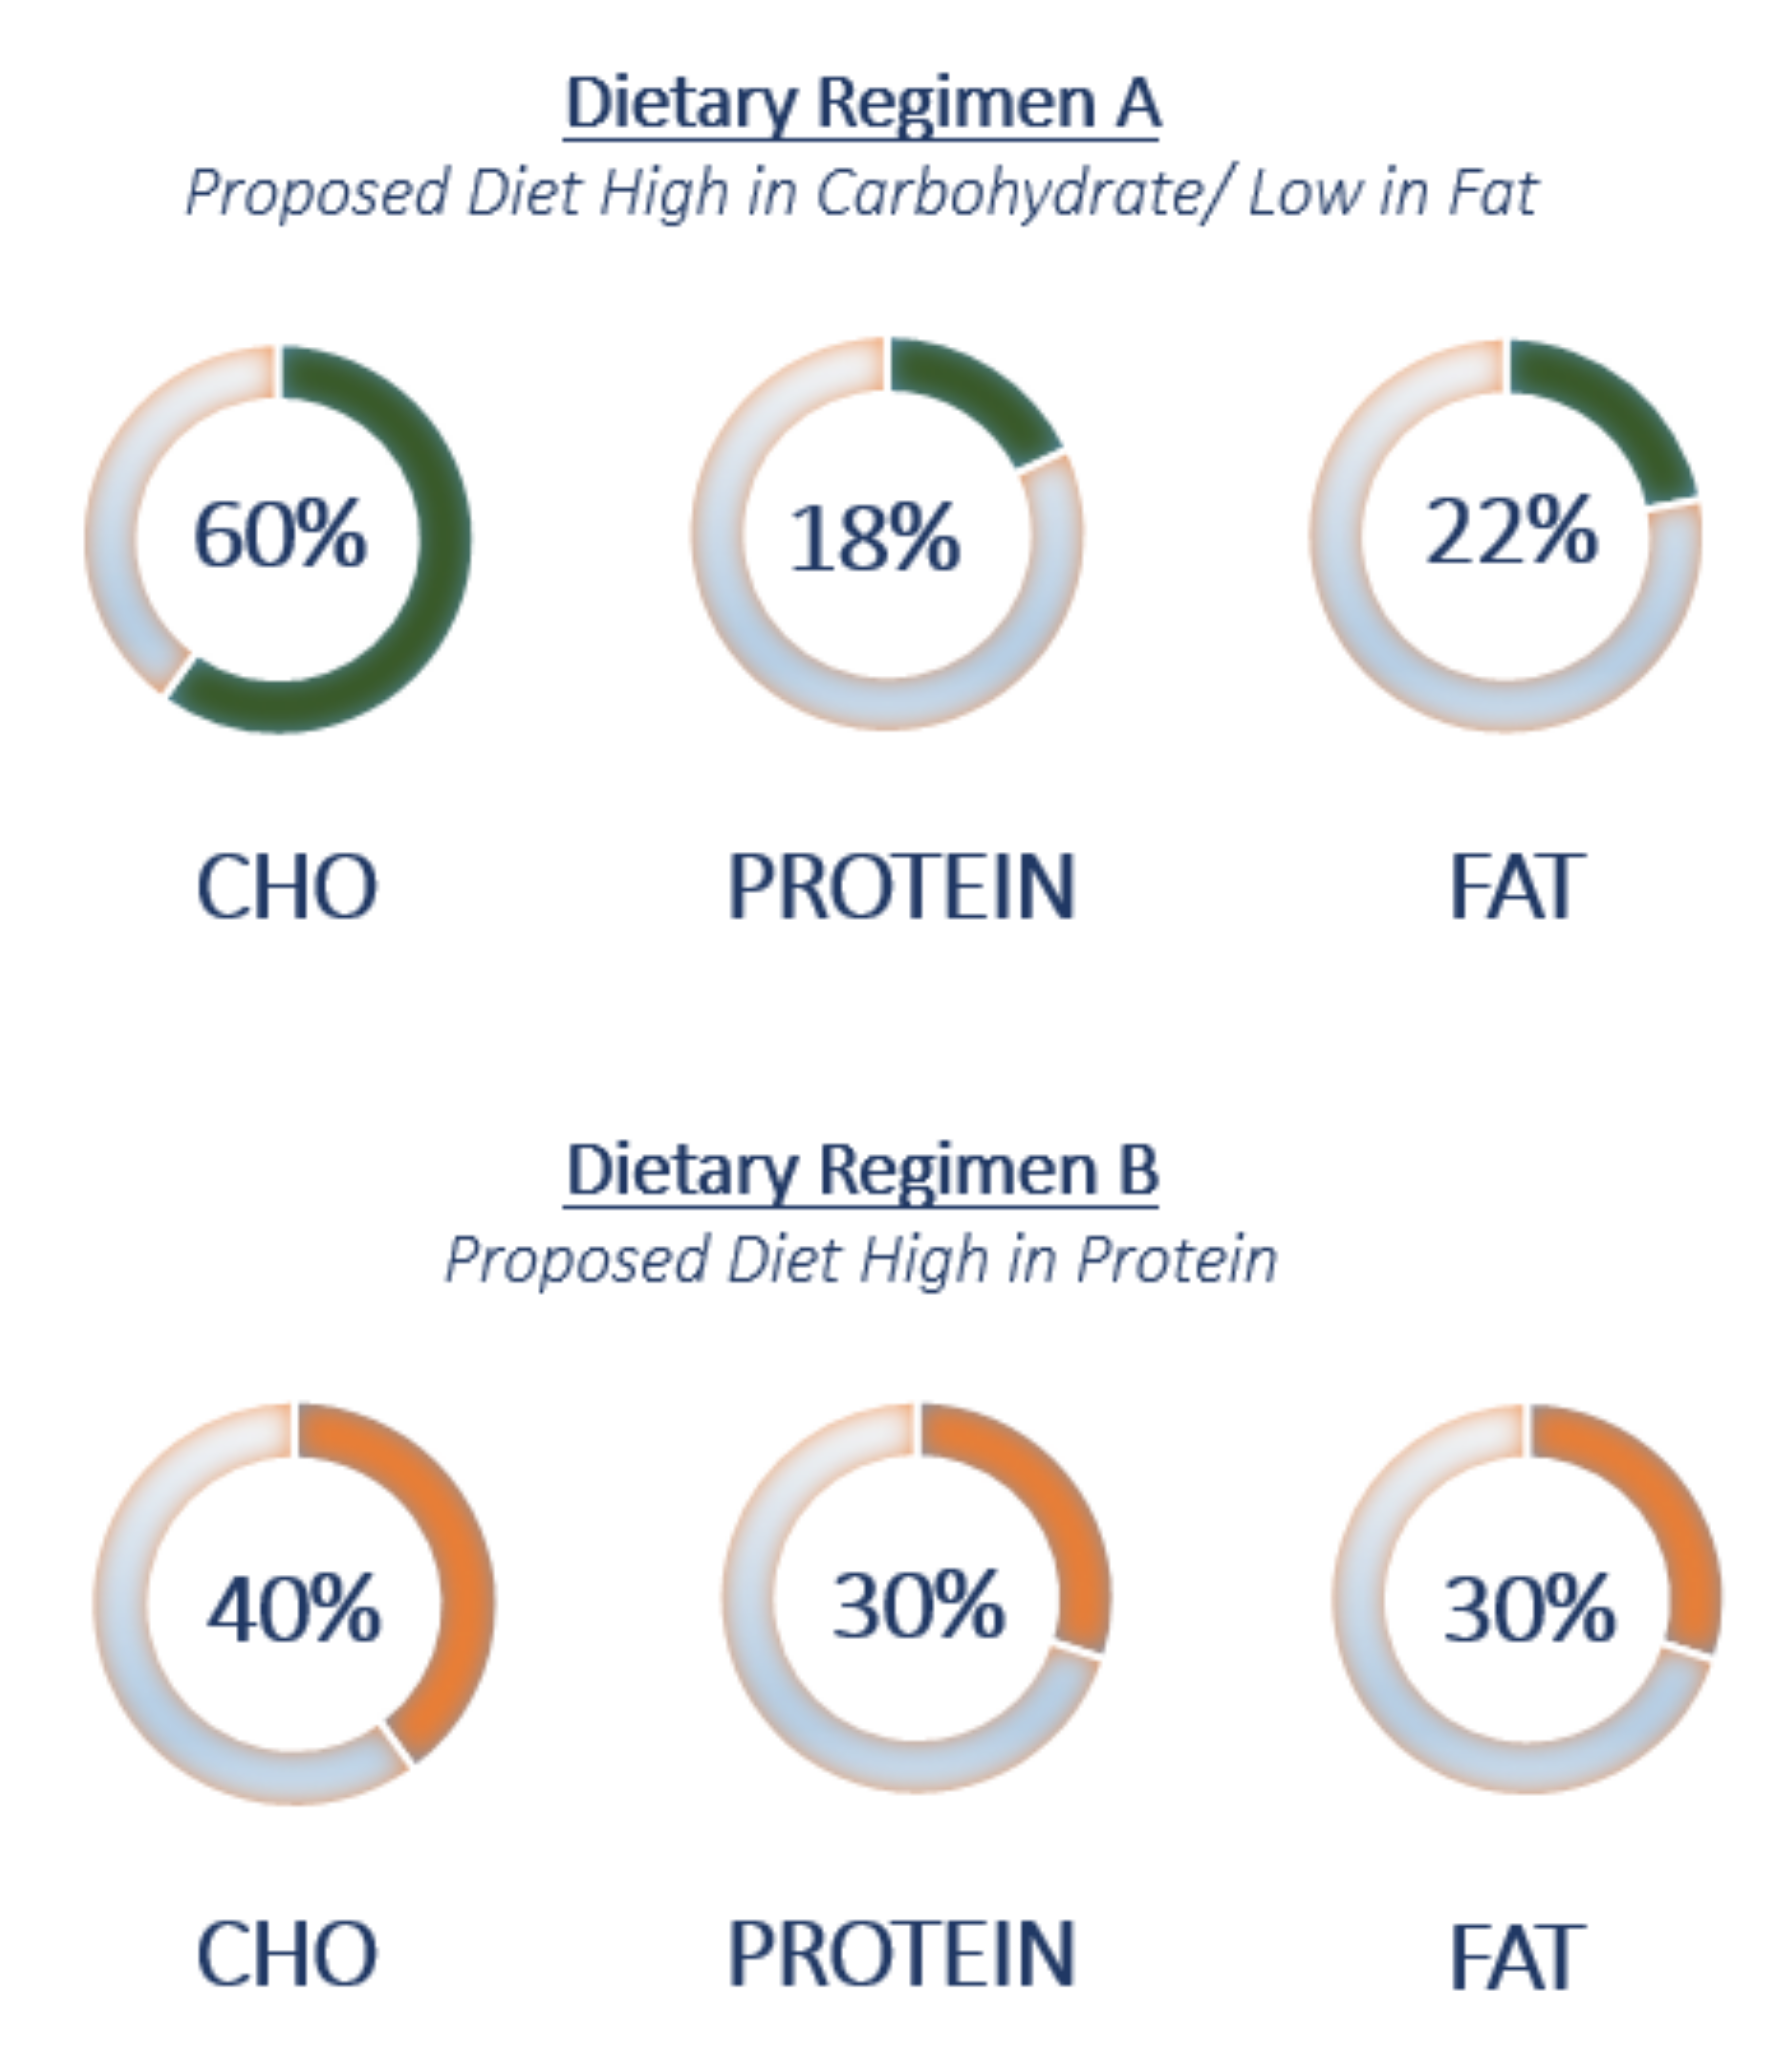
2.1. Nutritional Intervention Design and Study Population
2.2. Online Assessment Tool
2.3. Clinical Examination and Anthropometric Measurements
2.4. Biochemical Analyses
2.5. Genotyping Analyses
2.6. Dietary Assessment
2.7. Physical Activity Assessment
2.8. Statistical Analysis
3. Results
3.1. Descriptive Statistics
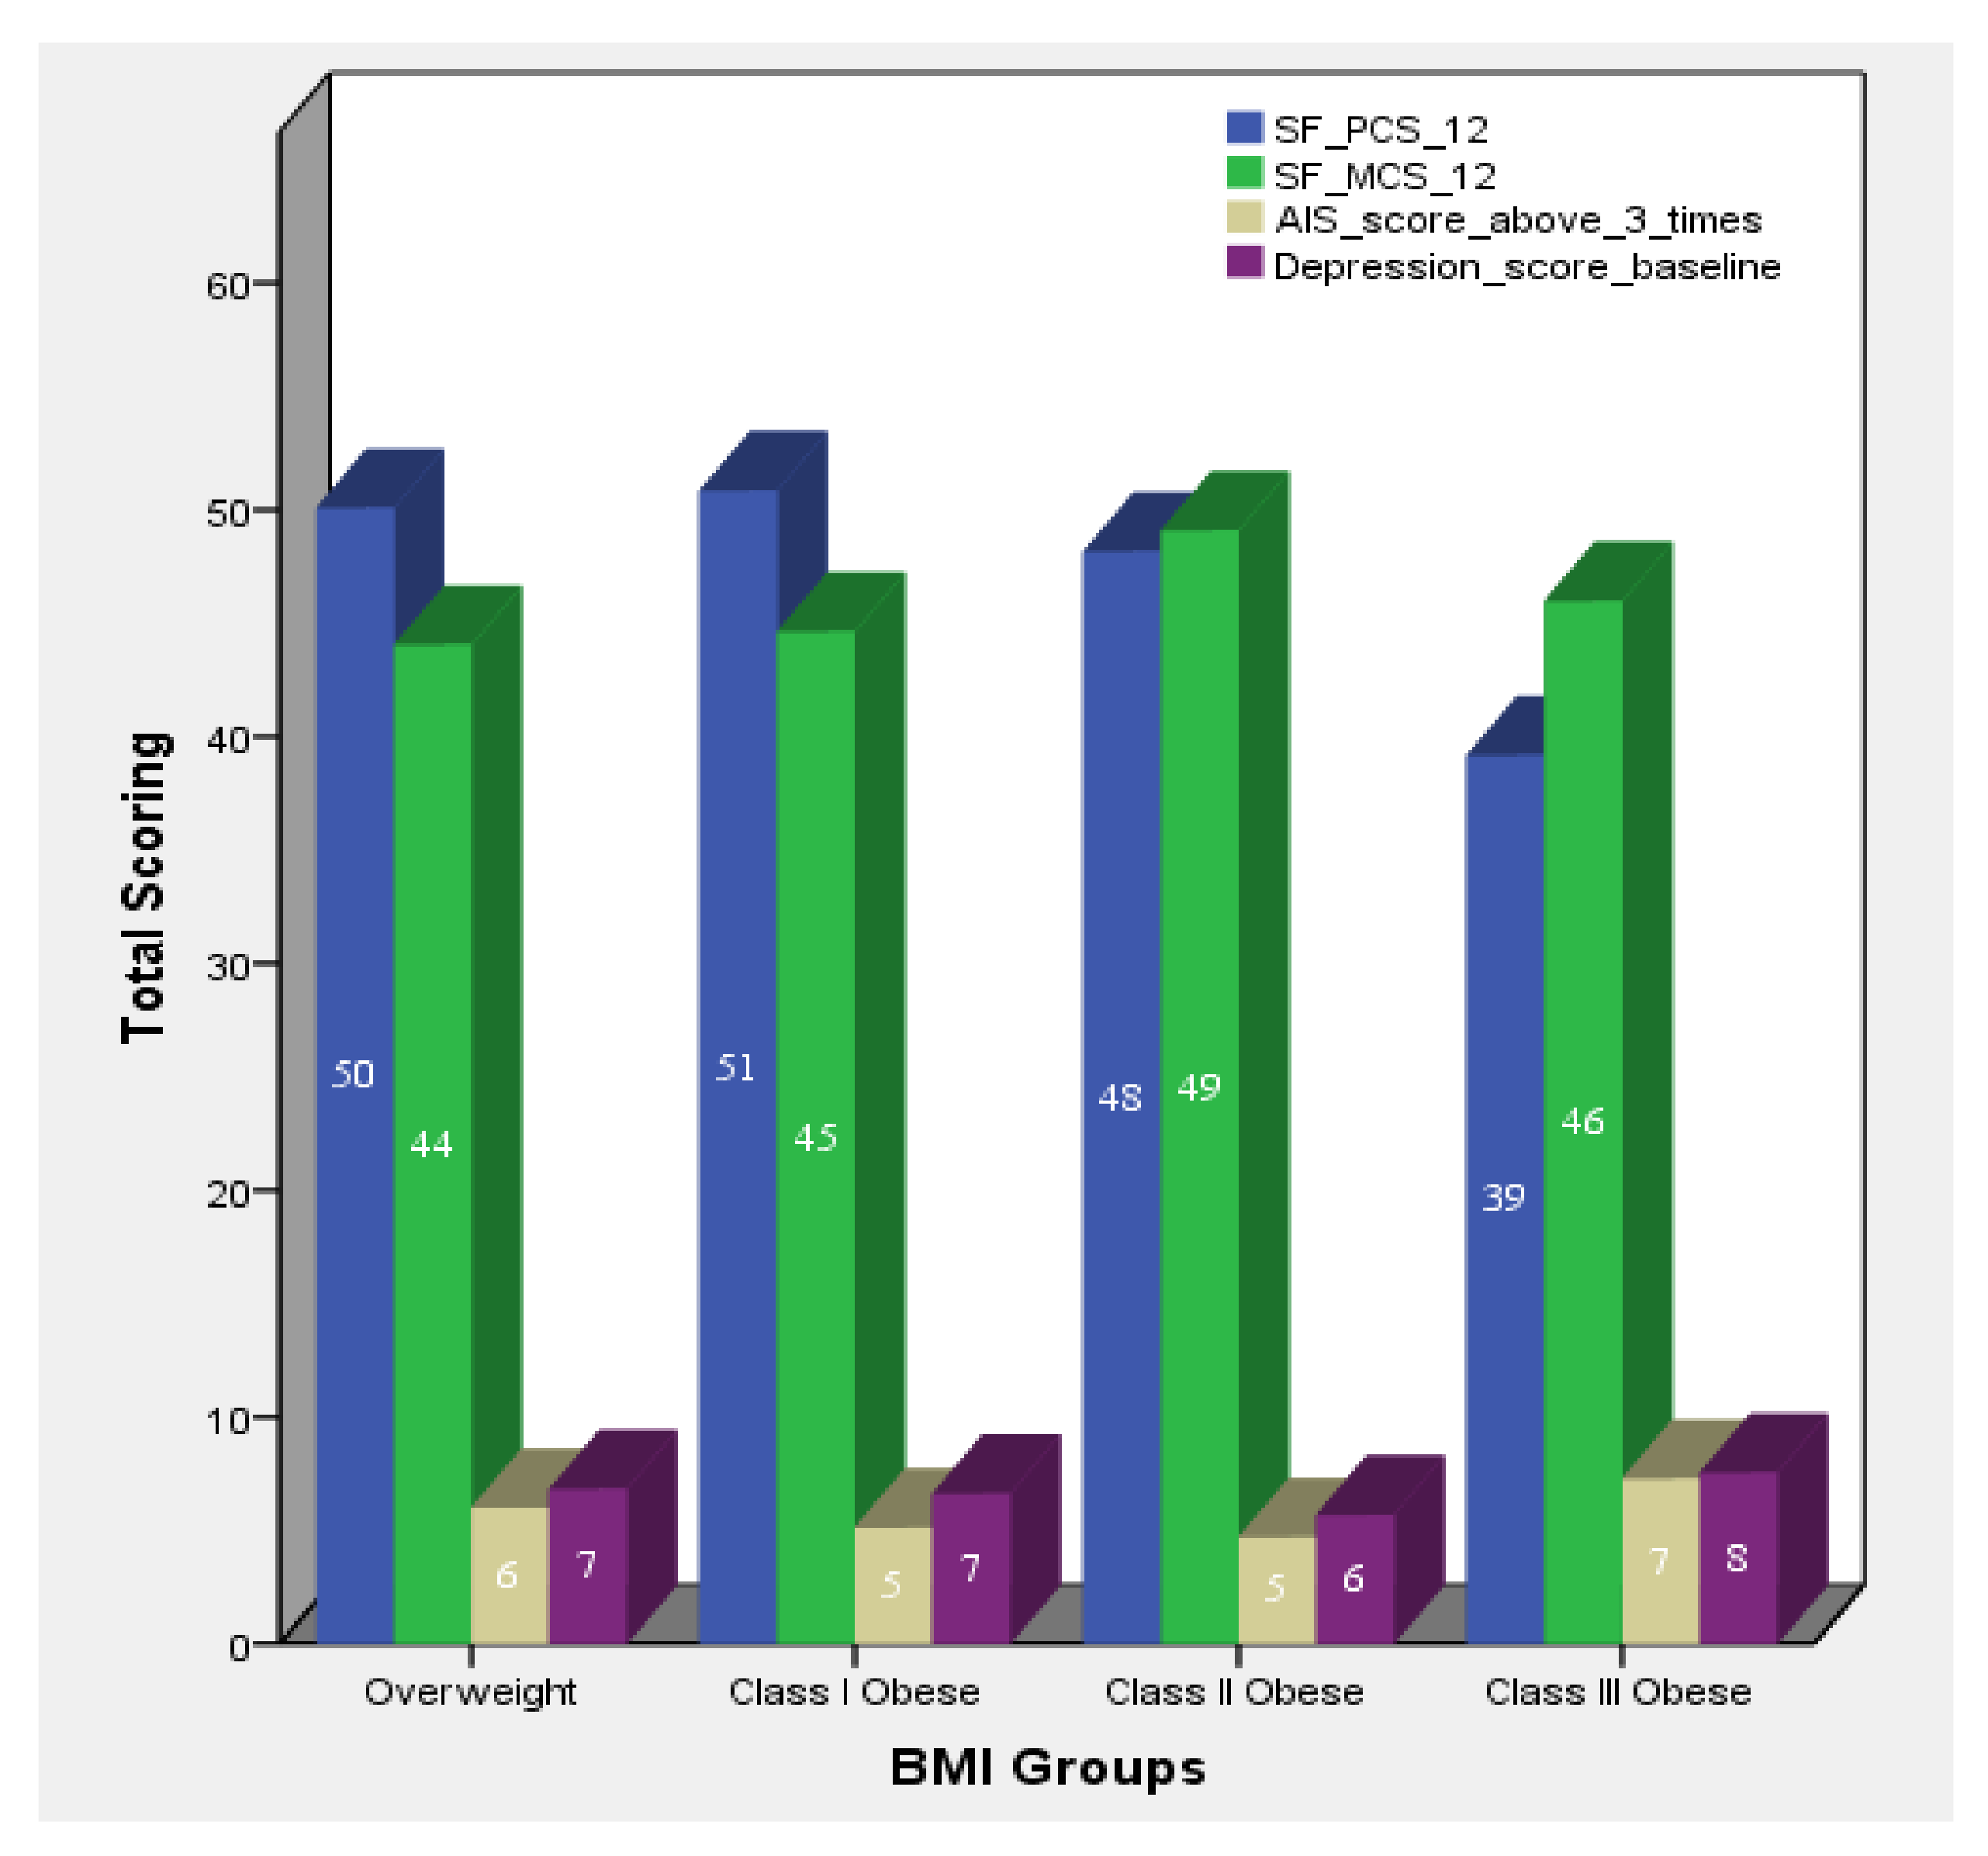
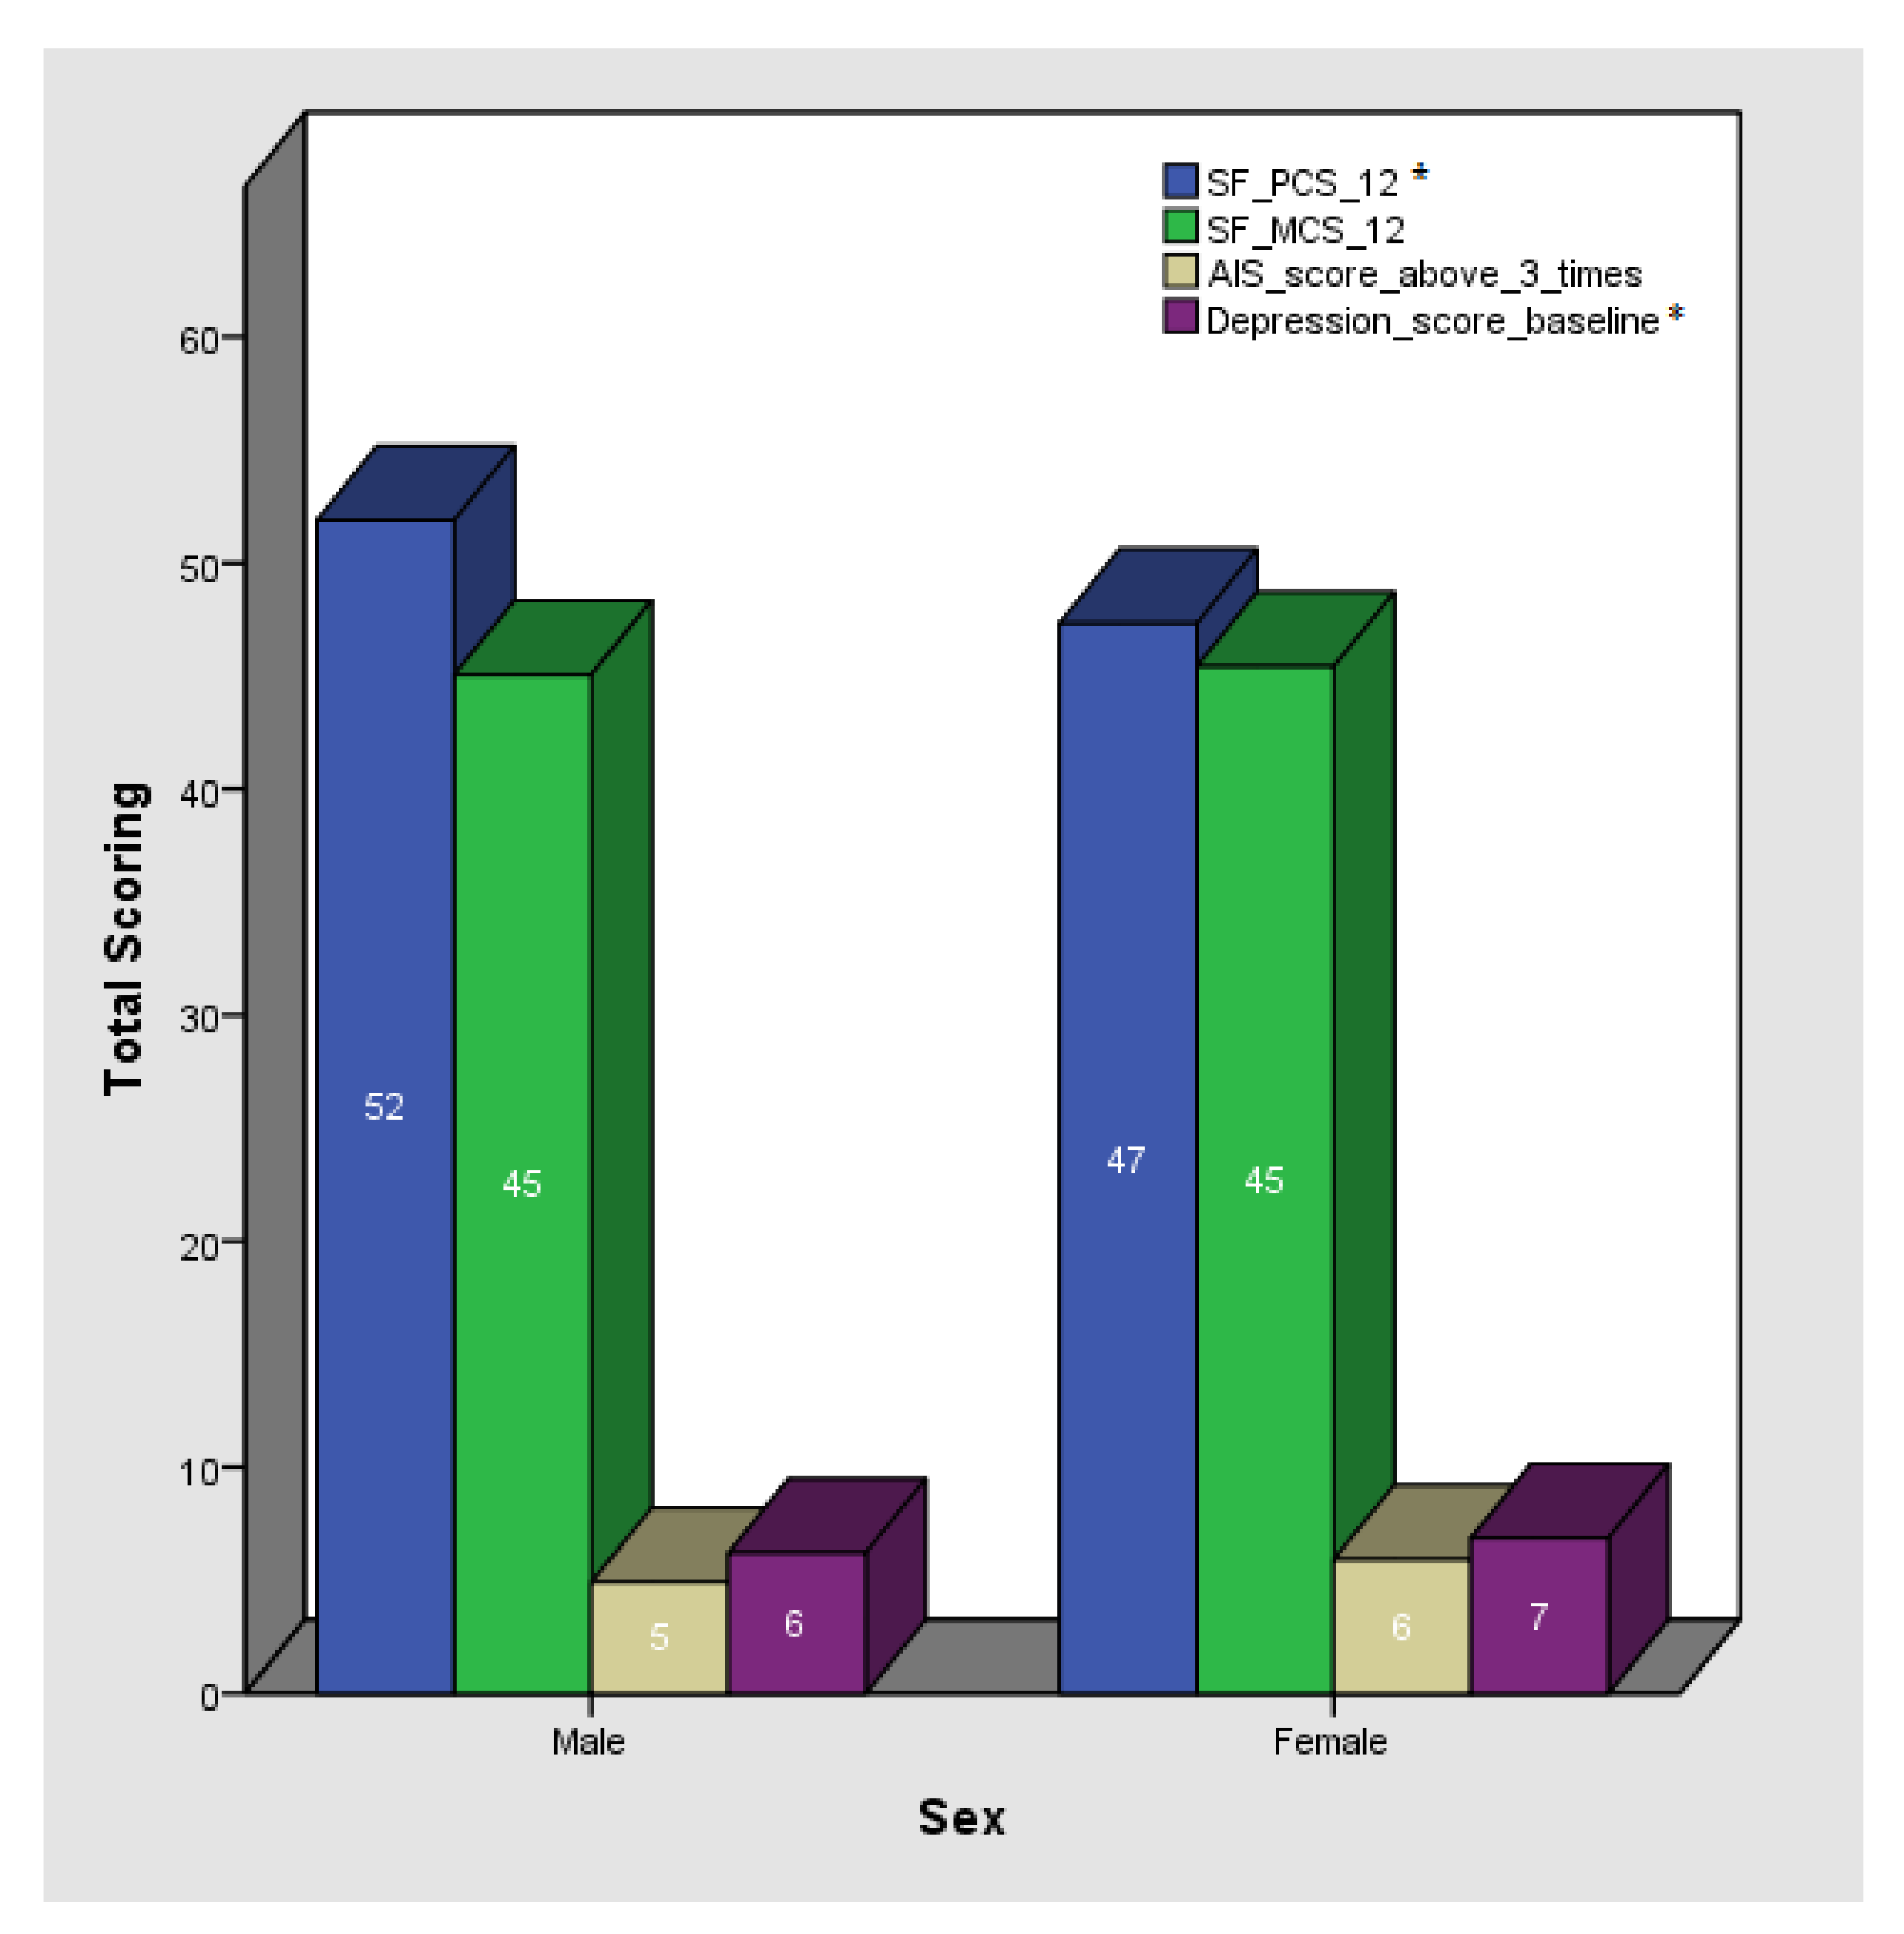
3.2. Lifestyle Characteristics
3.3. Dietary Patterns
3.4. Lifestyle Index (LI) Construction
4. Discussion
5. Conclusions
Author Contributions
Funding
Institutional Review Board Statement
Informed Consent Statement
Data Availability Statement
Acknowledgments
Conflicts of Interest
Appendix A

| Model 1 | Model 2 | Model 3 | |||||||
|---|---|---|---|---|---|---|---|---|---|
| β | SE | p-Value | β | SE | p-Value | β | SE | p-Value | |
| logGlucose (mg/dL) | |||||||||
| Mixed Pattern | 0.006 | 0.004 | 0.127 | 0.001 | 0.004 | 0.803 | 0.001 | 0.004 | 0.803 |
| Med-proxy Pattern | <0.001 | 0.004 | 0.980 | 0.002 | 0.004 | 0.560 | 0.002 | 0.004 | 0.560 |
| Eating-out Pattern | 0.002 | 0.004 | 0.635 | 0.001 | 0.004 | 0.862 | 0.001 | 0.004 | 0.862 |
| Traditional, vegetarian-alike Pattern | 0.003 | 0.004 | 0.462 | 0.001 | 0.004 | 0.871 | 0.001 | 0.004 | 0.871 |
| High in unsaturated fats Pattern | −0.003 | 0.004 | 0.380 | −0.005 | 0.004 | 0.222 | −0.005 | 0.004 | 0.222 |
| logUrea (mg/dL) | |||||||||
| Mixed Pattern | 0.004 | 0.007 | 0.566 | 0.002 | 0.008 | 0.814 | 0.001 | 0.009 | 0.932 |
| Med-proxy Pattern | 0.010 | 0.008 | 0.204 | 0.012 | 0.008 | 0.145 | 0.012 | 0.009 | 0.196 |
| Eating-out Pattern | −0.005 | 0.007 | 0.498 | −0.005 | 0.007 | 0.467 | −0.008 | 0.008 | 0.349 |
| Traditional, vegetarian-alike Pattern | <0.001 | 0.007 | 0.989 | −0.001 | 0.008 | 0.847 | −0.004 | 0.008 | 0.622 |
| High in unsaturated fats Pattern | −0.002 | 0.007 | 0.758 | −0.002 | 0.008 | 0.791 | −0.004 | 0.008 | 0.637 |
| logUric Acid(mg/dL) | |||||||||
| Mixed Pattern | 0.006 | 0.006 | 0.377 | −0.006 | 0.007 | 0.361 | −0.004 | 0.007 | 0.628 |
| Med-proxy Pattern | −0.004 | 0.007 | 0.585 | −0.001 | 0.007 | 0.854 | <0.001 | 0.007 | 0.963 |
| Eating-out Pattern | 0.003 | 0.006 | 0.603 | 0.002 | 0.006 | 0.749 | −0.002 | 0.006 | 0.805 |
| Traditional, vegetarian-alike Pattern | −0.002 | 0.006 | 0.739 | −0.004 | 0.006 | 0.506 | −0.004 | 0.007 | 0.502 |
| High in unsaturated fats Pattern | −0.006 | 0.006 | 0.336 | −0.006 | 0.006 | 0.358 | −0.007 | 0.007 | 0.331 |
| Total Cholesterol (mg/dL) | |||||||||
| Mixed Pattern | −0.259 | 2.402 | 0.914 | 1.283 | 2.575 | 0.619 | 0.922 | 2.915 | 0.752 |
| Med-proxy Pattern | −3.271 | 2.534 | 0.198 | −2.864 | 2.622 | 0.276 | −3.629 | 2.860 | 0.206 |
| Eating-out Pattern | −0.080 | 2.394 | 0.973 | −0.274 | 2.414 | 0.910 | −0.631 | 2.601 | 0.809 |
| Traditional, vegetarian-alike Pattern | 2.297 | 2.297 | 0.323 | 3.766 | 2.463 | 0.128 | 4.722 | 2.618 | 0.073 |
| High in unsaturated fats Pattern | −0.202 | 2.445 | 0.934 | 0.819 | 2.519 | 0.746 | 0.103 | 2.711 | 0.970 |
| logLDL Cholesterol (mg/dL) | |||||||||
| Mixed Pattern | −0.007 | 0.010 | 0.492 | 0.005 | 0.010 | 0.613 | 0.002 | 0.011 | 0.878 |
| Med-proxy Pattern | −0.008 | 0.010 | 0.430 | −0.005 | 0.010 | 0.642 | −0.008 | 0.011 | 0.491 |
| Eating-out Pattern | −0.003 | 0.010 | 0.751 | −0.004 | 0.009 | 0.659 | −0.006 | 0.010 | 0.557 |
| Traditional, vegetarian-alike Pattern | −0.006 | 0.009 | 0.539 | 0.002 | 0.010 | 0.816 | 0.005 | 0.010 | 0.625 |
| High in unsaturated fats Pattern | −0.010 | 0.010 | 0.321 | −0.003 | 0.010 | 0.755 | −0.003 | 0.011 | 0.746 |
| logAlbumin(g/dL) | |||||||||
| Mixed Pattern | 0.002 | 0.004 | 0.665 | 0.003 | 0.004 | 0.412 | 0.003 | 0.002 | 0.199 |
| Med-proxy Pattern | −0.002 | 0.004 | 0.691 | −0.002 | 0.004 | 0.584 | 0.002 | 0.002 | 0.289 |
| Eating-out Pattern | <0.001 | 0.004 | 0.904 | 0.001 | 0.004 | 0.759 | <0.001 | 0.002 | 0.977 |
| Traditional, vegetarian-alike Pattern | 0.003 | 0.004 | 0.368 | 0.003 | 0.004 | 0.508 | 0.003 | 0.002 | 0.115 |
| High in unsaturated fats Pattern | −0.002 | 0.004 | 0.606 | −0.003 | 0.004 | 0.441 | 0.001 | 0.002 | 0.733 |
References
- Eurostat. Over Half of Adults in the EU Are Overweight. 2021. Available online: https://ec.europa.eu/eurostat/web/products-eurostat-news/-/ddn-20210721-2 (accessed on 3 August 2021).
- Mu, M.; Xu, L.-F.; Hu, N.; Wu, J.; Bai, M.-J. Dietary Patterns and Overweight/Obesity: A Review Article. Iran. J. Public Health 2017, 46, 869–876. [Google Scholar] [PubMed]
- Cena, H.; Calder, P.C. Defining a Healthy Diet: Evidence for the Role of Contemporary Dietary Patterns in Health and Disease. Nutrients 2020, 12, 334. [Google Scholar] [CrossRef] [PubMed] [Green Version]
- Stelmach-Mardas, M.; Rodacki, T.; Dobrowolska-Iwanek, J.; Brzozowska, A.; Walkowiak, J.; Wojtanowska-Krosniak, A.; Zagrodzki, P.; Bechthold, A.; Mardas, M.; Boeing, H. Link between Food Energy Density and Body Weight Changes in Obese Adults. Nutrients 2016, 8, 229. [Google Scholar] [CrossRef] [PubMed]
- Li, Y.; Lv, M.-R.; Wei, Y.-J.; Sun, L.; Zhang, J.-X.; Zhang, H.-G.; Li, B. Dietary patterns and depression risk: A meta-analysis. Psychiatry Res. 2017, 253, 373–382. [Google Scholar] [CrossRef] [PubMed]
- Godos, J.; Grosso, G.; Castellano, S.; Galvano, F.; Caraci, F.; Ferri, R. Association between diet and sleep quality: A systematic review. Sleep Med. Rev. 2021, 57, 101430. [Google Scholar] [CrossRef] [PubMed]
- Mamalaki, E.; Poulimeneas, D.; Kosmidis, M.H.; Yannakoulia, M. Mediterranean lifestyle patterns are associated with cognition in older adults. Lifestyle Med. 2021, 2, e30. [Google Scholar] [CrossRef]
- Barbaresko, J.; Rienks, J.; Nöthlings, U. Lifestyle Indices and Cardiovascular Disease Risk: A Meta-Analysis. Am. J. Prev. Med. 2018, 55, 555–564. [Google Scholar] [CrossRef] [PubMed]
- Navarro, P.; Mehegan, J.; Murrin, C.M.; Kelleher, C.C.; Phillips, C.M.; Lifeways Cross Generation Cohort Study. Associations between a maternal healthy lifestyle score and adverse offspring birth outcomes and childhood obesity in the Lifeways Cross-Generation Cohort Study. Int. J. Obes. 2020, 44, 2213–2224. [Google Scholar] [CrossRef]
- Liao, J.; Muniz-Terrera, G.; Scholes, S.; Hao, Y.; Chen, Y.-M. Lifestyle index for mortality prediction using multiple ageing cohorts in the USA, UK and Europe. Sci. Rep. 2018, 8, 6644. [Google Scholar] [CrossRef]
- NIH; NHLBI Obesity Education Initiative. Clinical Guidelines on the Identification, Evaluation, and Treatment of Overweight and Obesity in Adults. Obes. Educ. Initiat. 1998, 6 (Suppl. S2), 51S–209S. Available online: http://www.nhlbi.nih.gov/guidelines/obesity/ob_gdlns.pdf (accessed on 10 September 2021).
- Panagiotakos, D.B.; Pitsavos, C.; Arvaniti, F.; Stefanadis, C. Adherence to the Mediterranean food pattern predicts the prevalence of hypertension, hypercholesterolemia, diabetes and obesity, among healthy adults; the accuracy of the MedDietScore. Prev. Med. 2007, 44, 335–340. [Google Scholar] [CrossRef] [PubMed]
- Radloff, L.S. The CES-D scale: A self-report depression scale for research in the general population. Appl. Psychol. Meas. 1977, 1, 385–401. Available online: https://www.brandeis.edu/roybal/docs/CESD-R_Website_PDF.pdf (accessed on 1 September 2021). [CrossRef]
- Ware, J.E.; Kosinski, M.; Keller, S. A 12-Item Short-Form Health Survey: Construction of Scales and Preliminary Tests of Reliability and Validity. Med. Care 1996, 34, 220–233. Available online: http://www.jstor.org/stable/3766749 (accessed on 1 September 2021). [CrossRef] [Green Version]
- Soldatos, C.R.; Dikeos, D.G.; Paparrigopoulos, T.J. Athens Insomnia Scale: Validation of an instrument based on ICD-10 criteria. J. Psychosom. Res. 2000, 48, 555–560. [Google Scholar] [CrossRef]
- Bountziouka, V.; Bathrellou, E.; Giotopoulou, A.; Katsagoni, C.N.; Bonou, M.; Vallianou, N.; Barbetseas, J.; Avgerinos, P.; Panagiotakos, D. Development, repeatability and validity regarding energy and macronutrient intake of a semi-quantitative food frequency questionnaire: Methodological considerations. Nutr. Metab. Cardiovasc. Dis. 2012, 22, 659–667. [Google Scholar] [CrossRef] [PubMed]
- International Physical Activity Questionnaire (IPAQ). Revised in 2013. Available online: https://sites.google.com/site/theipaq/questionnaire_links (accessed on 1 September 2021).
- ThermoFisher Scientific. iPrep™ PureLink™ gDNA Blood Kit. Available online: https://www.thermofisher.com/order/catalog/product/IS10005#/IS10005 (accessed on 30 July 2021).
- ThermoFisher Scientific. Axiom™ Precision Medicine Diversity Array Plus Kit, 96-Format. Available online: https://www.thermofisher.com/order/catalog/product/951961#/951961 (accessed on 30 July 2021).
- IBM Support. SPSS Statistics 23.0 Now Available for Download. Available online: https://www.ibm.com/support/pages/spss-statistics-230-now-available-download (accessed on 7 January 2021).
- The R Project for Statistical Computing. Last Modified in 2020. Available online: https://www.r-project.org/ (accessed on 5 January 2021).
- Saghafi-Asl, M.; Mirmajidi, S.; Jafarabadi, M.A.; Vahid, F.; Shivappa, N.; Hébert, J.R.; Attari, V.E. The association of dietary patterns with dietary inflammatory index, systemic inflammation, and insulin resistance, in apparently healthy individuals with obesity. Sci. Rep. 2021, 11, 7515. [Google Scholar] [CrossRef] [PubMed]
- Roman, G.; Rusu, A.; Graur, M.; Creteanu, G.; Morosanu, M.; Radulian, G.; Amorin, P.; Timar, R.; Pircalaboiu, L.; Bala, C. Dietary Patterns and Their Association with Obesity: A Cross-Sectional Study. Acta Endocrinol. 2019, 15, 86–95. [Google Scholar] [CrossRef] [PubMed]
- Malinowska, A.; Młodzik-Czyżewska, M.; Chmurzynska, A. Dietary patterns associated with obesity and overweight: When should misreporters be included in analysis? Nutrition 2020, 70, 110605. [Google Scholar] [CrossRef] [PubMed]
- Neri-Sánchez, M.; Martínez-Carrillo, B.E.; Valdés-Ramos, R.; Soto-Piña, A.E.; Vargas-Hernández, J.A.; Benítez-Arciniega, A.D. Dietary patterns, central obesity and serum lipids concentration in Mexican adults. Nutr. Hosp. 2019, 36, 109–117. [Google Scholar] [CrossRef]
- Wang, Y.-Y.; Tian, T.; Pan, D.; Zhang, J.-X.; Xie, W.; Wang, S.-K.; Xia, H.; Dai, Y.; Sun, G. The relationship between dietary patterns and overweight and obesity among adult in Jiangsu Province of China: A structural equation model. BMC Public Health 2021, 21, 1225. [Google Scholar] [CrossRef]
- Farmaki, A.-E.; Rayner, N.W.; Kafyra, M.; Matchan, A.; Ntaoutidou, K.; Feritoglou, P.; Athanasiadis, A.; Gilly, A.; Mamakou, V.; Zengini, E.; et al. A Dietary Pattern with High Sugar Content Is Associated with Cardiometabolic Risk Factors in the Pomak Population. Nutrients 2019, 11, 3043. [Google Scholar] [CrossRef] [Green Version]
- Kafyra, M.; Kalafati, I.P.; Kumar, S.; Kontoe, M.S.; Masson, C.; Siest, S.; Dedoussis, G.V. Dietary Patterns, Blood Pressure and the Glycemic and Lipidemic Profile of Two Teenage, European Populations. Nutrients 2021, 13, 198. [Google Scholar] [CrossRef]
- Asghari, G.; Mirmiran, P.; Yuzbashian, E.; Azizi, F. A systematic review of diet quality indices in relation to obesity. Br. J. Nutr. 2017, 117, 1055–1065. [Google Scholar] [CrossRef] [Green Version]
- Ntalla, I.; Yannakoulia, M.; Dedoussis, G.V. An Overweight Preventive Score associates with obesity and glycemic traits. Metabolism 2016, 65, 81–88. [Google Scholar] [CrossRef] [PubMed]
- Kosti, R.I.; Panagiotakos, D.B.; Mariolis, A.; Zampelas, A.; Athanasopoulos, P.; Tountas, Y. The Diet–Lifestyle Index evaluating the quality of eating and lifestyle behaviours in relation to the prevalence of overweight/obesity in adolescents. Int. J. Food Sci. Nutr. 2009, 60 (Suppl. S3), 34–47. [Google Scholar] [CrossRef] [PubMed]
- Kontogianni, M.D.; Farmaki, A.-E.; Vidra, N.; Sofrona, S.; Magkanari, F.; Yannakoulia, M. Associations between Lifestyle Patterns and Body Mass Index in a Sample of Greek Children and Adolescents. J. Am. Diet. Assoc. 2010, 110, 215–221. [Google Scholar] [CrossRef] [PubMed]
- McKenzie, F.; Biessy, C.; Ferrari, P.; Freisling, H.; Rinaldi, S.; Chajès, V.; Dahm, C.; Overvad, K.; Dossus, L.; Lagiou, P.; et al. Healthy Lifestyle and Risk of Cancer in the European Prospective Investigation into Cancer and Nutrition Cohort Study. Medicine 2016, 95, e2850. [Google Scholar] [CrossRef] [PubMed] [Green Version]
- Zhang, Y.; Pan, X.-F.; Chen, J.; Xia, L.; Cao, A.; Zhang, Y.; Wang, J.; Li, H.; Yang, K.; Guo, K.; et al. Combined lifestyle factors and risk of incident type 2 diabetes and prognosis among individuals with type 2 diabetes: A systematic review and meta-analysis of prospective cohort studies. Diabetologia 2019, 63, 21–33. [Google Scholar] [CrossRef] [PubMed] [Green Version]
- Lenz, T.L.; Gillespie, N.D.; Skradski, J.J.; Viereck, L.K.; Packard, K.A.; Monaghan, M.S. Development of a Composite Lifestyle Index and Its Relationship to Quality of Life Improvement: The CLI Pilot Study. ISRN Prev. Med. 2013, 2013, 481030. [Google Scholar] [CrossRef] [Green Version]
- Roda, C.; Charreire, H.; Feuillet, T.; MacKenbach, J.D.; Compernolle, S.; Glonti, K.; Bárdos, H.; Rutter, H.; McKee, M.; Brug, J.; et al. Lifestyle correlates of overweight in adults: A hierarchical approach (the SPOTLIGHT project). Int. J. Behav. Nutr. Phys. Act. 2016, 13, 114. [Google Scholar] [CrossRef] [Green Version]


| n | Smoking | Physical Activity Categories | Diet Group | ||||
|---|---|---|---|---|---|---|---|
| Smokers | Non-Smokers | Low | Moderate | Vigorous | High Carbohydrate/Low-Fat | High Protein | |
| Total | 50 | 151 | 64 | 104 | 31 | 94 | 108 |
| Women | 38 | 103 | 43 | 76 | 30 | 74 | 68 |
| Men | 12 | 48 | 21 | 28 | 11 | 20 | 40 |
| Variable | Total | Women | Men | p-Value | ||||||
|---|---|---|---|---|---|---|---|---|---|---|
| n | Median | IQR | n | Median | IQR | n | Median | IQR | ||
| Age | 202 | 47 | 15 | 142 | 47.50 | 14 | 60 | 45.78 * | 17 * | p > 0.05 ** |
| SBP (mmHg) | 196 | 121.00 | 21 | 139 | 117.00 | 19 | 57 | 131.00 | 21 | p < 0.001 ** |
| DBP (mmHg) | 196 | 80.84 * | 9.86 * | 139 | 78.68 * | 9.05 * | 57 | 86.09 * | 9.85 * | p < 0.001 ** |
| Pulse Rate (Beats per minute) | 196 | 74.99 | 11.38 | 139 | 74.00 | 16 | 57 | 73.00 | 14 | p > 0.05 ** |
| Anthropometric Characteristics | ||||||||||
| Weight (kg) | 202 | 87.10 | 26 | 142 | 82.80 | 18 | 60 | 100.65 | 29 | p < 0.001 ** |
| BMI (kg/m2) | 202 | 31.34 | 6.9 | 142 | 31.34 | 6.9 | 60 | 31.33 | 7.1 | p > 0.05 ** |
| Body fat (%) | 202 | 37.95 * | 7.8 * | 142 | 41.50 * | 5.4 * | 60 | 29.55 * | 5.8 * | p < 0.001 ** |
| Body fat (kg) | 202 | 32.95 | 13.3 | 142 | 34.85 | 12.8 | 60 | 29.05 | 14.5 | p < 0.002 ** |
| Fat free mass(kg) | 202 | 52.05 | 18 | 142 | 48.50 | 7 | 60 | 71.20 | 15 | p < 0.001 ** |
| Total body water (kg) | 202 | 38.05 | 13 | 142 | 36.35 * | 4.03 * | 60 | 52.10 | 11 | p < 0.001 ** |
| Visceral fat | 202 | 10.00 | 6 | 142 | 9.74 | 3.16 | 60 | 14.50 | 5.69 | p < 0.001 ** |
| Upper body fat (%) | 201 | 36.60 | 10 | 141 | 38.50 | 8 | 60 | 32.10 | 8 | p < 0.001 ** |
| Upper body fat (kg) | 201 | 17.60 | 7 | 141 | 17.30 | 7 | 60 | 18.00 | 7 | p > 0.05 ** |
| Upper body fat-free mass (kg) | 201 | 28.80 | 9 | 141 | 27.67 * | 2.75 * | 60 | 38.00 | 7 | p < 0.001 ** |
| Waist circumference (cm) | 185 | 99.00 | 17 | 130 | 96.50 | 15 | 55 | 105.00 | 17 | p < 0.001 ** |
| Hip circumference (cm) | 185 | 114.50 | 14 | 130 | 115.75 | 16 | 55 | 114.00 | 10 | p > 0.05 ** |
| WHR | 185 | 0.85 | 0.12 | 130 | 0.83 | 0.09 | 55 | 0.92 | 0.09 | p < 0.001 ** |
| Biochemical Biomarkers | ||||||||||
| Fasting glucose (mg/dL) | 193 | 92.00 | 10.50 | 135 | 92.00 | 10.00 | 58 | 95.00 | 16.25 | p < 0.001 ** |
| Urea (mg/dL) | 193 | 28.00 | 9.00 | 135 | 27.00 | 9.00 | 58 | 30.12 * | 6.01 * | p < 0.001 ** |
| Creatinine (mg/dL) | 193 | 0.68 | 0.21 | 135 | 0.62 * | 0.10 * | 58 | 0.85 * | 0.12 * | p < 0.001 ** |
| Uric acid(mg/dL) | 193 | 4.70 | 1.45 | 135 | 4.30 | 1.10 | 58 | 5.75 * | 1.00 * | p < 0.001 ** |
| Total cholesterol (mg/dL) | 193 | 177.96 * | 33.57 * | 135 | 179.32 * | 31.98 * | 58 | 174.79 * | 37.13 * | p > 0.05 ** |
| HDL cholesterol (mg/dL) | 193 | 49.00 | 16.50 | 135 | 52.00 | 17.00 | 58 | 42.00 | 14.50 | p < 0.001 ** |
| LDL cholesterol (mg/dL) | 193 | 105.20 | 38.70 | 135 | 105.00 | 38.40 | 58 | 108.00 | 42.05 | p > 0.05 ** |
| Triglycerides (mg/dL) | 193 | 90.00 | 5.00 | 135 | 86.00 | 51.00 | 58 | 105.50 | 86.50 | p < 0.001 ** |
| Total bilirubin (mg/dL) | 193 | 0.37 | 0.23 | 135 | 0.35 | 0.23 | 58 | 0.45 | 0.29 | p < 0.001 ** |
| Direct bilirubin (mg/dL) | 193 | 0.16 | 0.08 | 135 | 0.15 | 0.09 | 58 | 0.17 | 0.08 | p < 0.001 ** |
| Serum protein (g/dL) | 193 | 6.70 | 0.50 | 135 | 6.70 | 0.45 | 58 | 6.60 | 0.60 | p > 0.05 ** |
| Serum albumin (g/dL) | 193 | 4.20 | 0.30 | 135 | 4.40 | 0.50 | 58 | 4.20 | 0.40 | p < 0.001 ** |
| SGOT/AST (IU/L) | 193 | 16.00 | 6.00 | 135 | 15.00 | 5.00 | 58 | 18.00 | 5.25 | p < 0.001 ** |
| SGPT/ALT (IU/L) | 192 | 15.00 | 11.75 | 134 | 13.00 | 9.00 | 58 | 22.00 | 16.25 | p < 0.001 ** |
| Lifestyle Characteristics | ||||||||||
| AIS Score *** | 140 | 5.00 | 7.00 | 97 | 5.00 | 7.00 | 43 | 4.00 | 7.00 | p > 0.05 ** |
| CESD-R-10 Scale | 201 | 6.00 | 5.00 | 141 | 6.00 | 4.00 | 60 | 5.00 | 5.75 | p < 0.001 ** |
| SF PCS 12 Score | 145 | 51.98 | 12 | 99 | 50.37 | 11 | 46 | 53.82 | 8 | p < 0.001 ** |
| SF MCS 12 Score | 145 | 49.37 | 15 | 99 | 49.44 | 16 | 46 | 46.62 * | 8.36 | p > 0.001 ** |
| Variable | Model 1 * | ||
|---|---|---|---|
| β | SE | p-Value | |
| logBMI | |||
| Athens Insomnia Scale Score | 0.001 | 0.001 | 0.612 |
| CESD-R-10 Scale | 0.002 | 0.001 | 0.189 |
| SF PCS 12 Score | −0.003 | 0.001 | <0.001 |
| SF MCS 12 Score | 0.001 | 0.001 | 0.217 |
| Body fat (%) | |||
| Athens Insomnia Scale Score | 0.188 | 0.128 | 0.143 |
| CESD-R-10 Scale | 0.175 | 0.100 | 0.083 |
| SF PCS 12 Score | −0.218 | 0.057 | <0.001 |
| SF MCS 12 Score | 0.049 | 0.054 | 0.371 |
| Components | |||||||
|---|---|---|---|---|---|---|---|
| Mean Consumption (Median. IQR) | Food Group | 1 | 2 | 3 | 4 | 5 | |
| Croissant (g/d) | 5.2 (11.56) | Sweets | 0.705 | ||||
| Chocolate (g/d) | 12.85 (8.85) | ||||||
| Tarts (g/d) | 10.00 (10.00) | ||||||
| Ice cream (g/d) | 7.66 (24.64) | ||||||
| Mayonnaise (g/d) | 1.11 (2.02) * | Mayonnaise | 0.664 | ||||
| White bread (g/d) | 19.28 (17.28) | Refined Cereals | 0.643 | ||||
| Cereals (g/d) | 4.28 (4.28) | ||||||
| White rice (g/d) | 10.53 (23.32) | ||||||
| Barley (g/d) | 9.33 (30.00) | ||||||
| Burger bread (g/d) | 3.00 (10.44) * | ||||||
| Chips (g/d) | 4.66 (4.66) | Salty Snacks | 0.628 | ||||
| Crackers (g/d) | 1.33 (4.28) | ||||||
| Honey (g/d) | 1.07 (4.66) | Sugary Snacks | 0.596 | ||||
| Soft drinks (mL/d) | 28.69 (72.42) * | ||||||
| Fruit compost (g/d) | 7.58 96.66) * | ||||||
| Tray Sweets (g/d) | 10.00 (10.00) | Tray Sweets | 0.584 | ||||
| Pastitsio (g/d) | 10.00 (10.00) | Pastitsio | 0.493 | ||||
| Potatoes (boiled. cooked. not fried) (g/d) | 11.53 (25.53) | Potatoes (boiled, cooked, not fried) | 0.469 | ||||
| Chicken (g/d) | 32.14 (0.00) | Chicken | 0.388 | ||||
| Seed oil (g/d) | 3.23 (8.09) * | Seed oil, margarine, butter | 0.374 | ||||
| Margarine (g/d) | 1.03 (2.46) * | ||||||
| Butter (g/d) | 0.50 (1.00) | ||||||
| Light mayonnaise (g/d) | 0.71 (1.84) * | Light Products | 0.367 | ||||
| Light cold cuts (g/d) | 2.00 (6.42) | ||||||
| Light soft drinks (g/d) | 22.00 (70.71) | ||||||
| Sausage (g/d) | 1.08 (1.45) | −0.342 | |||||
| Tomatoes (g/d) | 64.28 (42.85) | Vegetables | 0.640 | ||||
| Lettuce (g/d) | 34.28 (34.28) | ||||||
| Broccoli (g/d) | 21.42 (14.76) | ||||||
| Spinach (g/d) | 6.00 (13.28) | ||||||
| Full fat milk (mL/d) | 43.46 (71.26) | Dairy | 0.568 | ||||
| Low fat milk | 51.42 (154.28) | ||||||
| White cheese (g/d) | 6.42 (17.28) | ||||||
| Eggs (g/d) | 10.71 (7.38) | Eggs | 0.562 | ||||
| Oranges (g/d) | 36.42 (97.95) | Fruits | 0.525 | ||||
| Apples (g/d) | 30.00 (80.66) | ||||||
| Bananas (g/d) | 21.42 (57.61) | ||||||
| Winter fruit (g/d) | 32.14 (86.42) | ||||||
| Summer fruit | 32.14 (64.28) | ||||||
| Whole bread (g/d) | 19.28 (17.28) | Non-refined cereals | 0.443 | ||||
| Brown rice (g/d) | 6.72 (14.73) * | ||||||
| Whole pasta (g/d) | 8.54 (9.33) | ||||||
| Large fish (g/d) | 10.00 (22.14) | Large fish | 0.432 | ||||
| Olive oil (g/d) | 45.00 (45.00) | Olive oil | 0.345 | ||||
| Dried fruit (g/d) | 3.35 (6.88) * | Dried fruit | 0.330 | ||||
| Coffee (mL/d) | 240.00 (240.00) | Caffeinated Beverages | −0.504 | ||||
| Tea (mL/d) | 16.00 (51.42) | ||||||
| Seafood (g/d) | 10.00 (10.00) | Seafood | 0.685 | ||||
| French Fries (g/d) | 4.83 (15.53) | French Fries | 0.648 | ||||
| Homemade pies (g/d) | 10.00 (0.00) | Pies | 0.510 | ||||
| Other pies (g/d) | 10.00 (10.00) | ||||||
| Beef (g/d) | 10.00 (22.14) | Red Meat | 0.499 | ||||
| Minced beef | 25.71 (17.71) | ||||||
| Pork (g/d) | 10.00 (22.14) | ||||||
| Lamb (g/d) | 5.83 (13.84) | ||||||
| Alcohol (mL/d) | 2.00 (6.42) | Alcohol and Beer | 0.398 | ||||
| Beer (mL/d) | 16.00 (51.42) | ||||||
| Legumes (g/d) | 64.28 (44.28) | Legumes | 0.698 | ||||
| Spinach and Rice (g/d) | 16.66 (53.57) | Traditional, Greek recipes | 0.695 | ||||
| Green Peas (g/d) | 42.85 (29.52) | ||||||
| Olives | 1.00 (3.21) | Olives | 0.645 | ||||
| Small fish (g/d) | 10.00 (32.14) | Small fish | 0.584 | ||||
| Nuts (g/d) | 3.33 (28.81) | Nuts | 0.343 | ||||
| Fruit Juice (g/d) | 16.00 (51.42) | Fruit Juice | 0.311 | ||||
| Total Variance Explained (%) | 14.74% | 9.87% | 6.26% | 4.96% | 4.49% | ||
| Model 1 | Model 2 | Model 3 | |||||||
|---|---|---|---|---|---|---|---|---|---|
| β | SE | p-Value | β | SE | p-Value | β | SE | p-Value | |
| LogBMI | |||||||||
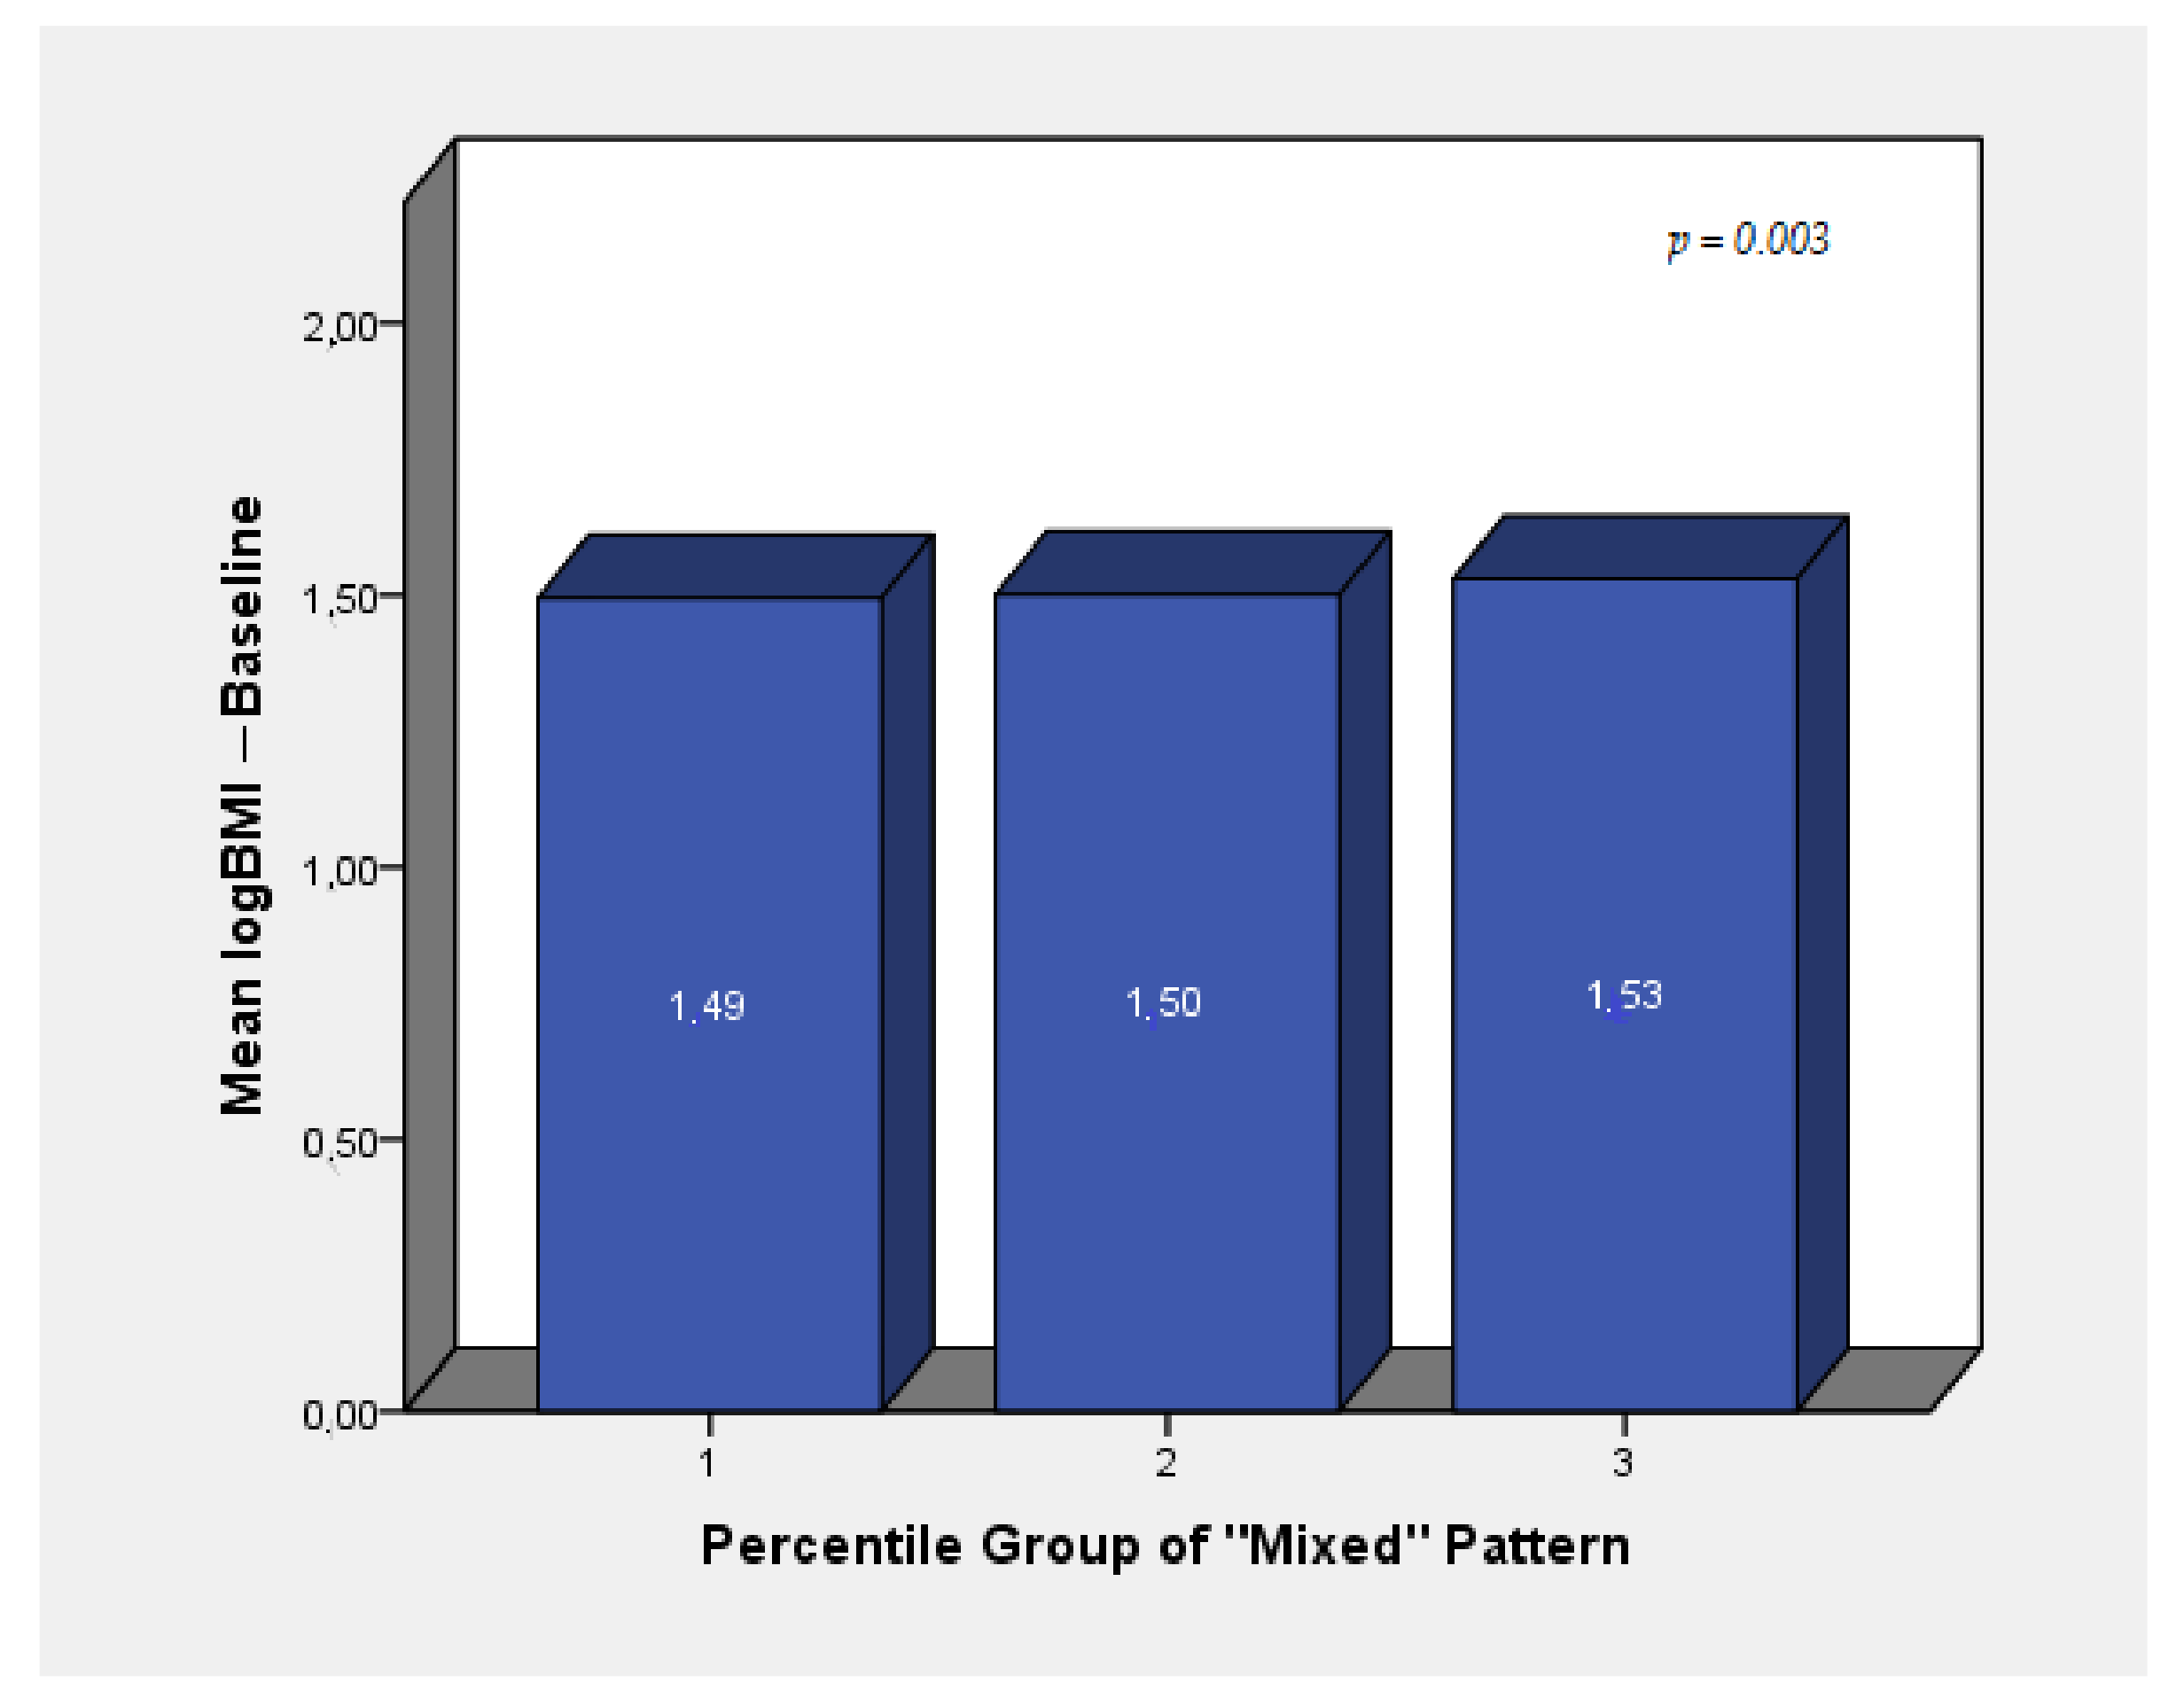
| Mixed Pattern | 0.019 | 0.005 | <0.001 | 0.017 | 0.005 | 0.001 | 0.015 | 0.005 | 0.009 |
| Med-proxy Pattern | −0.002 | 0.005 | 0.758 | <0.001 | 0.005 | 0.937 | −0.001 | 0.006 | 0.867 |
| Eating-out Pattern | 0.004 | 0.005 | 0.366 | 0.004 | 0.005 | 0.432 | 0.001 | 0.005 | 0.780 |
| Traditional, vegetarian-alike Pattern | −0.005 | 0.005 | 0.272 | −0.008 | 0.005 | 0.132 | −0.008 | 0.005 | 0.132 |
| High in unsaturated fats and fruit juice consumption Pattern | −0.005 | 0.005 | 0.338 | −0.006 | 0.005 | 0.269 | −0.006 | 0.005 | 0.281 |
| Body fat % | |||||||||
| Mixed Pattern | 1.179 | 0.392 | 0.003 | −0.149 | 0.230 | 0.516 | −0.195 | 0.259 | 0.451 |
| Med-proxy Pattern | −0.010 | 0.423 | 0.982 | 0.261 | 0.234 | 0.266 | 0.351 | 0.255 | 0.171 |
| Eating-out Pattern | 0.316 | 0.399 | 0.430 | 0.005 | 0.217 | 0.982 | −0.045 | 0.232 | 0.848 |
| Traditional, vegetarian-alike Pattern | −0.770 | 0.387 | 0.048 | −0.476 | 0.221 | 0.032 | −0.402 | 0.236 | 0.090 |
| High in unsaturated fats and fruit juice consumption Pattern | −0.335 | 0.400 | 0.404 | 0.054 | 0.220 | 0.808 | 0.167 | 0.236 | 0.480 |
| LogVisceral Fat | |||||||||
| Mixed Pattern | 0.032 | 0.009 | 0.001 | −0.002 | 0.004 | 0.633 | <0.001 | 0.004 | 0.980 |
| Med-proxy Pattern | −0.002 | 0.010 | 0.808 | 0.002 | 0.004 | 0.629 | 0.004 | 0.004 | 0.302 |
| Eating-out Pattern | 0.011 | 0.010 | 0.266 | 0.002 | 0.004 | 0.548 | 0.002 | 0.004 | 0.642 |
| Traditional, vegetarian-alike Pattern | −0.018 | 0.009 | 0.058 | −0.008 | 0.004 | 0.032 | −0.007 | 0.004 | 0.088 |
| High in unsaturated fats and fruit juice consumption Pattern | −0.007 | 0.010 | 0.450 | 0.002 | 0.004 | 0.522 | 0.006 | 0.004 | 0.139 |
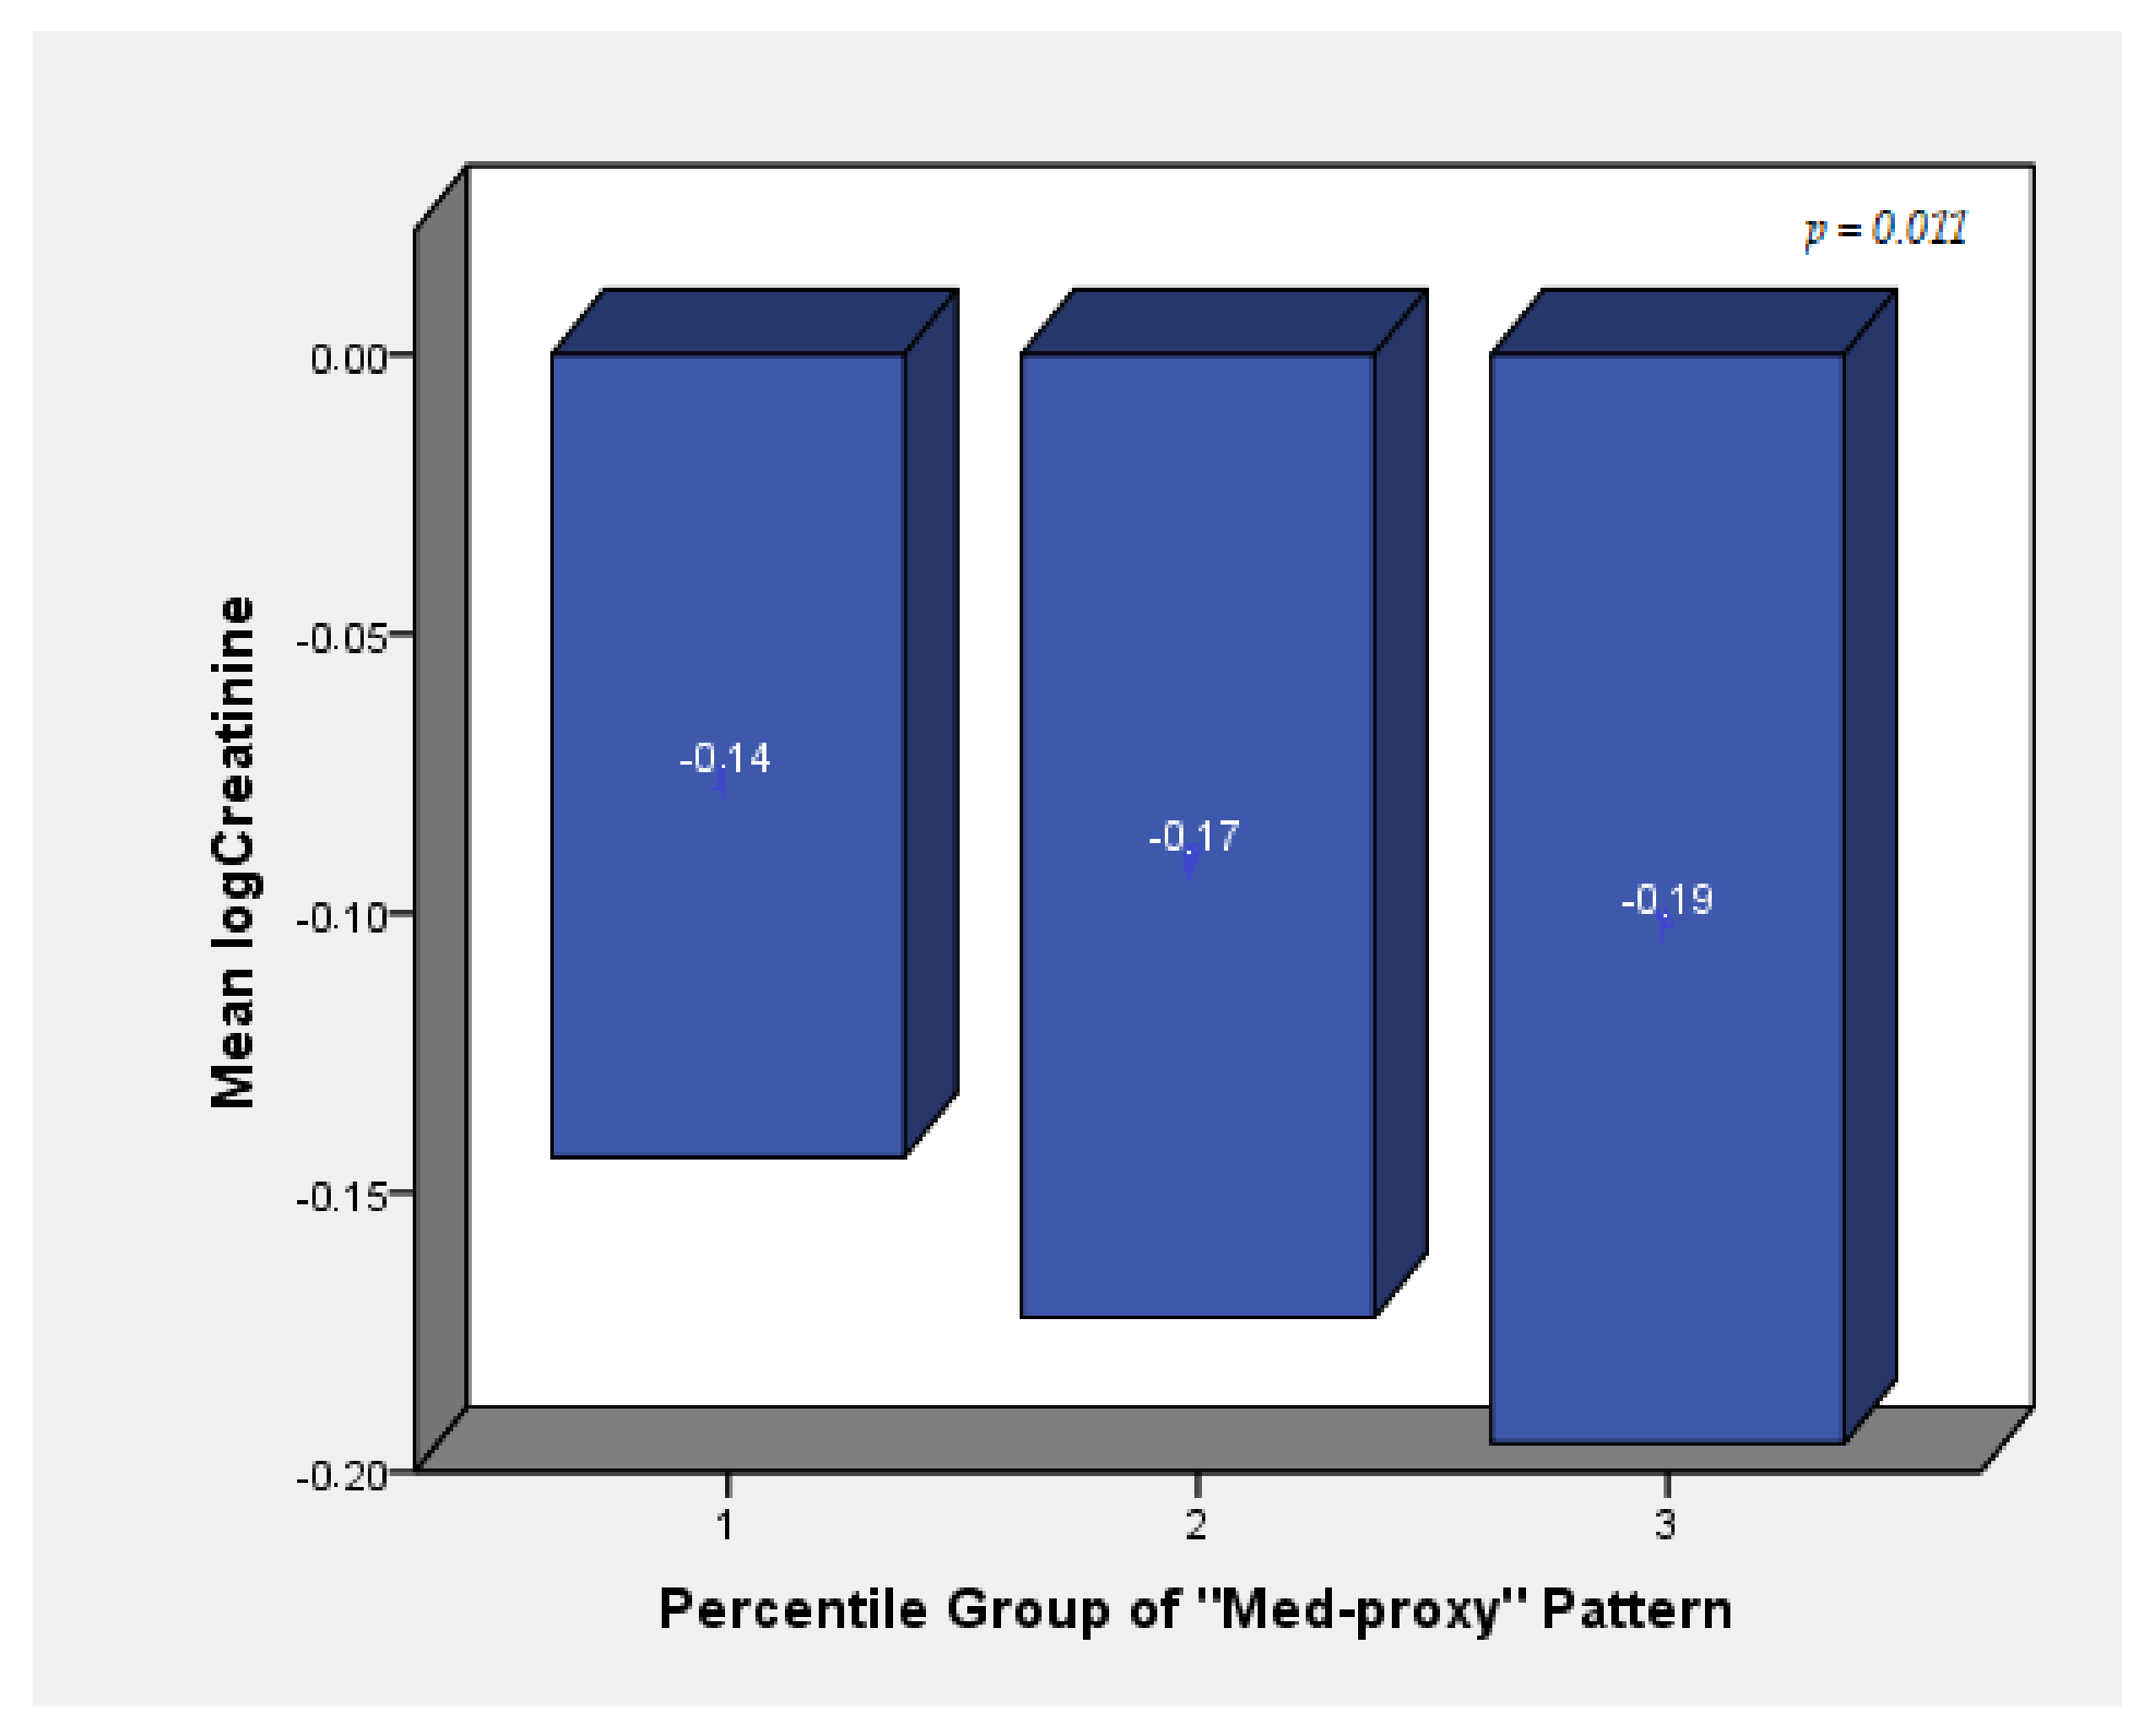
| logCreatinine(mg/dL) | |||||||||
| Mixed Pattern | 0.008 | 0.005 | 0.136 | 0.008 | 0.006 | 0.143 | 0.012 | 0.006 | 0.048 |
| Med-proxy Pattern | −0.008 | 0.006 | 0.150 | −0.010 | 0.006 | 0.066 | −0.013 | 0.006 | 0.029 |
| Eating-out Pattern | −0.001 | 0.005 | 0.897 | 0.001 | 0.005 | 0.848 | 0.001 | 0.006 | 0.875 |
| Traditional, vegetarian-alike Pattern | −0.003 | 0.005 | 0.549 | −0.008 | 0.005 | 0.155 | −0.008 | 0.006 | 0.149 |
| High in unsaturated fats and fruit juice consumption Pattern | 0.002 | 0.005 | 0.648 | 0.001 | 0.005 | 0.802 | 0.001 | 0.006 | 0.876 |
| logHDL Cholesterol (mg/dL) | |||||||||
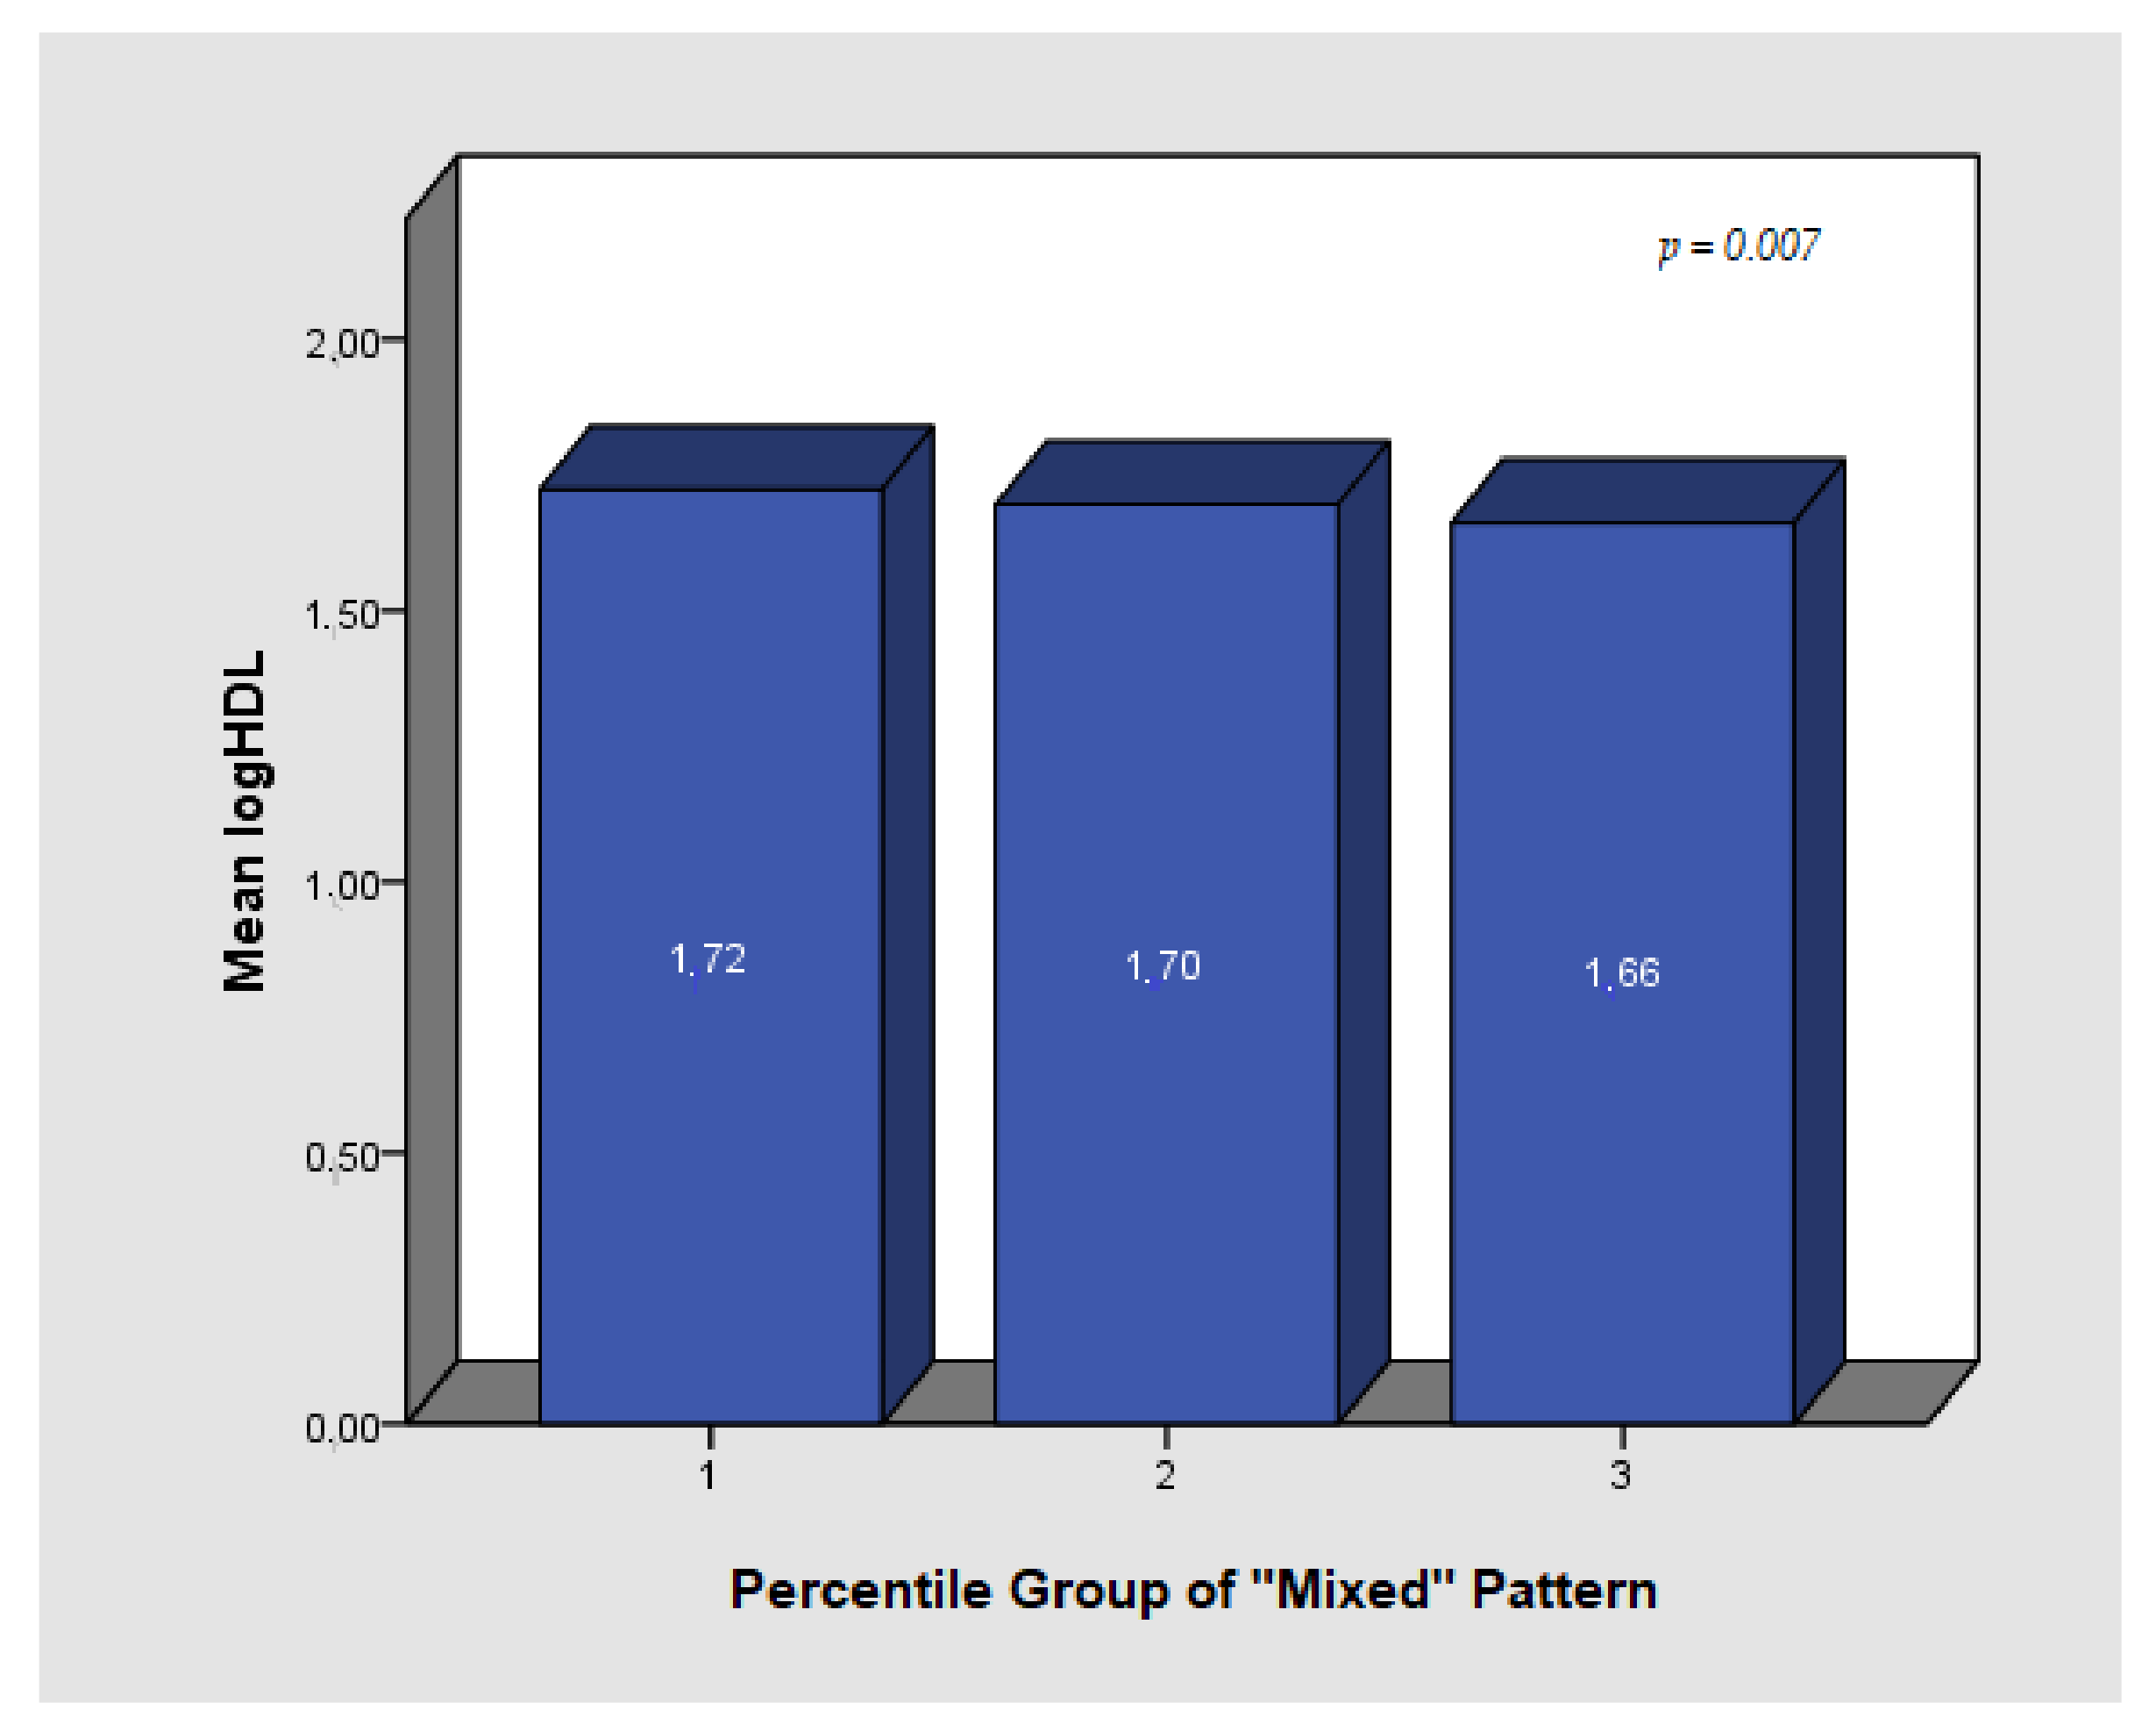
| Mixed Pattern | −0.020 | 0.007 | 0.006 | −0.013 | 0.007 | 0.079 | −0.016 | 0.009 | 0.057 |
| Med-proxy Pattern | −0.005 | 0.008 | 0.528 | −0.009 | 0.008 | 0.257 | −0.010 | 0.008 | 0.245 |
| Eating-out Pattern | 0.009 | 0.007 | 0.229 | 0.011 | 0.007 | 0.135 | 0.013 | 0.008 | 0.082 |
| Traditional, vegetarian-alike Pattern | 0.013 | 0.007 | 0.054 | 0.017 | 0.007 | 0.017 | 0.016 | 0.008 | 0.039 |
| High in unsaturated fats and fruit juice consumption Pattern | 0.005 | 0.007 | 0.483 | 0.006 | 0.007 | 0.445 | 0.003 | 0.008 | 0.688 |
| logTriglycerides(mg/dL) | |||||||||
| Mixed Pattern | 0.038 | 0.014 | 0.007 | 0.021 | 0.015 | 0.155 | 0.033 | 0.016 | 0.048 |
| Med-proxy Pattern | −0.008 | 0.015 | 0.579 | −0.003 | 0.015 | 0.850 | −0.002 | 0.016 | 0.908 |
| Eating-out Pattern | <0.001 | 0.014 | 0.998 | −0.003 | 0.014 | 0.816 | −0.007 | 0.015 | 0.622 |
| Traditional, vegetarian-alike Pattern | 0.009 | 0.014 | 0.509 | 0.006 | 0.014 | 0.662 | 0.015 | 0.015 | 0.316 |
| High in unsaturated fats and fruit juice consumption Pattern | 0.002 | 0.014 | 0.875 | <0.001 | 0.015 | 0.976 | −0.004 | 0.016 | 0.788 |
| logTotal Bilirubin(mg/dL) | |||||||||
| Mixed Pattern | −0.002 | 0.015 | 0.913 | 0.001 | 0.017 | 0.971 | 0.013 | 0.018 | 0.472 |
| Med-proxy Pattern | −0.036 | 0.016 | 0.025 | −0.043 | 0.017 | 0.010 | −0.042 | 0.018 | 0.019 |
| Eating-out Pattern | −0.005 | 0.015 | 0.735 | −0.001 | 0.015 | 0.943 | −0.005 | 0.016 | 0.772 |
| Traditional, vegetarian-alike Pattern | 0.032 | 0.015 | 0.031 | 0.030 | 0.016 | 0.059 | 0.033 | 0.016 | 0.047 |
| High in unsaturated fats and fruit juice consumption Pattern | 0.018 | 0.016 | 0.255 | 0.015 | 0.016 | 0.357 | 0.016 | 0.017 | 0.356 |
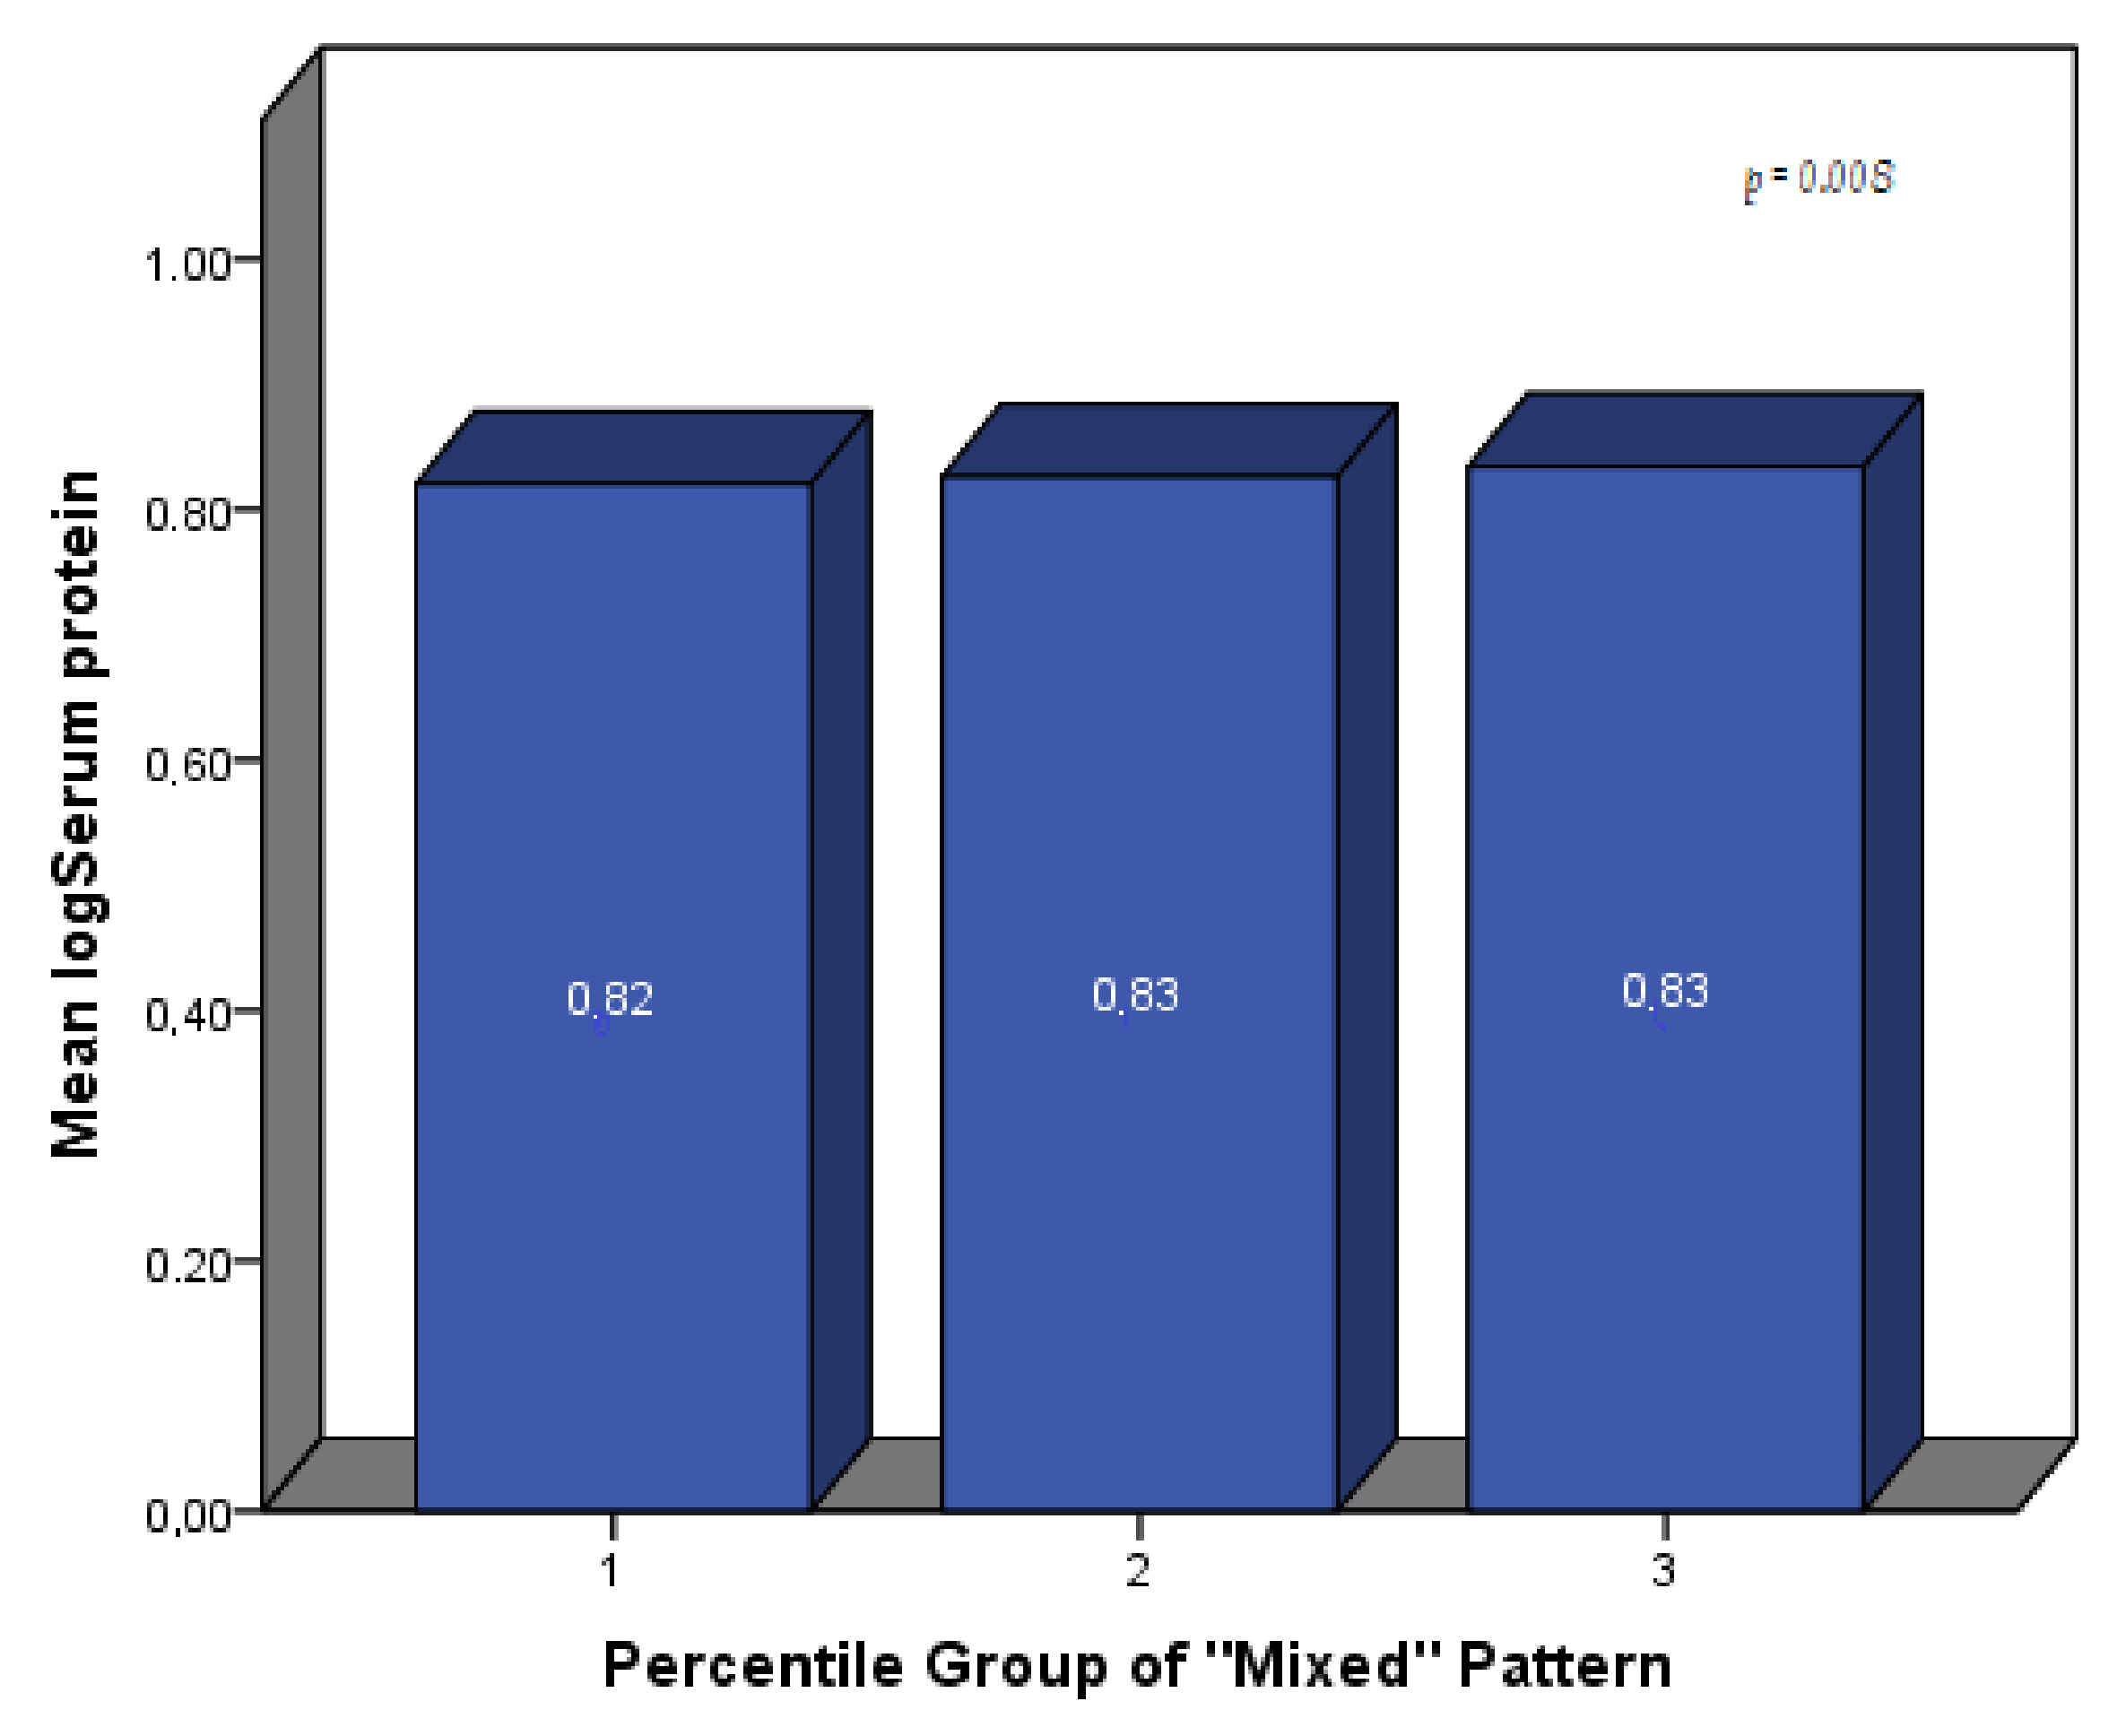
| logSerum protein(g/dL) | |||||||||
| Mixed Pattern | 0.004 | 0.002 | 0.036 | 0.003 | 0.002 | 0.187 | 0.005 | 0.002 | 0.029 |
| Med-proxy Pattern | −0.001 | 0.002 | 0.575 | −0.001 | 0.002 | 0.720 | <0.000 | 0.002 | 0.829 |
| Eating-out Pattern | −0.001 | 0.002 | 0.603 | −0.001 | 0.002 | 0.599 | −0.002 | 0.002 | 0.273 |
| Traditional, vegetarian-alike Pattern | 0.002 | 0.002 | 0.164 | 0.002 | 0.002 | 0.217 | 0.003 | 0.002 | 0.136 |
| High in unsaturated fats and fruit juice consumption Pattern | 0.001 | 0.002 | 0.525 | 0.001 | 0.002 | 0.530 | <0.001 | 0.002 | 0.794 |
| LogSGOT/AST(IU/L) | |||||||||
| Mixed Pattern | 0.024 | 0.011 | 0.029 | 0.024 | 0.012 | 0.043 | 0.028 | 0.012 | 0.022 |
| Med-proxy Pattern | 0.003 | 0.012 | 0.797 | 0.004 | 0.012 | 0.759 | 0.001 | 0.012 | 0.911 |
| Eating-out Pattern | −0.011 | 0.011 | 0.317 | −0.009 | 0.011 | 0.393 | −0.013 | 0.011 | 0.216 |
| Traditional, vegetarian-alike Pattern | 0.003 | 0.011 | 0.811 | −0.003 | 0.011 | 0.799 | −0.004 | 0.011 | 0.735 |
| High in unsaturated fats and fruit juice consumption Pattern | 0.006 | 0.011 | 0.603 | 0.004 | 0.012 | 0.735 | 0.003 | 0.011 | 0.824 |
| logSGPT/ALT (IU/L) | |||||||||
| Mixed Pattern | 0.052 | 0.014 | <0.001 | 0.049 | 0.016 | 0.002 | 0.070 | 0.016 | <0.001 |
| Med-proxy Pattern | −0.009 | 0.016 | 0.570 | −0.005 | 0.016 | 0.768 | −0.006 | 0.017 | 0.740 |
| Eating-out Pattern | −0.003 | 0.015 | 0.816 | −0.005 | 0.015 | 0.714 | −0.009 | 0.015 | 0.555 |
| Traditional, vegetarian-alike Pattern | 0.002 | 0.014 | 0.910 | <0.001 | 0.015 | 0.996 | <0.001 | 0.015 | 0.978 |
| High in unsaturated fats and fruit juice consumption Pattern | 0.005 | 0.015 | 0.724 | 0.006 | 0.016 | 0.701 | −0.002 | 0.016 | 0.919 |
| Model 1 | Model 2 | |||||||||||||||||
|---|---|---|---|---|---|---|---|---|---|---|---|---|---|---|---|---|---|---|
| Total * | Women | Men | Total ** | Women | Men | |||||||||||||
| β | SE | p-Value | β | SE | p-Value | β | SE | p-Value | β | SE | p-Value | β | SE | p-Value | β | SE | p-Value | |
| logBMI Lifestyle Index | −0.010 | 0.004 | 0.019 | −0.007 | 0.005 | 0.183 | −0.015 | 0.007 | 0.045 | − | − | − | − | − | ||||
| Body fat (%) | ||||||||||||||||||
| Lifestyle Index | −0.867 | 0.451 | 0.056 | −0.911 | 0.414 | 0.030 | −1.123 | 0.551 | 0.048 | −0.307 | 0.393 | 0.436 | −0.446 | 0.231 | 0.056 | −0.446 | 0.339 | 0.572 |
| logFasting glucose (mg/dL) | ||||||||||||||||||
| Lifestyle Index | −0.009 | 0.003 | 0.007 | −0.011 | 0.003 | 0.003 | −0.005 | 0.006 | 0.429 | −0.007 | 0.003 | 0.036 | −0.010 | 0.004 | 0.007 | <0.001 | 0.006 | 0.953 |
| logSGOT (IU/L) | ||||||||||||||||||
| Lifestyle Index | −0.006 | 0.009 | 0.534 | −0.017 | 0.007 | 0.026 | 0.017 | 0.020 | 0.397 | −0.006 | 0.010 | 0.518 | −0.018 | 0.008 | 0.023 | 0.015 | 0.021 | 0.484 |
| LogSGPT (IU/L) | ||||||||||||||||||
| Lifestyle Index | −0.027 | 0.014 | 0.049 | −0.039 | 0.013 | 0.003 | <0.001 | 0.023 | 0.988 | 0.292 | 0.277 | 0.293 | −0.038 | 0.013 | 0.005 | 0.003 | 0.024 | 0.895 |
Publisher’s Note: MDPI stays neutral with regard to jurisdictional claims in published maps and institutional affiliations. |
© 2021 by the authors. Licensee MDPI, Basel, Switzerland. This article is an open access article distributed under the terms and conditions of the Creative Commons Attribution (CC BY) license (https://creativecommons.org/licenses/by/4.0/).
Share and Cite
Kafyra, M.; Kalafati, I.P.; Katsareli, E.A.; Lambrinou, S.; Varlamis, I.; Kaliora, A.C.; Dedoussis, G.V. The iMPROVE Study; Design, Dietary Patterns, and Development of a Lifestyle Index in Overweight and Obese Greek Adults. Nutrients 2021, 13, 3495. https://doi.org/10.3390/nu13103495
Kafyra M, Kalafati IP, Katsareli EA, Lambrinou S, Varlamis I, Kaliora AC, Dedoussis GV. The iMPROVE Study; Design, Dietary Patterns, and Development of a Lifestyle Index in Overweight and Obese Greek Adults. Nutrients. 2021; 13(10):3495. https://doi.org/10.3390/nu13103495
Chicago/Turabian StyleKafyra, Maria, Ioanna P. Kalafati, Efthymia A. Katsareli, Sophia Lambrinou, Iraklis Varlamis, Andriana C. Kaliora, and George V. Dedoussis. 2021. "The iMPROVE Study; Design, Dietary Patterns, and Development of a Lifestyle Index in Overweight and Obese Greek Adults" Nutrients 13, no. 10: 3495. https://doi.org/10.3390/nu13103495
APA StyleKafyra, M., Kalafati, I. P., Katsareli, E. A., Lambrinou, S., Varlamis, I., Kaliora, A. C., & Dedoussis, G. V. (2021). The iMPROVE Study; Design, Dietary Patterns, and Development of a Lifestyle Index in Overweight and Obese Greek Adults. Nutrients, 13(10), 3495. https://doi.org/10.3390/nu13103495