Article

Carrot Consumption Frequency Associated with Reduced BMI and Obesity through the SNP Intermediary rs4445711

1
Department of Internal Medicine, Niigata University Faculty of Medicine, Niigata 951-8510, Japan
2
Genequest Inc., Tokyo 108-0014, Japan
3
Department of Health and Nutrition, Faculty of Human Life Studies, University of Niigata Prefecture, Niigata 950-8680, Japan
4
Department of Research and Development, University of Toyama Institute of Natural Medicine, Tomaya 930-8555, Japan
5
Department of Internal Medicine, University of Tsukuba School of Medicine, Tsukuba 305-8577, Japan
*
Author to whom correspondence should be addressed.
Nutrients 2021, 13(10), 3478; https://doi.org/10.3390/nu13103478
Submission received: 19 August 2021 / Revised: 25 September 2021 / Accepted: 28 September 2021 / Published: 30 September 2021
(This article belongs to the Section Nutrition and Public Health)

Abstract

:
It is unclear whether genetic interactions are involved in the association between vegetable intake and reduced body mass index (BMI) or obesity. We conducted a comprehensive search for single nucleotide polymorphisms (SNPs) which are associated with the interaction between vegetable intake frequency and BMI or obesity. We performed a genome-wide association analysis to evaluate the genetic interactions between self-reported intake of vegetables such as carrot, broccoli, spinach, other green vegetables (green pepper and green beans), pumpkin, and cabbage with BMI and obesity, which is defined as a BMI ≥ 25.0 kg/m2 in the Japanese population (n = 12,225). The mean BMI and prevalence of obesity was 23.9 ± 3.4 kg/m2 and 32.3% in men and 22.1 ± 3.8 kg/m2 and 17.3% in in women, respectively. A significant interaction was observed between rs4445711 and frequency of carrot intake on BMI (p = 4.5 × 10⁻⁸). This interaction was slightly attenuated after adjustment for age, sex, alcohol intake, smoking, physical activity and the frequency of total vegetable intake (p = 2.1 × 10⁻⁷). A significant interaction was also observed between rs4445711 and frequency of carrot intake on obesity (p = 2.5 × 10⁻⁸). No significant interactions that were the same as the interaction between frequency of carrot intake and rs4445711 were observed between the intake frequency of broccoli, spinach, other green vegetables, pumpkin or cabbage and BMI or obesity. The frequency of carrot consumption is implicated in reducing BMI by the intermediary of rs4445711. This novel genetic association may provide new clues to clarify the association between vegetable intake and BMI or obesity.

1. Introduction

Vegetables are an important part of a healthy eating pattern and provide sources of many nutrients. Vegetable intake may be a key modifiable factor in the prevention of chronic diseases such as diabetes, hypertension, and cardiovascular disease [1,2]. Being overweight or obese represents a major public health problem worldwide [3,4,5]. Obesity is an important contributing factor to the global incidence of diabetes, cardiovascular disease, and cancer, leading to a reduced quality of life [6,7]. So far, there has been no consistent finding on the association between vegetable consumption and body mass index (BMI) or obesity [8,9,10,11,12,13,14,15]. While several studies have shown that the intake of some vegetables is negatively associated with BMI [9,10,11,12,13,16], some studies have reported that there was no association between vegetable intake and a subsequent decrease in BMI [12,14,15]. Genetic factors have been reported to be associated with the consumption of vegetables. Matoba et al. showed that TAS1R3 (rs307355; known to be sensitive to the Umami taste) was associated with the consumption of vegetables in the Japanese population [17]. In addition, Calancie and Mikołajczyk-Stecyna et al. reported that TAS2R38 (rs713598, rs1726866, and rs10246939) and gustin (CA6; rs2274333) polymorphisms may affect the frequency of consumption of bitter-tasting foods [18,19].
A recent genome-wide association study (GWAS) revealed many loci associated with adult BMI, and these loci accounted for 2.7% of BMI variation [20]. Pathways involving synaptic plasticity and glutamate receptor activity were pathways that responded to changes in feeding and fasting and are regulated by obesity-related molecules such as BDNF and MC4R [20]. These findings indicate the importance of gene–environment interactions, such as genetic variations and dietary factors; however, it remains unclear whether a genetic interaction role exists between vegetable intake frequency and BMI or obesity.
Therefore, we conducted a comprehensive search for single nucleotide polymorphisms (SNPs) which interact with the association between various types of vegetables, such as carrot, broccoli, spinach, other green vegetables (green pepper, green beans), pumpkin, and cabbage, and reduced BMI or obesity using a GWAS in Japanese individuals.

2. Methods

2.1. Study Design

The study participants were customers of the Japanese Direct-to-Consumer genetic testing service, HealthData Lab, provided by Genequest Inc. (Tokyo, Japan) and Yahoo! Japan Corporation (Tokyo, Japan). All participants were over 18 years of age, had answered an online self-reported survey, and had consented to the use of their genotype and questionnaire data for this study. Criteria for inclusion were: (i) aged 18–90 years and (ii) participants of Yahoo HealthData Lab. Criteria for exclusion were those: (i) who had not provided informed consent, (ii) had an incomplete questionnaire or had not provided data, (iii) who were estimated to have non-Japanese ancestry, (iv) who had low call rates per subject, or those with a closely related subject. The final analysis was performed using 12,225 participants. Written informed consent was obtained from all participants. The study purpose was explained to the participants and a further agreement was obtained allowing participants to opt-out. The ethics committee of Niigata University and Genequest Inc. approved the present study (2015-2623 and G2017-0023, 2017-15-1).

2.2. Frequency of Vegetable Intake Measurement and Definition of BMI

Frequency of vegetable intake was assessed using an online survey that asked participants “How frequently do you eat carrot, broccoli, spinach, other green vegetables (green pepper and green beans), pumpkin, and cabbage?” The answers included eight categories of intake level: “hardly eat,” “1 to 3 times per month,” “1 to 2 times per week,” “3 to 4 times per week,” “5 to 6 times per a week,” “once per day,” “twice per day,” or “≥ 3 times per day.” Categories were converted into continuous variables (1 to 8), representing frequency, i.e., “hardly eat” was coded as 1, “1 to 3 times per month” as 2, “1 to 2 times per week” as 3, “3 to 4 times per week” as 4, “5 to 6 times per week” as 5, “once per day” as 6, “twice per day” as 7, and “≥ 3 times per day” as 8. In addition, self-reported information on height and weight was collected from all participants. BMI was calculated by dividing weight (kg) by the square of height (m). Obesity was defined as a BMI ≥ 25.0 kg/m2, according to the Japan Society for the Study of Obesity [21].

2.3. DNA Sampling, Genotyping and Quality Control

Saliva samples were collected using the Oragene DNA (OG-500) Collection Kit (DNA Genotek Inc., Ottawa, ON, Canada), followed by the extraction of genomic DNA according to the manufacturer’s instructions. Genotyping was performed using either of two Illumina (San Diego, CA, USA) platforms: the HumanCore-12+ Custom BeadChip or the HumanCore-24+ Custom BeadChip. Since these two platforms were designed to measure almost identical marker sets, we used 285,387 markers genotyped by both platforms. We excluded: (i) those estimated to have non-Japanese ancestry [22,23], (ii) those with low call rates per subject (<0.95), (iii) those with a closely related subject (PI_HAT > 0.1875), (iv) those with inconsistent sex data between questionnaire and genotype, (v) SNP markers with low call rates per SNP (<0.95), (vi) values with significant deviation from the Hardy-Weinberg equilibrium (exact test p values < 1 × 10⁻⁶), and/or low minor allele frequencies (<0.01).

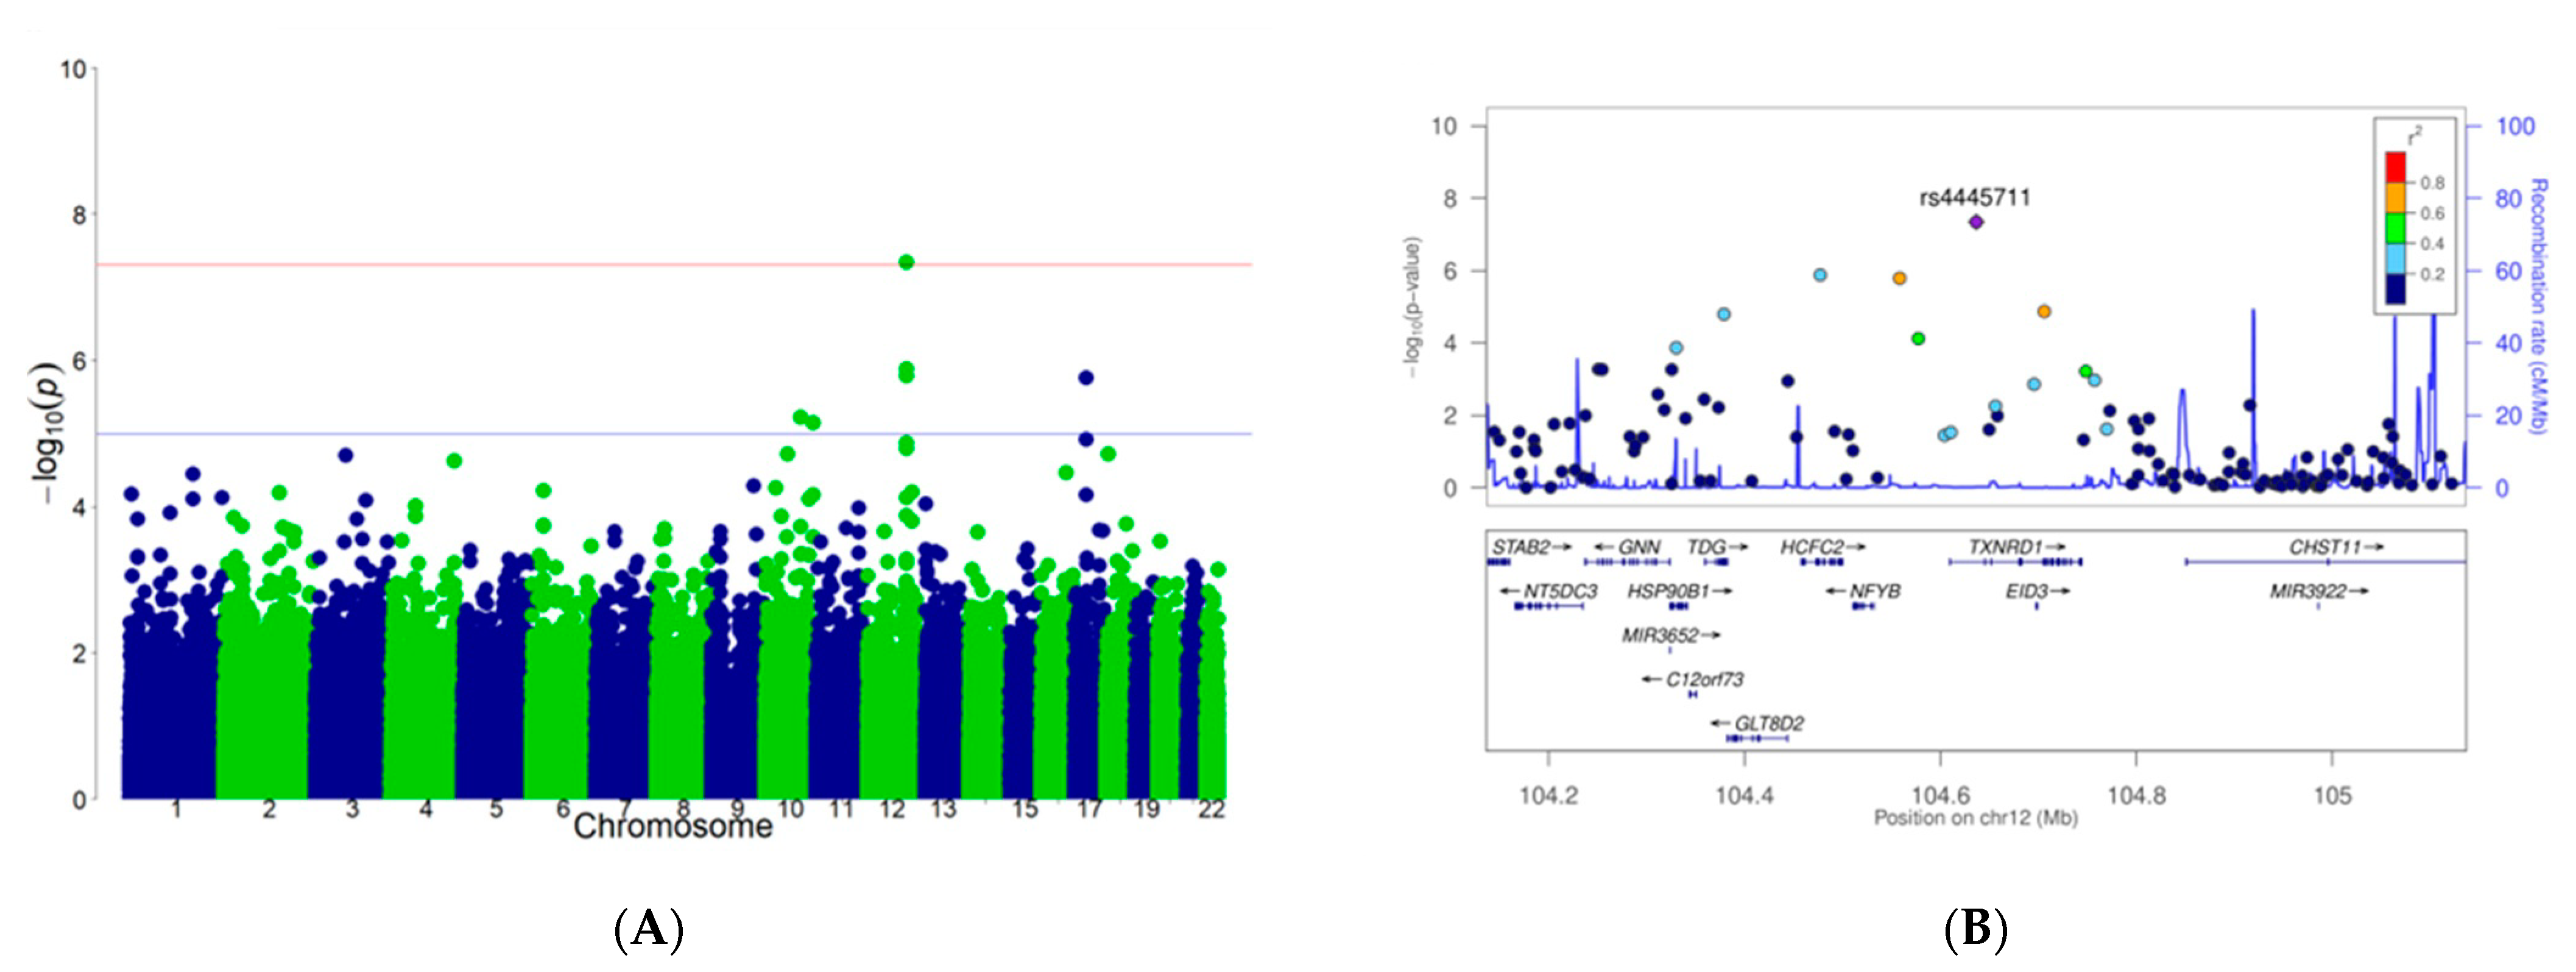
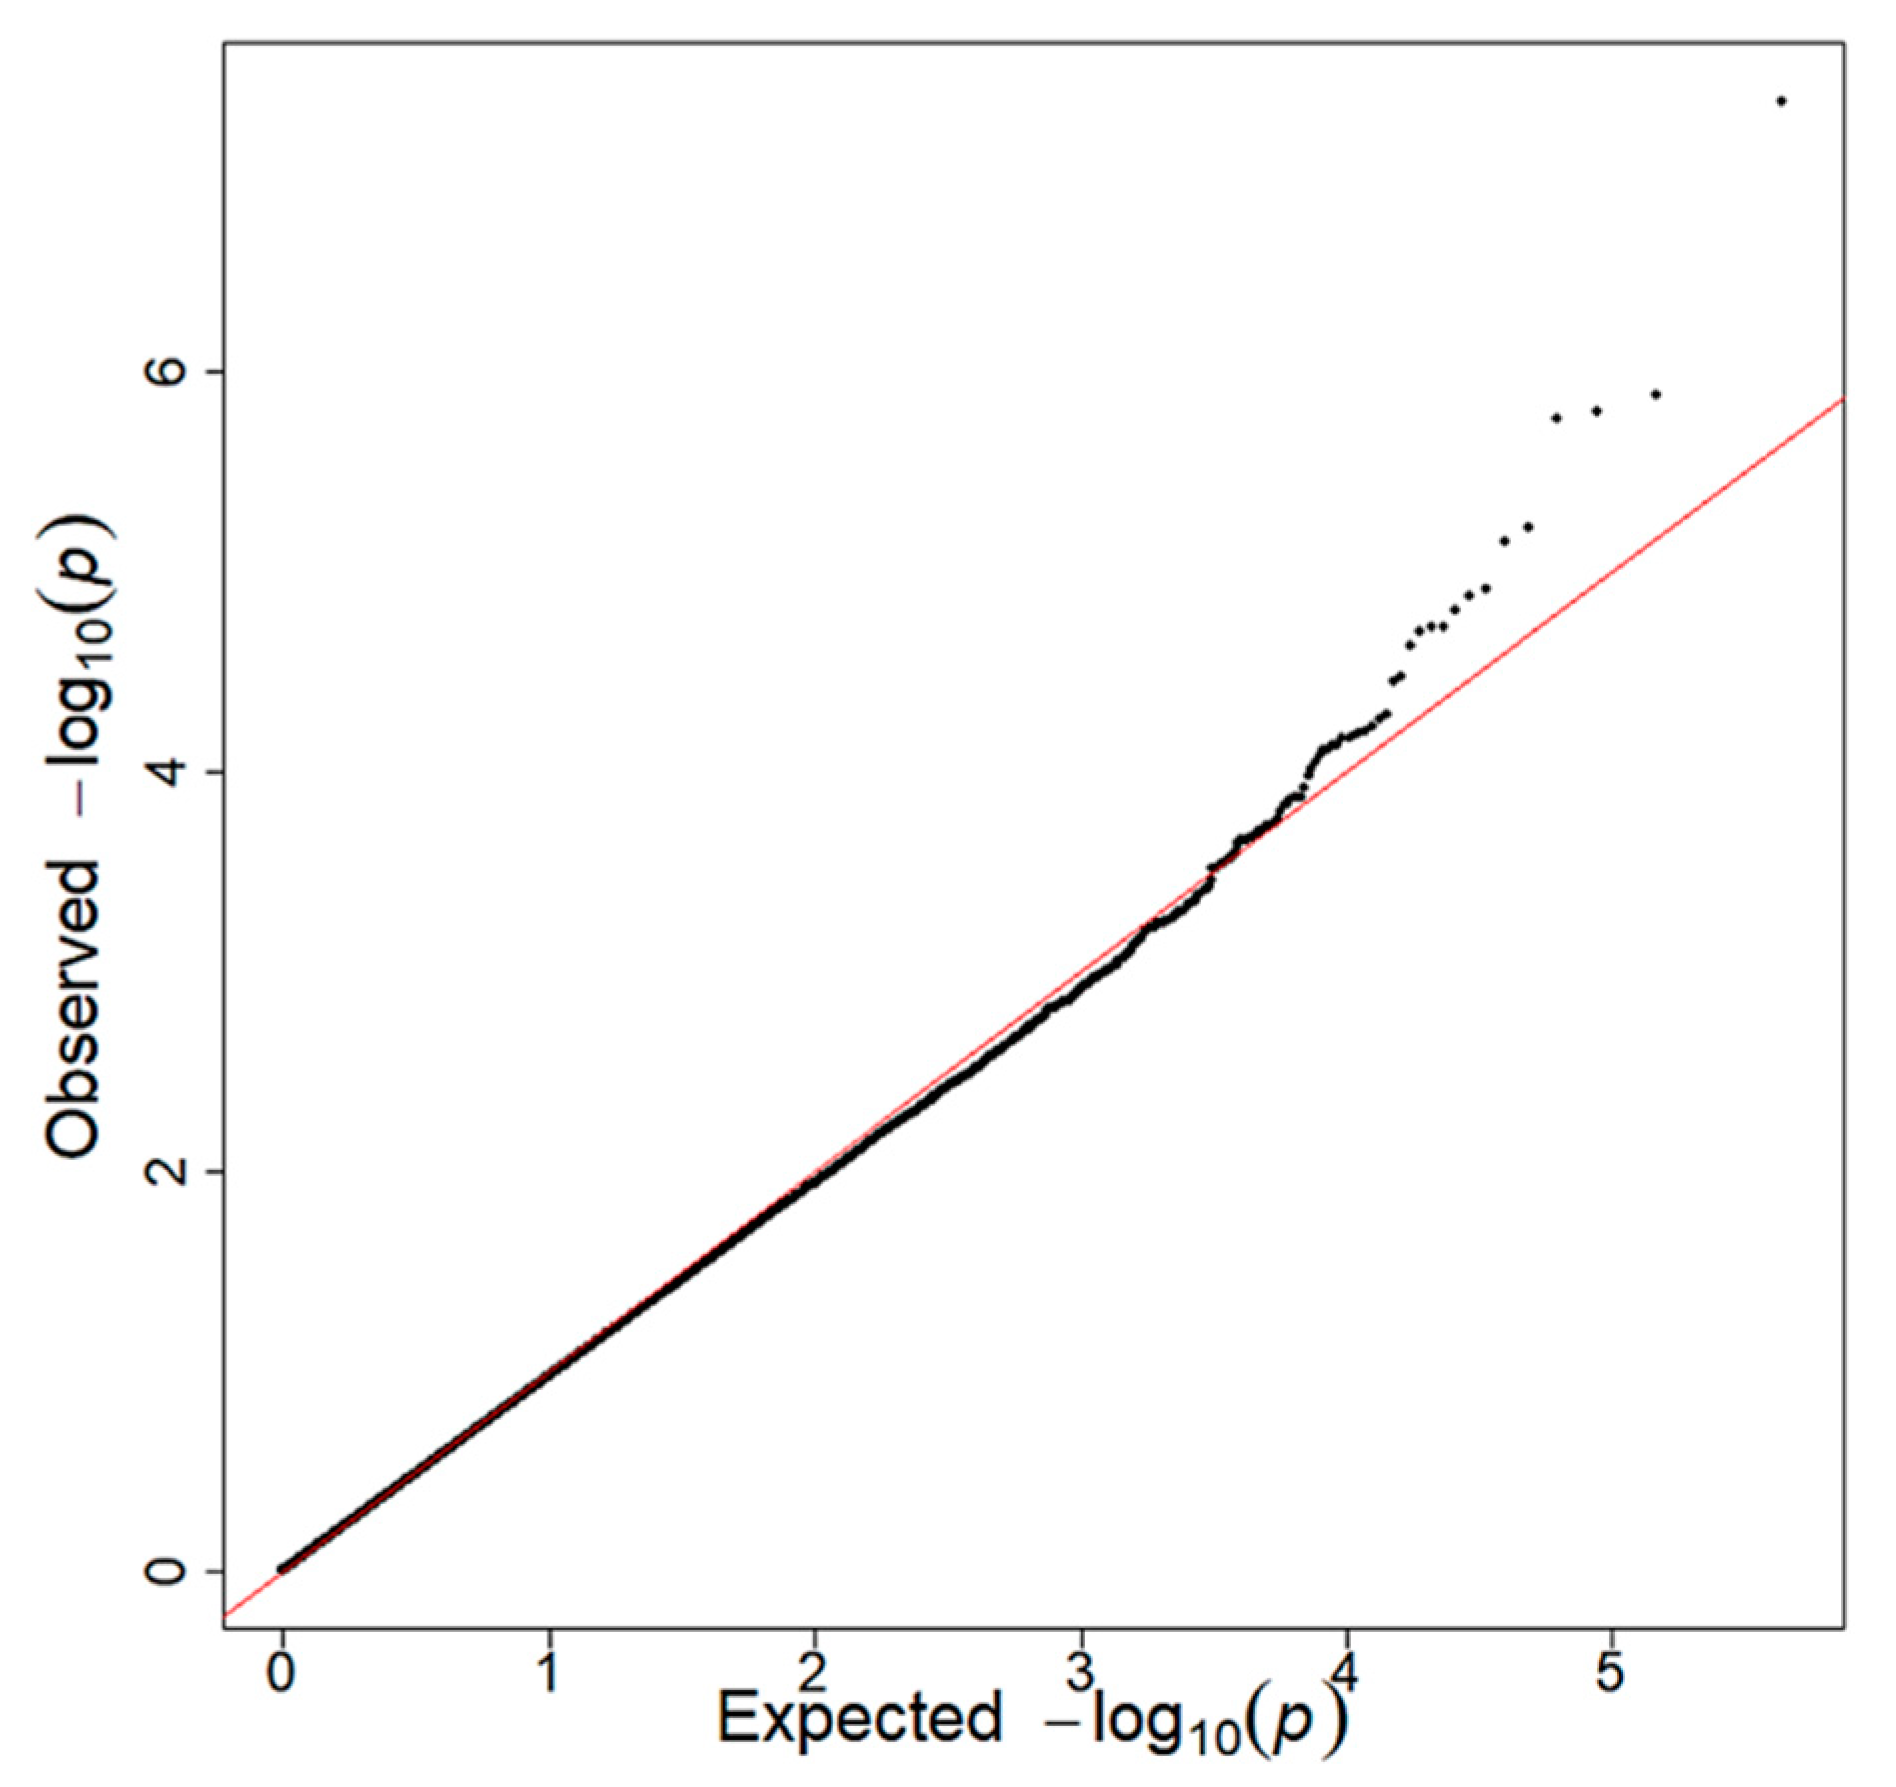
2.4. Genome-Wide Association Study (GWAS)

We conducted a comprehensive search for SNPs that interact with the intake of various vegetables associated with BMI using PLINK (version 1.90b3.42) [24,25].
First, the covariates included age and sex (regression formula: BMI = α + βSNP*SNP + βage*age + βsex*sex+ βvegetable intake frequency*vegetable intake frequency + βinteraction*(SNP*vegetable intake frequency)). We then added alcohol intake, smoking, physical activity and the frequency of total vegetable intake as covariates. Manhattan and quantile–quantile plots were created using the R software package qqman [26] (version 0.1.4). For SNPs that reached significance, we created regional association plots using LocusZoom [27] (version 1.3). A p value < 1 × 10⁻⁵ was considered as suggestive of significance and a p value < 5 × 10⁻⁸ was regarded as having genome-wide significance.

3. Results

A total of 12,225 participants were included in this study (Table 1). The mean BMI was 23.9 ± 3.4 kg/m2 and 22.1 ± 3.8 kg/m2 for men and women, respectively. The prevalence of obesity was 32.3% and 17.3% for men and women, respectively. The mean BMI in individuals with obesity was 27.8 kg/m2 and 28.5 kg/m2 for men and women, respectively. High intake frequency of carrot, broccoli, spinach, other green vegetables (green pepper and green beans), and pumpkin was negatively associated with BMI (p = 3.7 × 10⁻⁸, 1.2 × 10⁻³, 1.2 × 10⁻⁹, 2.8 × 10⁻³, 2.0 × 10⁻¹¹, respectively); no association was observed for cabbage.

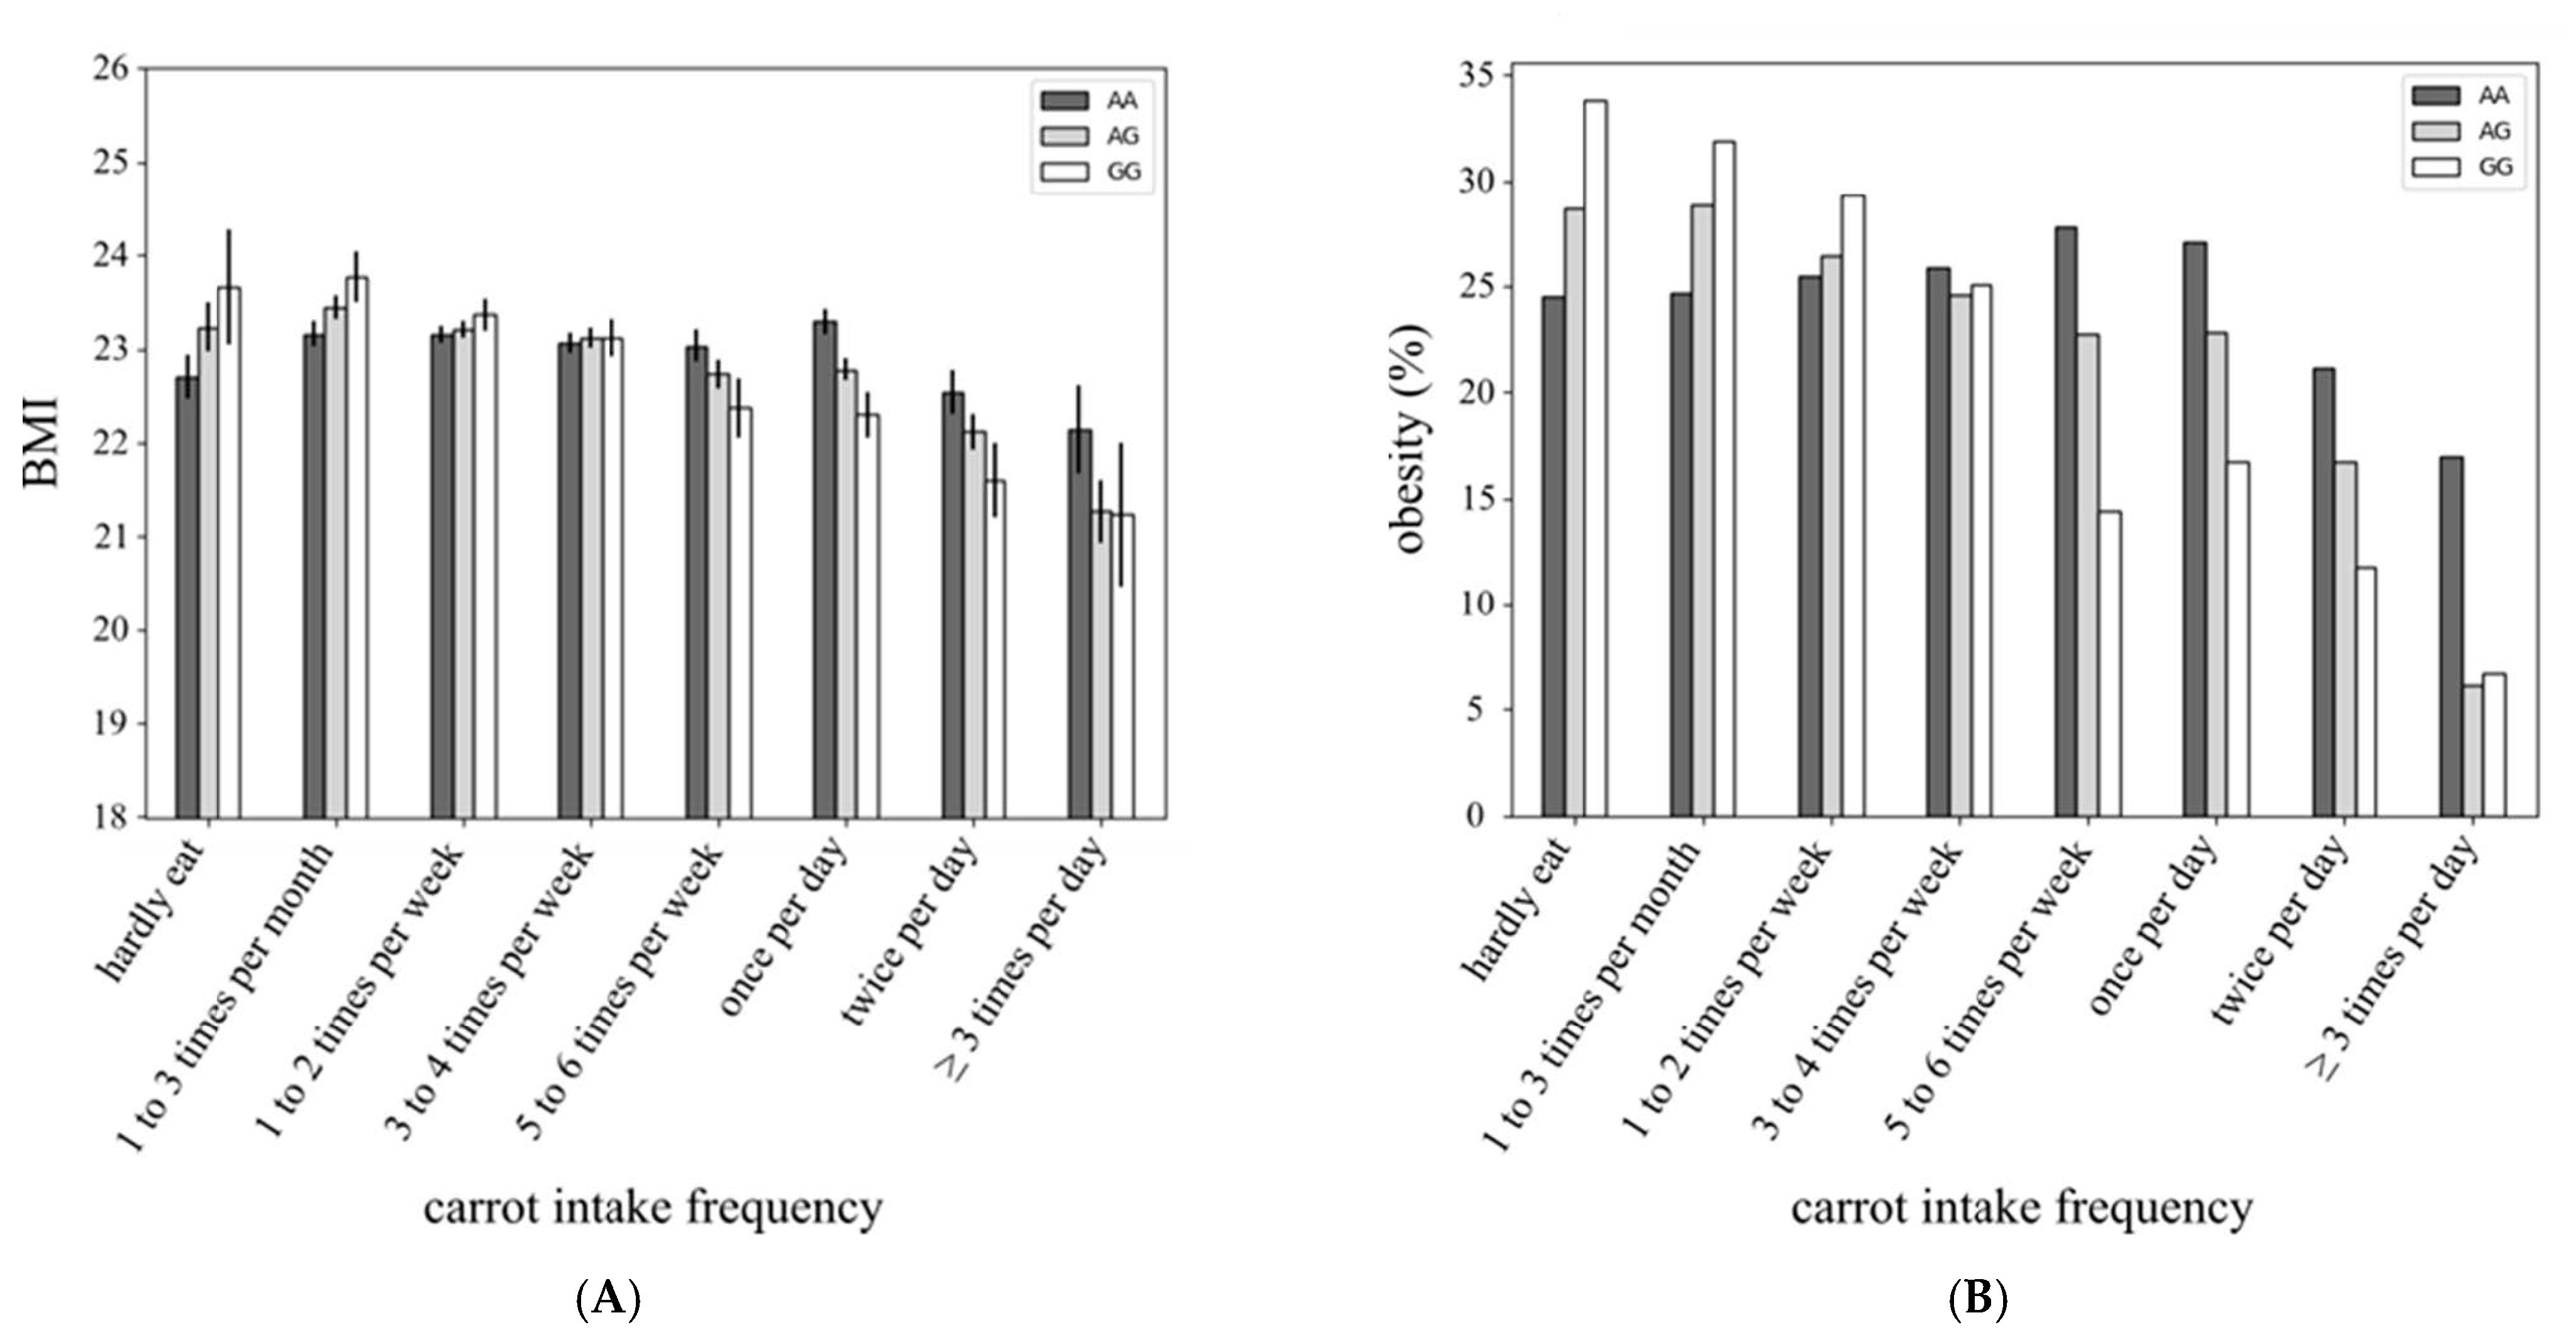
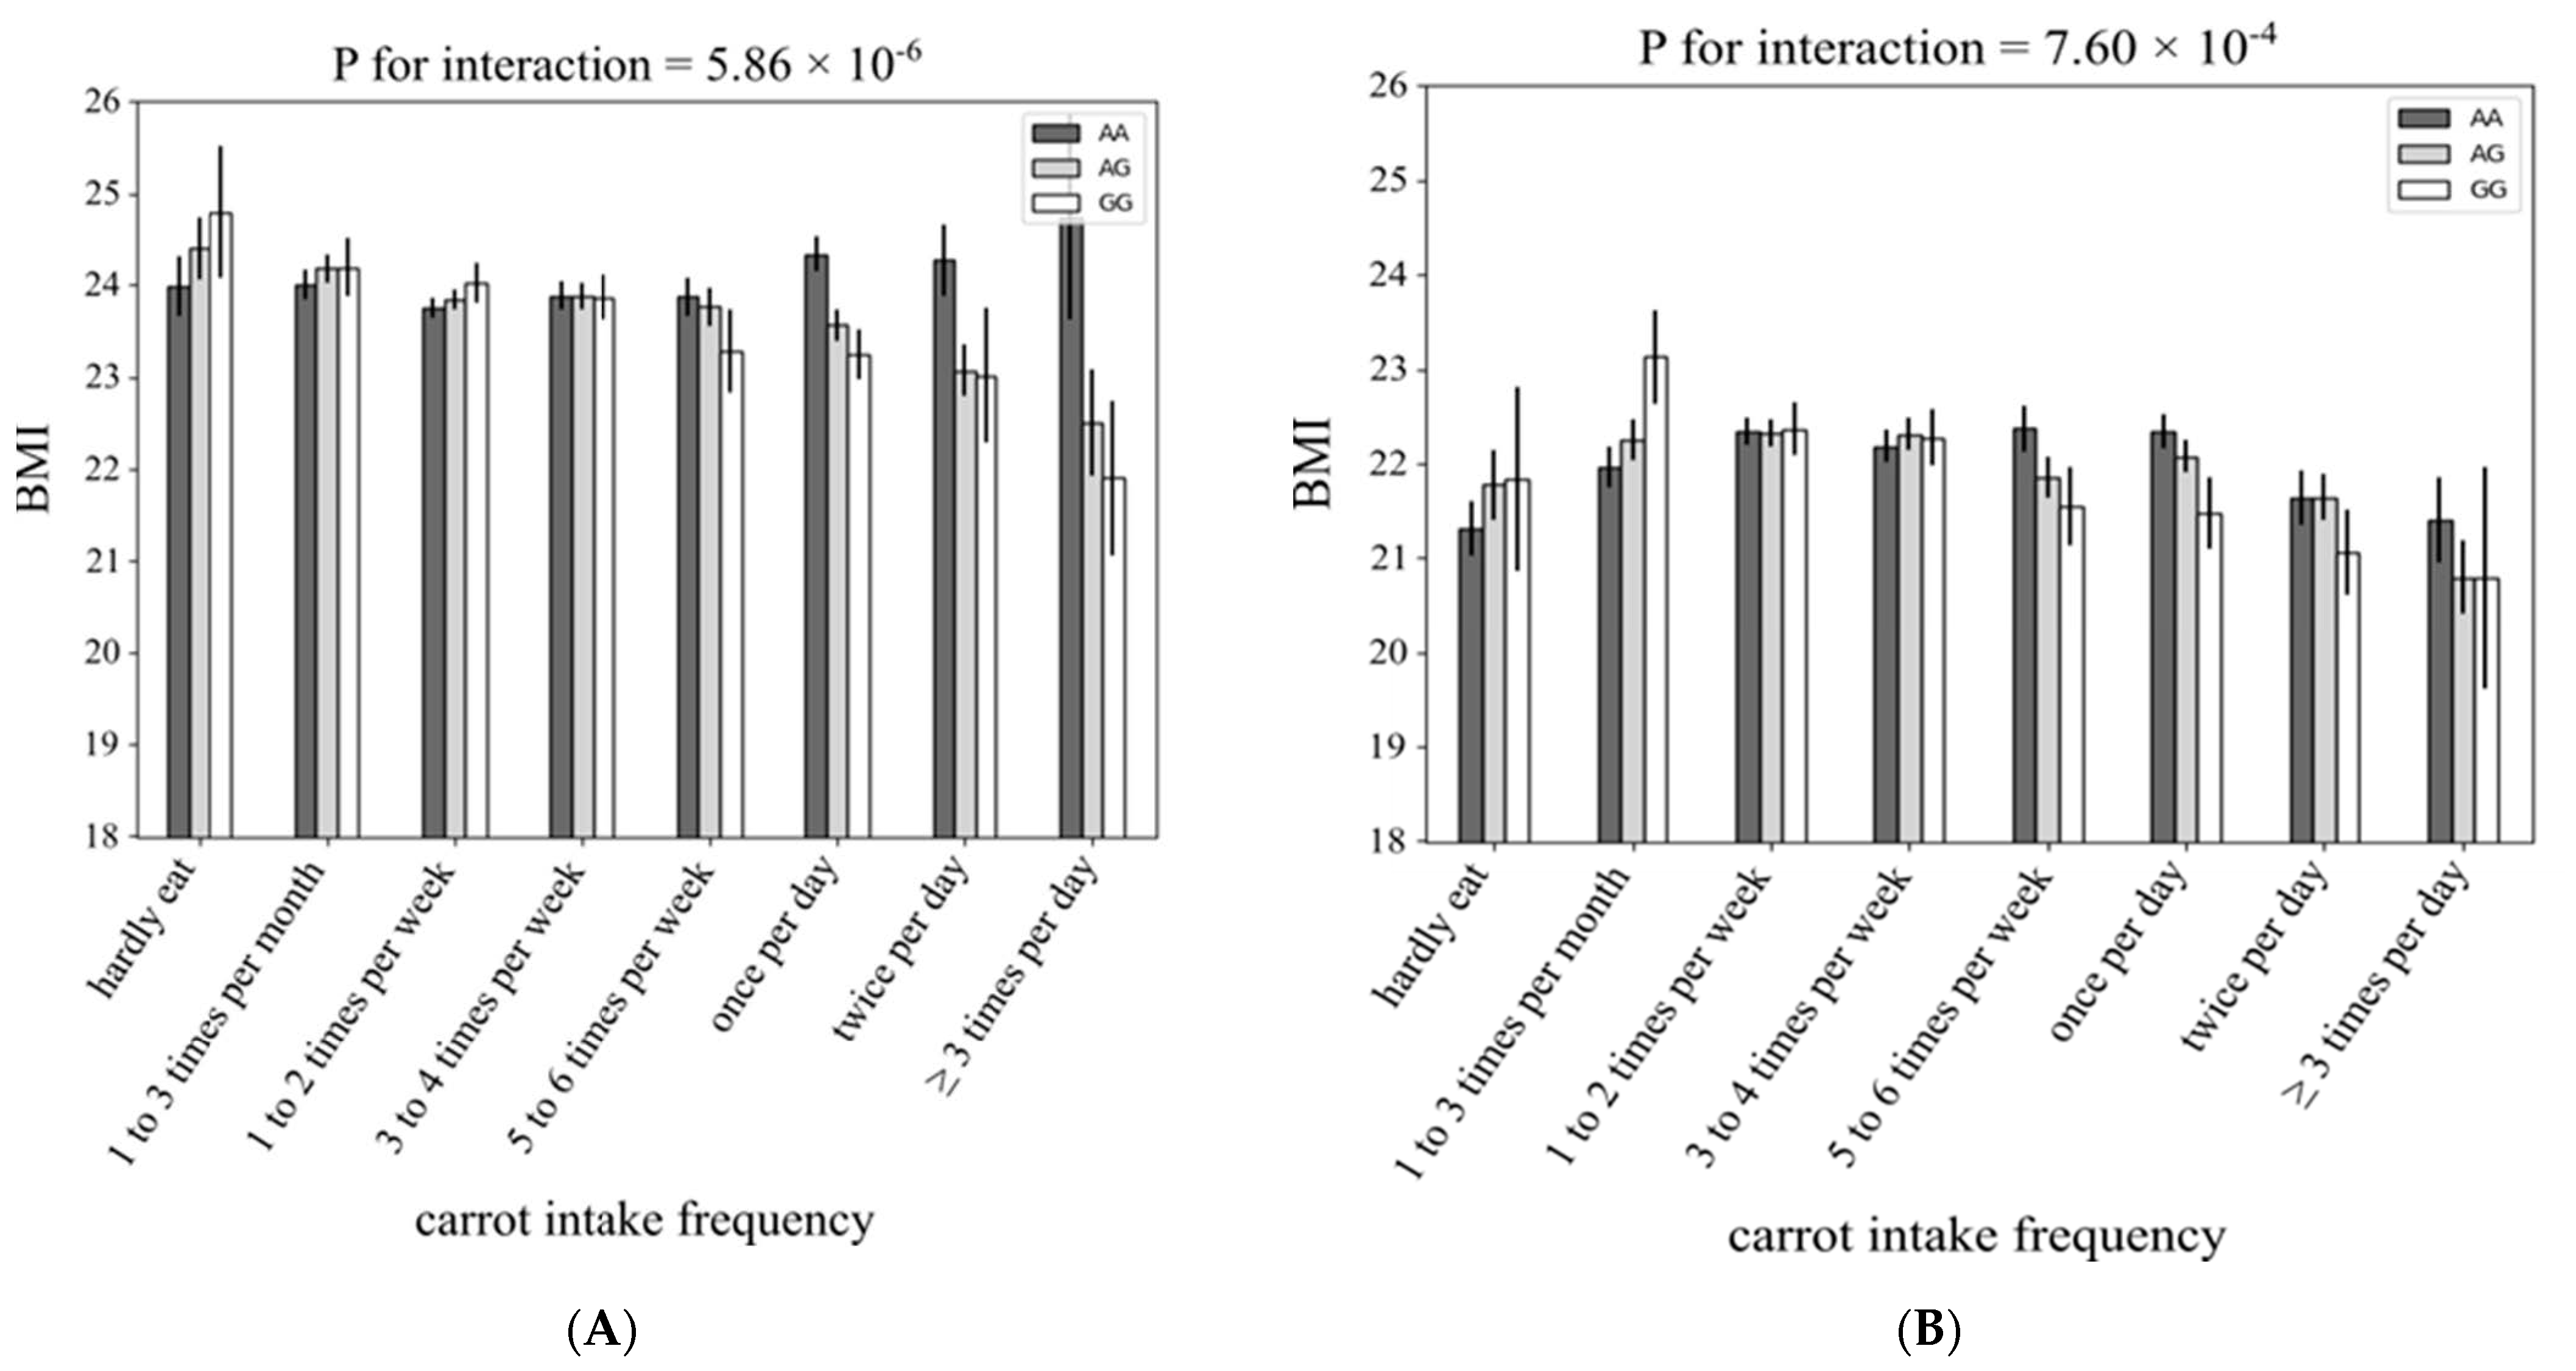
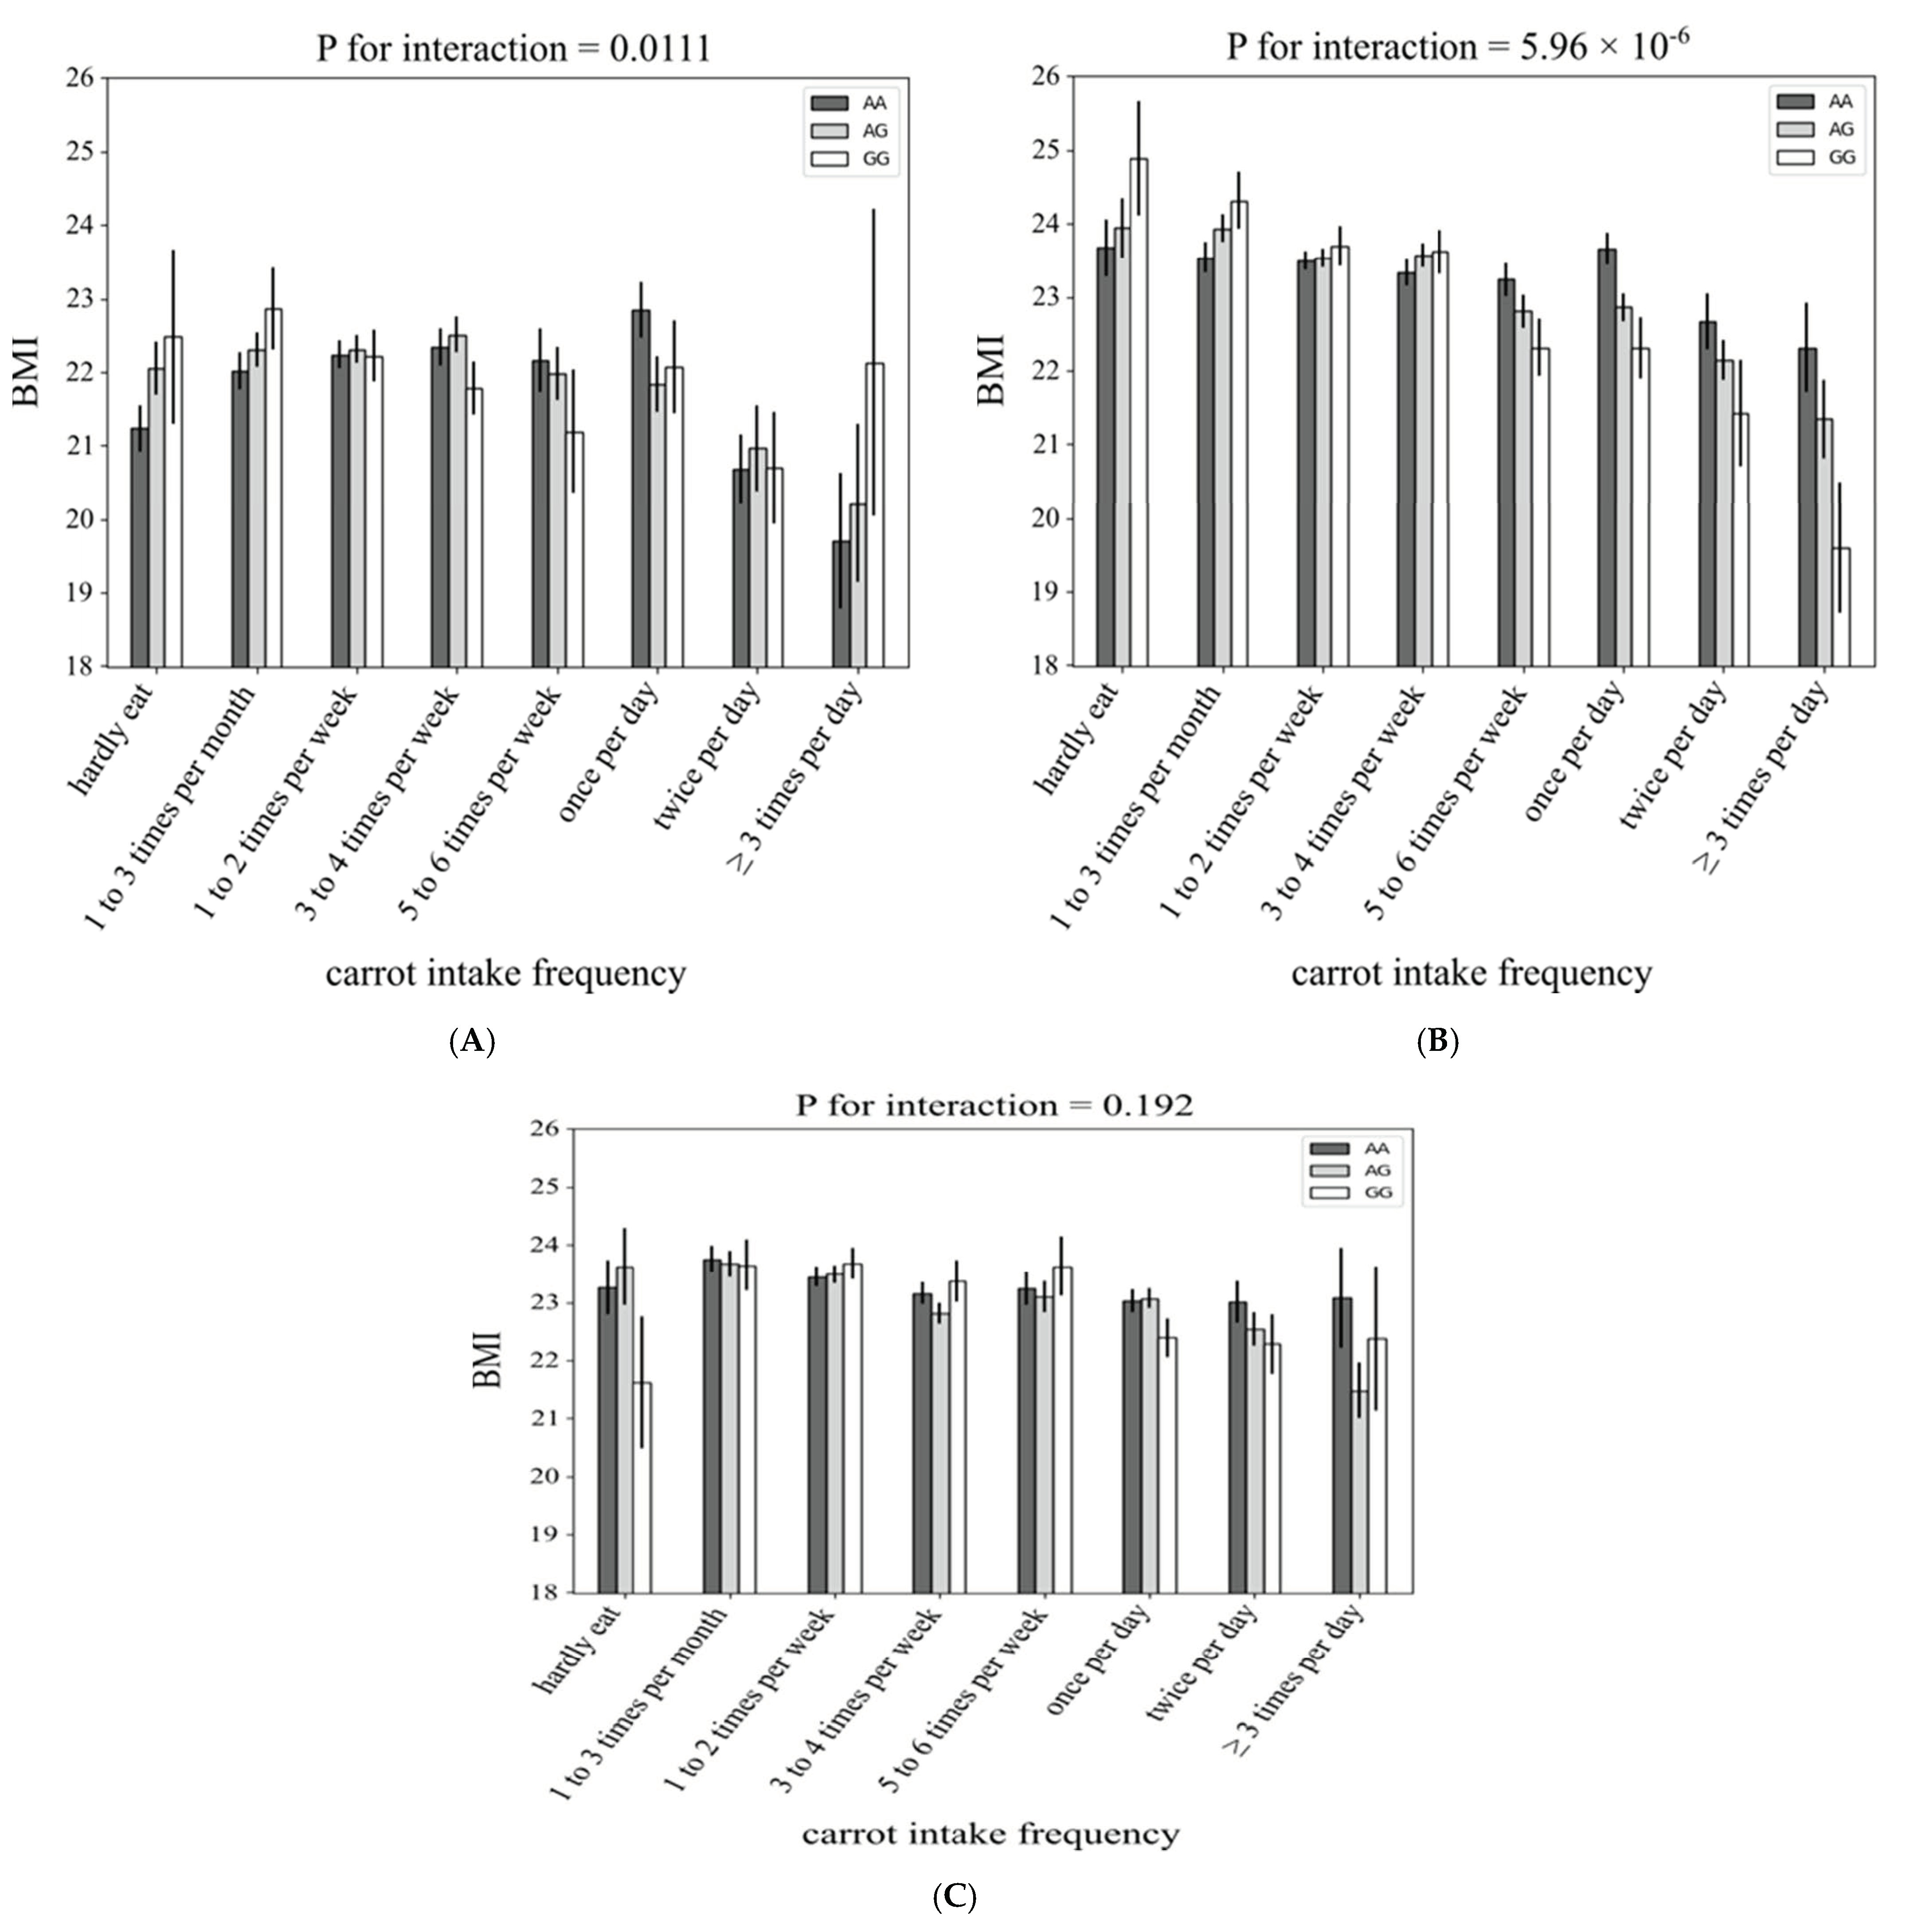
3.1. Interaction between rs4445711 and Frequency of Carrot Intake on BMI

SNPs with suggestive levels of association (p < 1 × 10⁻⁵) with BMI for each vegetable are shown in Table 2. The GWAS revealed a significant interaction between rs4445711 and frequency of carrot intake on BMI and obesity (Figure 1A, p = 4.5 × 10⁻⁸; Figure 1B, p = 2.5 × 10⁻⁸, respectively) adjusted for age and sex. This interaction was slightly attenuated after adjustment for alcohol intake, smoking, physical activity and the frequency of total vegetable intake on BMI (p = 2.1 × 10⁻⁷). Genotype analysis mapped rs4445711 to an intron of the thioredoxin reductase 1 (TXNRD1) gene on human chromosome 12 (Figure 2A), which codes for an antioxidant enzyme regulated by the Nrf2/Keap1 pathway. Figure 2B represents the area plot of chromosome 12 showing the relative location of rs4445711. The overall inflation factor (λ) for the association analysis was 0.9609 (95% confidence interval: 0.9510–0.9705), suggesting a minimal level of confounding with population stratification (Figure 3). There was no association between each rs4445711 allele (AA, AG, GG) and frequency of carrot intake (p = 0.80). In addition, no interactions that are the same as the interaction between frequency of carrot intake and rs4445711 were observed between the frequency of broccoli, spinach, other green vegetables (green pepper and green beans), pumpkin, or cabbage intake and BMI or obesity (Supplemental Table S1). The β coefficient for rs4445711 on BMI in the groups which ate carrot 5 or more times per week or less than 5 times per week was −0.438 and 0.128, respectively. No significant association was observed between rs4445711 variants and underweight (p = 0.49).

3.2. Subgroup Analysis

Figure 4 and Figure 5 show the association between each rs4445711 allele and frequency of carrot intake in men and women and each age category, respectively. The interaction between rs4445711 and BMI was consistent between men and women (p values for interactions in male and female groups were 5.9 × 10⁻⁶ and 7.6 × 10⁻⁴, respectively). However, across the age groups, the p values for interactions in the younger (≤39 years), middle aged (40–59 years), and older adult (≥60 years) groups were 0.0111, 6.0 × 10⁻⁶, and 0.192, respectively; no significant interaction was observed in the older adult group.

4. Discussion

This is the first report of a comprehensive search for SNPs which associate with the interaction between vegetable intake and BMI or obesity using a GWAS of the Japanese population.
We showed interactions between frequency of carrot intake and the rs4445711 variant on BMI and obesity. Our data indicated that the G allele of rs4445711 was associated with lower BMI or obesity in individuals with higher frequency of carrot intake.
There have been no consistent reports on an association between vegetable consumption and subsequent decrease in BMI. Wall et al. reported that children who ate vegetables three or more times per week had a lower BMI compared to children who never or occasionally reported eating vegetables [13]. However, no association was observed between vegetable intake in children and the risk of becoming overweight/obese in Western countries [14,15]. In addition, Charlton et al. suggested that improving adherence to dietary targets for fruits and vegetables may be a dietary strategy to overcome overweight among men but not among women [12]. The results indicate the importance of gene–environment interactions, such as genetic variations and frequency of specific vegetable intake. As far as we know, this is the first study to determine the role of interactions between specific genetic factors and the frequency of specific vegetable intake on BMI or obesity. The interaction between frequency of carrot intake and BMI may be dependent on rs4445711; suggesting that carrot intake may contribute to BMI values through rs4445711.
Carrots are rich in carotenoid antioxidants, such as β-carotene, α-carotene and β-cryptoxanthin. Epidemiological studies have shown that a high content of β-carotene in the blood correlates with a low incidence of type 2 diabetes, cancers and mortality [28,29,30,31,32]. Serum β-carotene has also been inversely associated with systemic markers of inflammation and insulin resistance [33,34]. A small-sized cross-sectional study showed that higher intakes of cryptoxanthin was related to low BMI in middle-aged Japanese women [35]. A longitudinal study showed that changes in serum β-cryptoxanthin levels were inversely correlated with changes in BMI in Western countries [36] and Iwata et al. reported that a β-cryptoxanthin-containing beverages produced a greater decrease in BMI and visceral fat area compared with a placebo beverage in pre-obese Japanese men [37]. These results indicate that increased carrot intake may lead to an increase in nutrients which interact with the rs4445711 G-allele. As a result, increased frequency of carrot intake may enhance the reduction in insulin resistance. Future studies are necessary to clarify the effects of serum levels of α-carotene, β-carotene, β-cryptoxanthin and systemic markers of inflammation and insulin resistance on the association between the rs4445711 G-allele and BMI.
The SNP rs4445711 is located in an intron of thioredoxin reductase 1 (TXNRD1) [38], an antioxidant enzyme regulated by the Nrf2/Keap1 pathway. Although rs4445711 has not been reported in the GWAS catalog, other SNPs on TXNRD1 have potential associations with free IGF-1 (rs11112046, p = 3.34 × 10⁻⁶) [39,40,41]. In addition, TXNRD1 levels in adipose tissue correlated with BMI [42]. A previous study showed that rs4445711 associated with the expression of E1A-like inhibitor of differentiation 3 (EID3) and thymine DNA glycosylase (TDG) in subcutaneous fat using eQTL analysis (p = 9.4 × 10⁻¹⁹, p = 2.4 × 10⁻⁶) [43]. The expression of EID3 was varied in other tissues [44]. Although further research is needed to understand the association between these results and our findings, our results may provide a clue to the mechanism of individual differences in BMI with regard to vegetable intake.
Our study has several limitations. First, we have no data on total carrot intake and carrot cultivars. Second, BMI data were self-reported via the internet, which may have introduced measurement error; however, the accuracy of internet-based BMI is reported to be high [45]. It is important to note that the definition of obesity differs between Japan and Western countries. Third, people who eat more carrots may have other healthy lifestyle behaviors; however, the results did not change even after adjusting for the effects of other vegetable intakes and exercise habits. Forth, although we have made efforts to adjust for factors that might affect BMI, residual confounding factors may exist, such as total calories, macro-nutrients, and dietary fiber intake. Fifth, we did not collect serum carotenoid concentration.
In conclusion, the frequency of carrot consumption has been implicated in reducing the BMI through the intermediary of rs4445711. This novel genetic association may provide new clues to clarify the association between vegetable intake and BMI.

Supplementary Materials

The following are available online at https://www.mdpi.com/article/10.3390/nu13103478/s1, Table S1: Interactions between rs4445711 and frequency of various types of vegetable intake on body mass index.

Author Contributions

H.S. (Hirohito Sone) had full access to all of the data in the study and takes responsibility for the integrity of the data and the accuracy of the data analysis. Study members that contributed significantly to this work are as follows: Study concept and design: K.F., S.N. and K.S.; Acquisition of data: K.F., S.N. and K.S.; Analysis and interpretation of data: K.F., S.N., C.H., K.S. and S.K.; Drafting of the manuscript: K.F., S.N., Y.T., K.C., H.I., Y.N. and T.M.; Critical revision of the manuscript for important intellectual content: K.F., S.N., K.S., S.K. and H.S. (Hitoshi Shimano); Statistical analysis: S.N.; Study supervision: S.K. and H.S. (Hirohito Sone). All authors have read and agreed to the published version of the manuscript.

Funding

This work is supported in part by the Japan Society for the Promotion of Science (19H04028).

Institutional Review Board Statement

The study was conducted according to the guidelines of the Declaration of Helsinki, and approved by the Ethics Committee of the Niigata University and Genequest Inc. (protocol code 2015-2623 and G2017-0023, 2017-15-1).

Informed Consent Statement

Informed consent was obtained from all subjects involved in the study.

Data Availability Statement

All data analyzed during this study are included in this paper and its additional files. Other data are available from the author upon reasonable request.

Acknowledgments

The authors would like to thank Mami Haga, Niigata University Faculty of Medicine, for excellent secretarial assistance.

Conflicts of Interest

S.N. is an employee of Genequest Inc.; K.S. is a board member of Genequest Inc. K.F., C.H., S.K. and H.S. declare no potential conflict of interest.

Ethical Approval

The ethics committee of the Niigata University and Genequest Inc. approved the present study (2015-2623 and G2017-0023, 2017-15-1).

Informed Consent

Informed consent was acquired and signed by each patient enrolled in the study.

Abbreviations

BMIbody mass index
EIDE1A-like inhibitor of differentiation
GWASgenome wide association study
SNPssingle nucleotide polymorphisms
TXNRDthioredoxin reductase

References

  1. Wang, X.; Ouyang, Y.; Liu, J.; Zhu, M.; Zhao, G.; Bao, W.; Hu, F.B. Fruit and vegetable consumption and mortality from all causes, cardiovascular disease, and cancer: Systematic review and dose-response meta-analysis of prospective cohort studies. BMJ 2014, 349, g4490. [Google Scholar] [CrossRef] [PubMed] [Green Version]
  2. Boeing, H.; Bechthold, A.; Bub, A.; Ellinger, S.; Haller, D.; Kroke, A.; Leschik-Bonnet, E.; Müller, M.J.; Oberritter, H.; Schulze, M.; et al. Critical review: Vegetables and fruit in the prevention of chronic diseases. Eur. J. Nutr. 2012, 51, 637–663. [Google Scholar] [CrossRef] [PubMed] [Green Version]
  3. Blüher, M. Obesity: Global epidemiology and pathogenesis. Nat. Rev. Endocrinol. 2019, 15, 288–298. [Google Scholar] [CrossRef] [PubMed]
  4. Hruby, A.; Hu, F.B. The Epidemiology of Obesity: A Big Picture. Pharmacoeconomics 2015, 33, 673–689. [Google Scholar] [CrossRef] [PubMed]
  5. WHO. Obesity and Overweight. Available online: https://www.who.int/news-room/fact-sheets/detail/obesity-and-overweight (accessed on 9 June 2021).
  6. Katz, D.A.; McHorney, C.A.; Atkinson, R.L. Impact of obesity on health-related quality of life in patients with chronic illness. J. Gen. Intern. Med. 2000, 15, 789–796. [Google Scholar] [CrossRef] [Green Version]
  7. Taylor, V.H.; Forhan, M.; Vigod, S.; McIntyre, R.S.; Morrison, K. The impact of obesity on quality of life. Best Pract. Res. Clin. Endocrinol. Metab. 2013, 27, 139–146. [Google Scholar] [CrossRef] [PubMed]
  8. Schlesinger, S.; Neuenschwander, M.; Schwedhelm, C.; Hoffmann, G.; Bechthold, A.; Boeing, H.; Schwingshackl, L. Food Groups and Risk of Overweight, Obesity, and Weight Gain: A Systematic Review and Dose-Response Meta-Analysis of Prospective Studies. Adv. Nutr. 2019, 10, 205–218. [Google Scholar] [CrossRef] [Green Version]
  9. Nour, M.; Lutze, S.A.; Grech, A.; Allman-Farinelli, M. The Relationship between Vegetable Intake and Weight Outcomes: A Systematic Review of Cohort Studies. Nutrients 2018, 10, 1626. [Google Scholar] [CrossRef] [Green Version]
  10. Mozaffarian, D.; Hao, T.; Rimm, E.B.; Willett, W.C.; Hu, F.B. Changes in Diet and Lifestyle and Long-Term Weight Gain in Women and Men. N. Engl. J. Med. 2011, 364, 2392–2404. [Google Scholar] [CrossRef] [Green Version]
  11. Bertoia, M.L.; Mukamal, K.J.; Cahill, L.E.; Hou, T.; Ludwig, D.S.; Mozaffarian, D.; Willett, W.C.; Hu, F.B.; Rimm, E.B. Changes in Intake of Fruits and Vegetables and Weight Change in United States Men and Women Followed for Up to 24 Years: Analysis from Three Prospective Cohort Studies. PLoS Med. 2015, 12, e1001878. [Google Scholar] [CrossRef]
  12. Charlton, K.; Kowal, P.; Soriano, M.M.; Williams, S.; Banks, E.; Vo, K.; Byles, J. Fruit and Vegetable Intake and Body Mass Index in a Large Sample of Middle-Aged Australian Men and Women. Nutrients 2014, 6, 2305–2319. [Google Scholar] [CrossRef] [PubMed] [Green Version]
  13. Wall, C.R.; Stewart, A.W.; Hancox, R.J.; Murphy, R.; Braithwaite, I.; Beasley, R.; Mitchell, E.A.; ISAAC Phase Three Study Group. Association between Frequency of Consumption of Fruit, Vegetables, Nuts and Pulses and BMI: Analyses of the International Study of Asthma and Allergies in Childhood (ISAAC). Nutrients 2018, 10, 316. [Google Scholar] [CrossRef] [PubMed] [Green Version]
  14. Field, A.E.; Gillman, M.W.; Rosner, B.; Rockett, H.R.; Colditz, G. Association between fruit and vegetable intake and change in body mass index among a large sample of children and adolescents in the United States. Int. J. Obes. 2003, 27, 821–826. [Google Scholar] [CrossRef] [PubMed] [Green Version]
  15. Rautiainen, S.; Wang, L.; Lee, I.M.; Manson, J.E.; Buring, J.E.; Sesso, H.D. Higher Intake of Fruit, but Not Vegetables or Fiber, at Baseline Is Associated with Lower Risk of Becoming Overweight or Obese in Middle-Aged and Older Women of Normal BMI at Baseline. J. Nutr. 2015, 145, 960–968. [Google Scholar] [CrossRef] [Green Version]
  16. Yuan, S.; Yu, H.J.; Liu, M.W.; Huang, Y.; Yang, X.H.; Tang, B.W.; Song, Y.; Cao, Z.K.; Wu, H.J.; He, Q.Q.; et al. The association of fruit and vegetable consumption with changes in weight and body mass index in Chinese adults: A cohort study. Public Health 2018, 157, 121–126. [Google Scholar] [CrossRef] [Green Version]
  17. Matoba, N.; Akiyama, M.; Ishigaki, K.; Kanai, M.; Takahashi, A.; Momozawa, Y.; Ikegawa, S.; Ikeda, M.; Iwata, N.; Hirata, M.; et al. GWAS of 165,084 Japanese individuals identified nine loci associated with dietary habits. Nat. Hum. Behav. 2020, 4, 308–316. [Google Scholar] [CrossRef]
  18. Calancie, L.; Keyserling, T.C.; Taillie, L.S.; Robasky, K.; Patterson, C.; Ammerman, A.S.; Schisler, J.C. TAS2R38 Predisposition to Bitter Taste Associated with Differential Changes in Vegetable Intake in Response to a Community-Based Dietary Intervention. G3 Genes Genomes Genet. 2018, 8, 2107–2119. [Google Scholar] [CrossRef] [Green Version]
  19. Mikołajczyk-Stecyna, J.; Malinowska, A.; Chmurzynska, A. TAS2R38 and CA6 genetic polymorphisms, frequency of bitter food intake, and blood biomarkers among elderly woman. Appetite 2017, 116, 57–64. [Google Scholar] [CrossRef]
  20. Locke, A.E.; Kahali, B.; Berndt, S.I.; Justice, A.E.; Pers, T.H.; Day, F.R.; Powell, C.; Vedantam, S.; Buchkovich, M.L.; Yang, J.; et al. Genetic studies of body mass index yield new insights for obesity biology. Nature 2015, 518, 197–206. [Google Scholar] [CrossRef] [Green Version]
  21. Examination Committee of Criteria for ’Obesity Disease’ in Japan. New criteria for ‘obesity disease’ in Japan. Circ. J. 2002, 66, 987–992. [Google Scholar] [CrossRef] [Green Version]
  22. Yamaguchi-Kabata, Y.; Nakazono, K.; Takahashi, A.; Saito, S.; Hosono, N.; Kubo, M.; Nakamura, Y.; Kamatani, N. Japanese Population Structure, Based on SNP Genotypes from 7003 Individuals Compared to Other Ethnic Groups: Effects on Population-Based Association Studies. Am. J. Hum. Genet. 2008, 83, 445–456. [Google Scholar] [CrossRef] [Green Version]
  23. Price, A.L.; Patterson, N.J.; Plenge, R.M.; Weinblatt, M.E.; Shadick, N.A.; Reich, D. Principal components analysis corrects for stratification in genome-wide association studies. Nat. Genet. 2006, 38, 904–909. [Google Scholar] [CrossRef]
  24. Purcell, S.; Neale, B.; Todd-Brown, K.; Thomas, L.; Ferreira, M.A.R.; Bender, D.; Maller, J.; Sklar, P.; de Bakker, P.I.W.D.; Daly, M.J.; et al. PLINK: A Tool Set for Whole-Genome Association and Population-Based Linkage Analyses. Am. J. Hum. Genet. 2007, 81, 559–575. [Google Scholar] [CrossRef] [Green Version]
  25. Chang, C.C.; Chow, C.C.; Tellier, L.C.A.M.; Vattikuti, S.; Purcell, S.M.; Lee, J.J. Second-generation PLINK: Rising to the challenge of larger and richer datasets. GigaScience 2015, 4, 7. [Google Scholar] [CrossRef] [PubMed]
  26. Turner, S.D. qqman: An R package for visualizing GWAS results using QQ and manhattan plots. BioRxiv 2014, 1, 005165. [Google Scholar]
  27. Pruim, R.J.; Welch, R.P.; Sanna, S.; Teslovich, T.M.; Chines, P.S.; Gliedt, T.P.; Boehnke, M.; Abecasis, G.; Willer, C.J. LocusZoom: Regional visualization of genome-wide association scan results. Bioinformatics 2010, 26, 2336–2337. [Google Scholar] [CrossRef] [PubMed] [Green Version]
  28. Ford, E.S.; Will, J.C.; Bowman, B.A.; Narayan, K.M.V. Diabetes Mellitus and Serum Carotenoids: Findings from the Third National Health and Nutrition Examination Survey. Am. J. Epidemiol. 1999, 149, 168–176. [Google Scholar] [CrossRef] [PubMed]
  29. Coyne, T.; Ibiebele, T.I.; Baade, P.D.; Dobson, A.; McClintock, C.; Dunn, S.; Leonard, D.; Shaw, J. Diabetes mellitus and serum carotenoids: Findings of a population-based study in Queensland, Australia. Am. J. Clin. Nutr. 2005, 82, 685–693. [Google Scholar] [CrossRef]
  30. Zheng, J.S.; Sharp, S.J.; Imamura, F.; Chowdhury, R.; Gundersen, T.E.; Steur, M.; Sluijs, I.; van der Schouw, Y.T.; Agudo, A.; Aune, D.; et al. Association of plasma biomarkers of fruit and vegetable intake with incident type 2 diabetes: EPIC-InterAct case-cohort study in eight European countries. BMJ 2020, 370, m2194. [Google Scholar] [CrossRef] [PubMed]
  31. Albanes, D. Beta-carotene and lung cancer: A case study. Am. J. Clin. Nutr. 1999, 69, 1345S–1350S. [Google Scholar] [CrossRef] [PubMed]
  32. Huang, J.; Weinstein, S.J.; Yu, K.; Männistö, S.; Albanes, D. Serum Beta Carotene and Overall and Cause-Specific Mortality. Circ. Res. 2018, 123, 1339–1349. [Google Scholar] [CrossRef] [PubMed]
  33. Erlinger, T.P.; Guallar, E.; Miller, E.R., 3rd; Stolzenberg-Solomon, R.; Appel, L.J. Relationship between systemic markers of inflammation and serum beta-carotene levels. Arch. Intern. Med. 2001, 161, 1903–1908. [Google Scholar] [CrossRef] [Green Version]
  34. Higuchi, K.; Saito, I.; Maruyama, K.; Eguchi, E.; Mori, H.; Tanno, S.; Sakurai, S.; Kishida, T.; Nishida, W.; Osawa, H.; et al. Associations of serum β-carotene and retinol concentrations with insulin resistance: The Toon Health Study. Nutrition 2015, 31, 975–980. [Google Scholar] [CrossRef] [PubMed]
  35. Hirose, A.; Terauchi, M.; Hirano, M.; Akiyoshi, M.; Owa, Y.; Kato, K.; Kubota, T. Higher intake of cryptoxanthin is related to low body mass index and body fat in Japanese middle-aged women. Maturitas 2016, 96, 89–94. [Google Scholar] [CrossRef] [PubMed] [Green Version]
  36. Andersen, L.F.; Jacobs, D.R.; Gross, M.D.; Schreiner, P.J.; Williams, O.D.; Lee, D.-H. Longitudinal associations between body mass index and serum carotenoids: The CARDIA study. Br. J. Nutr. 2006, 95, 358–365. [Google Scholar] [CrossRef] [PubMed] [Green Version]
  37. Iwata, A.; Matsubara, S.; Miyazaki, K. Beneficial effects of a beta-cryptoxanthin-containing beverage on body mass index and visceral fat in pre-obese men: Double-blind, placebo-controlled parallel trials. J. Funct. Foods 2018, 41, 250–257. [Google Scholar] [CrossRef]
  38. Crosley, L.; Méplan, C.; Nicol, F.; Rundlöf, A.; Arnér, E.; Hesketh, J.; Arthur, J. Differential regulation of expression of cytosolic and mitochondrial thioredoxin reductase in rat liver and kidney. Arch. Biochem. Biophys. 2007, 459, 178–188. [Google Scholar] [CrossRef]
  39. Buniello, A.; MacArthur, J.A.L.; Cerezo, M.; Harris, L.W.; Hayhurst, J.; Malangone, C.; McMahon, A.; Morales, J.; Mountjoy, E.; Sollis, E.; et al. The NHGRI-EBI GWAS Catalog of published genome-wide association studies, targeted arrays and summary statistics 2019. Nucleic Acids Res. 2019, 47, D1005–D1012. [Google Scholar] [CrossRef] [Green Version]
  40. Comuzzie, A.G.; Cole, S.A.; Laston, S.L.; Voruganti, V.S.; Haack, K.; Gibbs, R.A.; Butte, N.F. Novel genetic loci identified for the pathophysiology of childhood obesity in the Hispanic population. PLoS ONE 2012, 7, e51954. [Google Scholar] [CrossRef] [Green Version]
  41. Rundlöf, A.-K.; Arnér, E. Regulation of the Mammalian Selenoprotein Thioredoxin Reductase 1 in Relation to Cellular Phenotype, Growth, and Signaling Events. Antioxid. Redox Signal. 2004, 6, 41–52. [Google Scholar] [CrossRef]
  42. Peng, X.; Giménez-Cassina, A.; Petrus, P.; Conrad, M.; Rydén, M.; Arnér, E.S. Thioredoxin reductase 1 suppresses adipocyte differentiation and insulin responsiveness. Sci. Rep. 2016, 6, 28080. [Google Scholar] [CrossRef] [PubMed] [Green Version]
  43. GTEx Portal. Available online: https://gtexportal.org/home/faq#citePortal (accessed on 1 August 2021).
  44. Lonsdale, J.; Thomas, J.; Salvatore, M.; Phillips, R.; Lo, E.; Shad, S.; Hasz, R.; Walters, G.; Garcia, F.; Young, N.; et al. The Genotype-Tissue Expression (GTEx) project. Nat. Genet. 2013, 45, 580–585. [Google Scholar] [CrossRef] [PubMed]
  45. Pursey, K.; Burrows, T.L.; Stanwell, P.; Collins, C.E. How accurate is web-based self-reported height, weight, and body mass index in young adults? J. Med. Internet Res. 2014, 16, e4. [Google Scholar] [CrossRef] [PubMed]
Figure 1. Interaction between rs4445711 and frequency of carrot intake on body mass index (BMI) (A) and obesity (B) in both men and women.
Nutrients 13 03478 g001
Figure 2. (A) Manhattan plot analysis. The x-axis represents chromosomal positions and the y-axis represents −log10 p values. The red and blue horizontal lines indicate the genome-wide significance (p = 5.0 × 10⁻⁸) and suggestive significance (p = 5.0 × 10⁻⁵) levels, respectively. (B) Area plot of chromosome 12, showing the relative location of rs4445711.
Nutrients 13 03478 g002
Figure 3. A quantile–quantile plot for the genome-wide meta-analysis showing the p value distribution. The x-axis represents theoretical −log10 p values, and the y-axis represents observed −log10 p values. The red line indicates y = x.
Nutrients 13 03478 g003
Figure 4. The association between each rs4445711 allele and frequency of carrot intake: subgroup analysis stratified by sex. The y-axis represents body mass index according to the genotype of the lead variant at rs4445711—i.e., GG, AG, or AA—and the x-axis shows the 8 categories of carrot intake frequency, (A) male, and (B) female.
Nutrients 13 03478 g004
Figure 5. The association between each rs4445711 allele and frequency of carrot intake: subgroup analysis stratified by age. The y-axis represents body mass index according to the genotype of the lead variant at rs4445711—i.e., GG, AG, or AA—and the x-axis shows the 8 categories of carrot intake frequency, (A) younger (≤39 years), (B) middle aged (40–59 years), and (C) older adult (≥60 years).
Nutrients 13 03478 g005
Table 1. Characteristics of study participants and frequency of vegetable intake.
CharacteristicsMenWomen
Number of participants (n)64955730
Age (year)51 ± 1350 ± 13
Body mass index (kg/m2)23.9 ± 3.421.1 ± 3.8
Obesity (n, %)2097 (33)994 (17)
Carrot (n, %)
hardly eat321 (5)267 (5)
1 to 3 times per month1204 (19)790 (14)
1 to 2 times per week2216 (34)1569 (27)
3 to 4 times per week1257 (19)1172 (20)
5 to 6 times per week500 (8)602 (11)
once per day777 (12)858 (15)
twice per day183 (3)370 (6)
≥3 times per day37 (1)102 (2)
Broccoli (n, %)
hardly eat1140 (18)761 (13)
1 to 3 times per month2491 (38)2295 (40)
1 to 2 times per week1992 (31)1777 (31)
3 to 4 times per week556 (9)565 (10)
5 to 6 times per week153 (2)160 (3)
once per day147 (2)147 (3)
twice per day11 (0)18 (0)
≥3 times per day5 (0)7 (0)
Spinach (n, %)
hardly eat321 (5)267 (5)
1 to 3 times per month1204 (19)790 (14)
1 to 2 times per week2216 (34)1569 (27)
3 to 4 times per week1257 (19)1172 (20)
5 to 6 times per week500 (8)602 (11)
once per day777 (12)858 (35)
twice per day183 (3)370 (6)
≥3 times per day37 (1)102 (2)
Other green vegetables (green pepper and green bean) (n, %)
hardly eat629 (10)368 (6)
1 to 3 times per month2118 (33)1542 (27)
1 to 2 times per week2555 (39)2273 (40)
3 to 4 times per week807 (12)982 (17)
5 to 6 times per week192 (3)275 (5)
once per day164 (3)246 (4)
twice per day24 (0)34 (1)
≥3 times per day6 (0)10 (0)
Pumpkin (n, %)
hardly eat1405 (22)1020 (18)
1 to 3 times per month2809 (43)2587 (45)
1 to 2 times per week1703 (26)1454 (25)
3 to 4 times per week349 (5)388 (7)
5 to 6 times per week108 (2)124 (2)
once per day100 (2)129 (2)
twice per day18 (0)22 (0)
≥3 times per day3 (0)6 (0)
Cabbage (n, %)
hardly eat148 (2)118 (2)
1 to 3 times per month1037 (16)976 (17)
1 to 2 times per week2733 (42)2272 (40)
3 to 4 times per week1640 (25)1441 (25)
5 to 6 times per week446 (7)483 (8)
once per day419 (6)356 (6)
twice per day57 (1)68 (1)
≥3 times per day15 (0)16 (0)
Table 2. SNPs with suggestive levels of association (p < 1 × 10⁻⁵) with body mass index.
CHRSNPPositionEANEABETASEp
Carrot
12rs4445711104636601GA−0.16820.030734.53 × 10−5
17rs22315429928083TG−0.14450.03021.73 × 10−6
10rs491949195515515GA0.21130.04676.09 × 10−6
10rs2483855128933992AG0.17610.039247.27 × 10−6
Broccoli
4rs99377594731641GT−0.19440.040952.07 × 10−6
5rs1318588679108476CT0.2160.047926.63 × 10−6
Spinach
None
Other green vegetables (green pepper and green bean)
2rs11692441156950640GT0.23190.051837.73 × 10−6
2rs13429725147292648GA0.1860.041989.44 × 10−6
Pumpkin
3rs902192193111865AG−0.34040.074064.34 × 10−6
16rs993211754906895CA0.23470.051415.01 × 10−6
Cabbage
3rs12490455176910577TC−0.20170.044646.32 × 10−6
CHR—chromosome; SNPs—single nucleotide polymorphisms; EA—effect allele; NEA—non-effect allele; BETA—beta-interaction; SE—standard error; pp-value.
Publisher’s Note: MDPI stays neutral with regard to jurisdictional claims in published maps and institutional affiliations.

