
Relative Efficacy of Vitamin D2 and Vitamin D3 in Improving Vitamin D Status: Systematic Review and Meta-Analysis


Abstract
:1. Introduction
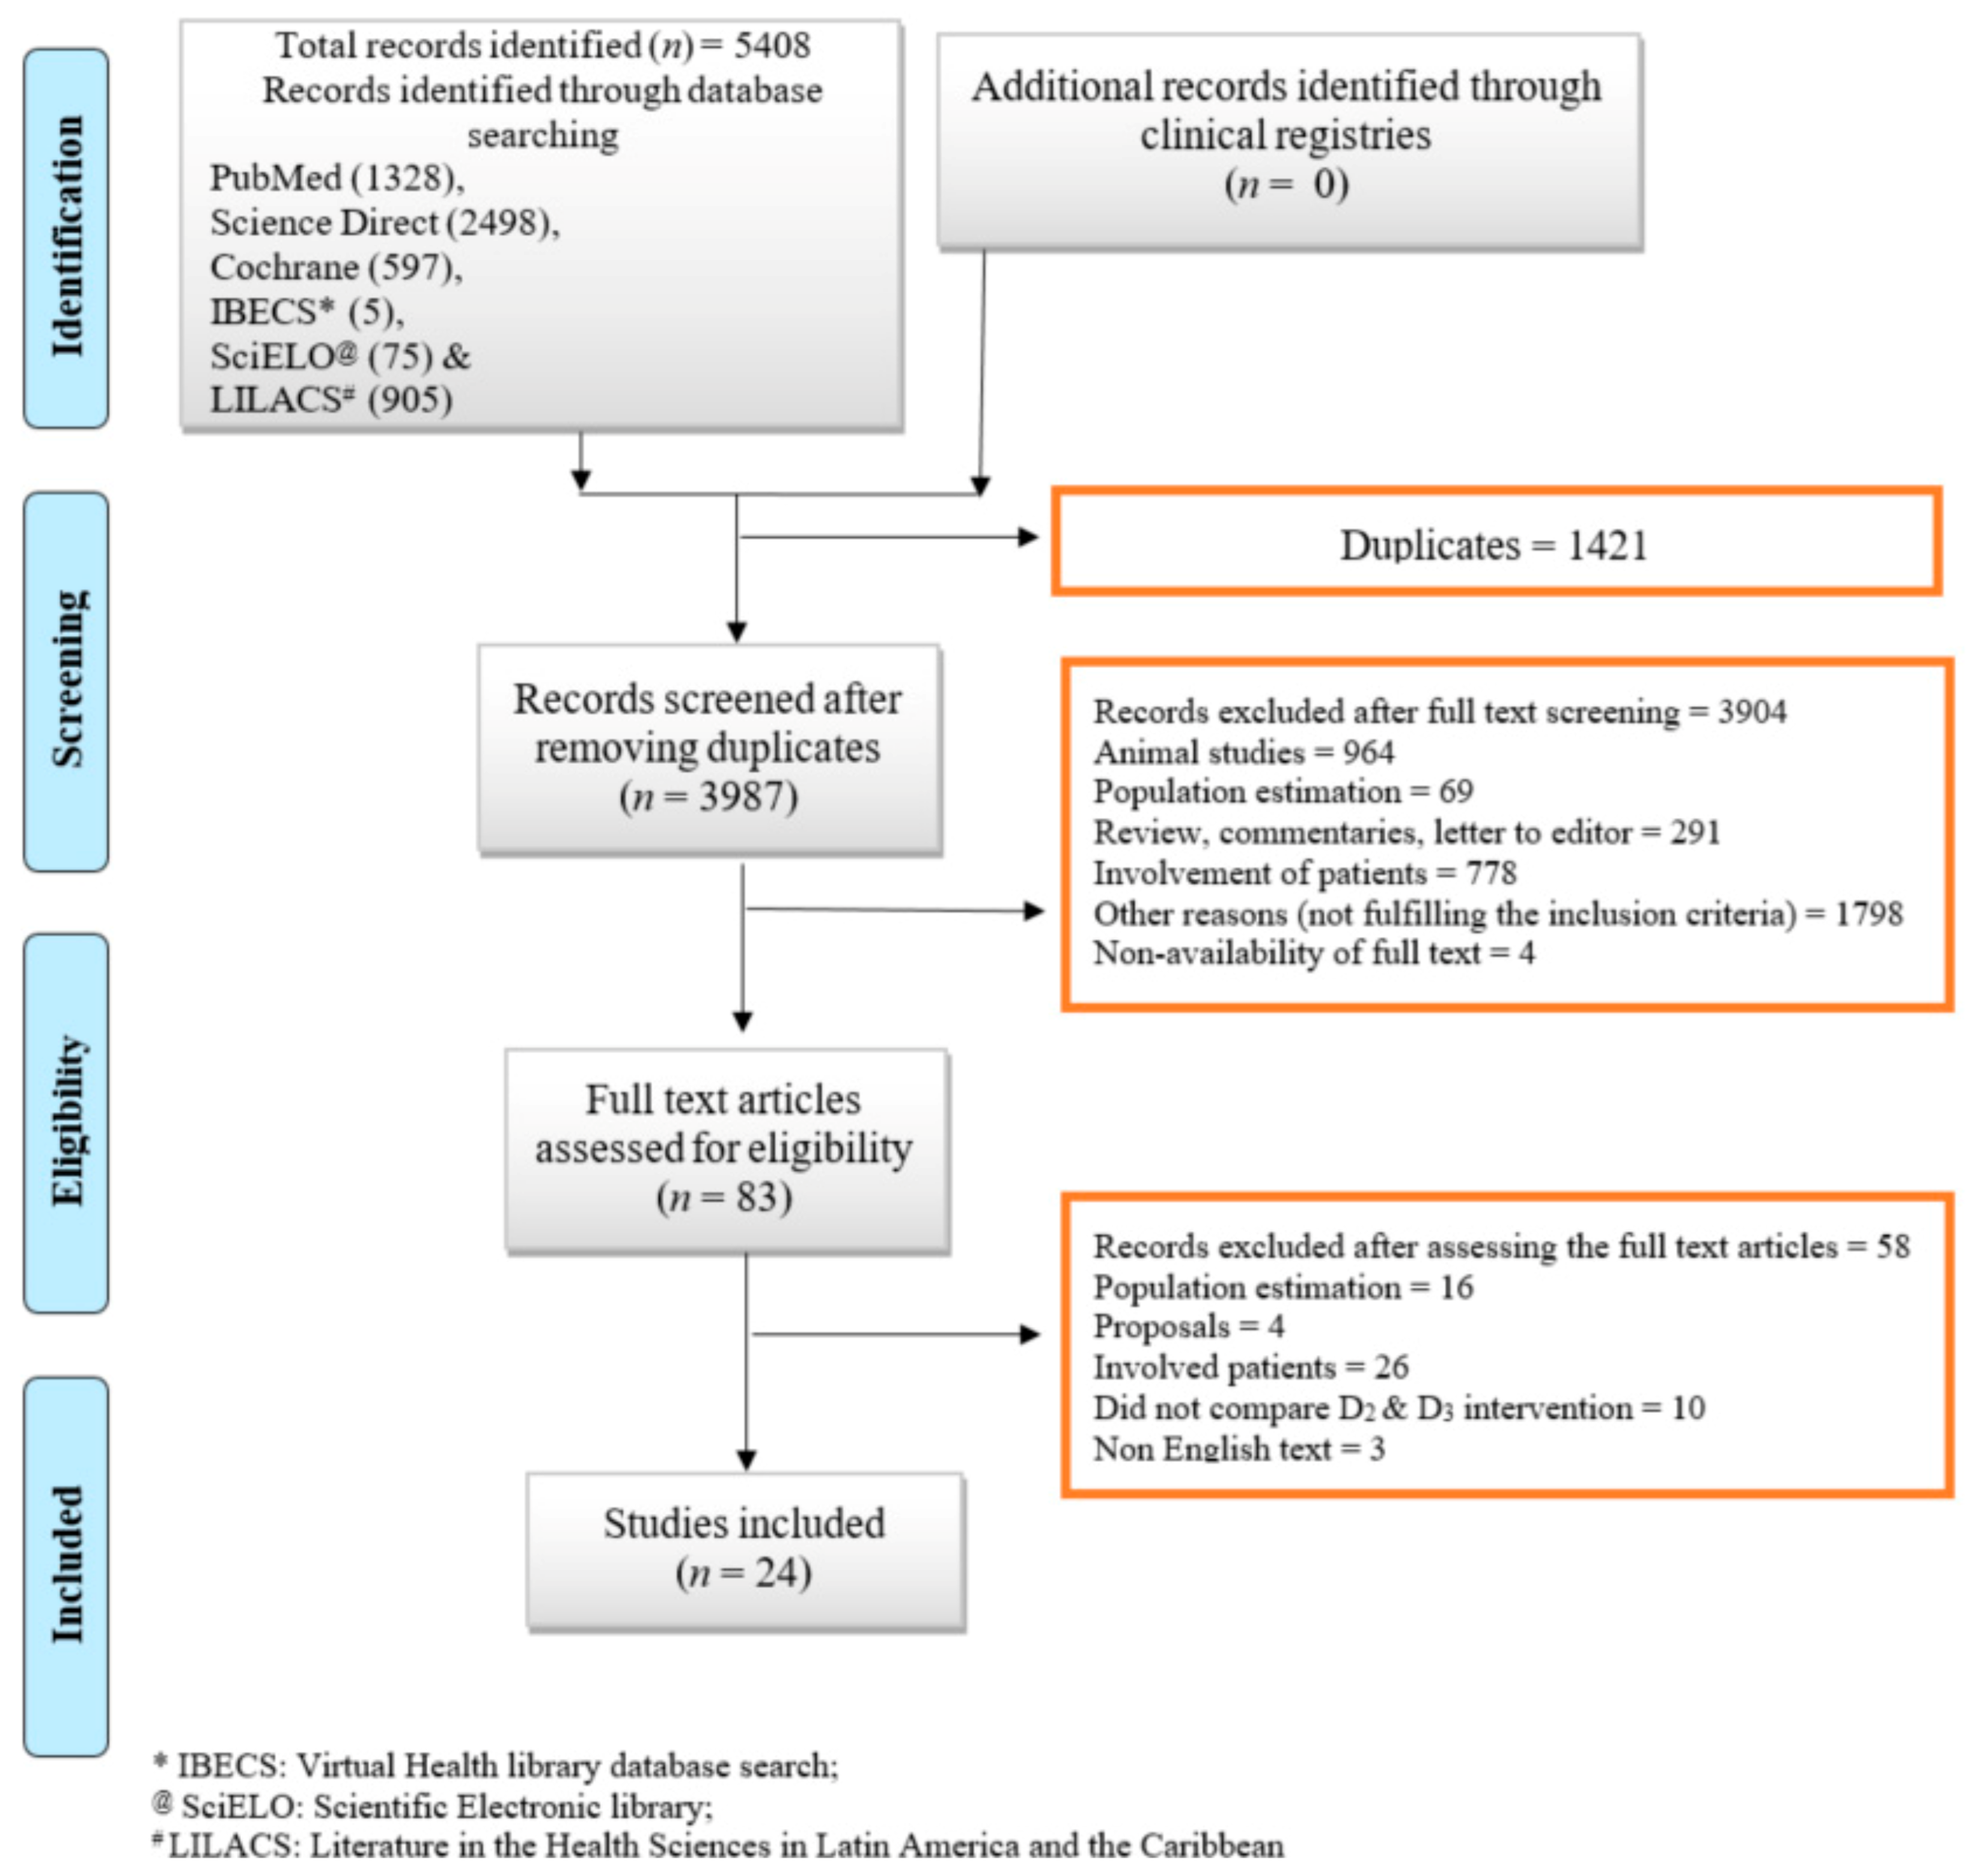
2. Methods
2.1. Criteria for Considering the Studies
2.2. Search Methods for Identification of Studies
2.3. Data Collection and Analysis
2.4. Data Extraction and Management
2.5. Assessment of Risk of Bias
2.6. Measures of Treatment Effect
2.7. Assessment of Heterogeneity
2.8. Subgroup Analysis and Sensitivity Analysis
2.9. Meta-Regression
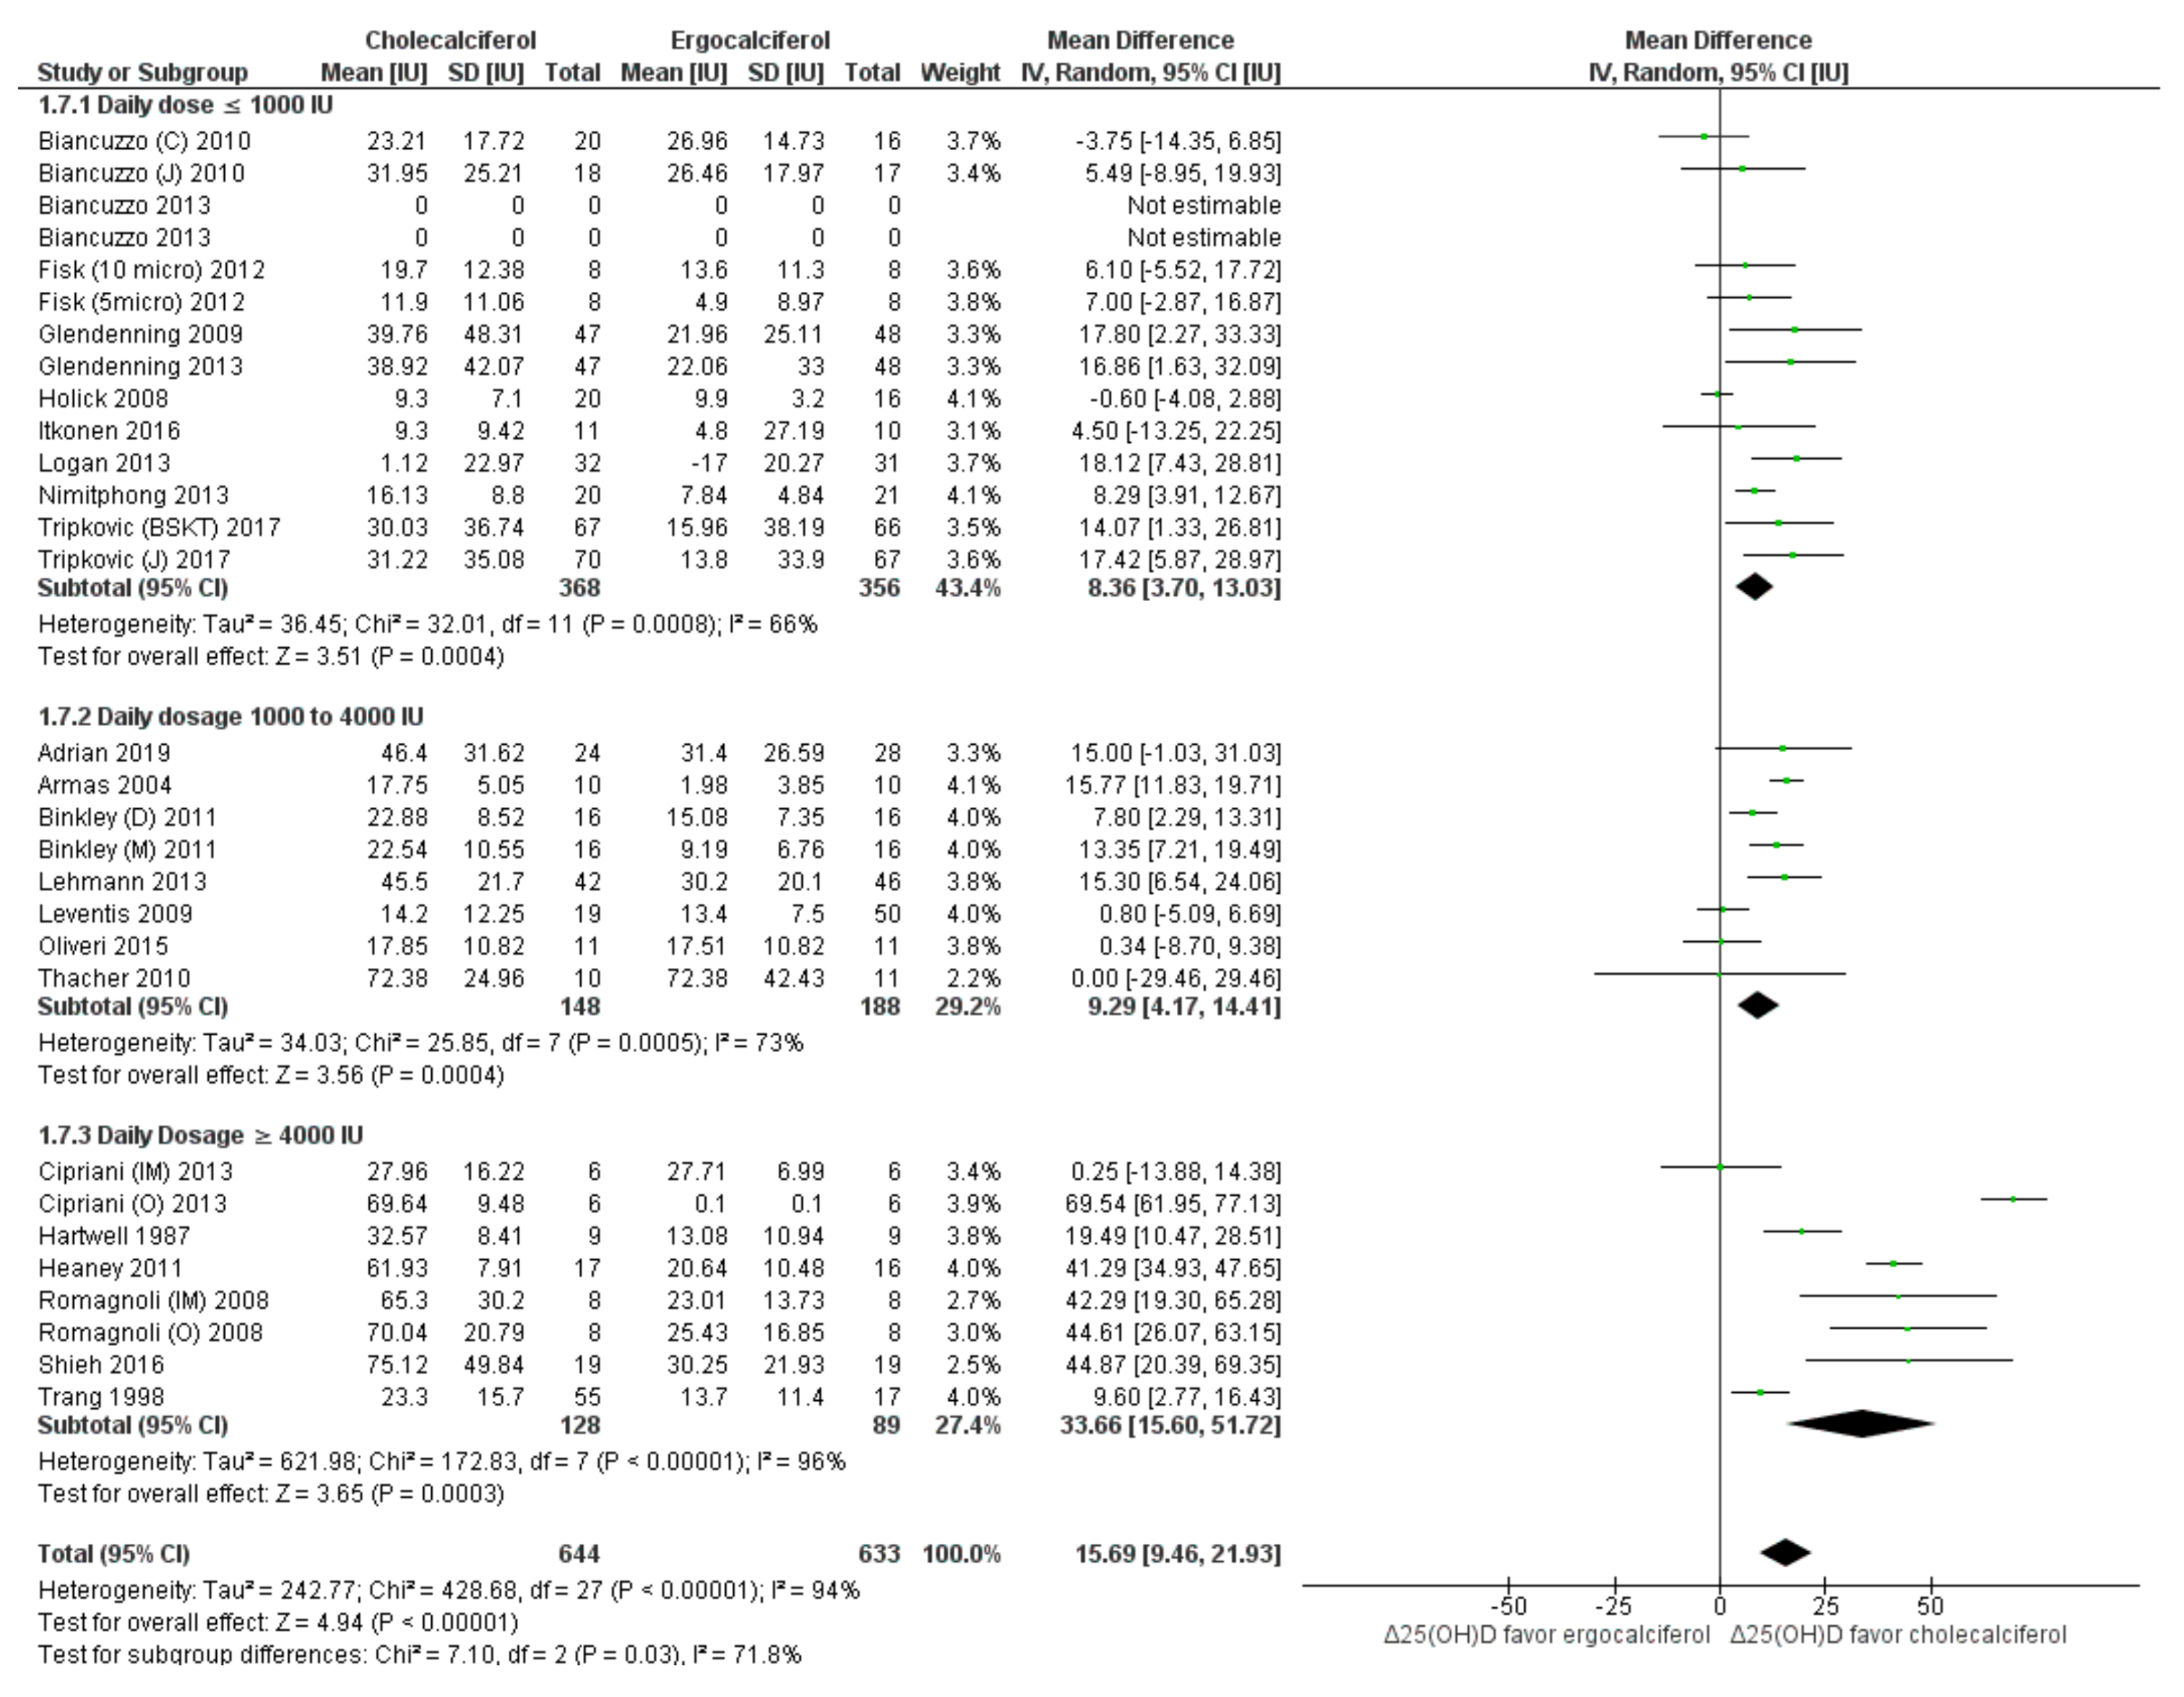
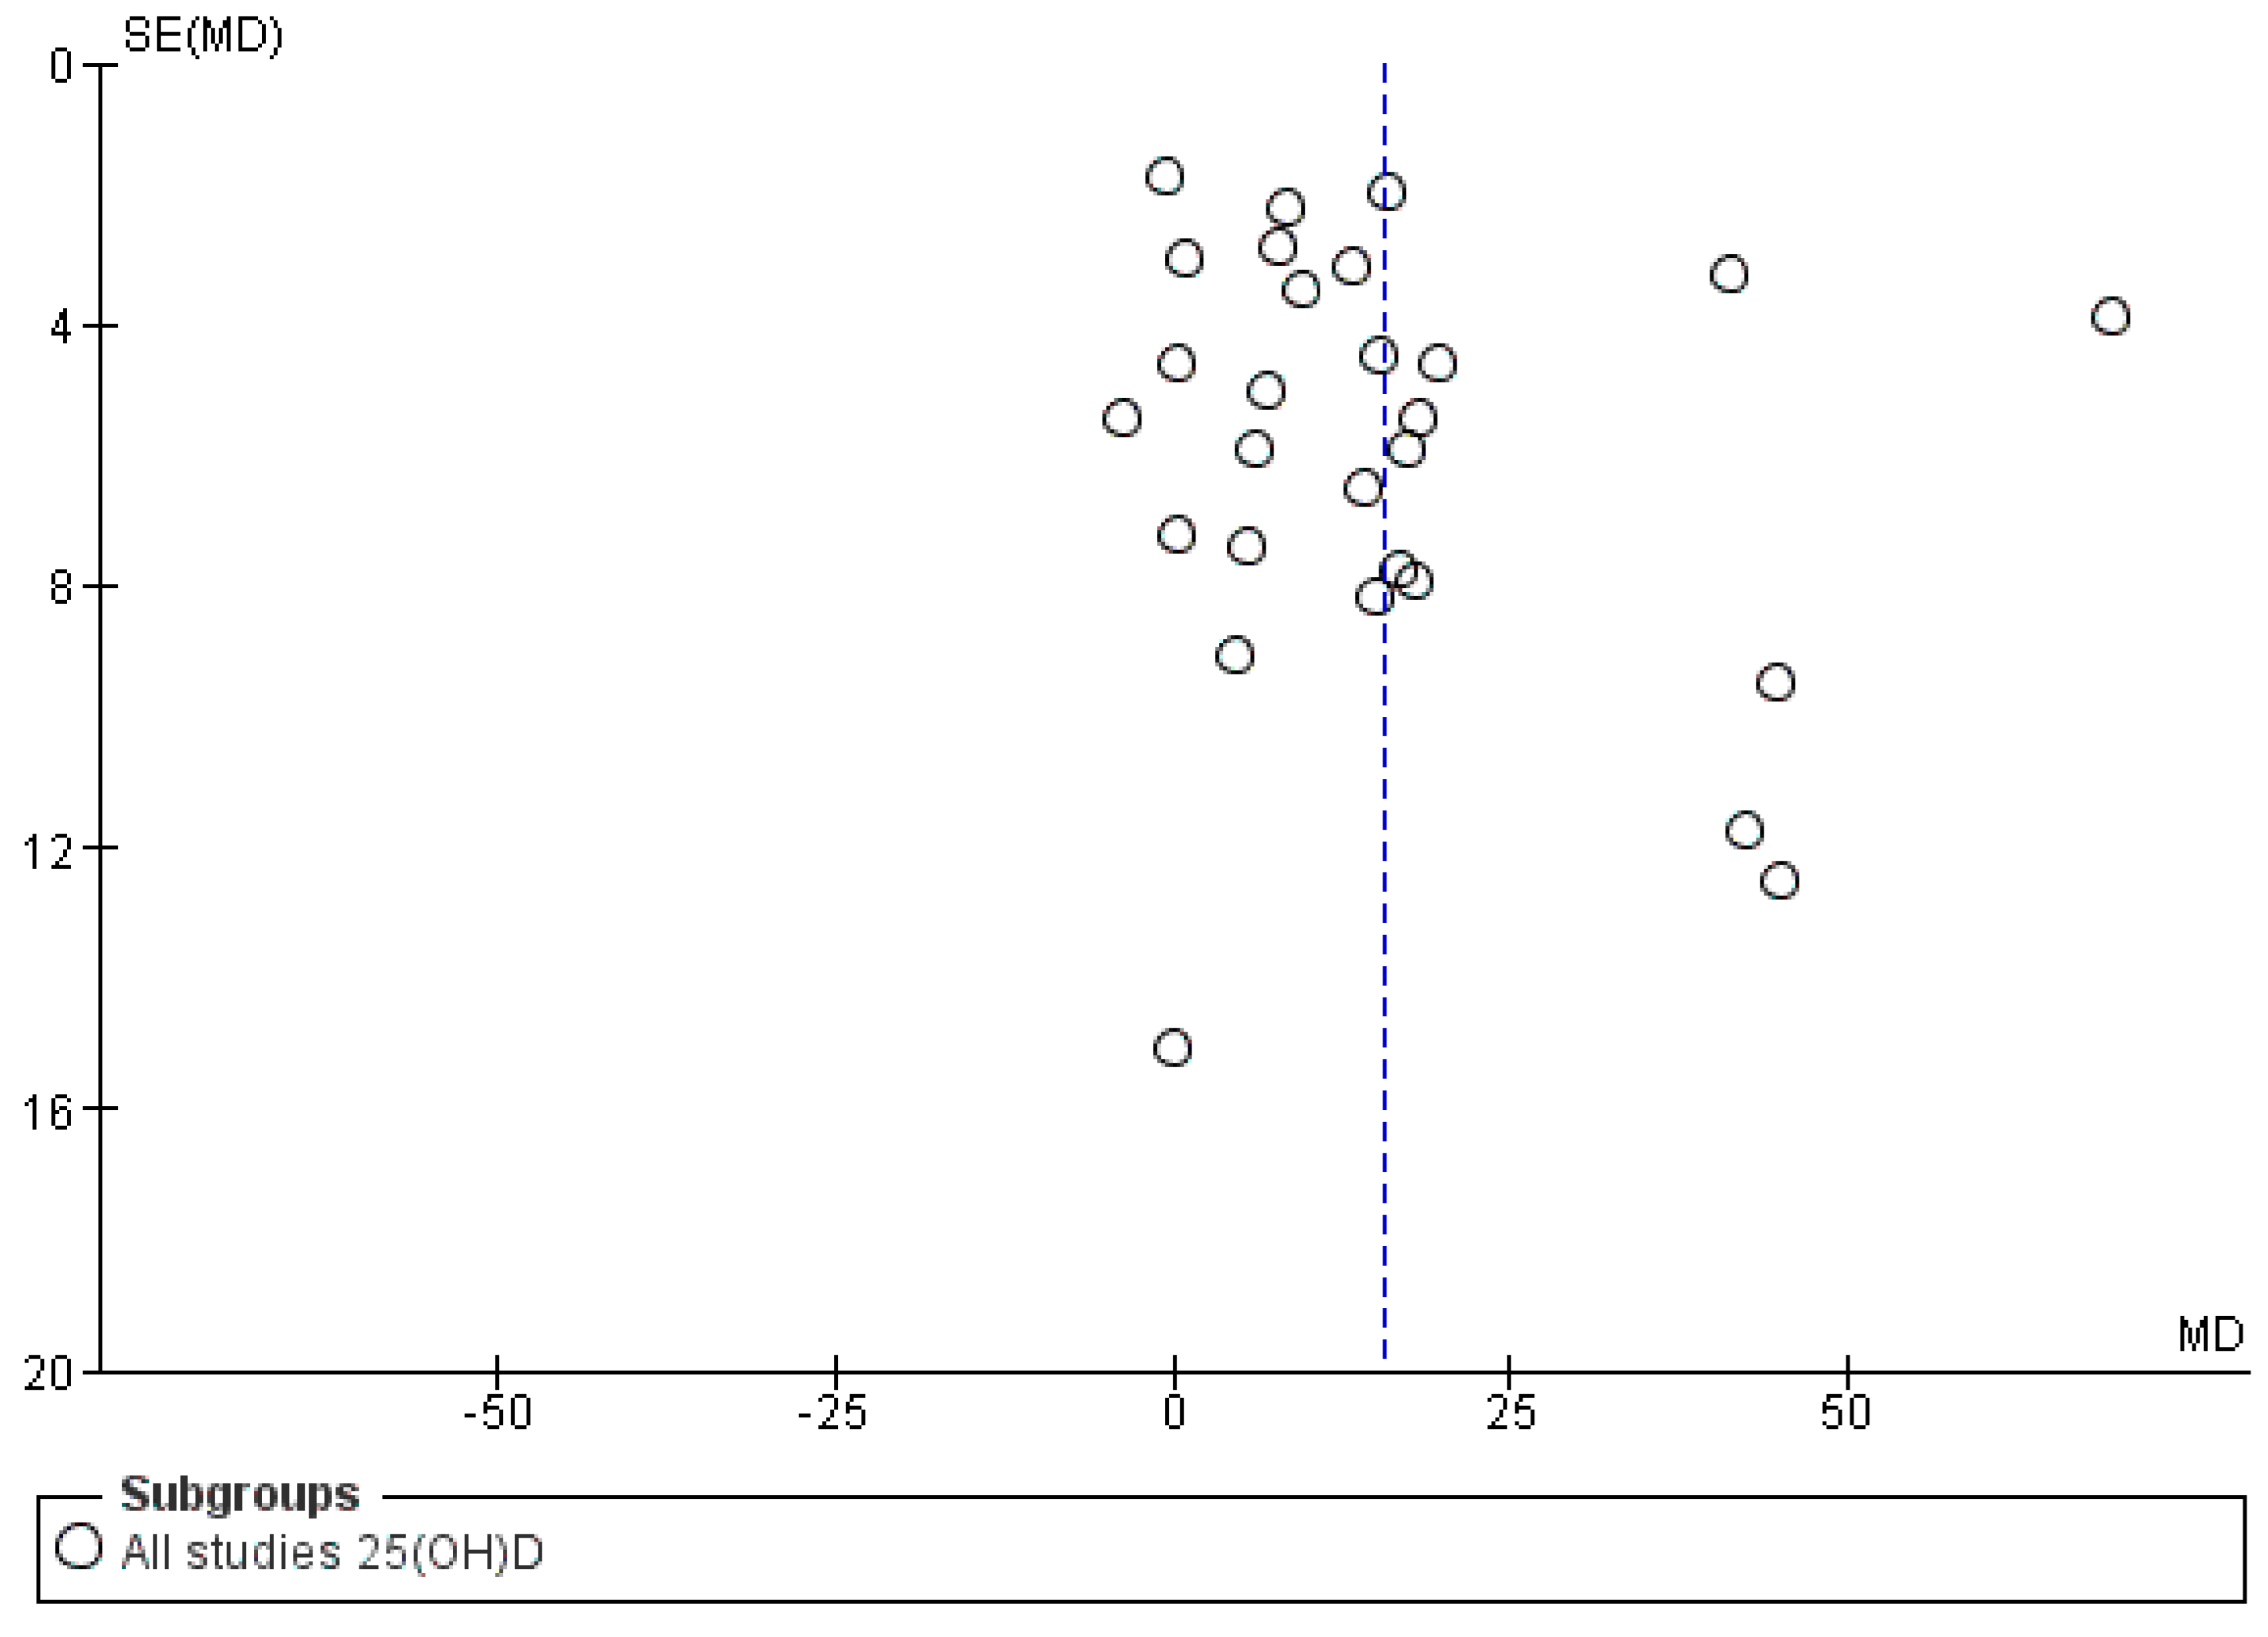
3. Results
4. Discussion
5. Conclusions
Supplementary Materials
Author Contributions
Funding
Acknowledgments
Conflicts of Interest
Abbreviations
| Vitamin D2 | Ergocalciferol |
| Vitamin D3 | Cholecalciferol |
| PTH | Paratharmone/parathyroid hormone |
| 25(OH)D | 25 hydroxy vitamin D |
| 25(OH)D2 | 25 hydroxy ergocalciferol |
| 25(OH)D3 | 25 hydroxy cholecalciferol |
| 1,25(OH)2D | 1,25 dihydroxy vitamin D |
| 1,25(OH)2D2 | 1,25 dihydroxy ergocalciferol |
| 1,25(OH)2D3 | 1,25 dihydroxy cholecalciferol |
| nmol/L | nano moles per liter |
| pmol/L | pico moles per liter |
| SD | standard deviation |
| CI | confidence interval |
| MD | Mean difference |
| Δ | Change |
| IU | International units |
| RIA | Radioimmunoassay |
| HPLC | High performance liquid chromatography |
| LCMS | Liquid chromatography mass spectrometry |
| RCT | Randomized controlled trial |
References
- Institute of Medicine (IoM). Dietary Reference Intakes for Calcium and Vitamin D; Ross, A.C., Taylor, C.L., Yaktine, A.L., Del Valle, H.B., Eds.; The National Academies Press: Washington, DC, USA, 2011. [Google Scholar]
- Bikle, D.D. Vitamin D metabolism, mechanism of action, and clinical applications. Chem. Biol. 2014, 21, 319–329. [Google Scholar] [CrossRef] [PubMed] [Green Version]
- DeLuca, H.F. The transformation of a vitamin into a hormone: The vitamin D story. Harvey Lect. 1979, 75, 333–379. [Google Scholar] [PubMed]
- Gupta, A. Vitamin D deficiency in India: Prevalence, causalities and interventions. Nutrients 2014, 6, 729–775. [Google Scholar]
- Gil, A.; Plaza-Diaz, J.; Mesa, M.D. Vitamin D: Classic and Novel Actions. Ann. Nutr. Metab. 2018, 72, 87–95. [Google Scholar] [CrossRef]
- Shaw, N.J.; Pal, B.R. Vitamin D deficiency in UK Asian families: Activating a new concern. Arch. Dis. Child. 2002, 86, 147–149. [Google Scholar] [CrossRef] [Green Version]
- Comprehensive National Nutrition Survey (CNNS): Comprehensive National Nutrition Survey (2016–2018) Reports. Ministry of Health and Family Welfare, Government of India. 2016–2018. Available online: https://nhmgovin/index1php?lang=1&level=2&sublinkid=1332&lid=713 (accessed on 24 June 2021).
- Jeon, S.M.; Shin, E.A. Exploring vitamin D metabolism and function in cancer. Exp. Mol. Med. 2018, 50, 20. [Google Scholar] [CrossRef] [Green Version]
- Rai, V.; Agrawal, D.K. Role of Vitamin D in Cardiovascular Diseases. Endocrinol. Metab. Clin. N. Am. 2017, 46, 1039–1059. [Google Scholar] [CrossRef]
- Umar, M.; Sastry, K.S.; Chouchane, A.I. Role of Vitamin D beyond the Skeletal Function: A Review of the Molecular and Clinical Studies. Int. J. Mol. Sci. 2018, 19, 1618. [Google Scholar] [CrossRef] [Green Version]
- Garg, M.K.; Marwaha, R.K.; Khadgawat, R.; Ramot, R.; Obroi, A.K.; Mehan, N.; Gupta, N.; Madan, R. Efficacy of vitamin D loading doses on serum 25-hydroxy vitamin D levels in school going adolescents: An open label non-randomized prospective trial. J. Pediatr. Endocrinol. Metab. 2013, 26, 515–523. [Google Scholar] [CrossRef]
- Khadgawat, R.; Marwaha, R.K.; Garg, M.K.; Ramot, R.; Oberoi, A.K.; Sreenivas, V.; Gahlot, M.; Mehan, N.; Mathur, P.; Gupta, N. Impact of vitamin D fortified milk supplementation on vitamin D status of healthy school children aged 10–14 years. Osteoporos. Int. 2013, 24, 2335–2343. [Google Scholar] [CrossRef]
- Food Safety & Standards Authority of India (FSSAL): Technical Handout on Fortification of Milk. Available online: https://ffrc.fssai.gov.in/commodity?commodity=fortified-milk (accessed on 24 June 2021).
- Shohl, A.T.; Bennett, H.B.; Weed, K.L. Rickets in Rats. V. Comparison of Effects of Irradiated Ergosterol and Cod Liver Oil. Proc. Soc. Exp. Biol. Med. 1928, 25, 551–554. [Google Scholar] [CrossRef]
- Tripkovic, L.; Lambert, H.; Hart, K.; Smith, C.P.; Bucca, G.; Penson, S.; Chope, G.; Hypponen, E.; Berry, J.; Vieth, R.; et al. Comparison of vitamin D2 and vitamin D3 supplementation in raising serum 25-hydroxyvitamin D status: A systematic review and meta-analysis. Am. J. Clin. Nutr. 2012, 95, 1357–1364. [Google Scholar] [CrossRef] [Green Version]
- Glendenning, P.; Chew, G.T.; Seymour, H.M.; Gillett, M.J.; Goldswain, P.R.; Inderjeeth, C.A.; Vasikaran, S.D.; Taranto, M.; Musk, A.A.; Fraser, W.D. Serum 25-hydroxyvitamin D levels in vitamin D-insufficient hip fracture patients after supplementation with ergocalciferol and cholecalciferol. Bone 2009, 45, 870–875. [Google Scholar] [CrossRef]
- Leventis, P.; Kiely, P.D.W. The tolerability and biochemical effects of high-dose bolus vitamin D2 and D3 supplementation in patients with vitamin D insufficiency. Scand. J. Rheumatol. 2009, 38, 149–153. [Google Scholar] [CrossRef]
- Romagnoli, E.; Mascia, M.L.; Cipriani, C.; Fassino, V.; Mazzei, F.; Erasmo, E.; Carnevale, V.; Scillitani, A.; Minisola, S. Short and long-term variations in serum calciotropic hormones after a single very large dose of ergocalciferol (vitamin D2) or cholecalciferol (vitamin D3) in the elderly. J. Clin. Endocrinol. Metab. 2008, 93, 3015–3020. [Google Scholar] [CrossRef]
- Trang, H.M.; Cole, D.E.; Rubin, L.A.; Pierratos, A.; Siu, S.; Vieth, R. Evidence that vitamin D3 increases serum 25-hydroxyvitamin D more efficiently than does vitamin D2. Am. J. Clin. Nutr. 1998, 68, 854–858. [Google Scholar] [CrossRef] [Green Version]
- Bharati, K.; Pullakhandam, R.; Balachandar, R.; Sachdev, H. Relative efficacy of vitamin D2 and vitamin D3 in improving vitamin D status: Proposal for systematic review and meta-analysis. In PROSPERO: International Register of Systematic Reviews; National Institute for Health Research: York, UK, 2018; Volume CRD42018108202. [Google Scholar]
- Higgins, J.P.T.T.J.; Chandler, J.; Cumpston, M.; Li, T.; Page, M.J. Cochrane Handbook for Systematic Reviews of Interventions, 2nd ed.; John Wiley & Sons: Chichester, UK, 2019. [Google Scholar]
- Armas, L.A.G.; Hollis, B.W.; Heaney, R.P. Vitamin D2 is much less effective than vitamin D3 in humans. J. Clin. Endocrinol. Metab. 2004, 89, 5387–5391. [Google Scholar] [CrossRef] [Green Version]
- Biancuzzo, R.M.; Clarke, N.; Reitz, R.E.; Travison, T.G.; Holick, M.F. Serum concentrations of 1,25-dihydroxyvitamin D2 and 1,25-dihydroxyvitamin D3 in response to vitamin D2 and vitamin D3 supplementation. J. Clin. Endocrinol. Metab. 2013, 98, 973–979. [Google Scholar] [CrossRef]
- Cipriani, C.; Romagnoli, E.; Pepe, J.; Russo, S.; Carlucci, L.; Piemonte, S.; Nieddu, L.; McMahon, D.J.; Singh, R.; Minisola, S. Long-term bioavailability after a single oral or intramuscular administration of 600,000 IU of ergocalciferol or cholecalciferol: Implications for treatment and prophylaxis. J. Clin. Endocrinol. Metab. 2013, 98, 2709–2715. [Google Scholar] [CrossRef] [Green Version]
- Fisk, C.M.; Theobald, H.E.; Sanders, T.A. Fortified malted milk drinks containing low-dose ergocalciferol and cholecalciferol do not differ in their capacity to raise serum 25-hydroxyvitamin D concentrations in healthy men and women not exposed to UV-B. J. Nutr. 2012, 142, 1286–1290. [Google Scholar] [CrossRef] [Green Version]
- Heaney, R.P.; Recker, R.R.; Grote, J.; Horst, R.L.; Armas, L.A. Vitamin D3 is more potent than vitamin D2 in humans. J. Clin. Endocrinol. Metab. 2011, 96, E447–E452. [Google Scholar] [CrossRef] [PubMed] [Green Version]
- Nimitphong, H.; Saetung, S.; Chanprasertyotin, S.; Chailurkit, L.O.; Ongphiphadhanakul, B. Changes in circulating 25-hydroxyvitamin D according to vitamin D binding protein genotypes after vitamin D3 or D2 supplementation. Nutr. J. 2013, 12, 39. [Google Scholar] [CrossRef] [PubMed] [Green Version]
- Thacher, T.D.; Obadofin, M.O.; Brien, K.O.; Abrams, S.A. The effect of vitamin D2 and vitamin D3 on intestinal calcium absorption in Nigerian children with rickets. J. Clin. Endocrinol. Metab. 2009, 94, 3314–3321. [Google Scholar] [CrossRef] [PubMed] [Green Version]
- Biancuzzo, R.M.; Young, A.; Bibuld, D.; Cai, M.H.; Winter, M.R.; Klein, E.K.; Ameri, A.; Reitz, R.; Salameh, W.; Chen, T.C.; et al. Fortification of orange juice with vitamin D2 or vitamin D3 is as effective as an oral supplement in maintaining vitamin D status in adults. Am. J. Clin. Nutr. 2010, 91, 1621–1626. [Google Scholar] [CrossRef] [Green Version]
- Binkley, N.; Gemar, D.; Engelke, J.; Gangnon, R.; Ramamurthy, R.; Krueger, D.; Drezner, M.K. Evaluation of ergocalciferol or cholecalciferol dosing, 1600 IU daily or 50,000 IU monthly in older adults. J. Clin. Endocrinol. Metab. 2011, 96, 981–988. [Google Scholar] [CrossRef] [Green Version]
- Glendenning, P.; Chew, G.T.; Inderjeeth, C.A.; Taranto, M.; Fraser, W.D. Calculated free and bioavailable vitamin D metabolite concentrations in vitamin D-deficient hip fracture patients after supplementation with cholecalciferol and ergocalciferol. Bone 2013, 56, 271–275. [Google Scholar] [CrossRef]
- Hartwell, D.; Hassager, C.; Christiansen, C. Effect of vitamin D2 and vitamin D3 on the serum concentrations of 1,25(OH)2D2, and 1,25(OH)2D3 in normal subjects. Acta Endocrinol. 1987, 115, 378–384. [Google Scholar] [CrossRef]
- Holick, M.F.; Biancuzzo, R.M.; Chen, T.C.; Klein, E.K.; Young, A.; Bibuld, D.; Reitz, R.; Salameh, W.; Ameri, A.; Tannenbaum, A.D. Vitamin D2 is as effective as vitamin D3 in maintaining circulating concentrations of 25-hydroxyvitamin D. J. Clin. Endocrinol. Metab. 2008, 93, 677–681. [Google Scholar] [CrossRef]
- Itkonen, S.T.; Skaffari, E.; Saaristo, P.; Saarnio, E.M.; Erkkola, M.; Jakobsen, J.; Cashman, K.D.; Lamberg-Allardt, C. Effects of vitamin D2-fortified bread v. supplementation with vitamin D2 or D3 on serum 25-hydroxyvitamin D metabolites: An 8-week randomised-controlled trial in young adult Finnish women. Br. J. Nutr. 2016, 115, 1232–1239. [Google Scholar] [CrossRef] [Green Version]
- Lehmann, U.; Hirche, F.; Stangl, G.I.; Hinz, K.; Westphal, S.; Dierkes, J. Bioavailability of vitamin D2 and D3 in healthy volunteers, a randomized placebo-controlled trial. J. Clin. Endocrinol. Metab. 2013, 98, 4339–4345. [Google Scholar] [CrossRef] [Green Version]
- Logan, V.F.; Gray, A.R.; Peddie, M.C.; Harper, M.J.; Houghton, L.A. Long-term vitamin D3 supplementation is more effective than vitamin D2 in maintaining serum 25-hydroxyvitamin D status over the winter months. Br. J. Nutr. 2013, 109, 1082–1088. [Google Scholar] [CrossRef] [Green Version]
- Oliveri, B.; Mastaglia, S.R.; Brito, G.M.; Seijo, M.; Keller, G.A.; Somoza, J.; Diez, R.A.; Di Girolamo, G. Vitamin D3 seems more appropriate than D2 to sustain adequate levels of 25OHD: A pharmacokinetic approach. Eur. J. Clin. Nutr. 2015, 69, 697–702. [Google Scholar] [CrossRef]
- Shieh, A.; Chun, R.F.; Ma, C.; Witzel, S.; Meyer, B.; Rafison, B.; Swinkels, L.; Huijs, T.; Pepkowitz, S.; Holmquist, B.; et al. Effects of High-Dose Vitamin D2 Versus D3 on Total and Free 25-Hydroxyvitamin D and Markers of Calcium Balance. J. Clin. Endocrinol. Metab. 2016, 101, 3070–3078. [Google Scholar] [CrossRef]
- Tripkovic, L.; Wilson, L.R.; Hart, K.; Johnsen, S.; de Lusignan, S.; Smith, C.P.; Bucca, G.; Penson, S.; Chope, G.; Elliott, R.; et al. Daily supplementation with 15 mug vitamin D2 compared with vitamin D3 to increase wintertime 25-hydroxyvitamin D status in healthy South Asian and white European women: A 12-wk randomized, placebo-controlled food-fortification trial. Am. J. Clin. Nutr. 2017, 106, 481–490. [Google Scholar] [CrossRef] [Green Version]
- Rohatgi, A. WebPlotDigitalizer: HTML5 Based Online Tool to Extract Numerical Data from Plot Images; Version 2.5; WebPlotDigitizer Pacifica: Oxnard, CA, USA, 2021. [Google Scholar]
- Review Manager (RevMan). Computer Program; Version 5.3; The Nordic Cochrane Centre, The Cochrane Collaboration: Copenhagen, Denmark, 2014. [Google Scholar]
- Richardson, M.; Garner, P.; Donegan, S. Interpretation of subgroup analyses in systematic reviews: A tutorial. Clin. Epidemiol. Glob. Health 2019, 7, 192–198. [Google Scholar] [CrossRef] [Green Version]
- Hammami, M.M.; Yusuf, A. Differential effects of vitamin D2 and D3 supplements on 25-hydroxyvitamin D level are dose, sex, and time dependent: A randomized controlled trial. BMC Endocr. Disord. 2017, 17, 12. [Google Scholar] [CrossRef] [Green Version]
- Thacher, T.D.; Fischer, P.R.; Obadofin, M.O.; Levine, M.A.; Singh, R.J.; Pettifor, J.M. Comparison of metabolism of vitamins D2 and D3 in children with nutritional rickets. J. Bone Miner. Res. 2010, 25, 1988–1995. [Google Scholar] [CrossRef] [Green Version]
- Martineau, A.R.; Thummel, K.E.; Wang, Z.; Jolliffe, D.A.; Boucher, B.J.; Griffin, S.J.; Forouhi, N.G.; Hitman, G.A. Differential Effects of Oral Boluses of Vitamin D2 vs. Vitamin D3 on Vitamin D Metabolism: A Randomized Controlled Trial. J. Clin. Endocrinol. Metab. 2019, 104, 5831–5839. [Google Scholar] [CrossRef]
- Chowdhury, R.; Kunutsor, S.; Vitezova, A.; Oliver-Williams, C.; Chowdhury, S.; Kiefte-de-Jong, J.C.; Khan, H.; Baena, C.P.; Prabhakaran, D.; Hoshen, M.B.; et al. Vitamin D and risk of cause specific death: Systematic review and meta-analysis of observational cohort and randomised intervention studies. BMJ 2014, 348, g1903. [Google Scholar] [CrossRef] [Green Version]
- Jones, K.S.; Assar, S.; Harnpanich, D.; Bouillon, R.; Lambrechts, D.; Prentice, A.; Schoenmakers, I. 25(OH)D2 half-life is shorter than 25(OH)D3 half-life and is influenced by DBP concentration and genotype. J. Clin. Endocrinol. Metab. 2014, 99, 3373–3381. [Google Scholar] [CrossRef] [Green Version]
- Houghton, L.A.; Vieth, R. The case against ergocalciferol (vitamin D2) as a vitamin supplement. Am. J. Clin. Nutr. 2006, 84, 694–697. [Google Scholar] [CrossRef] [Green Version]
- Morris, H.A.; Anderson, P.H. Autocrine and paracrine actions of vitamin D. Clin. Biochem. Rev. 2010, 31, 129–138. [Google Scholar]


| Study | Country | Participants | Duration of Follow up | Dosage and Duration of D2 and D3 Supplementation | Vitamin D Consumed in a Month before Outcome Assessment | Outcomes Assessed | Results |
|---|---|---|---|---|---|---|---|
| Adrian. 2019 [45] | United Kingdom (UK) | Apparently healthy adults with risk for diabetes between 30 and 75 years
| 4 months | 100,000 IU/month for 4 months, oral | 400,000 IU | Total 25(OH)D, 25(OH)D2, 25(OH)D3, 1,25(OH)2D2, 1,25(OH)2D3 | Ergocalciferol is less effective than cholecalciferol in elevating total 25(OH)D, and ergocalciferol reduces hydroxylation of vitamin D3 and 25(OH)D3. |
| Armas, 2004 [22] | United states of America (USA) | Apparently healthy men, age: range 20 to 61 years
| 4 weeks | 50,000 IU, single dose | 50,000 IU | Total 25(OH)D | Cholecalciferol was found to be more potent with longer duration of action as compared to ergocalciferol. |
| Biancuzzo, 2013 [23] | United states of America (USA) | Apparently healthy adults, age: range 18 to 79 years
| 11 weeks | 1000 IU/day for 11 weeks | 30,000 IU | 25(OH)D2 and 25(OH)D3 | Ergocalciferol and cholecalciferol induced similar increases in total 25(OH)D as well as in 25(OH)D2 and 25(OH)D3, respectively. |
| Biancuzzo, 2010 [29] | United states of America (USA) | Apparently healthy adults, age 40.1 ± 15.6 years
| 11 weeks | 1000 IU/day for 11 weeks | 30,000 IU | Total 25(OH)D and PTH | Ergocalciferol and cholecalciferol were equally bioavailable in orange juice and capsules. D2 and cholecalciferol induced similar increases in total 25(OH)D as well as in 25(OH)D2 and 25(OH)D3, respectively. |
| Binkley, 2011 [30] | United states of America (USA) | Healthy older adults
| 1 year | 1600 IU daily or 50,000 IU monthly for 1 year | 48,000 IU or 50000 IU | Total 25(OH)D | Daily as well as monthly doses of cholecalciferol were marginally better than respective ergocalciferol doses in raising 25(OH)D. |
| Cipriani, 2013 [24] | Italy | Healthy adults, age 63.9 ± 7.1 years (18 females and 6 males)
| 120 days | 600,000 IU single dose (IM or oral) | Bolus dose received before 120 days, hence unavailable | Total 25(OH)D | Cholecalciferol was more effective than ergocalciferol in raising 25(OH)D and sustaining 1,25(OH)2D. Oral dosages produced immediate rise in active metabolites, while IM route provided slow but sustained increase in the metabolites. |
| Fisk, 2012 [25] | United Kingdom (UK) | Healthy adults
| 4 weeks | 200 IU/day or 400 IU/day through malted milk drink | 56,000 IU or 11,200 IU | Total 25(OH)D, 25(OH)2, 25(OH)D3 and PTH | Both cholecalciferol and ergocalciferol resulted in dose-dependent increases in their respective 25(OH)D metabolites to a similar extent. |
| Glendenning, 2013 [31] | Australia | Adults with hip fracture and vitamin D insufficiency
| 3 months | 1000 IU/day for 3 months | 30,000 IU | Total 25(OH)D and Total 1,25(OH)2D | Compared to ergocalciferol, increment in total 25(OH)D was significantly higher with cholecalciferol, but there was no difference in total serum 1,25(OH)2D. |
| Glendenning, 2009 [16] | Australia | Adults with hip fracture and vitamin D insufficiency
| 3 months | 1000 IU/day for 3 months | 30,000 IU | Total 25(OH)D, 25(OH)D2, 25(OH)D3 and PTH | Compared to ergocalciferol, increment in total 25(OH)D was significantly higher with cholecalciferol, but there was no difference in the degree of PTH lowering between the treatments. Ergocalciferol and cholecalciferol supplementation. |
| Hammami, 2017 [43] | Saudi Arabia | Healthy adults
| 140 days | Daily 2000 IU/day or 25,000 IU fortnightly or 50,000 IU 4 weekly over 140 days | 60,000 IU, 50,000 IU, 50,000 IU respectively | Total 25(OH)D, 25(OH)D2 and 25(OH)D3 | Ergocalciferol had marginally higher efficacy than cholecalciferol in raising total 25(OH)D during the initial 14 days of daily supplementation. However, the latter was more efficacious with subsequent daily supplementation. Cholecalciferol was more efficacious in fortnightly and monthly supplementation. |
| Hartwell, 1987 [32] | Denmark | Premenopausal women, age 22 to 49 years
| 8 weeks | 4000 IU/day for 8 weeks | 120,000 IU | Total 25(OH)D, 25(OH)D2and 25(OH)D3 | Ergocalciferol intervention suppressed serum 1,25(OH)2D3 concentration while increasing 1,25(OH)2D2. The cholecalciferol intervention did not result in changes in 1,25(OH)2D metabolites. |
| Heaney, 2011 [26] | United states of America (USA) | Healthy adults
| 12 weeks | 50,000 IU/week for 12 weeks | 200,000 IU | Total 25(OH)D | Compared to ergocalciferol, cholecalciferol was found to be more potent in raising and maintaining total 25(OH)D levels. |
| Holick, 2008 [33] | United states of America (USA) | Healthy adults
| 11 weeks | 1000 IU/day for 11 weeks | 30,000 IU | Total 25(OH)D, 25(OH)D2and 25(OH)D3 | Daily doses of both forms were equipotent in raising total 25(OH)D levels from their baseline value. |
| Itkonen, 2016 [34] | Finland | Healthy women
| 8 weeks | 1000 IU/day for 8 weeks | 30,000 IU | Total 25(OH)D, 25(OH)D2 and 25(OH)D3 | Ergocalciferol was less potent than cholecalciferol in increasing the total 25(OH)D levels. Both ergocalciferol and cholecalciferol supplementation led to larger increases in their respective 25(OH)D metabolites than the other vitamer. |
| Lehmann, 2013 [35] | Germany | Healthy adults
| 8 weeks | 2000 IU/day | 60,000 IU | Total 25(OH)D, 25(OH)D2 and 25(OH)D3 | Ergocalciferol was less potent than cholecalciferol in raising total 25(OH)D. Ergocalciferol supplementation was associated with a decrease in serum 25(OH)D3. |
| Leventis 2009 [17] | United Kingdom (UK) | Healthy adults
| 24 weeks | D2: Single bolus 300,000 IU IM D3: 300,000 IU oral | Bolus dose received before 24 weeks, hence unavailable | Total 25(OH)D and PTH | Cholecalciferol had greater potency than ergocalciferol, with a higher, sustained serum 25(OH)D response and efficacious PTH suppression. |
| Logan, 2013 [36] | New Zealand | Healthy adults, age 18–50 years
| 25 weeks | 1000 IU/day for 25 weeks | 30,000 IU | Total 25(OH)D and PTH | Cholecalciferol was more effective than ergocalciferol in raising total 25(OH)D levels, but no intervention-related changes in PTH were observed. |
| Nimitphong, 2013 [27] | Thailand | Healthy adults
| 3 months | 400 IU/day for 3 months | 12,000 IU | Total 25(OH)D, 25(OH)D2 25(OH)D3 and PTH | Cholecalciferol-related increment in total 25(OH)D levels was higher than that with ergocalciferol. Genetic variations in DBP (rs4588 SNP) influenced 25(OH)D levels with cholecalciferol but not ergocalciferol. |
| Oliveri, 2015 [36] | Argentina | Healthy adults
| 77 days (values at the end of 21 days were considered, as values post 77 days were unavailable) | 100,000 IU stat (day 0) + 4800 IU/day (7th–20th day) | 196,000 IU | Total 25(OH)D | Cholecalciferol and ergocalciferol raised total 25(OH)D levels equally after the loading dose; however, the effect of the former was more sustained. |
| Romagnoli, 2008 [18] | Italy | Elderly women from nursing care facilities
| 60 days | 300,000 IU single dose | Single bolus dose received before 60 days, hence unavailable | Total 25(OH)D and PTH | Cholecalciferol was more potent than ergocalciferol in raising total 25(OH)D levels. |
| Shieh, 2016 [38] | United states of America (USA) | Healthy adults
| 5 weeks | 50,000 IU twice a week for 5 weeks | 400,000 IU | Total 25(OH)D and 1,25(OH)2D | Cholecalciferol-related increase in total 25(OH)D was higher compared to ergocalciferol. |
| Thacher, 2010 [44] | Nigeria | Healthy pre-pubertal children
| 14 days | 50,000 IU stat | 50,000 IU | Total 25(OH)D and 1,25(OH)2D | Cholecalciferol and ergocalciferol resulted in equal improvement in total 25(OH)D and 1,25(OH)2D levels in apparently healthy children. |
| Trang, 1998 [19] | Canada | Healthy adults
| 14 days | 4000 IU/day | 56,000 IU | Total 25(OH)D and 1,25(OH)2D | Cholecalciferol was more potent than ergocalciferol in raising total 25(OH)D levels. |
| Tripkovic, 2017 [39] | United Kingdom (UK) | Healthy adults
| 12 weeks | 600 IU/day (Biscuits or juice) | 18,000 IU | Total 25(OH)D and 1,25(OH)2D | Cholecalciferol was more potent than ergocalciferol in raising total 25(OH)D levels. |
| Study | Random Sequence Generation | Allocation Concealment | Blinding of Participants and Personnel | Blinding of Outcome Assessment | Incomplete Outcome Data | Selective Reporting | Other Sources of Bias |
|---|---|---|---|---|---|---|---|
| Adrian, 2019 [45] | Low risk of bias | Unclear risk of bias | Low risk of bias | Unclear risk of bias | Low risk of bias | Unclear risk of bias | None |
| Armas, 2004 [22] | Low risk of bias | Unclear risk of bias | Low risk of bias | Unclear risk of bias | Low risk of bias | Unclear risk of bias | None |
| Biancuzzo, 2013 [23] | Low risk of bias | Unclear risk of bias | Low risk of bias | Unclear risk of bias | Low risk of bias | Unclear risk of bias | None |
| Biancuzzo, 2010 [29] | Low risk of bias | Unclear risk of bias | Low risk of bias | Unclear risk of bias | Low risk of bias | Low risk of bias | None |
| Binkley, 2011 [30] | Low risk of bias | Unclear risk of bias | Low risk of bias | Unclear risk of bias | Low risk of bias | Low risk of bias | None |
| Cipriani, 2013 [24] | Low risk of bias | Unclear risk of bias | Unclear risk of bias | Low risk of bias | Low risk of bias | Unclear risk of bias | None |
| Fisk, 2012 [25] | Low risk of bias | Low risk of bias | Low risk of bias | Low risk of bias | Low risk of bias | Low risk of bias | None |
| Glendenning, 2013 [31] | Low risk of bias | Low risk of bias | Low risk of bias | Unclear risk of bias | Low risk of bias | Unclear risk of bias | None |
| Glendenning, 2009 [16] | Low risk of bias | Low risk of bias | Low risk of bias | Unclear risk of bias | Low risk of bias | Unclear risk of bias | None |
| Hammami, 2017 [43] | Low risk of bias | Unclear risk of bias | Unclear risk of bias | Low risk of bias | Low risk of bias | Low risk of bias | None |
| Hartwell, 1987 [32] | Low risk of bias | Low risk of bias | Unclear risk of bias | Unclear risk of bias | Low risk of bias | Unclear risk of bias | None |
| Heaney, 2011 [26] | Low risk of bias | Unclear risk of bias | Unclear risk of bias | Unclear risk of bias | Low risk of bias | Low risk of bias | None |
| Holick, 2008 [33] | Low risk of bias | Unclear risk of bias | Low risk of bias | Unclear risk of bias | Low risk of bias | Unclear risk of bias | None |
| Itkonen, 2016 [34] | Low risk of bias | Low risk of bias | Low risk of bias | Unclear risk of bias | Low risk of bias | Unclear risk of bias | None |
| Lehmann, 2013 [35] | Low risk of bias | Unclear risk of bias | Low risk of bias | Low risk of bias | Low risk of bias | Low risk of bias | None |
| Leventis 2009 [17] | Unclear risk of bias | Unclear risk of bias | Unclear risk of bias | Unclear risk of bias | Low risk of bias | Low risk of bias | None |
| Logan, 2013 [36] | Low risk of bias | Unclear risk of bias | Low risk of bias | Unclear risk of bias | Low risk of bias | Low risk of bias | None |
| Nimitphong, 2013 [27] | Low risk of bias | Low risk of bias | Unclear risk of bias | Unclear risk of bias | Low risk of bias | Unclear risk of bias | None |
| Oliveri, 2015 [37] | Low risk of bias | Low risk of bias | Unclear risk of bias | Low risk of bias | Low risk of bias | Unclear risk of bias | None |
| Romagnoli, 2008 [18] | Low risk of bias | Unclear risk of bias | Unclear risk of bias | Unclear risk of bias | Low risk of bias | Unclear risk of bias | None |
| Shieh, 2016 [38] | Low risk of bias | Unclear risk of bias | Unclear risk of bias | Unclear risk of bias | Low risk of bias | Low risk of bias | None |
| Thacher, 2010 [44] | Low risk of bias | Low risk of bias | Low risk of bias | Unclear risk of bias | Low risk of bias | Unclear risk of bias | None |
| Trang, 1998 [19] | Low risk of bias | Unclear risk of bias | Low risk of bias | Unclear risk of bias | Low risk of bias | Low risk of bias | None |
| Tripkovic, 2017 [39] | Low risk of bias | Low risk of bias | Low risk of bias | Low risk of bias | Low risk of bias | Low risk of bias | None |
| Explanatory Variable | Slope (β Coefficient) | 95% CI of the Slope | p Value for Individual Predictors | p Value for Model | Proportion of Variation Explained by Model |
|---|---|---|---|---|---|
| Serum total 25(OH)D nmol/L (N = 22 studies) | |||||
| Total dose (per 100 IU) | −0.0002 | −0.0043, 0.0038 | 0.9047 | 0.010 | 37.34% |
| Average dose/day (per 100 IU) | 0.5122 | 0.1517, 0.8727 | 0.0054 | ||
| Dose-test interval (days) | −0.0113 | −0.1571, 0.1344 | 0.8788 | ||
| Participant’s age (years) | 0.2695 | −0.0874, 0.6264 | 0.1389 | ||
| Serum PTH pmol/L (N = 10 studies) | |||||
| Total dose (per 100 IU) | 0.0002 | −0.0007, −0.0012 | 0.6027 | 0.0797 | 79.57% |
| Average dose/day (per 100 IU) | −0.0296 | −0.0986, 0.0188 | 0.1826 | ||
| Dose-test interval (days) | −0.0072 | −0.0242, 0.0098 | 0.4076 | ||
| Participant’s age (years) | 0.0068 | −0.0007, 0.0012 | 0.6027 | ||
| Serum total 25(OH)D3 nmol/L (N = 10 studies) | |||||
| Total dose (per 100 IU) | −0.0117 | −0.1188, 0.0954 | 0.8305 | 0.0047 | 52.88% |
| Average dose/day (per 100 IU) | 2.2053 | −3.5824, 7.993 | 0.4552 | ||
| Dose-test interval (days) | 1.1842 | −12.7882, 15.1566 | 0.8681 | ||
| Participant’s age (years) | 0.0778 | −0.9051, 1.0607 | 0.8767 | ||
| Serum total 25(OH)D2 nmol/L (N = 10 studies) | |||||
| Total dose (per 100 IU) | −0.0022 | −0.0688, 0.0645 | 0.9494 | 0.0003 | 62.71% |
| Average dose/day (per 100 IU) | −0.9128 | −4.5182, 2.6926 | 0.6197 | ||
| Dose-test interval (days) | 0.0209 | −8.6496, 8.6914 | 0.9962 | ||
| Participant’s age (years) | 0.2058 | −0.4418, 0.8535 | 0.5333 | ||
Publisher’s Note: MDPI stays neutral with regard to jurisdictional claims in published maps and institutional affiliations. |
© 2021 by the authors. Licensee MDPI, Basel, Switzerland. This article is an open access article distributed under the terms and conditions of the Creative Commons Attribution (CC BY) license (https://creativecommons.org/licenses/by/4.0/).
Share and Cite
Balachandar, R.; Pullakhandam, R.; Kulkarni, B.; Sachdev, H.S. Relative Efficacy of Vitamin D2 and Vitamin D3 in Improving Vitamin D Status: Systematic Review and Meta-Analysis. Nutrients 2021, 13, 3328. https://doi.org/10.3390/nu13103328
Balachandar R, Pullakhandam R, Kulkarni B, Sachdev HS. Relative Efficacy of Vitamin D2 and Vitamin D3 in Improving Vitamin D Status: Systematic Review and Meta-Analysis. Nutrients. 2021; 13(10):3328. https://doi.org/10.3390/nu13103328
Chicago/Turabian StyleBalachandar, Rakesh, Raghu Pullakhandam, Bharati Kulkarni, and Harshpal Singh Sachdev. 2021. "Relative Efficacy of Vitamin D2 and Vitamin D3 in Improving Vitamin D Status: Systematic Review and Meta-Analysis" Nutrients 13, no. 10: 3328. https://doi.org/10.3390/nu13103328
APA StyleBalachandar, R., Pullakhandam, R., Kulkarni, B., & Sachdev, H. S. (2021). Relative Efficacy of Vitamin D2 and Vitamin D3 in Improving Vitamin D Status: Systematic Review and Meta-Analysis. Nutrients, 13(10), 3328. https://doi.org/10.3390/nu13103328