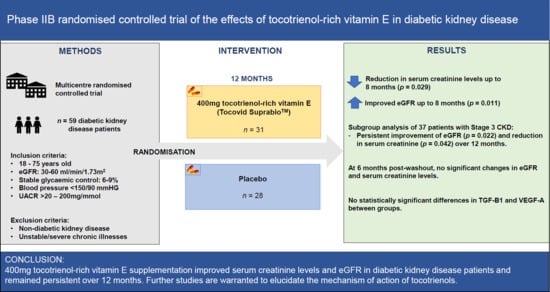
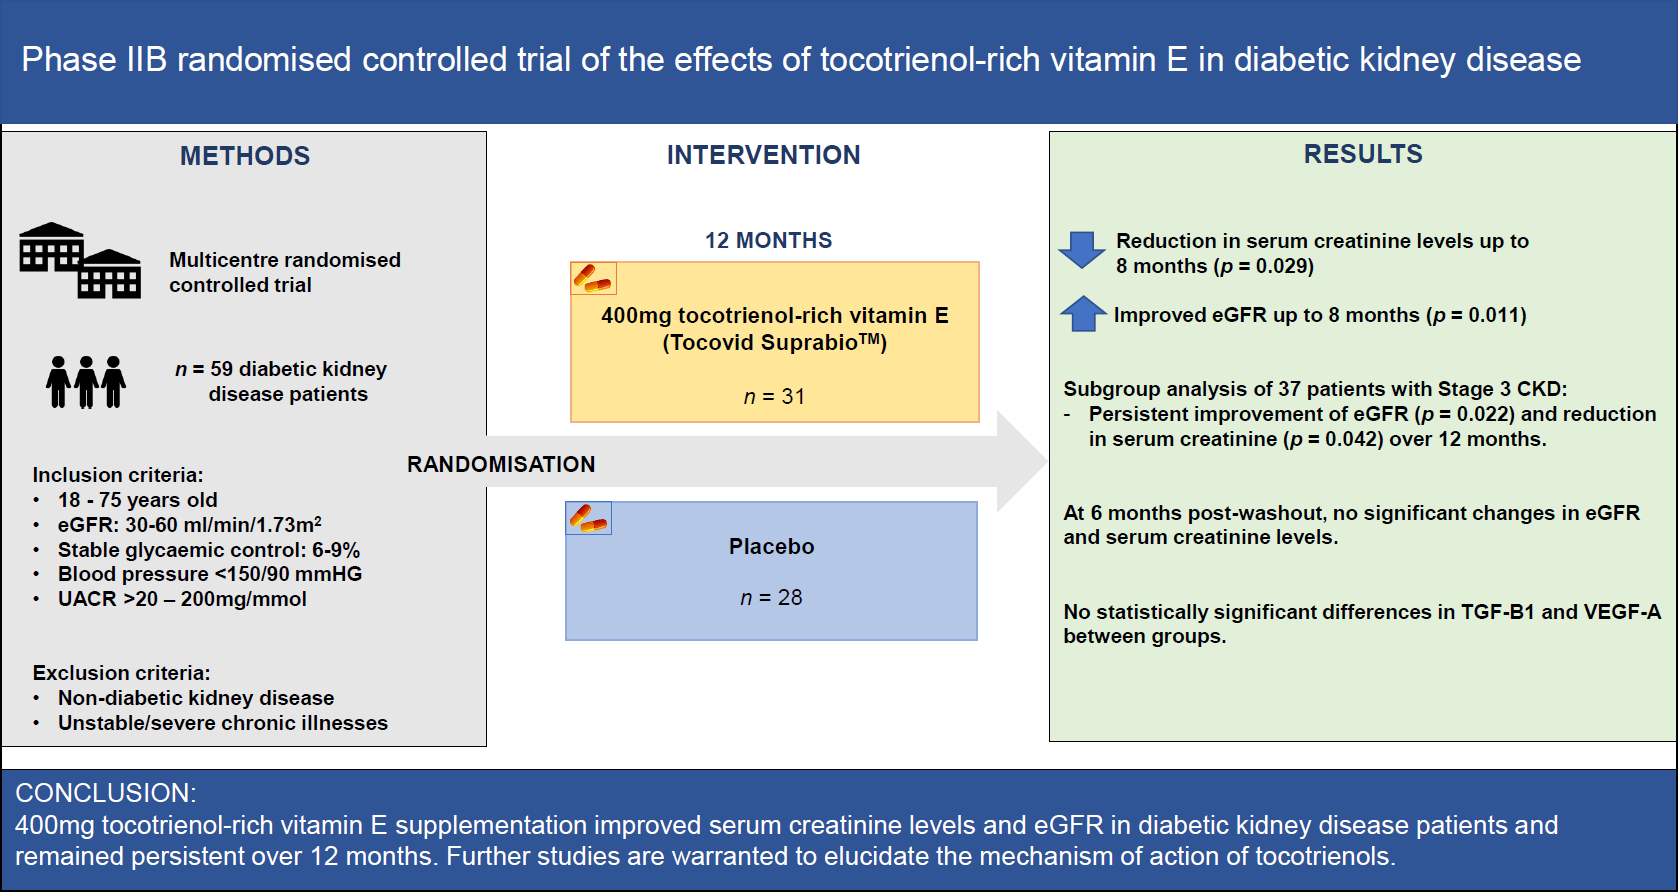
A Phase IIb Randomized Controlled Trial Investigating the Effects of Tocotrienol-Rich Vitamin E on Diabetic Kidney Disease

 ,
,
Abstract
1. Introduction
2. Materials and Methods
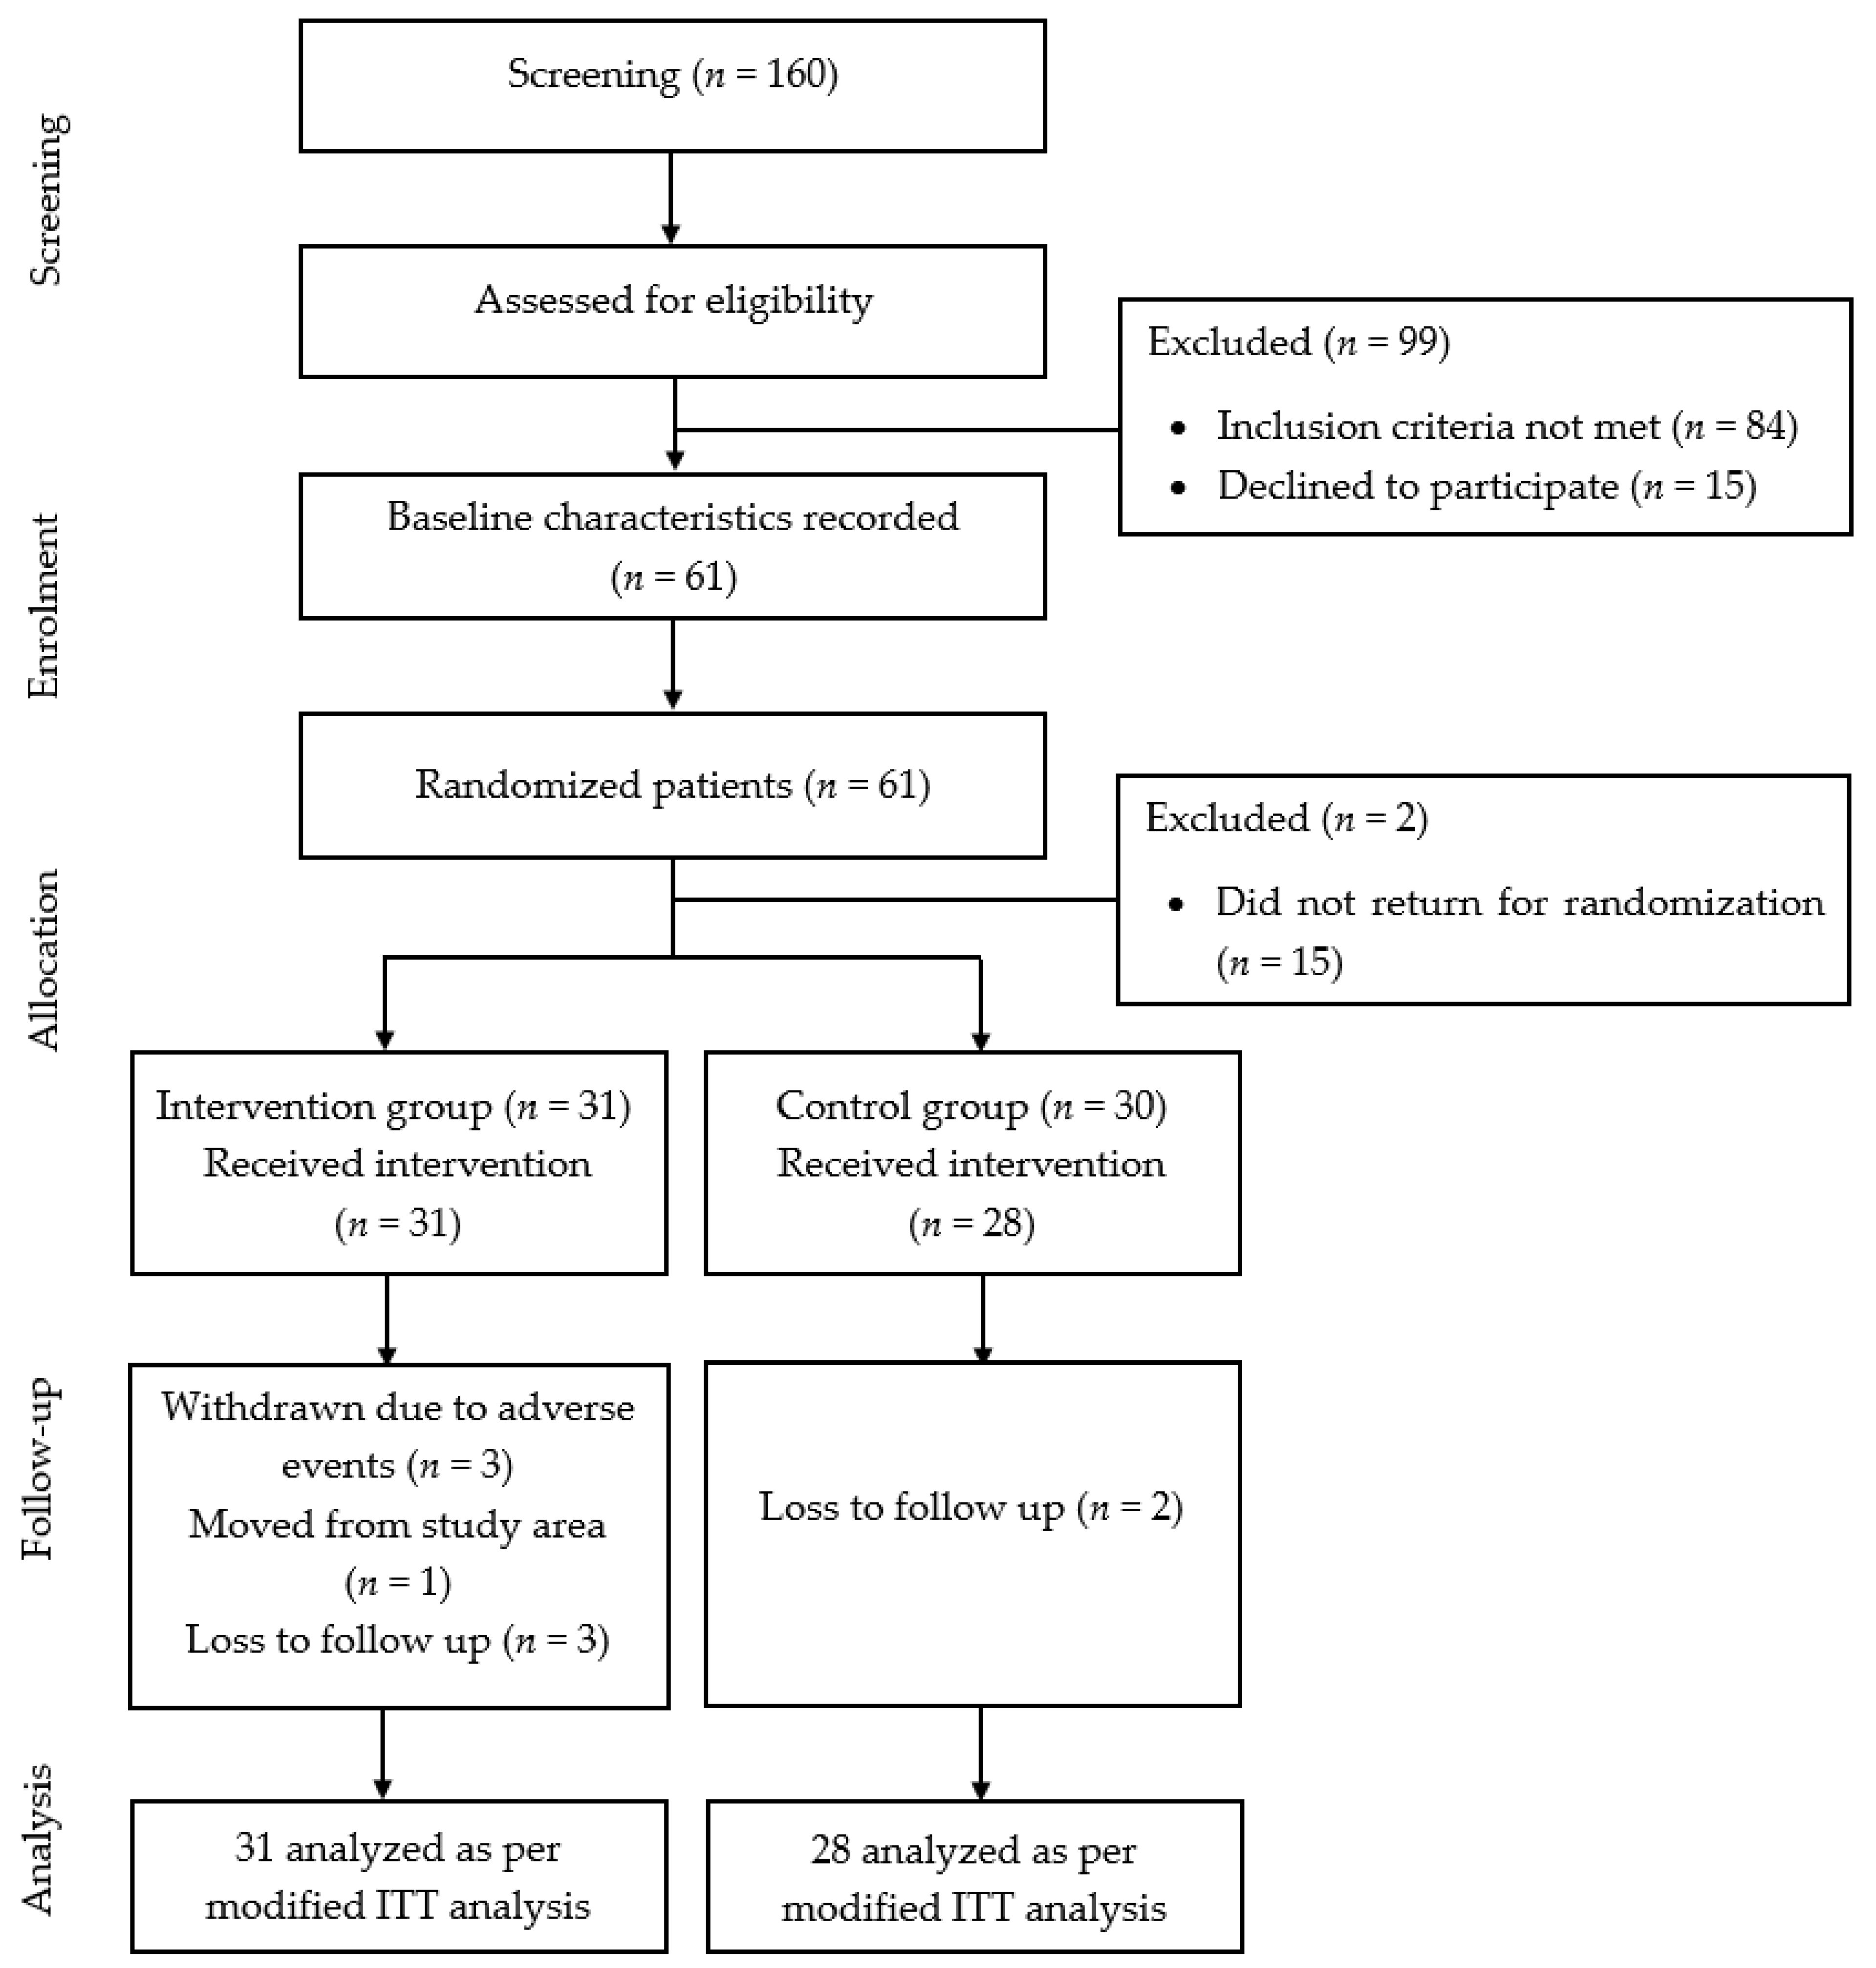
2.1. Study Design and Participants
2.2. Inclusion and Exclusion Criteria
2.3. Ethics
2.4. Screening Visit
2.5. Randomization and Blinding
2.6. Sample Size
2.7. Follow-Up Visits
2.8. Assessment of Outcomes
2.9. Serum Creatinine, eGFR, Liver Function Test and Lipid Profile, HbA1c
2.10. TGF- β1, VEGF-A, Tocotrienol, Tocopherol Levels
2.11. Urine Albumin Creatinine Ratio UACR
2.12. Statistical Analysis
3. Results
3.1. Baseline Characteristics
3.2. Six Months Post-Tocotrienol-Rich Vitamin E Supplementation
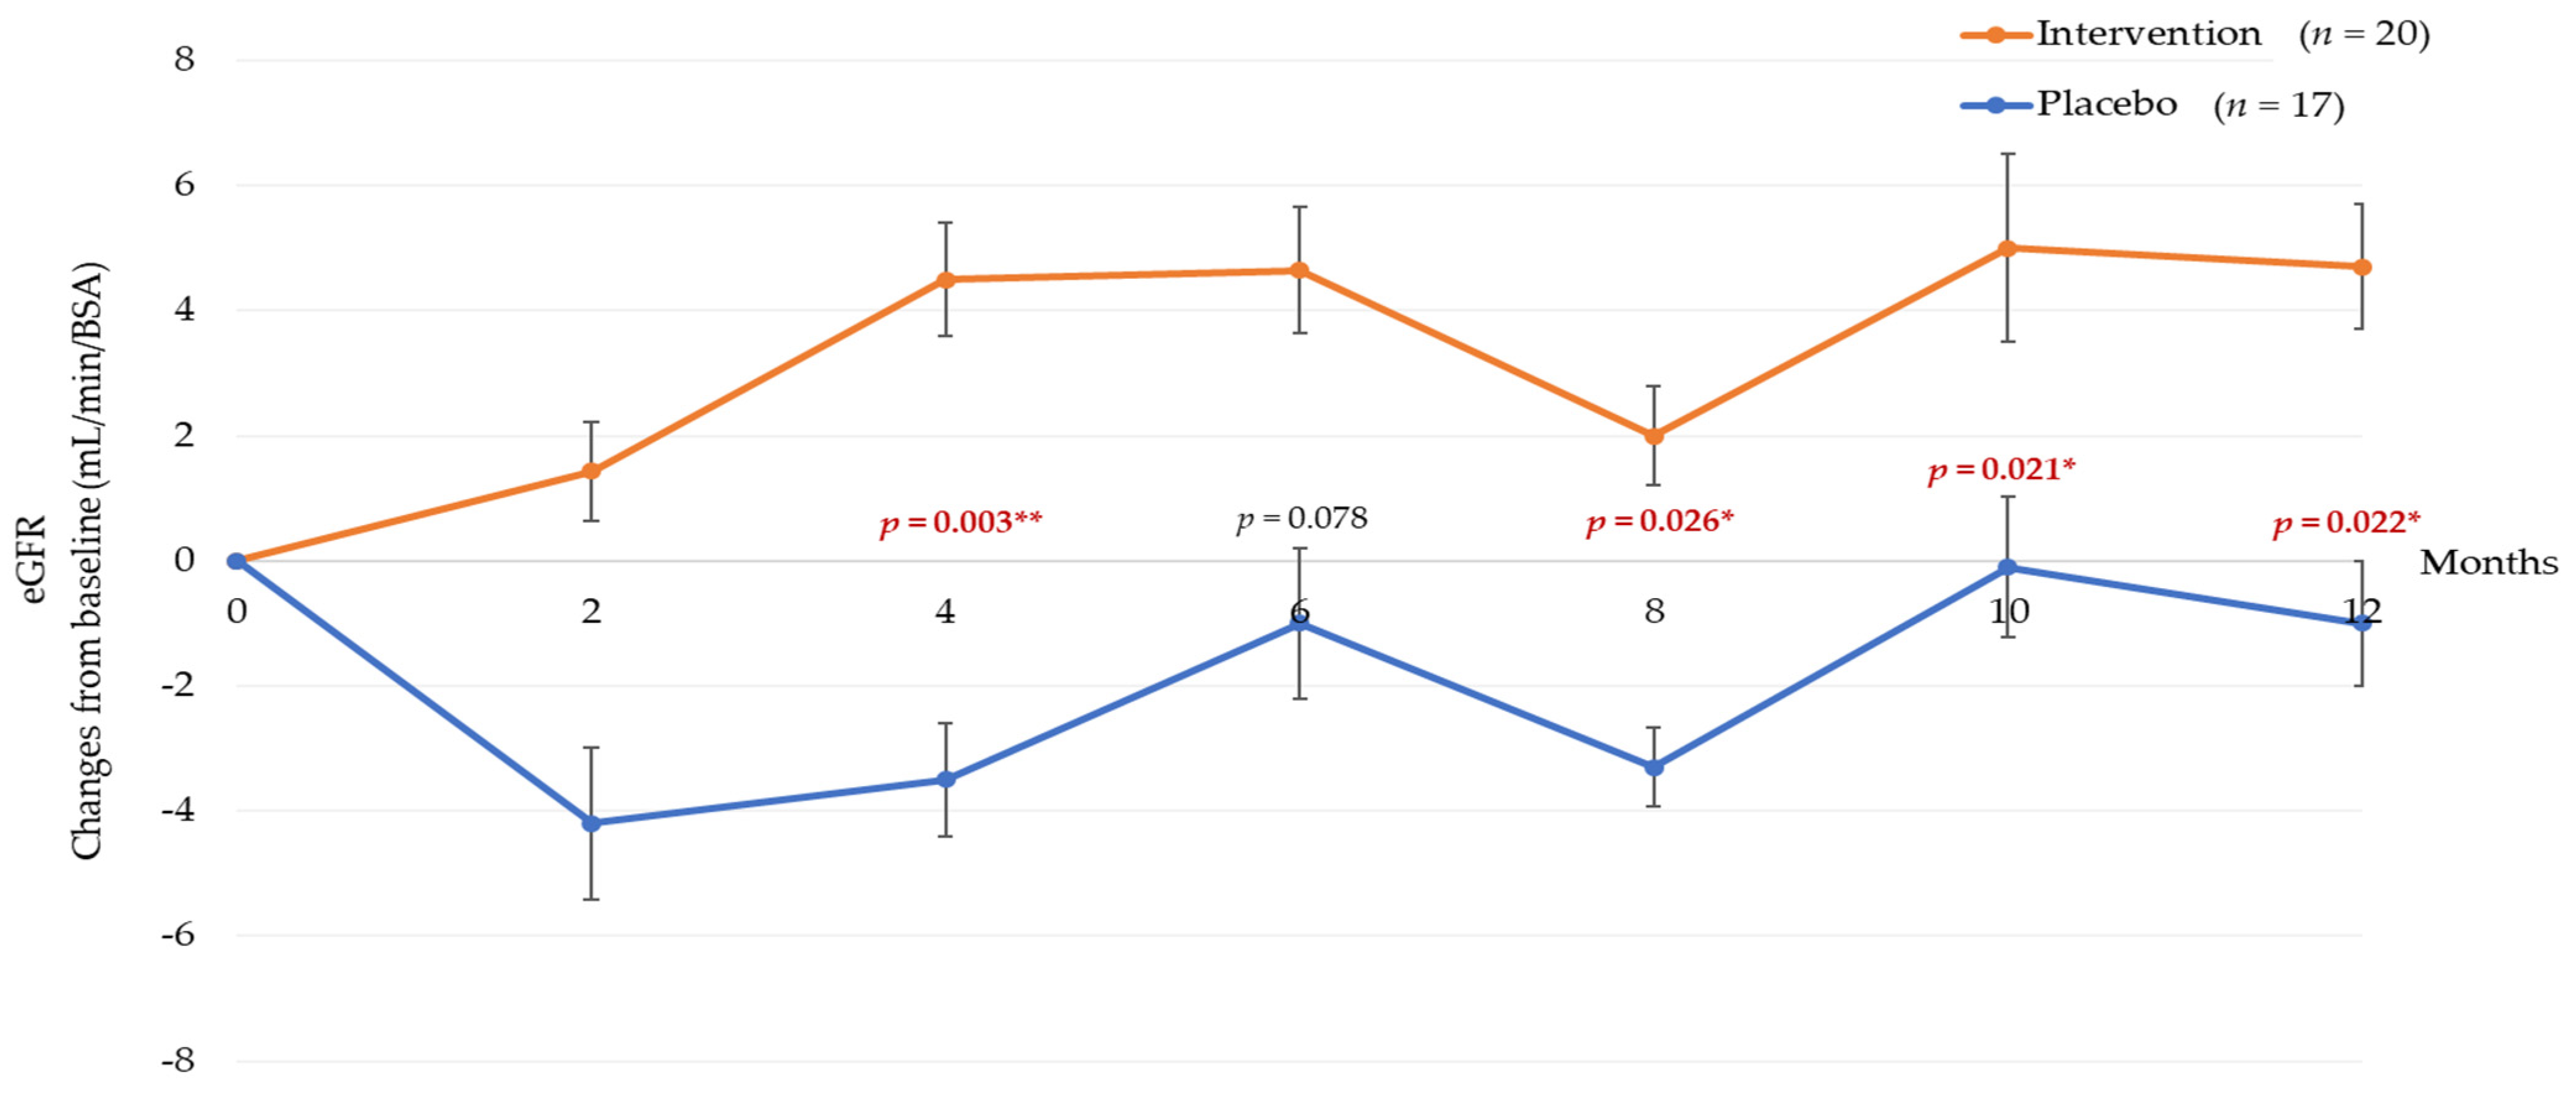
3.3. Twelve Months Post-Tocotrienol-Rich Vitamin E Supplementation
3.4. Correlation of Renal Parameters with TGF-β1 and VEGF-A
3.5. Subgroup Analysis
3.6. Post Washout Analysis
4. Discussion
Author Contributions
Funding
Institutional Review Board Statement
Informed Consent Statement
Data Availability Statement
Acknowledgments
Conflicts of Interest
References
- Luyckx, V.A.; Tonelli, M.; Stanifer, J.W. The global burden of kidney disease and the sustainable development goals. Bull. World Health Organ. 2018, 96, 414–422D. [Google Scholar] [CrossRef] [PubMed]
- Toth-Manikowski, S.; Atta, M.G. Diabetic Kidney Disease: Pathophysiology and Therapeutic Targets. J. Diabetes Res. 2015, 2015, 697010. [Google Scholar] [CrossRef] [PubMed]
- Di Vincenzo, A.; Tana, C.; El Hadi, H.; Pagano, C.; Vettor, R.; Rossato, M. Antioxidant, Anti-Inflammatory, and Metabolic Properties of Tocopherols and Tocotrienols: Clinical Implications for Vitamin E Supplementation in Diabetic Kidney Disease. Int. J. Mol. Sci. 2019, 20, 5101. [Google Scholar] [CrossRef] [PubMed]
- Aggarwal, B.B.; Sundaram, C.; Prasad, S.; Kannappan, R. Tocotrienols, the vitamin E of the 21st century: Its potential against cancer and other chronic diseases. Biochem. Pharmacol. 2010, 80, 1613–1631. [Google Scholar] [CrossRef]
- Peh, H.Y.; Tan, W.S.; Liao, W.; Wong, W.S. Vitamin E therapy beyond cancer: Tocopherol versus tocotrienol. Pharmacol. Ther. 2016, 162, 152–169. [Google Scholar] [CrossRef]
- Palozza, P.; Verdecchia, S.; Avanzi, L.; Vertuani, S.; Serini, S.; Iannone, A.; Manfredini, S. Comparative antioxidant activity of tocotrienols and the novel chromanyl-polyisoprenyl molecule FeAox-6 in isolated membranes and intact cells. Mol. Cell. Biochem. 2006, 287, 21–32. [Google Scholar] [CrossRef] [PubMed]
- Bardhan, J.; Chakraborty, R.; Raychaudhuri, U. The 21st century form of vitamin E--tocotrienol. Curr. Pharm. Des. 2011, 17, 2196–2205. [Google Scholar] [CrossRef] [PubMed][Green Version]
- Lonn, E.; Yusuf, S.; Hoogwerf, B.; Pogue, J.; Yi, Q.; Zinman, B.; Bosch, J.; Dagenais, G.; Mann, J.F.; Gerstein, H.C. Effects of vitamin E on cardiovascular and microvascular outcomes in high-risk patients with diabetes: Results of the HOPE study and MICRO-HOPE substudy. Diabetes Care 2002, 25, 1919–1927. [Google Scholar] [CrossRef]
- Xu, R.; Zhang, S.; Tao, A.; Chen, G.; Zhang, M. Influence of Vitamin E Supplementation on Glycaemic Control: A Meta-Analysis of Randomised Controlled Trials. PLoS ONE 2014, 9, e95008. [Google Scholar] [CrossRef]
- Suksomboon, N.; Poolsup, N.; Sinprasert, S. Effects of vitamin E supplementation on glycaemic control in type 2 diabetes: Systematic review of randomized controlled trials. J. Clin. Pharm. Ther. 2011, 36, 53–63. [Google Scholar] [CrossRef]
- Patel, N.; Amin, P.; Shenoy, A. Is vitamin E supplementation effective in reducing mortality related to cardiovascular events in people with type 2 diabetes mellitus? A systematic review. IJC Metab. Endocr. 2016, 12, 42–45. [Google Scholar] [CrossRef][Green Version]
- Tan, S.M.Q.; Chiew, Y.; Ahmad, B.; Kadir, K.A. Tocotrienol-Rich Vitamin E from Palm Oil (Tocovid) and Its Effects in Diabetes and Diabetic Nephropathy: A Pilot Phase II Clinical Trial. Nutrients 2018, 10, 1315. [Google Scholar] [CrossRef] [PubMed]
- Tan, G.C.J.; Tan, S.M.Q.; Phang, S.C.W.; Ng, Y.T.; Ng, E.Y.; Ahmad, B.; Palamisamy, U.D.M.; Kadir, K.A. Tocotrienol-rich vitamin E improves diabetic nephropathy and persists 6-9 months after washout: A phase IIa randomized controlled trial. Ther. Adv. Endocrinol. Metab. 2019. [Google Scholar] [CrossRef] [PubMed]
- Goldfarb, S.; Ziyadeh, F.N. TGF-beta: A crucial component of the pathogenesis of diabetic nephropathy. Trans. Am. Clin. Climatol. Assoc. 2001, 112, 27–32. [Google Scholar]
- Siddiqui, S.; Ahsan, H.; Khan, M.R.; Siddiqui, W.A. Protective effects of tocotrienols against lipid-induced nephropathy in experimental type-2 diabetic rats by modulation in TGF-β expression. Toxicol. Appl. Pharmacol. 2013, 273, 314–324. [Google Scholar] [CrossRef] [PubMed]
- Cojocel, C.; Al-Maghrebi, M.; Thomson, M.S.; Rawoot, P.; Raghupathy, R. Modulation of the transforming growth factor beta1 by vitamin E in early nephropathy. Med. Princ. Pract. 2005, 14, 422–429. [Google Scholar] [CrossRef] [PubMed]
- Che, H.-L.; Tan, D.M.-Y.; Meganathan, P.; Gan, Y.-L.; Abdul Razak, G.; Fu, J.-Y. Validation of a HPLC/FLD method for quantification of tocotrienols in human plasma. Int. Anal. Chem. 2015, 2015, 1–7. [Google Scholar] [CrossRef] [PubMed]
- Lim, J.U.; Lee, J.H.; Kim, J.S.; Hwang, Y.I.; Kim, T.-H.; Lim, S.Y.; Yoo, K.H.; Jung, K.-S.; Kim, Y.K.; Rhee, C.K. Comparison of World Health Organization and Asia-Pacific body mass index classifications in COPD patients. Int. J. Chronic Obstr. Pulm. Dis. 2017, 12, 2465–2475. [Google Scholar] [CrossRef] [PubMed]
- Altemtam, N.; Russell, J.; El Nahas, M. A study of the natural history of diabetic kidney disease (DKD). Nephrol. Dial. Transplant. 2011, 27, 1847–1854. [Google Scholar] [CrossRef] [PubMed]
- Alicic, R.Z.; Rooney, M.T.; Tuttle, K.R. Diabetic Kidney Disease: Challenges, Progress, and Possibilities. Clin. J. Am. Soc. Nephrol. 2017, 12, 2032–2045. [Google Scholar] [CrossRef]
- Bouhairie, V.E.; McGill, J.B. Diabetic Kidney Disease. Mo. Med. 2016, 113, 390–394. [Google Scholar] [PubMed]
- Anyanwagu, U.; Donnelly, R.; Idris, I. Individual and Combined Relationship between Reduced eGFR and/or Increased Urinary Albumin Excretion Rate with Mortality Risk among Insulin-Treated Patients with Type 2 Diabetes in Routine Practice. Kidney Dis. 2019, 5, 91–99. [Google Scholar] [CrossRef] [PubMed]
- Drury, P.L.; Ting, R.; Zannino, D.; Ehnholm, C.; Flack, J.; Whiting, M.; Fassett, R.; Ansquer, J.-C.; Dixon, P.; Davis, T.M.E.; et al. Estimated glomerular filtration rate and albuminuria are independent predictors of cardiovascular events and death in type 2 diabetes mellitus: The Fenofibrate Intervention and Event Lowering in Diabetes (FIELD) study. Diabetologia 2011, 54, 32–43. [Google Scholar] [CrossRef] [PubMed]
- Zitouni, K.; Harry, D.D.; Nourooz-Zadeh, J.; Betteridge, D.J.; Earle, K.A. Circulating vitamin E, transforming growth factor β1, and the association with renal disease susceptibility in two racial groups with type 2 diabetes. Kidney Int. 2005, 67, 1993–1998. [Google Scholar] [CrossRef] [PubMed]
- Tasanarong, A.; Kongkham, S.; Duangchana, S.; Thitiarchakul, S.; Eiam-Ong, S. Vitamin E ameliorates renal fibrosis by inhibition of TGF-beta/Smad2/3 signaling pathway in UUO mice. J. Med. Assoc. Thai. 2011, 94 (Suppl. 7), S1–S9. [Google Scholar] [PubMed]
- Zhao, Y.; Zhang, W.; Jia, Q.; Feng, Z.; Guo, J.; Han, X.; Liu, Y.; Shang, H.; Wang, Y.; Liu, W.J. High Dose Vitamin E Attenuates Diabetic Nephropathy via Alleviation of Autophagic Stress. Front. Physiol. 2019, 9, 1939. [Google Scholar] [CrossRef] [PubMed]
- Leaf, I.A.; Duffield, J.S. What can target kidney fibrosis? Nephrol. Dial. Transplant. 2017, 32 (Suppl. 1), i89–i97. [Google Scholar] [CrossRef] [PubMed]
- Isaka, Y. Targeting TGF-β Signaling in Kidney Fibrosis. Int. J. Mol. Sci. 2018, 19, 2532. [Google Scholar] [CrossRef] [PubMed]
- Böhler, J.; Becker, A.; Reetze-Bonorden, P.; Woitas, R.; Keller, E.; Schollmeyer, P. Effect of antihypertensive drugs on glomerular hyperfiltration and renal haemodynamics. Eur. J. Clin. Pharmacol. 1993, 44, S57–S61. [Google Scholar] [CrossRef]
- Mou, X.; Zhou, D.-Y.; Zhou, D.-Y.; Ma, J.-R.; Liu, Y.-H.; Chen, H.-P.; Hu, Y.-B.; Shou, C.-M.; Chen, J.-W.; Liu, W.-H.; et al. Serum TGF-β1 as a Biomarker for Type 2 Diabetic Nephropathy: A Meta-Analysis of Randomized Controlled Trials. PLoS ONE 2016, 11, e0149513. [Google Scholar] [CrossRef]
- Pena, M.J.; Mischak, H.; Heerspink, H.J.L. Proteomics for prediction of disease progression and response to therapy in diabetic kidney disease. Diabetologia 2016, 59, 1819–1831. [Google Scholar] [CrossRef] [PubMed]


| Baseline Characteristic | Tocovid (n = 31) | Placebo (n = 28) | p-Value | Total (n = 59) |
|---|---|---|---|---|
| Age (years) | 66 (13) | 70 (13) | 0.403 a | 67 (14) |
| Gender | 0.985 b | |||
| Male (%) | 20 (52.6 %) | 18 (47.4 %) | 38 (64.6 %) | |
| Female (%) | 11 (52.4 %) | 10 (47.6 %) | 21 (35.6 %) | |
| Race | 0.216 c | |||
| Malay (%) | 21 (67.7 %) | 13 (46.4 %) | 34 (57.6 %) | |
| Chinese (%) | 6 (19.4 %) | 9 (32.1 %) | 15 (25.4 %) | |
| Indian (%) | 4 (12.9 %) | 4 (14.3 %) | 8 (13.6 %) | |
| Others (%) | 0 (0 %) | 2 (7.2 %) | 2 (3.4 %) | |
| BMI (kg/m2) | 28.1 ± 4.4 | 29.1 ± 5.0 | 0.403 d | 28.5 ± 4.7 |
| SBP (mmHg) | 134 ± 14 | 129 ± 12 | 0.149 d | 132 ± 13 |
| DBP (mmHg) | 76.7 ± 8.9 | 75.3 ± 9.7 | 0.557 d | 76 ± 9 |
| Duration of diabetes (year) | 15.3 ± 7.6 | 17.9 ± 8.9 | 0.231 d | 16.5 ± 8.3 |
| HbA1c (%) | 7.59 ± 0.95 | 7.56 ± 1.10 | 0.903 d | 7.57 ± 1.02 |
| eGFR (mL/min/1.73 m2) | 54.9 ± 18.4 | 56.0 ± 20.4 | 0.829 d | 55.9 ± 19.2 |
| Serum creatinine (µmol/L) | 122 ± 48 | 118 ± 34 | 0.829 d | 121 ± 42 |
| UACR (mg/mmol) | 20.9 (45.6) | 18.8 (43.9) | 0.988 a | 19 (44.3) |
| Urea (mmol/L) | 6.95 ± 2.56 | 6.82 ± 2.07 | 0.832 d | 6.89 ± 2.32 |
| Uric acid (mmol/L) | 383 ± 102 | 427 ± 99 | 0.097 †,d | 404 ± 13 |
| Parameters | 2 Months Post-Supplementation | 4 Months Post-Supplementation | 6 Months Post-Supplementation | |||||||||
|---|---|---|---|---|---|---|---|---|---|---|---|---|
| Intervention (31) | Placebo (28) | Mean Difference Mean (95%CI) | p-Value | Intervention (31) | Placebo (28) | Mean Difference Mean (95%CI) | p-Value | Intervention (31) | Placebo (28) | Mean Difference Mean (95%CI) | p-Value | |
| General | ||||||||||||
| HbA1c (%) | 7.74 ± 1.16 | 7.87 ± 1.36 | −0.16 (−0.62, 0.29) | 0.480 a | - | - | - | - | 7.43 ± 1.26 | 7.31 ± 1.06 | 0.082 (−0.47, 0.64) | 0.769 a |
| Systolic BP—mmHg | 132 ± 15 | 129 ± 14 | −1.95 (−9.87, 5.98) | 0.624 a | 136 ± 15 | 130 ± 13 | 1.39 (−6.62, 9.41) | 0.729 a | 136 ± 14 | 133 ± 13 | −1.78 (−9.99, 6.43) | 0.666 a |
| Diastolic BP—mmHg | 74.4 ± 8.90 | 75.0 ± 9.32 | −2.01 (−6.09, 2.08) | 0.329 a | 77.3 ± 9.30 | 72.9 ± 9.30 | 2.98 (−1.26, 7.24) | 0.165 a | 77.8 ± 8.66 | 77.7 ± 9.26 | −1.27 (−5.16, 2.61) | 0.516 a |
| Renal Parameters | ||||||||||||
| Serum creatinine—µmol/L | 118 ± 42.1 | 127 ± 39.3 | −13.4 (−22.1, −4.7) | 0.003 a,* | 117 ± 43.4 | 122 ± 41.1 | −10.4 (−19.9, −0.87) | 0.033 *,a | 117 ± 44 | 122 ± 38 | −9.66 (−18.49, −0.83) | 0.033 *,a |
| eGFR—mL/min/1.73 m2 | 56.3 ± 18.7 | 51.4 ± 19.3 | 6.02 (2.18, 9.87) | 0.003 a,* | 57.2 ± 18.1 | 54.1 ± 20.8 | 4.2 (−0.01, 8.5) | 0.051 a | 58.1 ± 18.9 | 53.4 ± 19.7 | 5.69 (−0.96, 10.43) | 0.019 *,a |
| UACR—mg/mmol | 13.8 (45) | 13.4 (27) | - | 0.264 b | - | - | - | - | 23.2 (46.7) | 9.55 (49.9) | 0.574 b | |
| Urea – mmol/L | 7.69 ± 2.46 | 7.90 ± 2.48 | −0.33 (−1.31, 0.64) | 0.498 a | 7.43 ± 2.37 | 7.30 ± 2.10 | −0.01 (−0.79, 0.78) | 0.984 a | 7.26 ± 2.31 | 7.35 ± 2.65 | −0.22 (−1.19, 0.74) | 0.644 a |
| Uric acid – mmol/L | 358 ± 121 | 418 ± 89.6 | −16.7 (46.4, 13.0) | 0.265 a | 387 ± 113 | 414 ± 91 | 17.0 (−10.0, 44.3) | 0.216 a | 395 ± 130 | 431 ± 105 | 7.89 (−28.6, 44.4) | 0.667 a |
| Biomarkers | ||||||||||||
| TGF-β1 – ng/mL | 23.3 (19.0) | 23.0 (11.4) | - | 0.933 b | - | - | - | - | 21.72 (7.5) | 17.4 (8.4) | - | 0.534 b |
| VEGF-A—pg/mL | 862 ± 473 | 763 ± 472 | - | 0.127 a | - | - | - | - | 796 ± 488 | 551 ± 356 | - | 0.794 a |
| Parameters | 8 Months Post-Supplementation | 10 Months Post-Supplementation | 12 Months Post-Supplementation | |||||||||
|---|---|---|---|---|---|---|---|---|---|---|---|---|
| Intervention (31) | Placebo (28) | Mean Difference Mean (95%CI) | p-value | Intervention (31) | Placebo (28) | Mean Difference Mean (95%CI) | p-Value | Intervention (31) | Placebo (28) | Mean Difference Mean (95%CI) | p-Value | |
| General | ||||||||||||
| HbA1c (%) | 7.88 ± 1.44 | 7.97 ± 1.27 | −0.13 (−0.78, 0.53) | 0.698 a | 7.68 ± 1.36 | 8.86 ± 5.87 | −1.02 (−3.26, 0.83) | 0.239 a | 7.75 ± 1.41 | 7.98 ± 1.22 | −0.26 (−0.32, 0.38) | 0.424 a |
| Systolic BP—mmHg | 135 ± 13 | 129 ± 11 | 1.39 (−6.17, 8.94) | 0.715 a | 132 ± 15 | 132 ± 12 | −4.76 (−13.0, 3.48) | 0.252 a | 135 ± 13 | 131 ± 10 | −0.68 (3.79, −6.91) | 0.858 a |
| Diastolic BP—mmHg | 74.2 ± 8.26 | 74.6 ± 10.5 | −1.86 (−5.87, 2.14) | 0.355 a | 72.9 ± 10.5 | 75.9 ± 10.9 | −4.40 (−8.94, 0.15) | 0.058 a | 74.2 ± 9.16 | 76.0 ± 10.4 | 2.01 (−7.22, 0.82) | 0.117 a |
| Renal Parameters | ||||||||||||
| Serum creatinine—µmol/L | 118 ± 41.3 | 127 ± 45.0 | −13.4 (−23.9, −2.95) | 0.029 *,† | 116 ± 41 | 120 ± 37 | −8.75 (−18.1, 0.59) | 0.066 a | 114 (38.8) | 107 (40.2) | - | 0.076 b |
| eGFR—mL/min/1.73 m2 | 56.7 ± 18.4 | 52.6 ± 21.0 | 5.19 (1.22, 9.16) | 0.011* | 56.8 ± 16.1 | 54.2 ± 19.3 | 3.69 (−0.93, 8.32) | 0.115 a | 56.8 ± 16.7 | 53.8 ± 20.2 | 4.07 (−0.522, 8.66) | 0.081 a |
| UACR—mg/mmol | - | - | - | - | - | - | - | - | 28.6 (56.4) | 15.3 (45.8) | 0.125 b | |
| Urea – mmol/L | 6.40 ± 2.55 | 7.54 ± 2.85 | 5.19 (1.22, 9.16) | 0.014 * | 6.83 ± 2.02 | 7.07 ± 1.90 | −0.37 (−1.24, 0.49) | 0.394 a | 6.68 (2.18) | 7.43 (4.02) | 0.021 *,b | |
| Uric acid – mmol/L | 401 ± 118 | 426 ± 101 | 19.2 (−18.7, 57.2) | 0.314 a | 385 ± 110 | 399 ± 80.5 | 30.1 (−1.94, 62.3) | 0.065 a | 372 ± 83 | 416 ± 106 | 0.049 (−37.8, 37.9) | 0.998 a |
| Biomarkers | ||||||||||||
| TGF-β1 – ng/mL | - | - | - | - | - | - | - | - | 19.0 (8.7) | 14.6 (7.3) | - | 0.638 b |
| VEGF-A pg/mL | - | - | - | - | - | - | - | - | 653(429) | 497 (511) | - | 0.940 a |
| Baseline Parameters | TGF-β1 – ng/mL | VEGF-A pg/mL | ||
|---|---|---|---|---|
| Correlation, r | p-Value a | Correlation, r | p-Value a | |
| Serum creatinine—µmol/L | −0.036 | 0.785 | −0.062 a | 0.638 |
| eGFR—mL/min/1.73 m2 | 0.054 | 0.687 | 0.119 a | 0.370 * |
| Parameters (Subgroup) | 2 Months Post-Supplementation | 4 Months Post-Supplementation | 6 Months Post-Supplementation | ||||||
|---|---|---|---|---|---|---|---|---|---|
| Intervention (31) | Placebo (28) | p-Value | Intervention (31) | Placebo (28) | p-Value a | Intervention (31) | Placebo (28) | p-Value | |
| General | |||||||||
| HbA1c (%) | 0.05 ± 1.08 | 0.44 ± 0.85 | 0.295 †,a | - | - | - | −0.090 ± 1.27 | −0.34 ± 0.86 | 0.505 a |
| Systolic BP—mmHg | 0.05 ± 15.77 | −0.82 ± 13.41 | 0.858 a | 2.13 ± 15.23 | 1.88 ± 14.88 | 0.962 | 4.56 ± 16.58 | 6.08 ± 15.82 | 0.778 a |
| Diastolic BP—mmHg | −2.00 ± 9.84 | −1.77 ± 6.17 | 0.933 a | 0.57 ± 8.35 | −2.41 ± 5.15 | 0.210 | 1.54 ± 8.54 | 3.51 ± 7.12 | 0.455 a |
| Renal Parameters | |||||||||
| Serum creatinine—µmol/L | −5.88 ± 18.66 | 12.45 ± 16.58 | 0.004 a,* | −9.55 ± 8.92 | −7.23 ± 17.68 | 0.046 a,*,† | −7.23 ± 17.68 | 5.82 ± 21.38 | 0.050 a,* |
| eGFR—mL/min/1.73 m2 | 1.65 ± 6.70 | −4.18 ± 6.30 | 0.010 a,* | 4.36 ± 9.38 | −3.41 ± 4.27 | 0.003 a,* | 4.55 ± 11.06 | −1.11 ± 7.09 | 0.078 a |
| UACR—mg/mmol | 0.10 (8.83) | −0.70 (10.65) | 0.177 b | - | - | - | 0.60 (27.08) | 0.50(7.60) | 0.497 b |
| Urea – mmol/L | 0.84 ± 2.06 | 0.68 ± 1.82 | 0.808 a | 0.45 ± 1.82 | 0.30 ± 1.27 | 0.777 | −0.40 (1.03) | 0.00(2.40) | 0.729 b |
| Uric acid – mmol/L | −17.9 ± 44.7 | −11.8 ± 65.5 | 0.744 a | −5.95 ± 43.9 | −1.19 ± 40.0 | 0.734 | 17.5 ± 77.6 | 16.7± 72.1 | 0.973 a |
| Parameters (Subgroup) | 8 Months Post-Supplementation | 10 Months Post-Supplementation | 12 Months Post-Supplementation | ||||||
|---|---|---|---|---|---|---|---|---|---|
| Intervention (31) | Placebo (28) | p-Value | Intervention (31) | Placebo (28) | p-Value | Intervention (31) | Placebo (28) | p-Value | |
| General | |||||||||
| HbA1c (%) | 0.32 ± 1.38 | 0.30 ± 0.98 | 0.969 †,a,* | - | - | - | 0.42 ± 1.65 | 0.49 ± 6.78 | 0.879 a |
| Systolic BP—mmHg | 1.77 ± 16.40 | −0.88 ± 10.75 | 0.573 a | 1.57 ± 17.79 | 0.65 ± 10.89 | 0.854 | 3.79 ± 19.59 | 2.12 ± 8.23 | 0.746 a |
| Diastolic BP—mmHg | −3.38 ± 6.64 | −1.47 ± 9.84 | 0.489 a | −3.58 ± 9.75 | −1.71 ± 7.25 | 0.518 | −2.45 ± 8.44 | 0.88 ± 7.48 | 0.558 a |
| Renal Parameters | |||||||||
| Serum creatinine—µmol/L | −7.29 ± 14.31 | 13.8 ± 27.4 | 0.008 a,* | −11.15 ± 17.66 | 1.91. ± 19.50 | 0.040 * | −7.85 (20.75) | 0.84 (26.03) | 0.042 b |
| eGFR—mL/min/1.73 m2 | 2.35 ± 5.43 | −3.29 ± 9.10 | 0.026 a,* | 5.09 ± 6.34 | −0.13 ± 6.85 | 0.021 * | 4.83 ± 6.78 | −1.45 ± 9.18 | 0.022 a,* |
| UACR—mg/mmol | - | - | - | - | - | - | 1.78 (45.7) | 0.56 (17.04) | 0.141 b |
| Urea – mmol/L | −0.72 ± 2.13 | 0.79 ± 1.59 | 0.021 a,* | −0.58 ± 1.45 | −0.17 ± 1.59 | 0.421 | −0.87 ± 1.69 | 0.81 ± 2.39 | 0.017 a,* |
| Uric acid – mmol/L | −12.0 (103) | 6.00 (104) | 0.916 b | −12.36 ± 70.75 | −25.71 ± 57.89 | 0.545 | −22.07 ± 63.88 | 1.45 ± 82.73 | 0.336 a |
| Renal Parameters | Intervention Group (n = 29) | Placebo (n = 27) | p-Value | ||||
|---|---|---|---|---|---|---|---|
| At 12 Months | 6-Months Washout | Change | At 12 Months | 6-Months Washout | Change | ||
| HbA1c (%) | 7.50 ± 1.20 | 7.50 ± 1.30 | −0.40 ± 1.00 | 8.00 ± 1.20 | 7.70 ± 1.20 | −0.30 ± 0.80 | 0.426 |
| UACR (mg/mmol) | 28.60 (56.40) | 15.80 (34.20) | −19.30 ± 25.70 | 15.30 (45.80) | 18.50 (56.20) | 4.60 ± 17.90 | 0.006 * |
| Serum creatinine (umol/L) | 107.00 (37.10) | 116.70 (42.40) | 9.70 ± 1.60 | 102.6 (47.20) | 108.70 (63.90) | 6.10 ± 3.00 | 0.657 |
| eGFR (ml/min/1.73 m2) | 61.70 ± 18.20 | 50.90 ± 15.50 | −10.80 ± 22.20 | 59.00 ± 21.40 | 54.70 ± 19.20 | −4.30 ± 12.80 | 0.212 |
| Urea (mmol/L) | 6.20 ± 1.60 | 7.70 ± 2.50 | 1.50 ± 2.40 | 7.20 ± 2.30 | 7.20 ± 2.40 | 0.10 ± 2.20 | 0.026 * |
| Uric acid (mmol/L) | 370.30 ± 87.60 | 355.90 ± 73.20 | −5.60 ± 24.40 | 382.30 ± 78.70 | 392.30 ± 92.90 | 10.00 ± 63.20 | 0.250 |
Publisher’s Note: MDPI stays neutral with regard to jurisdictional claims in published maps and institutional affiliations. |
© 2021 by the authors. Licensee MDPI, Basel, Switzerland. This article is an open access article distributed under the terms and conditions of the Creative Commons Attribution (CC BY) license (http://creativecommons.org/licenses/by/4.0/).
Share and Cite
Koay, Y.Y.; Tan, G.C.J.; Phang, S.C.W.; Ho, J.-I.; Chuar, P.F.; Ho, L.S.; Ahmad, B.; Abdul Kadir, K. A Phase IIb Randomized Controlled Trial Investigating the Effects of Tocotrienol-Rich Vitamin E on Diabetic Kidney Disease. Nutrients 2021, 13, 258. https://doi.org/10.3390/nu13010258
Koay YY, Tan GCJ, Phang SCW, Ho J-I, Chuar PF, Ho LS, Ahmad B, Abdul Kadir K. A Phase IIb Randomized Controlled Trial Investigating the Effects of Tocotrienol-Rich Vitamin E on Diabetic Kidney Disease. Nutrients. 2021; 13(1):258. https://doi.org/10.3390/nu13010258
Chicago/Turabian StyleKoay, Yan Yi, Gerald Chen Jie Tan, Sonia Chew Wen Phang, J-Ian Ho, Pei Fen Chuar, Loon Shin Ho, Badariah Ahmad, and Khalid Abdul Kadir. 2021. "A Phase IIb Randomized Controlled Trial Investigating the Effects of Tocotrienol-Rich Vitamin E on Diabetic Kidney Disease" Nutrients 13, no. 1: 258. https://doi.org/10.3390/nu13010258
APA StyleKoay, Y. Y., Tan, G. C. J., Phang, S. C. W., Ho, J.-I., Chuar, P. F., Ho, L. S., Ahmad, B., & Abdul Kadir, K. (2021). A Phase IIb Randomized Controlled Trial Investigating the Effects of Tocotrienol-Rich Vitamin E on Diabetic Kidney Disease. Nutrients, 13(1), 258. https://doi.org/10.3390/nu13010258