Differential Effects of DHA- and EPA-Rich Oils on Sleep in Healthy Young Adults: A Randomized Controlled Trial

 , , , ,
Abstract
1. Introduction
2. Materials and Methods
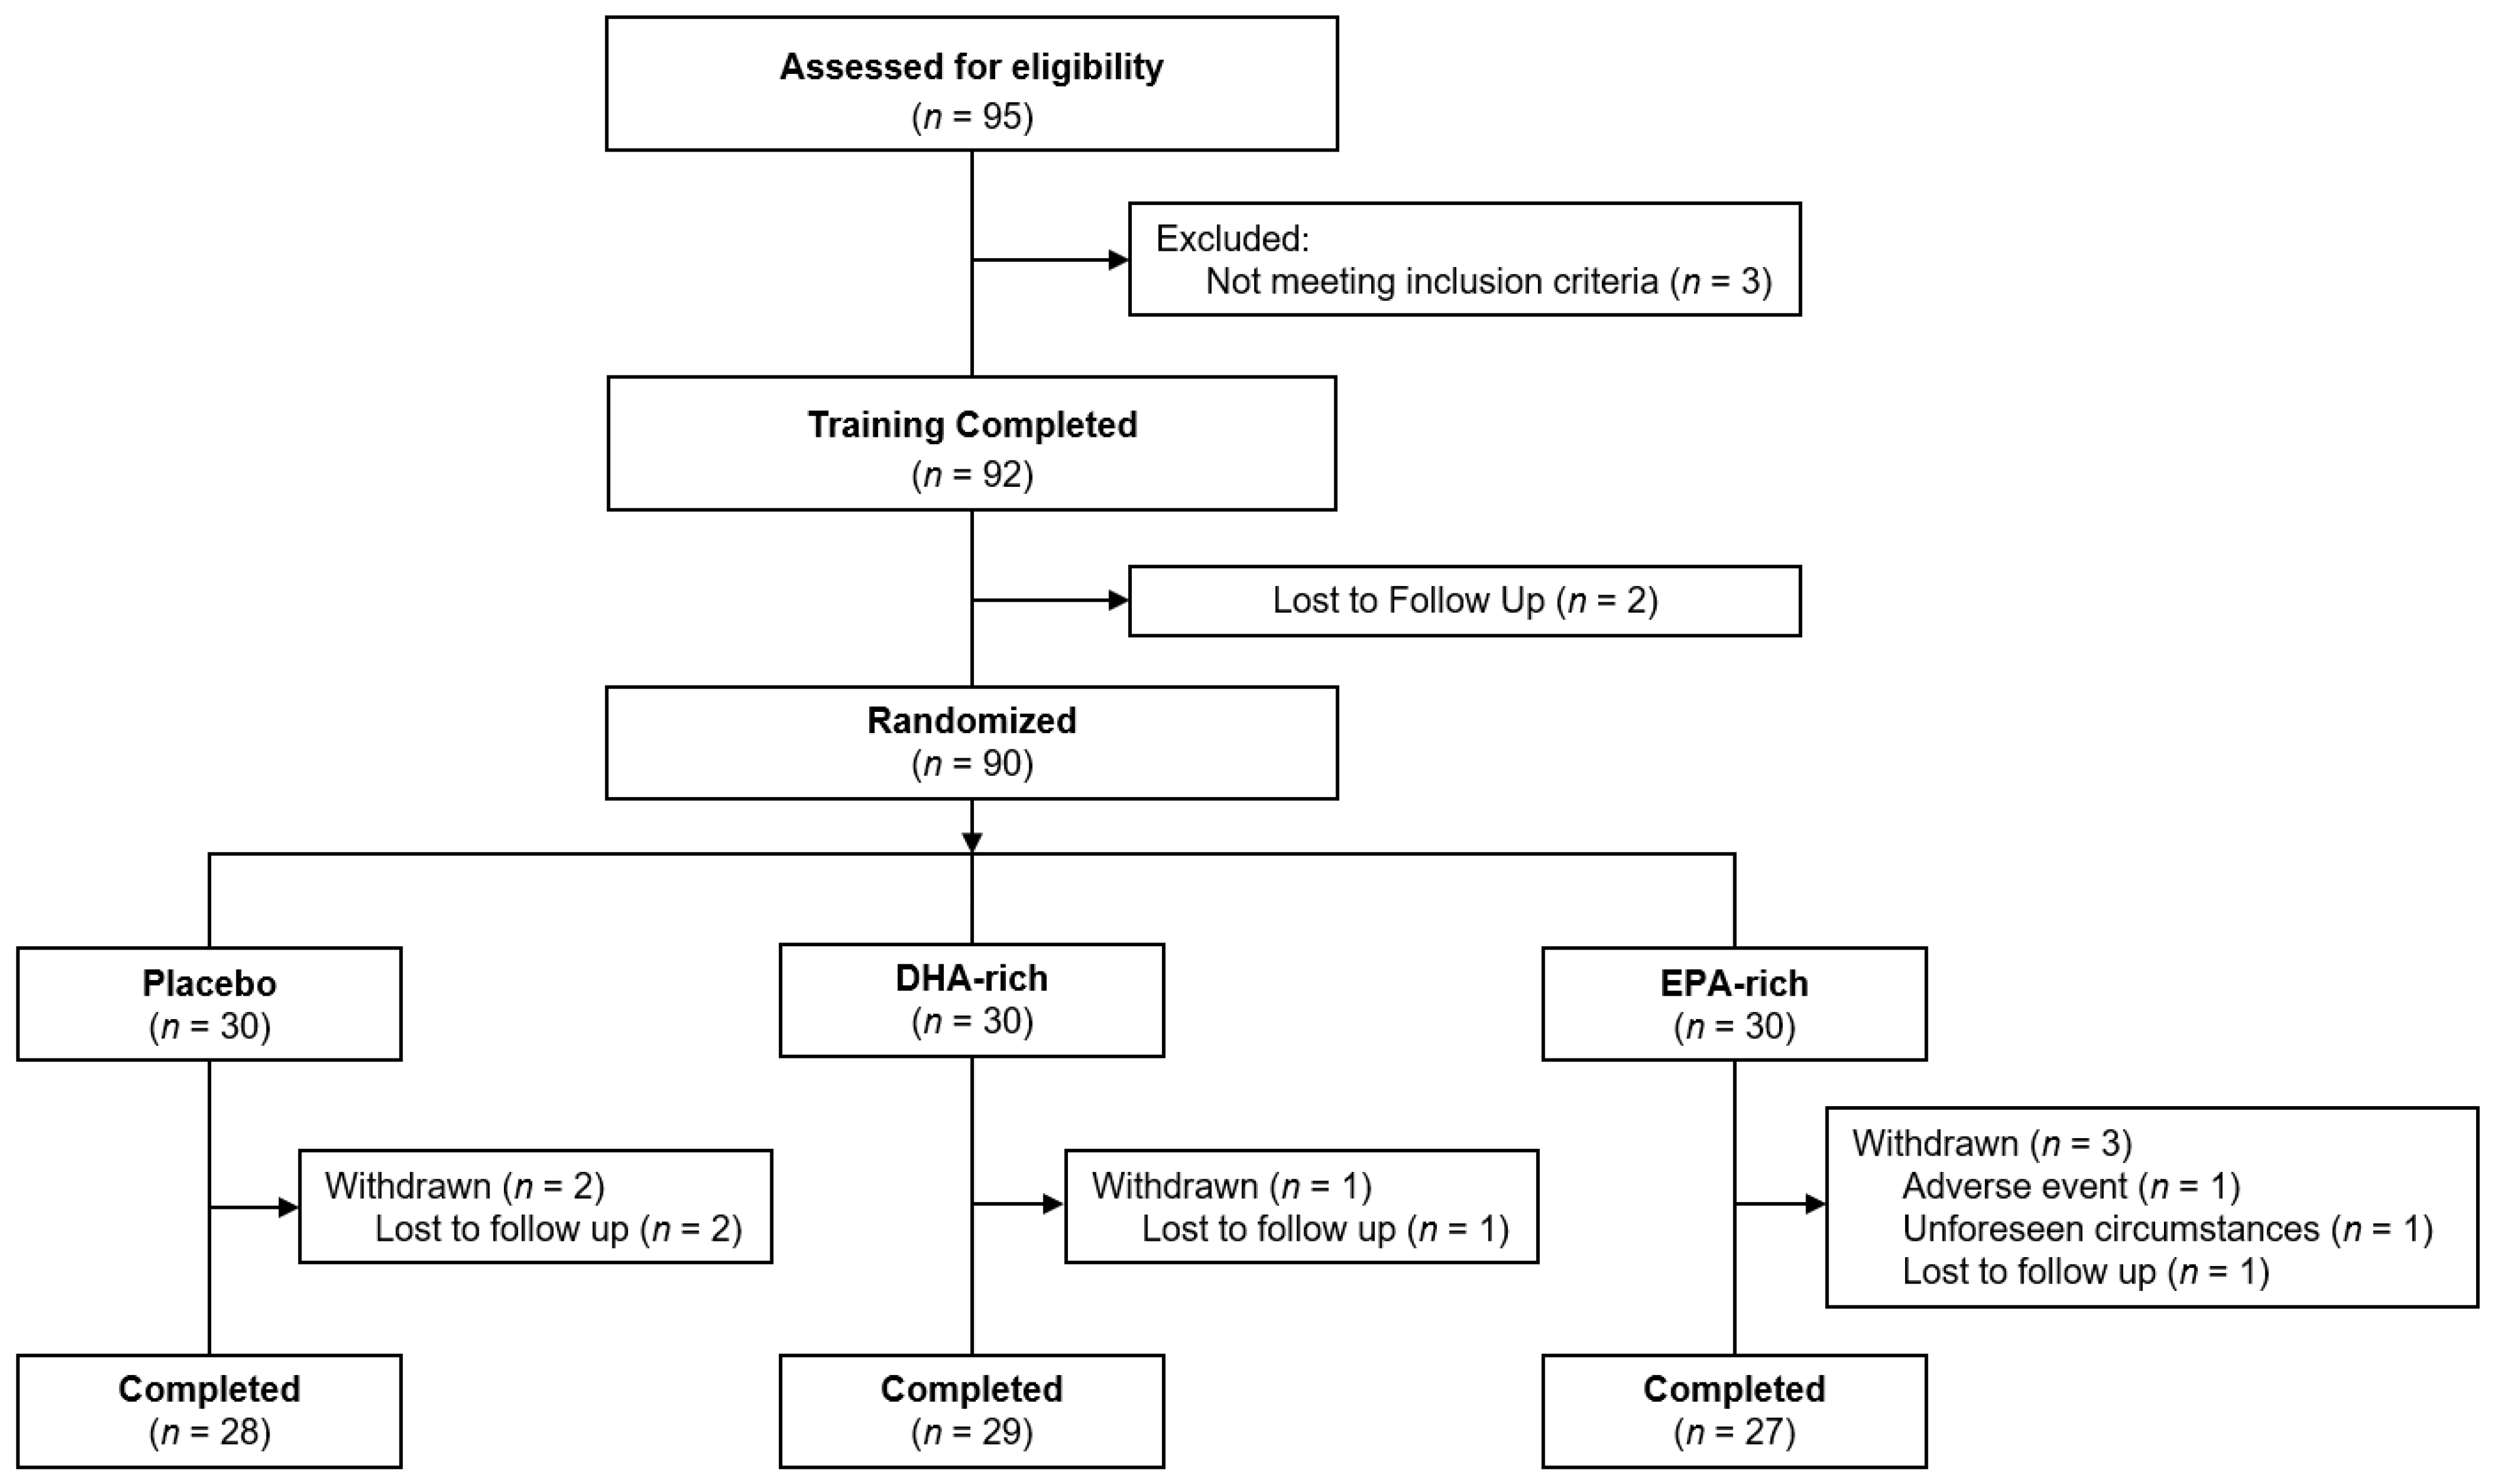
2.1. Study Design
2.2. Participants
2.3. Sample Size
2.4. Randomization
2.5. Treatment
2.6. Procedure
2.7. Outcomes
2.7.1. Subjective Measures
2.7.2. Biological Measures
2.7.3. Objective Measures
- Sleep latency (The difference in minutes between In-Bedtime and sleep onset).
- Sleep efficiency (Number of sleep minutes divided by the total number of minutes the participant was in bed, i.e., the difference between the In-Bed and Out-Bedtime).
- Total sleep time (The total number of minutes scored as “asleep”).
- Total minutes in bed (The total number of minutes in bed both awake and asleep).
- Wake after sleep onset (The total number of minutes awake after sleep onset occurred).
- Number of awakenings (Total number of awakenings from the time spent in bed).
- Average awakening length (The average length, in minutes, of all awakening episodes).
- Sleep Fragmentation Index (The sum of the Movement Index—Total of scored awake minutes divided by Total time in bed in hours ×100 and the Fragmentation Index—Total of 1-min scored sleep bouts divided by the total number of sleep bouts of any length × 100)
2.8. Red Blood Cell Fatty Acid Measurements
2.9. Compliance and Treatment Guess
2.10. Statistical Methods
2.11. Ethics
3. Results
3.1. Compliance
3.2. Mixed Models Analysis
3.2.1. Objective Measures
3.2.2. Subjective Measures
3.2.3. Biological Measures
4. Discussion
Supplementary Materials
Author Contributions
Funding
Institutional Review Board Statement
Informed Consent Statement
Data Availability Statement
Acknowledgments
Conflicts of Interest
References
- Frank, S.; Gonzalez, K.; Lee-Ang, L.; Young, M.C.; Tamez, M.; Mattei, J. Diet and Sleep Physiology: Public Health and Clinical Implications. Front. Neurol. 2017, 8. [Google Scholar] [CrossRef] [PubMed]
- St-Onge, M.P.; Mikic, A.; Pietrolungo, C.E. Effects of Diet on Sleep Quality. Adv. Nutr. 2016, 7, 938–949. [Google Scholar] [CrossRef] [PubMed]
- Ji, X.; Grandner, M.A.; Liu, J. The relationship between micronutrient status and sleep patterns: A systematic review. Public Health Nutr. 2017, 20, 687–701. [Google Scholar] [CrossRef] [PubMed]
- Pusceddu, M.M.; Kelly, P.; Stanton, C.; Cryan, J.F.; Dinan, T.G. N-3 Polyunsaturated Fatty Acids through the Lifespan: Implication for Psychopathology. Int. J. Neuropsychopharmacol. 2016, 19, pyw078. [Google Scholar] [CrossRef]
- Da Silva, A.X.; Lavialle, F.; Gendrot, G.; Guesnet, P.; Alessandri, J.M.; Lavialle, M. Glucose transport and utilization are altered in the brain of rats deficient in n-3 polyunsaturated fatty acids. J. Neurochem. 2002, 81, 1328–1337. [Google Scholar] [CrossRef]
- Lavialle, M.; Champeil-Potokar, G.; Alessandri, J.M.; Balasse, L.; Guesnet, P.; Papillon, C.; Pévet, P.; Vancassel, S.; Vivien-Roels, B.; Denis, I. An (n-3) polyunsaturated fatty acid-deficient diet disturbs daily locomotor activity, melatonin rhythm, and striatal dopamine in syrian hamsters. J. Nutr. 2008, 138, 1719–1724. [Google Scholar] [CrossRef]
- Lafourcade, M.; Larrieu, T.; Mato, S.; Duffaud, A.; Sepers, M.; Matias, I.; De Smedt-Peyrusse, V.; Labrousse, V.F.; Bretillon, L.; Matute, C.; et al. Nutritional omega-3 deficiency abolishes endocannabinoid-mediated neuronal functions. Nat. Neurosci. 2011, 14, 345–350. [Google Scholar] [CrossRef]
- Fagioli, I.; Baroncini, P.; Ricour, C.; Salzarulo, P. Decrease of slow-wave sleep in children with prolonged absence of essential lipids intake. Sleep 1989, 12, 495–499. [Google Scholar]
- Cheruku, S.R.; Montgomery-Downs, H.E.; Farkas, S.L.; Thoman, E.B.; Lammi-Keefe, C.J. Higher maternal plasma docosahexaenoic acid during pregnancy is associated with more mature neonatal sleep-state patterning. Am. J. Clin. Nutr. 2002, 76, 608–613. [Google Scholar] [CrossRef]
- Judge, M.P.; Cong, X.; Harel, O.; Courville, A.B.; Lammi-Keefe, C.J. Maternal consumption of a DHA-containing functional food benefits infant sleep patterning: An early neurodevelopmental measure. Early Hum. Dev. 2012, 88, 531–537. [Google Scholar] [CrossRef]
- Montgomery, P.; Burton, J.R.; Sewell, R.P.; Spreckelsen, T.F.; Richardson, A.J. Fatty acids and sleep in UK children: Subjective and pilot objective sleep results from the DOLAB study—A randomized controlled trial. J. Sleep Res. 2014, 23, 364–388. [Google Scholar] [CrossRef] [PubMed]
- Papandreou, C. Independent associations between fatty acids and sleep quality among obese patients with obstructive sleep apnoea syndrome. J. Sleep Res. 2013, 22, 569–572. [Google Scholar] [CrossRef] [PubMed]
- Patrick, R.P.; Ames, B.N. Vitamin D and the omega-3 fatty acids control serotonin synthesis and action, part 2: Relevance for ADHD, bipolar disorder, schizophrenia, and impulsive behavior. FASEB J. 2015, 29, 2207–2222. [Google Scholar] [CrossRef] [PubMed]
- Calder, P.C. Omega-3 fatty acids and inflammatory processes: From molecules to man. Biochem. Soc. Trans. 2017, 45, 1105–1115. [Google Scholar] [CrossRef] [PubMed]
- Huang, Z.-L.; Urade, Y.; Hayaishi, O. The Role of Adenosine in the Regulation of Sleep. Curr. Top. Med. Chem. 2011, 11, 1047–1057. [Google Scholar] [CrossRef]
- Benisek, D.; Bailey-Hall, E.; Oken, H.; Masayesva, S.; Arterburn, L. Validation of a simple food frequency questionnaire as an indicator of long chain omega-3 intake. Inform 2002, 96. [Google Scholar]
- West, A.L.; Kindberg, G.M.; Hustvedt, S.O.; Calder, P.C. A novel self-micro-emulsifying delivery system enhances enrichment of eicosapentaenoic acid and docosahexaenoic acid after single and repeated dosing in healthy adults in a randomized trial. J. Nutr. 2018, 148, 1704–1715. [Google Scholar] [CrossRef]
- Parrott, A.C.; Hindmarch, I. Factor analysis of a sleep evaluation questionnaire. Psychol. Med. 1978, 8, 325–329. [Google Scholar] [CrossRef]
- Aldhous, M.E.; Arendt, J. Radioimmunoassay for 6-sulphatoxymelatonin in urine using an iodinated tracer. Ann. Clin. Biochem. 1988, 25, 298–303. [Google Scholar] [CrossRef]
- Shekleton, J.; Parcell, D.L.; Redman, J.R.; Phipps-Nelson, J.; Ponsford, J.; Rajaratnam, S.M. Sleep disturbance and melatonin levels following traumatic brain injury. Neurology 2010, 74, 1732–1738. [Google Scholar] [CrossRef]
- De Almeida, E.A.; Di Mascio, P.; Harumi, T.; Spence, D.W.; Moscovitch, A.; Hardeland, R.; Cardinali, D.P.; Brown, G.M.; Pandi-Perumal, S. Measurement of melatonin in body fluids: Standards, protocols and procedures. Child’s Nerv. Syst. 2011, 27, 879–891. [Google Scholar] [CrossRef] [PubMed]
- Cole, R.J.; Kripke, D.F.; Gruen, W.; Mullaney, D.J.; Gillin, J.C. Automatic sleep/wake identification from wrist activity. Sleep 1992, 15, 461–469. [Google Scholar] [CrossRef] [PubMed]
- Fisk, H.L.; West, A.L.; Childs, C.E.; Burdge, G.C.; Calder, P.C. The use of gas chromatography to analyze compositional changes of fatty acids in rat liver tissue during pregnancy. JoVE 2014, e51445. [Google Scholar] [CrossRef] [PubMed]
- Drton, M.; Plummer, M. A Bayesian information criterion for singular models. J. R. Stat. Soc. Ser. B 2017, 79, 323–380. [Google Scholar] [CrossRef]
- Yehuda, S. Omega-6/omega-3 ratio and brain-related functions. World Rev. Nutr. Diet. 2003, 92, 37–56. [Google Scholar]
- Peuhkuri, K.; Sihvola, N.; Korpela, R. Diet promotes sleep duration and quality. Nutr. Res. 2012, 32, 309–319. [Google Scholar] [CrossRef]
- Paila, Y.D.; Ganguly, S.; Chattopadhyay, A. Metabolic depletion of sphingolipids impairs ligand binding and signaling of human serotonin1A receptors. Biochemistry 2010, 49, 2389–2397. [Google Scholar] [CrossRef]
- Chalon, S. Omega-3 fatty acids and monoamine neurotransmission. Prostaglandins Leukot. Essent. Fat. Acids 2006, 75, 259–269. [Google Scholar] [CrossRef]
- Portas, C.M.; Bjorvatn, B.; Ursin, R. Serotonin and the sleep/wake cycle: Special emphasis on microdialysis studies. Progress Neurobiol. 2000, 60, 13–35. [Google Scholar] [CrossRef]
- Benloucif, S.; Burgess, H.J.; Klerman, E.B.; Lewy, A.J.; Middleton, B.; Murphy, P.J.; Parry, B.L.; Revell, V.L. Measuring melatonin in humans. J. Clin. Sleep Med. 2008, 4, 66–69. [Google Scholar] [CrossRef]
- Feige, B.; Baglioni, C.; Spiegelhalder, K.; Hirscher, V.; Nissen, C.; Riemann, D. The microstructure of sleep in primary insomnia: An overview and extension. Int. J. Psychophysiol. 2013, 89, 171–180. [Google Scholar] [CrossRef] [PubMed]
- Feige, B.; Al-Shajlawi, A.; Nissen, C.; Voderholzer, U.; Hornyak, M.; Spiegelhalder, K.; Kloepfer, C.; Perlis, M.; Riemann, D. Does REM sleep contribute to subjective wake time in primary insomnia? A comparison of polysomnographic and subjective sleep in 100 patients. J. Sleep Res. 2008, 17, 180–190. [Google Scholar] [CrossRef] [PubMed]
- Manconi, M.; Ferri, R.; Sagrada, C.; Punjabi, N.M.; Tettamanzi, E.; Zucconi, M.; Oldani, A.; Castronovo, V.; Ferini-Strambi, L. Measuring the error in sleep estimation in normal subjects and in patients with insomnia. J. Sleep Res. 2010, 19, 478–486. [Google Scholar] [CrossRef] [PubMed]
- Edinger, J.D.; Krystal, A.D. Subtyping primary insomnia: Is sleep state misperception a distinct clinical entity? Sleep Med. Rev. 2003, 7, 203–214. [Google Scholar] [CrossRef] [PubMed]
- Harvey, A.G.; Tang, N.K. (Mis) perception of sleep in insomnia: A puzzle and a resolution. Psychol. Bull. 2012, 138, 77. [Google Scholar] [CrossRef] [PubMed]
- Günther, J.; Schulte, K.; Wenzel, D.; Malinowska, B.; Schlicker, E. Prostaglandins of the E series inhibit monoamine release via EP 3 receptors: Proof with the competitive EP 3 receptor antagonist L-826,266. Naunyn-Schmiedeberg’s Arch. Pharmacol. 2010, 381, 21. [Google Scholar] [CrossRef]
- Monti, J.M. Serotonin control of sleep-wake behavior. Sleep Med. Rev. 2011, 15, 269–281. [Google Scholar] [CrossRef]
- Murphy, R.; Gu, Q.; Marklund, M.; Riserus, U.; Virtanen, J.; Tintle, N.; Wood, A.; Gudnason, V.; Carnethon, M.; Harris, W.; et al. Omega-3 Fatty Acid Biomarkers and Sleep: Pooled Analysis of Prospective Studies in the Fatty Acids and Outcome Research Consortium (FORCE). Curr. Dev. Nutr. 2020, 4, 1460. [Google Scholar] [CrossRef]
- Murphy, R.; Carnethon, M.; Harris, W.; Mello, V.D.; Uusitupa, M.; Tuomilehto, J.; Tuomilehto, H.; Lindberg, E.; Mozaffarian, D.; Gu, Q. Omega-3 and omega-6 Fatty Acid Biomarkers and Sleep Duration: Pooled Analysis from Five Prospective Studies in the Fatty Acids and Outcome Research Consortium (FORCE) (P08-116-19). Curr. Dev. Nutr. 2019, 3. [Google Scholar] [CrossRef]
- Price, A.M.; Wake, M.; Ukoumunne, O.C.; Hiscock, H. Five-year follow-up of harms and benefits of behavioral infant sleep intervention: Randomized trial. Pediatrics 2012, 130, 643–651. [Google Scholar] [CrossRef]
- Ellulu, M.S.; Khaza’ai, H.; Rahmat, A.; Patimah, I.; Abed, Y. Obesity can predict and promote systemic inflammation in healthy adults. Int. J. Cardiol. 2016, 215, 318–324. [Google Scholar] [CrossRef] [PubMed]
- Ferrante, A., Jr. Obesity-induced inflammation: A metabolic dialogue in the language of inflammation. J. Intern. Med. 2007, 262, 408–414. [Google Scholar] [CrossRef] [PubMed]
- Hargens, T.A.; Kaleth, A.S.; Edwards, E.S.; Butner, K.L. Association between sleep disorders, obesity, and exercise: A review. Nat. Sci. Sleep 2013, 5, 27. [Google Scholar] [CrossRef] [PubMed]


| Variable | Treatment | Mean | SD | p |
|---|---|---|---|---|
| n (Males/Females) | Placebo | 8/20 | - | |
| DHA-rich | 7/22 | - | 0.886 | |
| EPA-rich | 8/19 | - | ||
| % of EPA in RBC | Placebo | 0.82 | 0.21 | |
| DHA-rich | 0.89 | 0.28 | 0.169 | |
| EPA-rich | 1.05 | 0.67 | ||
| % of DHA in RBC | Placebo | 4.87 | 0.94 | |
| DHA-rich | 4.74 | 0.92 | 0.637 | |
| EPA-rich | 5.04 | 1.50 | ||
| n-3 index (EPA + DHA) | Placebo | 5.69 | 1.01 | |
| DHA-rich | 5.63 | 1.06 | 0.455 | |
| EPA-rich | 6.10 | 2.00 | ||
| Age (years) | Placebo | 36.89 | 7.78 | |
| DHA-rich | 37.41 | 7.28 | 0.768 | |
| EPA-rich | 35.89 | 8.73 | ||
| Systolic BP (mmHg) | Placebo | 122.80 | 11.19 | |
| DHA-rich | 120.21 | 13.04 | 0.699 | |
| EPA-rich | 120.50 | 13.43 | ||
| Diastolic BP (mmHg) | Placebo | 81.00 | 8.12 | |
| DHA-rich | 79.45 | 9.67 | 0.805 | |
| EPA-rich | 79.81 | 9.82 | ||
| Heart Rate (BPM) | Placebo | 71.70 | 12.36 | |
| DHA-rich | 69.50 | 11.38 | 0.439 | |
| EPA-rich | 73.43 | 10.42 | ||
| Weight (kg) | Placebo | 73.92 | 17.45 | |
| DHA-rich | 70.37 | 12.20 | 0.656 | |
| EPA-rich | 72.11 | 14.40 | ||
| Height (cm) | Placebo | 168.83 | 9.85 | |
| DHA-rich | 166.59 | 6.01 | 0.614 | |
| EPA-rich | 167.65 | 8.48 | ||
| BMI (kg/m2) | Placebo | 25.76 | 4.59 | |
| DHA-rich | 25.36 | 4.24 | 0.936 | |
| EPA-rich | 25.62 | 4.48 | ||
| Years in Education | Placebo | 16.28 | 1.10 | |
| DHA-rich | 15.56 | 1.74 | 0.239 | |
| EPA-rich | 15.96 | 1.61 | ||
| Fruit & Vegetable (portions per day) | Placebo | 4.13 | 1.78 | |
| DHA-rich | 4.48 | 2.21 | 0.359 | |
| EPA-rich | 4.11 | 1.93 | ||
| Alcohol (units per day) | Placebo | 1.00 | 0.71 | |
| DHA-rich | 1.27 | 1.05 | 0.157 | |
| EPA-rich | 1.23 | 0.85 |
| N-3 PUFA Food Source | Treatment | Mean | SD | p |
|---|---|---|---|---|
| Oily fish, servings per month a | Placebo | 1.43 | 1.45 | |
| DHA-rich | 1.79 | 1.55 | 0.522 | |
| EPA-rich | 1.85 | 1.48 | ||
| Fish, servings per month b | Placebo | 2.07 | 1.54 | |
| DHA-rich | 2.05 | 1.76 | 0.834 | |
| EPA-rich | 2.33 | 2.41 | ||
| Fish/shellfish, servings per month c | Placebo | 1.36 | 1.70 | |
| DHA-rich | 1.90 | 1.81 | 0.402 | |
| EPA-rich | 1.39 | 1.50 | ||
| Liver, servings per month d | Placebo | 2.04 | 4.78 | |
| DHA-rich | 0.78 | 1.84 | 0.381 | |
| EPA-rich | 1.93 | 4.12 | ||
| Egg yolks, servings per week | Placebo | 4.11 | 3.62 | |
| DHA-rich | 4.52 | 4.12 | 0.890 | |
| EPA-rich | 4.69 | 5.77 | ||
| Poultry, servings per week | Placebo | 2.93 | 2.36 | |
| DHA-rich | 3.53 | 2.59 | 0.534 | |
| EPA-rich | 2.87 | 2.44 |
| Variable | Treatment | Baseline (n = 80) | Week 26 (n = 70) | Change * (n = 69) |
|---|---|---|---|---|
| % of EPA in RBC | Placebo | 0.82 ± 0.21 | 0.80 ± 0.27 | −0.03 ± 0.19 |
| DHA-rich | 0.88 ± 0.28 | 2.16 ± 0.57 | 1.24 ± 0.57 | |
| EPA-rich | 1.03 ± 0.43 | 2.73 ± 1.02 | 1.68 ± 1.03 | |
| % of DHA in RBC | Placebo | 4.82 ± 0.96 | 4.77 ± 0.82 | 0.03 ± 0.78 |
| DHA-rich | 4.71 ± 0.91 | 7.69 ± 1.31 | 2.94 ± 1.42 | |
| EPA-rich | 5.04 ± 1.48 | 6.12 ± 0.95 | 1.08 ± 1.43 | |
| n-3 index (EPA + DHA) | Placebo | 5.63 ± 1.03 | 5.57 ± 0.95 | −0.00 ± 0.80 |
| DHA-rich | 5.59 ± 1.06 | 9.85 ± 1.64 | 4.18 ± 1.69 | |
| EPA-rich | 6.07 ± 1.94 | 8.85 ± 1.60 | 2.75 ± 2.19 |
| Variable | Treatment | Post-Dose | Main Effects | ||||
|---|---|---|---|---|---|---|---|
| n | Mean | SE | F | p | |||
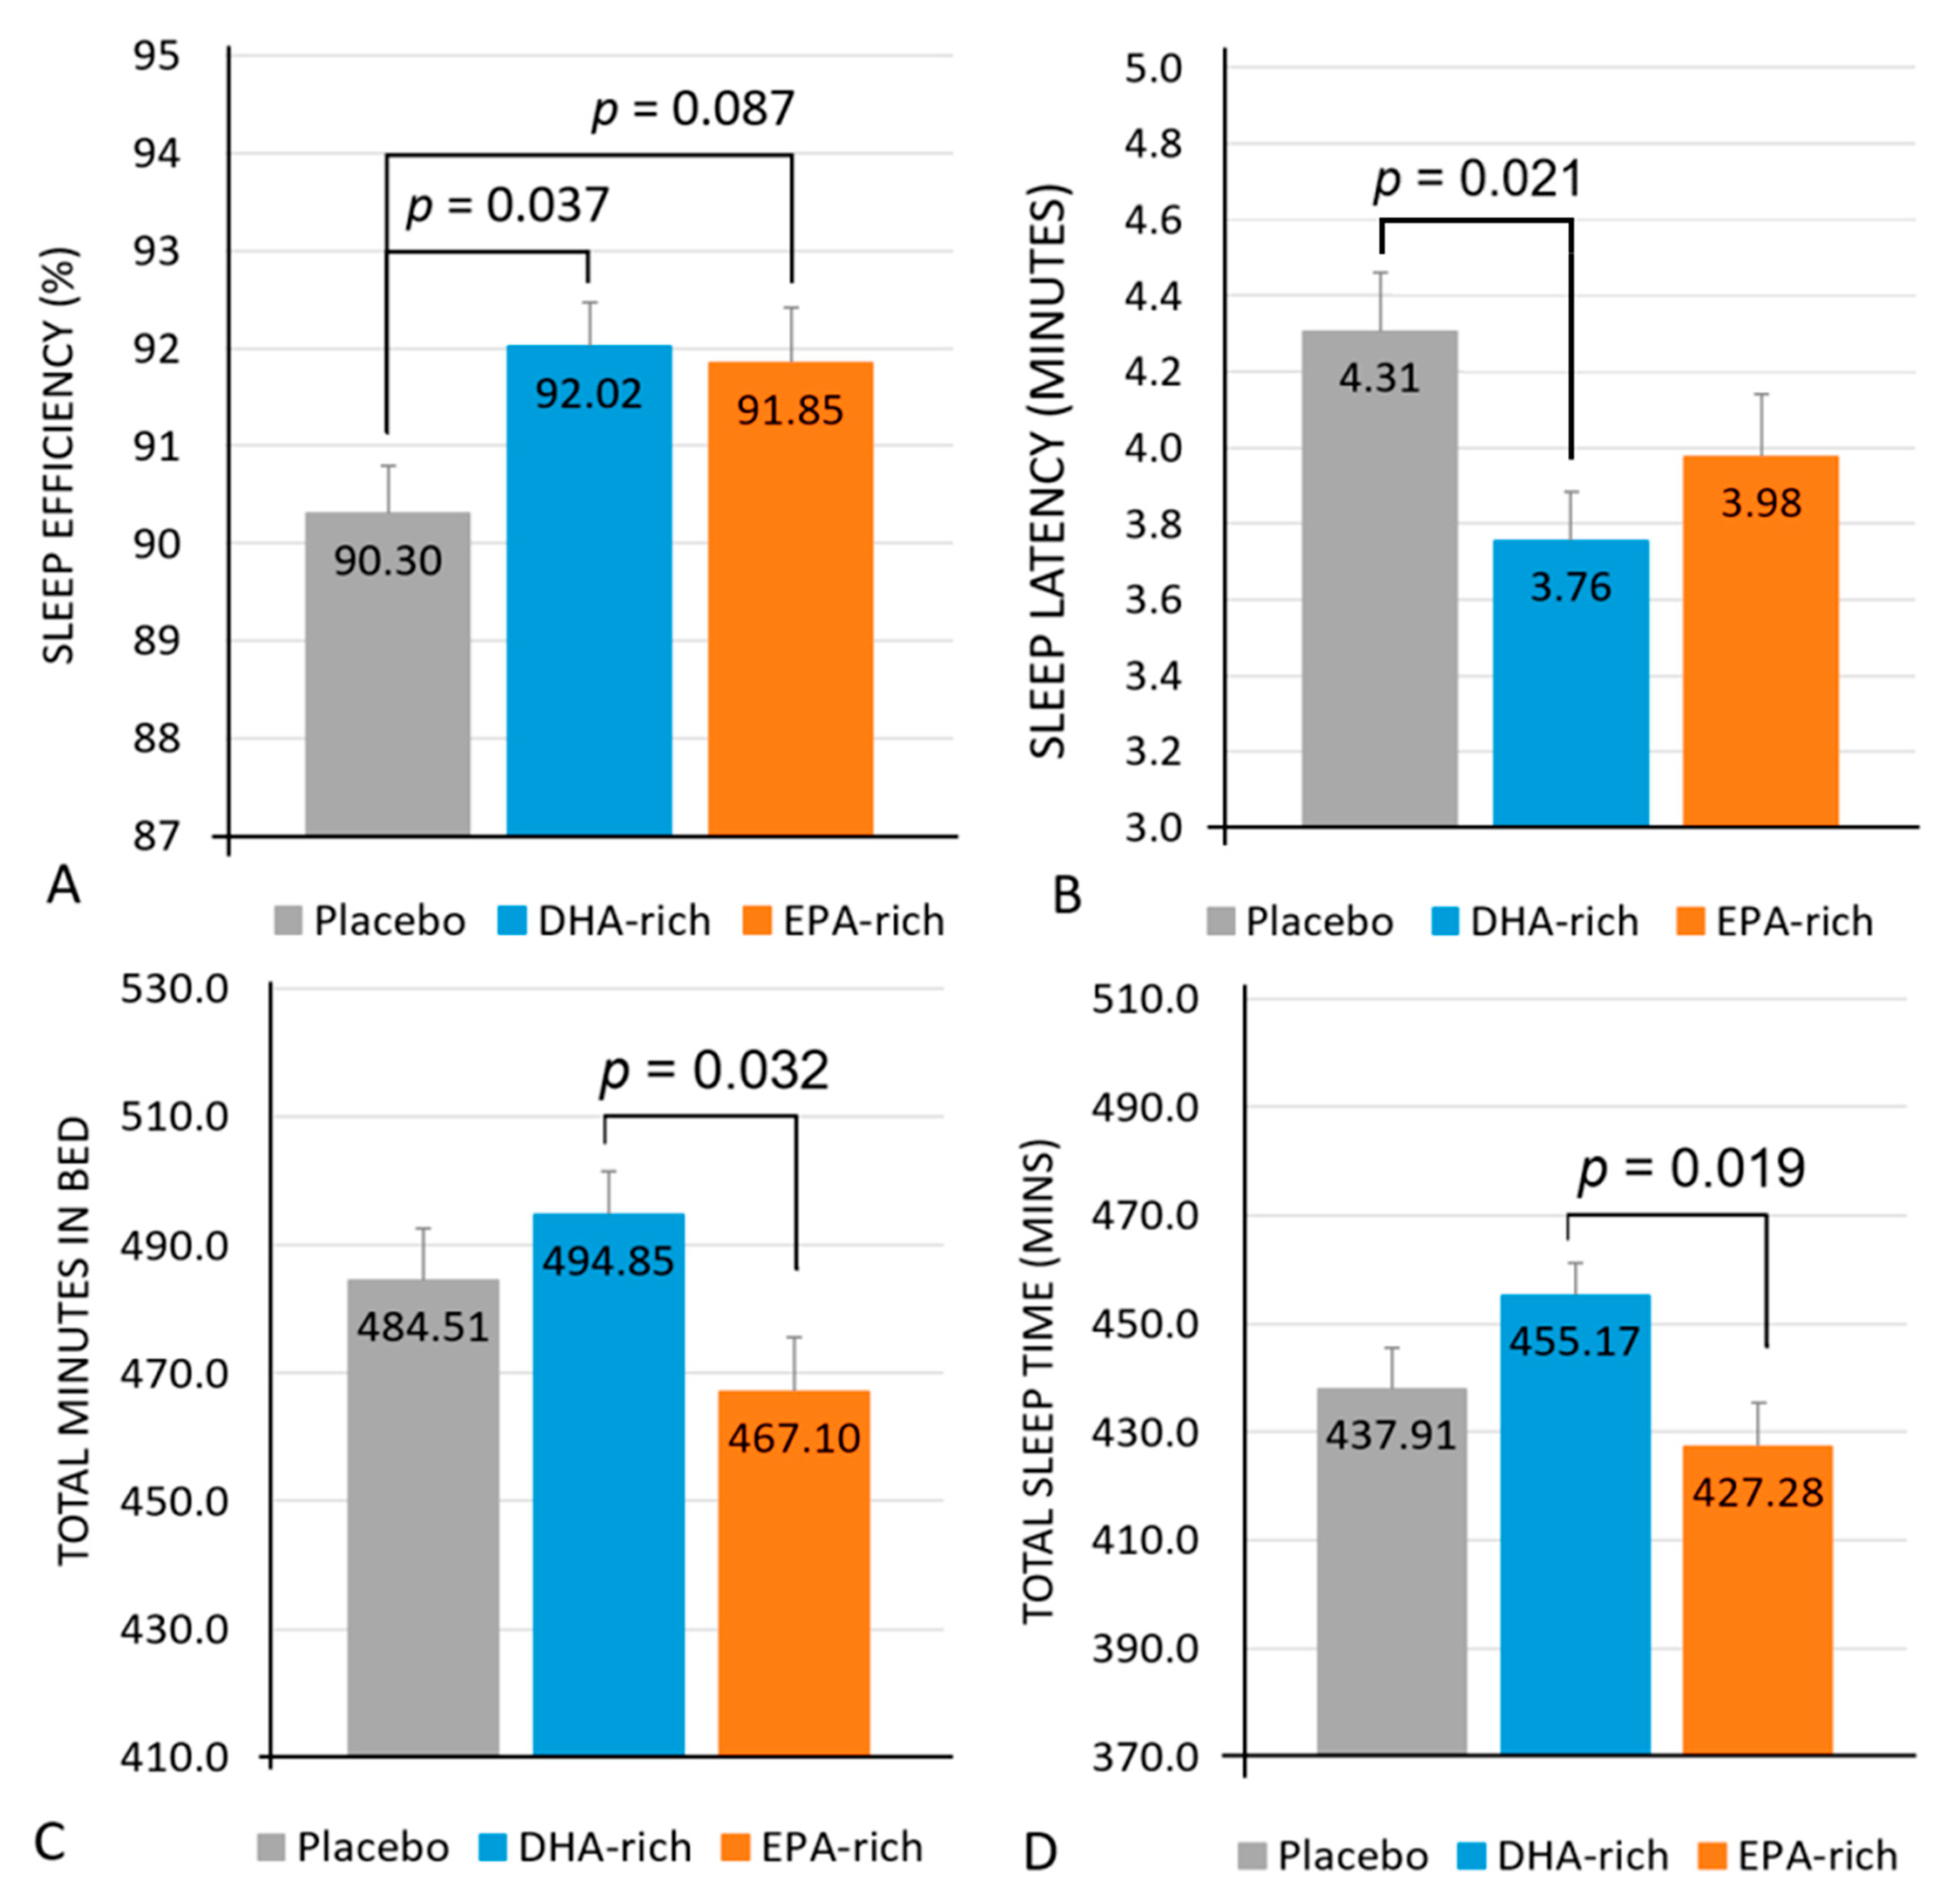
| Latency (minutes) | Placebo | 74 | 4.31 a | 0.21 | Treatment | 3.68 | 0.026 |
| DHA-rich | 3.76 a | 0.26 | |||||
| EPA-rich | 3.98 | 0.27 | Treatment × Night | 2.28 | 0.009 | ||
| Efficiency (%) | Placebo | 72 | 90.30 a,T | 0.50 | Treatment | 3.68 | 0.030 |
| DHA-rich | 92.02 a | 0.49 | |||||
| EPA-rich | 91.85 T | 0.57 | Treatment × Night | 1.47 | 0.138 | ||
| Total Minutes in bed (minutes) | Placebo | 74 | 484.51 | 8.13 | Treatment | 3.29 | 0.039 |
| DHA-rich | 494.85 b | 6.63 | |||||
| EPA-rich | 467.10 b | 8.55 | Treatment × Night | 0.851 | 0.598 | ||
| Total Sleep Time (Minutes) | Placebo | 73 | 437.91 | 7.56 | Treatment | 4.06 | 0.018 |
| DHA-rich | 455.17 b | 6.18 | |||||
| EPA-rich | 427.28 b | 8.08 | Treatment × Night | 1.20 | 0.281 | ||
| Wake after Sleep Onset (minutes) | Placebo | 72 | 42.02 | 2.42 | Treatment | 2.55 | 0.084 |
| DHA-rich | 35.84 | 2.14 | |||||
| EPA-rich | 34.77 | 2.74 | Treatment × Night | 1.29 | 0.225 | ||
| Number of Awakenings | Placebo | 74 | 17.50 | 0.99 | Treatment | 0.813 | 0.446 |
| DHA-rich | 15.87 | 0.88 | |||||
| EPA-rich | 16.20 | 1.08 | Treatment × Night | 1.19 | 0.289 | ||
| Average Awakening Length (minutes) | Placebo | 74 | 2.44 | 0.11 | Treatment | 0.576 | 0.564 |
| DHA-rich | 2.29 | 0.09 | |||||
| EPA-rich | 2.38 | 0.12 | Treatment × Night | 1.50 | 0.126 | ||
| Sleep Fragmentation Index | Placebo | 74 | 22.89 | 1.28 | Treatment | 0.802 | 0.451 |
| DHA-rich | 20.80 | 1.11 | |||||
| EPA-rich | 22.22 | 1.38 | Treatment × Night | 1.90 | 0.036 | ||
| Variable | Treatment | Week 13 | Week 26 | Main Effects | |||||
|---|---|---|---|---|---|---|---|---|---|
| n | Mean | SE | Mean | SE | F | p | |||
| Getting to Sleep (0–300) | Placebo | 86 | 182.49 | 6.69 | 170.63 | 6.69 | Treatment | 0.243 | 0.785 |
| DHA-rich | 177.13 | 7.28 | 177.05 | 6.56 | |||||
| EPA-rich | 176.04 | 7.09 | 167.88 | 6.98 | Treatment × Visit | 0.557 | 0.575 | ||
| Quality of Sleep (0–200) | Placebo | 86 | 118.12 | 6.65 | 112.38 | 6.74 | Treatment | 0.438 | 0.647 |
| DHA-rich | 118.47 | 7.19 | 118.64 | 6.53 | |||||
| EPA-rich | 109.22 | 7.02 | 112.26 | 6.92 | Treatment × Visit | 0.392 | 0.677 | ||
| Awake Following Sleep (0–200) | Placebo | 86 | 107.23 | 6.01 | 113.52 | 6.12 | Treatment | 0.518 | 0.598 |
| DHA-rich | 118.80 | 6.62 | 115.34 | 5.91 | |||||
| EPA-rich | 112.80 | 6.37 | 113.05 | 6.27 | Treatment × Visit | 0.379 | 0.686 | ||
| Behaviour Following Wakening (0–300) | Placebo | 86 | 191.09 | 7.68 | 180.02 | 7.79 | Treatment | 0.814 | 0.447 |
| DHA-rich | 181.98 | 8.38 | 165.39 | 7.57 | |||||
| EPA-rich | 169.66 | 8.20 | 188.93 | 8.09 | Treatment × Visit | 5.03 | 0.009 | ||
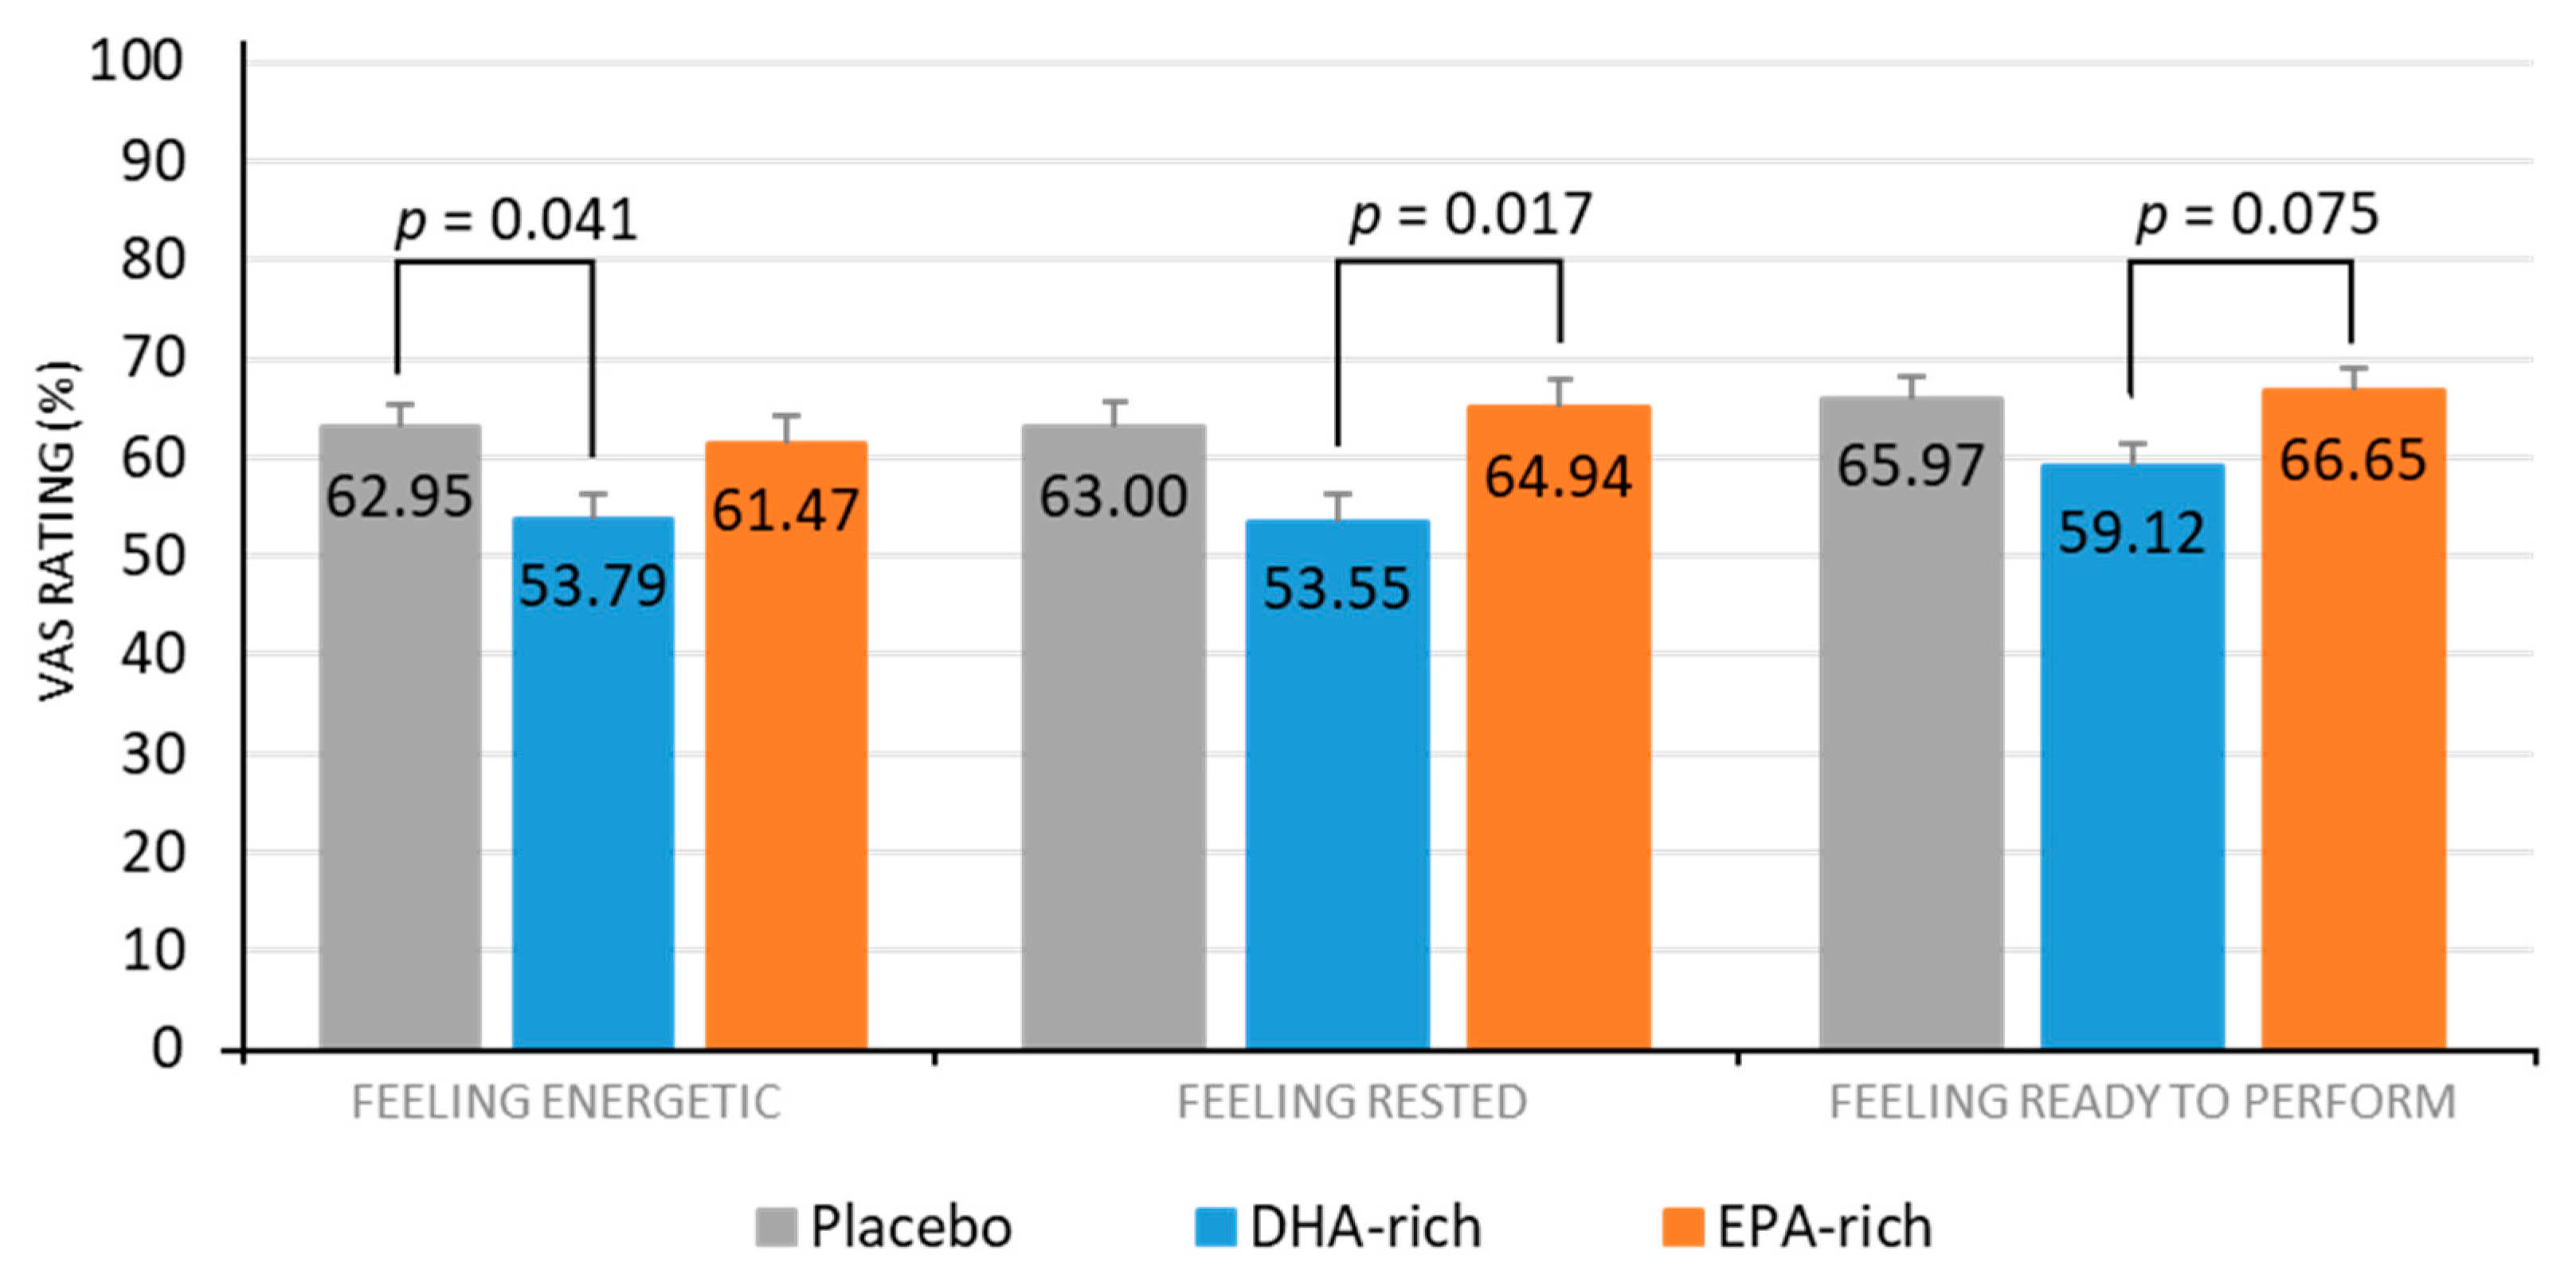
| Rested (%) | Placebo | 86 | 66.21 a | 3.67 | 59.80 | 3.74 | Treatment | 4.71 | 0.012 |
| DHA-rich | 56.44 a | 4.06 | 50.65 | 3.60 | |||||
| EPA-rich | 68.79 | 3.91 | 61.09 | 3.82 | Treatment × Visit | 0.034 | 0.966 | ||
| Energetic (%) | Placebo | 86 | 65.69 a | 3.21 | 60.20 | 3.26 | Treatment | 3.55 | 0.034 |
| DHA-rich | 56.35 a | 3.56 | 51.23 | 3.16 | |||||
| EPA-rich | 60.42 | 3.42 | 62.51 | 3.37 | Treatment × Visit | 1.05 | 0.354 | ||
| Relaxed (%) | Placebo | 86 | 64.87 | 3.21 | 65.82 | 3.26 | Treatment | 1.37 | 0.260 |
| DHA-rich | 61.12 | 3.49 | 58.81 | 3.14 | |||||
| EPA-rich | 65.60 | 3.40 | 65.47 | 3.35 | Treatment × Visit | 0.191 | 0.827 | ||
| Irritable (%) | Placebo | 86 | 26.74 | 3.70 | 27.70 | 3.77 | Treatment | 1.46 | 0.238 |
| DHA-rich | 31.95 | 4.09 | 35.10 | 3.64 | |||||
| EPA-rich | 28.70 | 3.92 | 27.25 | 3.85 | Treatment × Visit | 0.196 | 0.822 | ||
| Ready to Perform (%) | Placebo | 86 | 65.70 | 2.81 | 66.23 | 2.86 | Treatment | 3.21 | 0.045 |
| DHA-rich | 61.56 b | 3.08 | 56.68 | 2.76 | |||||
| EPA-rich | 66.88 b | 2.98 | 66.43 | 2.92 | Treatment × Visit | 0.668 | 0.515 | ||
| Good Night’s Sleep (%) | Placebo | 86 | 65.88 | 4.30 | 59.53 | 4.38 | Treatment | 1.61 | 0.205 |
| DHA-rich | 63.06 | 4.72 | 50.85 | 4.23 | |||||
| EPA-rich | 68.37 | 4.54 | 62.69 | 4.45 | Treatment × Visit | 0.392 | 0.677 | ||
| Variable | Treatment | Post-Treatment | Main Effects | ||||
|---|---|---|---|---|---|---|---|
| n | Mean | SE | F | p | |||
| Total aMT6s (ng) | Placebo | 67 | 15,289.27 | 1,267.50 | |||
| DHA-rich | 15,335.89 | 1,267.88 | Treatment | 0.558 | 0.575 | ||
| EPA-rich | 13,585.56 | 1,346.06 | |||||
| Bedtime aMT6s (ng) | Placebo | 60 | 563.98 | 120.67 | |||
| DHA-rich | 468.62 | 123.42 | Treatment | 2.12 | 0.130 | ||
| EPA-rich | 805.34 | 117.08 | |||||
Publisher’s Note: MDPI stays neutral with regard to jurisdictional claims in published maps and institutional affiliations. |
© 2021 by the authors. Licensee MDPI, Basel, Switzerland. This article is an open access article distributed under the terms and conditions of the Creative Commons Attribution (CC BY) license (http://creativecommons.org/licenses/by/4.0/).
Share and Cite
Patan, M.J.; Kennedy, D.O.; Husberg, C.; Hustvedt, S.O.; Calder, P.C.; Middleton, B.; Khan, J.; Forster, J.; Jackson, P.A. Differential Effects of DHA- and EPA-Rich Oils on Sleep in Healthy Young Adults: A Randomized Controlled Trial. Nutrients 2021, 13, 248. https://doi.org/10.3390/nu13010248
Patan MJ, Kennedy DO, Husberg C, Hustvedt SO, Calder PC, Middleton B, Khan J, Forster J, Jackson PA. Differential Effects of DHA- and EPA-Rich Oils on Sleep in Healthy Young Adults: A Randomized Controlled Trial. Nutrients. 2021; 13(1):248. https://doi.org/10.3390/nu13010248
Chicago/Turabian StylePatan, Michael J., David O. Kennedy, Cathrine Husberg, Svein Olaf Hustvedt, Philip C. Calder, Benita Middleton, Julie Khan, Joanne Forster, and Philippa A. Jackson. 2021. "Differential Effects of DHA- and EPA-Rich Oils on Sleep in Healthy Young Adults: A Randomized Controlled Trial" Nutrients 13, no. 1: 248. https://doi.org/10.3390/nu13010248
APA StylePatan, M. J., Kennedy, D. O., Husberg, C., Hustvedt, S. O., Calder, P. C., Middleton, B., Khan, J., Forster, J., & Jackson, P. A. (2021). Differential Effects of DHA- and EPA-Rich Oils on Sleep in Healthy Young Adults: A Randomized Controlled Trial. Nutrients, 13(1), 248. https://doi.org/10.3390/nu13010248