Abstract
Consumption of trans fatty acids (TFAs) has been unequivocally linked to several adverse health effects, with the increased risk of cardiovascular disease being one of the most well understood. To reduce TFA-related morbidity and mortality, several countries have imposed voluntary or mandatory measures to minimize the content of industrial TFAs (iTFAs) in the food supply. In 2018, Slovenia introduced a ban on iTFAs on top of preceding voluntary calls to industry to reduce its use of partially hydrogenated oils (PHOs) as the main source of iTFAs. To investigate the consumption of TFAs, data available from the nationally representative dietary survey SI.Menu were analyzed. The survey consisted of two 24-h non-consecutive day recalls from 1248 study participants from three age groups (10–17, 18–64, 65–74 years old), combined with socio-demographic, socio-economic, and lifestyle parameters. The analyses demonstrated that, on average, TFAs accounted for 0.38–0.50% of total energy intake (TEI). However, 13% of adolescents, 29.4% of adults, and 41.8% of the elderly population still consumed more than 0.50% TEI with TFAs. The main sources of TFAs in the diet were naturally present TFAs from butter, meat dishes, and meat products, regardless of the age group. Results indicate that following the reformulation activities, the major sources of TFAs in the diets of the Slovenian population now represent foods which are natural sources of TFAs.
1. Introduction
Trans fatty acids (TFAs) are fatty acid isomers with one or more double bonds in trans instead of cis configuration. TFAs can be produced in the process of industrial partial hydrogenation of unsaturated fats (i.e., vegetable oils), which was the previously used method for production of margarine and shortening, or can occur naturally as a result of bacterial biohydrogenation of unsaturated fatty acids in rumen and can therefore be found in meat, milk, and dairy products from ruminants [1].
The intake of industrially produced TFAs (iTFAs) has been found to negatively influence blood cholesterol profile, increase triglycerides [2], stimulate inflammatory responses [3], and increase mortality, particularly from coronary heart disease (CHD) [4]. According to a meta-analysis of four prospective cohort studies, with every 2% of total daily energy gained from TFAs, coronary heart disease incidence increases by 23% [1]. A substantial body of scientific evidence on adverse health effects of iTFAs has led public health organizations to establish a recommendation of an upper tolerable limit for TFA intake at 1% of total energy intake (TEI), although, according to Ref. [5], “the intake should be as low as possible”. The intake of TFAs has also been recognized as a key risk parameter in the Global Burden of Disease Study [6], in which optimal daily TFA intake (taking into account TFAs from all sources) was set at 0.5% of TEI or below. Moreover, the WHO’s action package called “REPLACE”, released in 2018, aimed to completely eliminate iTFAs from the global food supply by 2023 [7].
As one of the first countries to recognize iTFAs as a major public health threat, Denmark set a maximum limit of 2 g TFAs per 100 g of total fat in foods in 2004 [8]. The policy successfully reduced the amount of iTFAs present in the food supply, while, as a result of the action, the cardiovascular mortality rate also declined sharply [9]. By the end of 2018, similar legislation was introduced in 22 other countries, including Switzerland, Austria, Iceland, Hungary, and Norway [10,11]. In Slovenia, a ban on TFAs was introduced in March 2018 with the transitional period of one year [12], although the use of partially hydrogenated oils (PHOs) in Slovenian food supply had already decreased substantially between 2015 and 2017 [13]. During this period, TFAs were a subject of numerous media reports, putting pressure on the food industry to reformulate products containing PHOs [13]. In 2017, the only remaining categories of pre-packaged foods with a notable proportion of items containing PHOs were cakes, muffins, pastries, and biscuits [13]. Expected intake of iTFAs in the general population was therefore low, except for specific population groups, such as regular consumers of cakes, muffins, pastries, and biscuits of certain brands, which were high in iTFAs.
In 2010, reported estimated intakes of TFAs varied from 0.2 to 6.5% TEI across different countries worldwide, with the intakes being higher at younger ages. The estimated mean intake of total TFAs in Slovenian adults was approximately 1% TEI [14]. The objective of our study was to access current mean daily TFA intake levels using data collected within the Slovenian national dietary survey SI.Menu 2017/2018, and to identify major sources of TFAs in people’s diets.
2. Material and Methods
2.1. Study Design and Subjects
The data on food intake was obtained during the cross-sectional Slovenian national food consumption survey, SI.Menu 2017/2018, between March 2017 and April 2018, following the European Food Safety Authority (EFSA) Guidance on European Union (EU) Menu Methodology [15]. Methodology and sample characteristics are described in detail elsewhere [16]. In short, 2280 Slovenian residents aged 10–74 years were selected randomly, using the Central Register of Population of Slovenia. All selected participants received an invitation letter with all the information regarding the study and were later visited by the study interviewers who confirmed the eligibility of the participants and collected information from the respondents by interviews. A total of 62.2% of all invited participants joined the survey.
The study design was approved by the National Medical Ethics Committee (KME 53/07/16; approval No. 0120-337/2016 issued on 19.7.2016). Before enrolment in the survey, all participants were asked to sign written informed consent. If a participant was 18 years of age or younger, written consent was signed by the parent(s) or legal guardian(s).
2.2. Food Consumption Data
2.2.1. General Questionnaire and Anthropometric Measurements
During the first interviewer’s visit, the participants filled in a general questionnaire, which assessed general socio-demographic and socio-economic determinants such as number of household members, marital status, level of education, monthly net income of the household, as well as habitual frequency and duration of physical activity. For the purpose of this study, the latter was subsequently converted into the International Physical Activity Questionnaire (IPAQ) score [17]. During the first interview, participants’ body mass and body height were assessed by the interviewer using portable calibrated scales. Body mass index (BMI; kg/m2) was determined with the cut-off point for overweightness set at 25 kg/m2, except for adolescents, where gender/age adjusted cut-off points (>1SD) were applied [18,19].
2.2.2. 24-h Dietary Recalls
Assessment of dietary intake was performed using a two 24-h dietary recall method. The two recalls were carried out on the same day of the week one to three weeks apart and took place at the participant’s home. To obtain a sample that would take into consideration the variations in dietary habits between working and weekend days, 71% of the recalls were performed on work days and 29% on weekends. Altogether, 87% of the recalls were repeated within 7 days after the first recall, while the rest were completed within the next two weeks. The recall was structured to follow a daily meal timeline to help the participants systematically recollect foods and beverages consumed during the previous day. To better estimate the portion sizes of reported foods, a nationally adjusted booklet containing 46 pictures of different food products or simple recipes was developed especially for this purpose. Each food product was presented in 6 different portion sizes to help interviewers and participants determine the quantity of the ingested dish. A picture book was validated according to the method of conceptualization in May 2015 at Biotechnical Faculty, University of Ljubljana, Slovenia [16].
Data from the recalls were collected using an application that was based on the Open Platform for Clinical Nutrition (OPEN), developed by the Jozef Stefan Institute (Ljubljana, Slovenia) for the purpose of SI.Menu survey. The OPEN app is an extension of the Slovenian food composition database [20], which includes data on generic and branded foods and provides a list of ingredients for traditional and other recipes frequently consumed in Slovenia. Missing data were completed with data from other European (EuroFIR) and United States Department of Agriculture (USDA) food composition databases [21].
2.3. Assessment of TFA Content
Energy and nutrient content of all reported foods and beverages was calculated based on the data available on the national platform for clinical nutrition, called the Open Platform for Clinical Nutrition (OPEN) [20]. Missing data for TFA content were extracted from the previously established database [22], which was compiled by analytical assessment of foods from Slovenian food. In the OPEN database, the energy value of foods and beverages is calculated based on macronutrients, alcohol, and dietary fiber content, using an approach provided in the EU Regulation 1169/2011 on the provision of food information to consumers [23]. When information on dietary fiber content was available, total energy value was calculated as total available energy using established conversion factors for the calculation of energy (i.e., 17 kJ per g of digestible carbohydrates and protein, 37 kJ per g of fat, and 8 kJ per g of dietary fiber) [23]. In certain foods and beverages, in which a very low content of dietary fiber was expected, total energy content was calculated as 17 kJ per g of total carbohydrates. To enable accurate nutrient profile formation for more complex foods and dishes, a disaggregation method was applied based on the recipes provided by the subjects, when applicable, or traditional recipes collected in OPKP, considering both the yield and retention factors [20]. To differentiate between pre-packaged and non-packaged foods, each food/beverage item was assigned as branded or non-branded. For the purpose of the statistical analyses in this study, each reported food was allotted to one of 17 predefined categories, which were further divided into 96 subcategories. The categorization system was adapted from Dunford et al. [24], with the additional subcategories added only for non-packaged and home-cooked foods.
2.4. Final Sample for Data Analyses
Inclusion and exclusion criteria as well as exclusion of under- and over-reporters in SI.Menu study were previously described [25]. In short, 97 participants were excluded before the final analyses due to incomplete anthropometric data (n = 12), incomplete 24-h recall data (n = 36), or under- and over-reporting (n = 49). The final sample consisted of 1248 subjects: 468 adolescents (mean age 13.4 ± 2.37), 364 adults (mean age 43.6 ± 13.81), and 416 elderly (mean age 68.7 ± 2.7). Under- and over-reporting cut-off points were calculated by Goldberg method [26], considering adaption by Black et al. [27]. Basic metabolic rate (BMR) was calculated based on gender, age, body height, and body mass using the method described by Harris et al. [28] and adapted by Roza and Shizgal [29].
2.5. Statistical Analyses
All analyzed participants completed both 24-h recalls and provided answers to the survey questionnaire. The energy- and TFA-intake estimates for each of the two recalls and per each of the three age categories were normalized using log transformation method. The TFA estimates were further energy adjusted using nutrient residual method [30]. As the 24h recalls measured only short-term consumption patterns, both recalls were combined to estimate the habitual TFA consumption using the multiple source method (MSM) [31]. The algorithm of the MSM method was used to estimate an average TFA intake adjusted for interpersonal variance under the assumption that all survey participants are habitual consumers of TFAs. The data referring to the national representative sample was weighted using the iterative proportional fitting method [32] based on the census data from 2017 to produce representative results according to age, gender, and region of living.
Descriptive statistics for age cohorts and for different socio-demographic-, anthropometric-, and individual-based variables within each age group are shown as frequencies and proportions, or medians and means with standard deviations (SD). Multiple linear and logistic regression models for all three age cohorts were undertaken separately to assess the significant differences between different sub-populations in terms of TFA consumption based on TEI. The unadjusted means of TFA in % TEI were determined by gender, region, BMI, and IPAQ levels for all age groups, education, income for adults and elderly, and employment status for adults only. The prevalence of consumption of more than 0.5% TEI in TFAs was adjusted for socio-demographic, anthropometric, and lifestyle parameters. The logistic regression analysis was used to determine independent predictors for TFA intake greater than 0.5% of TEI with a maximum likelihood as the estimation method for the model parameters. Odds ratios (ORs) with 95% confidence intervals (CIs) were used as a measure of association with exposure to more than 0.5% TEI from TFA. Statistical significance was set at p < 0.05. All analyses were performed using STATA version 15.1 (StataCorp LLC, Coledge Station, TX, USA).
3. Results
Considering the study sampling design, we estimated dietary intakes of TFAs in the Slovenian population separately for adolescents, adults, and the elderly (Table 1). Estimates were done for both the amount of consumed TFAs daily (0.68 g, 0.77 g, and 0.89 g, respectively) and for total energy intake (TEI) from TFAs (0.38–0.50%), which is particularly relevant and was therefore used for statistical analyses and modelling. In adolescents, the TFAs represented on average 0.38% (CI: 0.35–0.39) of TEI. The percentage was marginally higher in adults, where 0.42% (CI: 0.40–0.45) of TEI came from TFAs and was the highest in the elderly, whose consumption of TFAs accounted for 0.5% (CI: 0.47–0.53) of TEI (Table 1, Figure 1).

Table 1.
Population-weighted trans fatty acid (TFA) intake (g/day) and prevalence of total energy intake (TEI) from TFAs > 0.5%/1.0% daily (95% CI), both cumulative and according to gender.
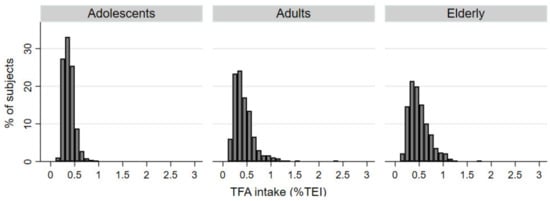
Figure 1.
Histograms of daily dietary intake of total trans fatty acids (TFAs) expressed in percentage of total energy intake (%TEI) in adolescents, adults, and elderly populations.
On average, women consumed significantly higher % of TEI with TFAs compared to men, regardless of their age. A significant difference was observed in adults with different BMI, with higher TFA consumption recorded in overweight and obese individuals, as compared to those with normal BMI. In the adjusted analysis, there were no other significant differences in TFA consumption in other socio-demographic variables, including region, education, family net income, IPAQ score, or employment status (Table 2).
Table 2.
Adjusted mean (95% CI) levels of trans fatty acid (TFA; % TEI) intake by gender, region, body mass index (BMI), international physical activity questionnaire (IPAQ) score, education, income, and employment for different age groups.
Additional analyses demonstrated that 13% adolescents, 29.4% adults, and 41.8% of the elderly population consume more than 0.5% TEI with TFAs. Odds for exceeding 0.5% TEI coming from TFAs were significantly higher among adolescent girls and elderly women compared to men. Although not significant, a notable gender-related pattern was observed among adults as well. None of the remaining variables significantly influenced the prevalence exceeding the 0.5% TEI limit (Table 3).
Table 3.
Percentage of the population exceeding 0.5% of total energy intake (TEI) from trans fatty acid (TFA) intake by sex, place of living, education, family net income, body mass index (BMI), international physical activity questionnaire (IPAQ) score, and employment.
Major sources of TFAs among Slovenian adolescents were butter (14.8%), bread (11.8%), meat dishes (10.9%), and processed meat (10.4%). Biscuits (7.7%), cakes, muffins, and pastry (6.9%), soups (6.6%), and ice cream and edible ices (5.8%), were also notable sources of TFAs among the youth. The majority of TFA intake among adults came from meat dishes (22%) and processed meat (12.8%), but also bread (11.1%), butter (10%), and soups (8.3%). In the elderly, butter was the predominant source of TFAs (24.5%), followed by meat dishes (17.4%), bread (12.4%), processed meat (10.6%), and soups (7.3%) (Figure 2).
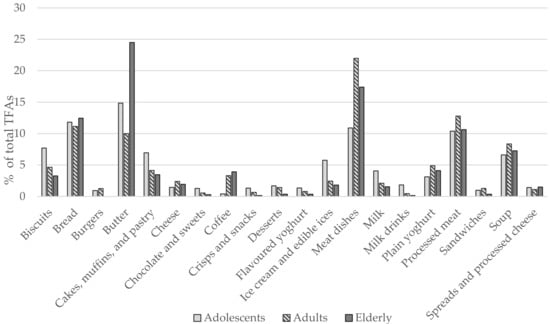
Figure 2.
Relative contribution of food categories to trans fatty acid (TFA) intake among different age groups (% of total TFAs intake). Note: “Coffee” category also includes coffee drinks that can contain milk or cream.
4. Discussion
With an average value between 0.38 and 0.50% TEI, total intake of TFAs in Slovenia in 2017/2018 was much lower than the estimate of Micha et al. for 2010 [14] and also lower than WHO recommendations [5] of up to 1% TEI. Worldwide analyses of dietary risks among 195 countries demonstrated that in 2017, TFA intake in Central and Western European countries averaged at around 0.4% TEI [6], which is comparable with the TFAs intakes estimated in our study. Much higher intakes were, on the other hand, reported from high-income North America and certain Latin American countries [6].
Several studies have reported a decreasing consumption of TFAs during the last decades due to active public campaigns as well as voluntary or mandatory measures following the cumulative evidence on the adverse health effects of iTFA consumption [33,34,35]. However, in 2016, Stender and colleagues [36] published a market basket investigation, in which they reported a 3-fold increase in the availability of biscuits containing PHOs in Slovenia between 2012 and 2014. Our subsequent studies demonstrated that by 2017, the proportion of pre-packaged foods containing PHOs had already dropped significantly [13]. The highest proportion of TFA-containing items was found among biscuits, for which additional analyses demonstrated that they would exceed EU regulatory TFA limits in 69% of cases among PHO-containing products [22]. However, the present study revealed that biscuits account only for approximately 7% of all TFAs consumed, which can be either of industrial or natural sources.
Even though we were unable to differentiate between industrially produced and naturally present TFAs, due to limited data about the food composition, relative contribution of different food categories demonstrated that a great proportion of TFAs in Slovenia were consumed in the form of vaccenic acid, a natural TFA found in dairy and beef products. While some evidence suggests that both industrial and ruminant TFAs show similar effects on composition of plasma lipoproteins [2,37], the topic remains controversial [38,39,40,41,42]. Their chemical structure is indeed different and some evidence suggests that compared to ruminant vaccenic acid, iTFAs have much higher potency for promoting inflammation, endoplasmic reticulum stress, and cholesterol synthesis [43]. Nevertheless, the intake of TFAs of animal origin are generally well below the recommended 1% TEI, which greatly limits their possible impact on cardiovascular disease risk. The major sources of naturally present TFAs in Slovenia were butter, meat dishes, and processed meat, which jointly contributed on average 36% of all TFAs consumed among adolescents and up to 53% in the elderly. Especially due to high butter consumption, the intake of TFAs is the highest among elderly Slovenians, which is in contrast to the findings of Micha and colleagues [14], whose systematic analysis showed TFA intake tended to be higher among younger participants. The observed discrepancy most likely results from a shift from artificial towards predominantly natural dietary sources of TFAs, due to the diminished use of PHOs. Adolescents tend to consume more biscuits and other foods which used to be high in iTFAs, while adults and the elderly consume more meat and butter, which now represent the predominant sources of TFAs.
Successful elimination of iTFAs from the food supply is a significant advancement in cardiovascular disease prevention, although concerns have been voiced whether TFAs in processed foods might not necessarily be replaced by healthier alternatives, such as mono- and polyunsaturated vegetable oils [44,45]. Replacement of iTFAs with another solid fat could concomitantly increase the intake of saturated fats, which would hamper the efforts to lower their intake. However, studies from the U.S. and Canada showed that a decrease in TFA content in the food supply was not accompanied by an increase in saturated fat content [46,47]. Whether similar trends took place in Europe and other parts of the world has not been investigated yet. Furthermore, an overview of identified food sources of TFAs in the Slovenian population highlighted that further reduction of TFA intake would be only possible with reduced intake of foods, which are natural sources of TFAs, particularly meat, butter and dairy products. Regarding this is should be noted, that some evidence also suggests some possible beneficial effects of specific types of TFAs, which are naturally present in these foods, such as trans vaccenic acid [38,39,40,41,42].
The strengths of this study are in the nationally representative sample for Slovenia (aged 10–74 years), the use of a robust methodological approach, and the fact that the actual data about TFA levels for many foods were available, as they had been collected within the “Trans fats in foods” project [48]. An additional strength of the present study is that we did not only estimate TFAs intakes but also investigated lifestyle and socio-demographic parameters, which might be associated with TFA intakes. However, there are also some important limitations that should be noted. Namely, data collection with two 24 h recalls can result in misreporting and has limited accuracy [49], but other methodological approaches also have considerable limitations. To minimize errors, interviewers were trained to have participants recollect all ingested foods and drinks and corresponding portion sizes as accurately as possible. The remaining under- and over-reporting errors were corrected for during data analyses. Alternatively, using blood biomarkers of TFA plasma levels could increase the precision of TFA intake estimates in the population, but such an approach would not reveal the major dietary sources of TFAs. A limitation of the present study is the quantification of only total TFA intake, due to difficult distinctions between industrial and naturally present TFAs in complex food products. However, the reported adverse health effects tend to be similar for both TFA sources [50] and therefore the used approach should be equally relevant. Another limitation comes from assessing TFA content in foods. Relying on data from food composition databases can introduce errors, as the data can be incomplete, especially when it comes to specific food constituents, such as TFAs. To decrease the magnitude of error, products known to contain the largest amounts of iTFAs had had their TFA content determined analytically in one of our preceding studies [22]. We should also note that the used methodological approach does not enable us to evaluate variability in food consumption and identification of specific risk scenarios, such as TFA intakes in brand-loyal consumers of PHO-containing biscuits and cakes, for which the probabilistic exposure assessment would be an appropriate method.
5. Conclusions
In last decade, the intake of TFAs in Slovenia has dropped under 0.5% of TEI, with butter and meat products becoming a predominant source of TFAs consumed. With additional mandatory restrictions on the use of PHOs in foods in place, more vulnerable specific consumer groups are now also protected. Further reduction of TFA intakes would be only possible with considerable changes in dietary patterns towards less full-fat dairy and high-fat meats, however, a complete elimination of TFAs is not feasible within the scope of a balanced omnivorous diet.
Author Contributions
N.Z. performed the data analyses and wrote the manuscript; B.K.S. was responsible for information technology, and H.H. for the preparation of the database and for data analyses. M.H. conducted food-matching to estimate TFA levels. A.K., K.Ž., Ž.L. and R.V. collaborated in data collection and assessment for determination of TFA content. M.G. and U.B. were responsible for SI.Menu study design and food consumption data. P.G. was responsible for planning anthropometric measurements and physical activity in the SI.Menu study. I.P. was responsible for assuring the set-up and funding of the study, prepared the study design, collaborated in the data analyses, and reviewed the manuscript. K.Ž. made a revision of the final draft and prepared the submission. All authors reviewed the manuscript and agreed to the published version of the manuscript.
Funding
This study was conducted as a part of the research project L3-7538 “The content of trans fats in foods and population intakes”, which was funded by the Slovenian Research Agency and Ministry of Health of Republic of Slovenia, and research program P3-0395 “Nutrition and Public Health”, funded by the Slovenian Research Agency. The original SI.Menu 2017/18 national food consumption survey was funded by the European Food Safety Authority (EFSA contract No. OC/EFSA/DATA/2014/02-LOT2-CT03), Ministry of Health of the Republic of Slovenia, and Slovenian Research Agency.
Institutional Review Board Statement
The study was conducted according to the guidelines of the Declaration of Helsinki, and approved by the National Medical Ethics Committee, Ljubljana, Slovenia (KME 53/07/16; approval No. 0120-337/2016 issued on 19.7.2016).
Informed Consent Statement
Informed consent was obtained from all subjects involved in the study.
Data Availability Statement
The data presented in this study are available on request from the corresponding author.
Acknowledgments
We acknowledge support of all SI.Menu project partners and their researchers, particularly Nataša Delfar, Metka Zaletel, Darja Lavtar, Ada Hočevar Grom, and Ivan Eržen (National Institute of Public Health, Ljubljana, Slovenia); the Department of Food Science at Biotechnical Faculty and Group of Anthropology at Biotechnical Faculty of University of Ljubljana (Slovenia); Stojan Kostanjevec (University of Ljubljana, Faculty of Education, Ljubljana, Slovenia; Majda Pajnkihar (University of Maribor, Faculty of Health Sciences, Maribor, Slovenia); Tamara Poklar Vatovec (University of Primorska, Faculty of Health Sciences, Koper, Slovenia); Eva Valenčič (Jožef Stefan Institute, Ljubljana, Slovenia); and Evgen Benedik (University Medical Centre Ljubljana, University Children’ s Hospital, Ljubljana, Slovenia). We also acknowledge support of Veronika Belec and her team and interviewers at GfK Research Institute (Slovenia) for conducting the survey field work.
Conflicts of Interest
The authors declare no conflict of interests. The funders had no role in the design of the study; in the collection, analyses, or interpretation of data; in the writing of the manuscript; or in the decision to publish the results. I.P. has led and participated in various other research projects in the area of nutrition, public health, and food technology, which were (co)funded by the Slovenian Research Agency, Ministry of Health of the Republic of Slovenia, the Ministry of Agriculture, Forestry and Food of the Republic of Slovenia, and in case of specific applied research projects, also by food businesses. I.P., M.G., and U.B. are members of a workgroup for food reformulation at Ministry of Health of Republic of Slovenia.
References
- Mozaffarian, D.; Katan, M.B.; Ascherio, A.; Stampfer, M.J.; Willett, W.C. Trans fatty acids and cardiovascular disease. N. Engl. J. Med. 2006, 354, 1601–1613. [Google Scholar] [CrossRef] [PubMed]
- Brouwer, I.A.; Wanders, A.J.; Katan, M.B. Effect of animal and industrial trans fatty acids on HDL and LDL cholesterol levels in humans—A quantitative review. PLoS ONE 2010, 5, e9434. [Google Scholar] [CrossRef]
- Mozaffarian, D. Trans fatty acids—Effects on systemic inflammation and endothelial function. Atheroscler. Suppl. 2006, 7, 29–32. [Google Scholar] [CrossRef] [PubMed]
- De Souza, R.J.; Mente, A.; Maroleanu, A.; Cozma, A.I.; Ha, V.; Kishibe, T.; Uleryk, E.; Budylowski, P.; Schünemann, H.; Beyene, J. Intake of saturated and trans unsaturated fatty acids and risk of all cause mortality, cardiovascular disease, and type 2 diabetes: Systematic review and meta-analysis of observational studies. BMJ 2015, 351, h3978. [Google Scholar] [CrossRef] [PubMed]
- World Health Organization. European Food and Nutrition Action Plan 2015–2020; World Health Organization: Copenhagen, Denmark, 2015; Available online: https://www.euro.who.int/__data/assets/pdf_file/0008/253727/64wd14e_FoodNutAP_140426.pdf?ua=1 (accessed on 28 December 2020).
- Afshin, A.; Sur, P.J.; Fay, K.A.; Cornaby, L.; Ferrara, G.; Salama, J.S.; Mullany, E.C.; Abate, K.H.; Abbafati, C.; Abebe, Z. Health effects of dietary risks in 195 countries, 1990–2017: A systematic analysis for the Global Burden of Disease Study 2017. Lancet 2019, 393, 1958–1972. [Google Scholar] [CrossRef]
- Ghebreyesus, T.A.; Frieden, T.R. REPLACE: A roadmap to make the world trans fat free by 2023. Lancet 2018, 391, 1978–1980. [Google Scholar] [CrossRef]
- L’Abbé, M.R.; Stender, S.; Skeaff, C.M.; Ghafoorunissa, R.; Tavella, M. Approaches to removing trans fats from the food supply in industrialized and developing countries. Eur. J. Clin. Nutr. 2009, 63, S50–S67. [Google Scholar] [CrossRef]
- Restrepo, B.J.; Rieger, M. Denmark’s policy on artificial trans fat and cardiovascular disease. Am. J. Prev. Med. 2016, 50, 69–76. [Google Scholar] [CrossRef]
- World Health Organization. Eliminating Trans Fats in Europe: A Policy Brief; WHO Regional Office for Europe: Copenhagen, Denmark, 2015. [Google Scholar]
- Zuchowska-Grzywacz, M.; Kowalska, M. Trans fatty acids in food—Current legal regulations as protections for consumers and food manufacturers. Acta Aliment. 2019, 48, 105–114. [Google Scholar] [CrossRef]
- Republike Slovenije. Pravilnik o Največji Dovoljeni Vsebnosti Transmaščobnih Kislin v Živilih. Available online: https://www.uradni-list.si/glasilo-uradni-list-rs/vsebina/2018-01-0801/ (accessed on 28 December 2020).
- Zupanič, N.; Hribar, M.; Pivk Kupirovič, U.; Kušar, A.; Žmitek, K.; Pravst, I. Limiting trans fats in foods: Use of partially hydrogenated vegetable oils in prepacked foods in Slovenia. Nutrients 2018, 10, 355. [Google Scholar] [CrossRef]
- Micha, R.; Khatibzadeh, S.; Shi, P.; Fahimi, S.; Lim, S.; Andrews, K.G.; Engell, R.E.; Powles, J.; Ezzati, M.; Mozaffarian, D. Global, regional, and national consumption levels of dietary fats and oils in 1990 and 2010: A systematic analysis including 266 country-specific nutrition surveys. BMJ 2014, 348, g2272. [Google Scholar] [CrossRef] [PubMed]
- EFSA. Guidance on the EU Menu methodology. EFSA J. 2014, 12, 3944. [Google Scholar] [CrossRef]
- Gregorič, M.; Blaznik, U.; Delfar, N.; Zaletel, M.; Lavtar, D.; Seljak, B.K.; Golja, P.; Kotnik, K.Z.; Pravst, I.; Mis, N.F. Slovenian national food consumption survey in adolescents, adults and elderly. EFSA Supporting Publ. 2019, 16, 1729E. [Google Scholar]
- Lee, P.H.; Macfarlane, D.J.; Lam, T.H.; Stewart, S.M. Validity of the international physical activity questionnaire short form (IPAQ-SF): A systematic review. Int. J. Behav. Nutr. Phys. Act. 2011, 8, 115. [Google Scholar] [CrossRef] [PubMed]
- De Onis, M.; Onyango, A.; Borghi, E.; Siyam, A.; Blössner, M.; Lutter, C. Worldwide implementation of the WHO child growth standards. Public Health Nutr. 2012, 15, 1603–1610. [Google Scholar] [CrossRef] [PubMed]
- De Onis, M.; Onyango, A.W.; Borghi, E.; Siyam, A.; Nishida, C.; Siekmann, J. Development of a WHO growth reference for school-aged children and adolescents. Bull. World Health Organ. 2007, 85, 660–667. [Google Scholar] [CrossRef]
- Korošec, M.; Golob, T.; Bertoncelj, J.; Stibilj, V.; Seljak, B.K. The Slovenian food composition database. Food Chem. 2013, 140, 495–499. [Google Scholar] [CrossRef]
- Bodner-Montville, J.; Ahuja, J.K.; Ingwersen, L.A.; Haggerty, E.S.; Enns, C.W.; Perloff, B.P. USDA food and nutrient database for dietary studies: Released on the web. J. Food Comp. Anal. 2006, 19, S100–S107. [Google Scholar] [CrossRef]
- Kušar, A.; Hribar, M.; Lavriša, Ž.; Zupanič, N.; Kupirovič, U.P.; Hristov, H.; Abramovič, H.; Vidrih, R.; Zlatić, E.; Kokalj, D. Assessment of trans-fatty acid content in a sample of foods from the Slovenian food supply using a sales-weighting approach. Public Health Nutr. 2020, 24, 12–21. [Google Scholar] [CrossRef]
- EC. Regulation (EU) No 1169/2011 of the European Parliament and of the Council of 25 October 2011 on the Provision of Food Information to Consumers. Available online: https://eur-lex.europa.eu/legal-content/EN/AUTO/?uri=CELEX:02011R1169-20180101&qid=1547797296601 (accessed on 28 December 2020).
- Dunford, E.; Neal, B.; Macgregor, G.; Czernichow, S.; Ni Mhurchu, C.; Food Monitoring Group. International collaborative project to compare and track the nutritional composition of fast foods. BMC Public Health 2012, 12, 559. [Google Scholar]
- Zupanič, N.; Hristov, H.; Gregorič, M.; Blaznik, U.; Delfar, N.; Koroušić Seljak, B.; Ding, E.L.; Fidler Mis, N.; Pravst, I. Total and Free Sugars Consumption in a Slovenian Population Representative Sample. Nutrients 2020, 12, 1729. [Google Scholar] [CrossRef] [PubMed]
- Goldberg, G.; Black, A.; Jebb, S.; Cole, T.; Murgatroyd, P.; Coward, W.; Prentice, A. Critical evaluation of energy intake data using fundamental principles of energy physiology: 1. Derivation of cut-off limits to identify under-recording. Eur. J. Clin. Nutr. 1991, 45, 569–581. [Google Scholar] [PubMed]
- Black, A.E. Critical evaluation of energy intake using the Goldberg cut-off for energy intake: Basal metabolic rate. A practical guide to its calculation, use and limitations. Int. J. Obes. 2000, 24, 1119–1130. [Google Scholar] [CrossRef] [PubMed]
- Harris, J.A.; Benedict, F.G. A biometric study of human basal metabolism. Proc. Natl. Acad. Sci. USA 1918, 4, 370. [Google Scholar] [CrossRef]
- Roza, A.M.; Shizgal, H.M. The Harris Benedict equation reevaluated: Resting energy requirements and the body cell mass. Am. J. Clin. Nutr. 1984, 40, 168–182. [Google Scholar] [CrossRef]
- Willett, W.C.; Howe, G.R.; Kushi, L.H. Adjustment for total energy intake in epidemiologic studies. Am. J. Clin. Nutr. 1997, 65, 1220S–1228S. [Google Scholar] [CrossRef]
- Harttig, U.; Haubrock, J.; Knüppel, S.; Boeing, H. The MSM program: Web-based statistics package for estimating usual dietary intake using the Multiple Source Method. Eur. J. Clin. Nutr. 2011, 65, S87–S91. [Google Scholar] [CrossRef]
- Kolenikov, S. Calibrating survey data using iterative proportional fitting (raking). Stata J. 2014, 14, 22–59. [Google Scholar] [CrossRef]
- Wanders, A.J.; Zock, P.L.; Brouwer, I.A. Trans fat intake and its dietary sources in general populations worldwide: A systematic review. Nutrients 2017, 9, 840. [Google Scholar] [CrossRef]
- Temme, E.H.; Millenaar, I.L.; Van Donkersgoed, G.; Westenbrink, S. Impact of fatty acid food reformulations on intake of Dutch young adults. Acta Cardiol. 2011, 66, 721–728. [Google Scholar] [CrossRef]
- Hutchinson, J.; Rippin, H.L.; Jewell, J.; Breda, J.J.; Cade, J.E. Comparison of high and low trans-fatty acid consumers: Analyses of UK National Diet and Nutrition Surveys before and after product reformulation. Public Health Nutr. 2018, 21, 465–479. [Google Scholar] [CrossRef] [PubMed]
- Stender, S.; Astrup, A.; Dyerberg, J. Artificial trans fat in popular foods in 2012 and in 2014: A market basket investigation in six European countries. BMJ Open 2016, 6. [Google Scholar] [CrossRef] [PubMed]
- Gebauer, S.K.; Destaillats, F.; Dionisi, F.; Krauss, R.M.; Baer, D.J. Vaccenic acid and trans fatty acid isomers from partially hydrogenated oil both adversely affect LDL cholesterol: A double-blind, randomized controlled trial. Am. J. Clin. Nutr. 2015, 102, 1339–1346. [Google Scholar] [CrossRef] [PubMed]
- Kuhnt, K.; Baehr, M.; Rohrer, C.; Jahreis, G. Trans fatty acid isomers and the trans-9/trans-11 index in fat containing foods. Eur. J. Lipid Sci. Technol. 2011, 113, 1281–1292. [Google Scholar] [CrossRef]
- Aldai Elkoro-Iribe, N.; Dugan, M.; Rolland, D.; Kramer, K. Survey of the fatty acid composition of Canadian beef: Backfat and longissimus lumborum muscle. Can. J. Anim. Sci. 2009, 89, 315–329. [Google Scholar] [CrossRef]
- Wang, X.; England, A.; Sinclair, C.; Merkosky, F.; Chan, C.B. Trans-11 vaccenic acid improves glucose homeostasis in a model of type 2 diabetes by promoting insulin secretion via GPR40. J. Funct. Foods 2019, 60, 103410. [Google Scholar] [CrossRef]
- Lim, J.-N.; Oh, J.-J.; Wang, T.; Lee, J.-S.; Kim, S.-H.; Kim, Y.-J.; Lee, H.-G. Trans-11 18: 1 vaccenic acid (TVA) has a direct anti-carcinogenic effect on MCF-7 human mammary adenocarcinoma cells. Nutrients 2014, 6, 627–636. [Google Scholar] [CrossRef]
- Bassett, C.M.; Edel, A.L.; Patenaude, A.F.; McCullough, R.S.; Blackwood, D.P.; Chouinard, P.Y.; Paquin, P.; Lamarche, B.; Pierce, G.N. Dietary vaccenic acid has antiatherogenic effects in LDLr−/− mice. J. Nutr. 2010, 140, 18–24. [Google Scholar] [CrossRef]
- Oteng, A.-B.; Kersten, S. Mechanisms of Action of trans Fatty Acids. Adv. Nutr. 2019, 11, 697–708. [Google Scholar] [CrossRef]
- Stender, S.; Astrup, A.; Dyerberg, J. What went in when trans went out? N. Engl. J. Med. 2009, 361, 314–316. [Google Scholar] [CrossRef]
- Eckel, R.H.; Borra, S.; Lichtenstein, A.H.; Yin-Piazza, S.Y. Understanding the complexity of trans fatty acid reduction in the American diet: American Heart Association Trans Fat Conference 2006: Report of the Trans Fat Conference Planning Group. Circulation 2007, 115, 2231–2246. [Google Scholar] [CrossRef] [PubMed]
- Mozaffarian, D.; Jacobson, M.F.; Greenstein, J.S. Food reformulations to reduce trans fatty acids. N. Engl. J. Med. 2010, 362, 2037–2039. [Google Scholar] [CrossRef] [PubMed]
- Ratnayake, W.; L’Abbe, M.; Mozaffarian, D. Nationwide product reformulations to reduce trans fatty acids in Canada: When trans fat goes out, what goes in? Eur. J. Clin. Nutr. 2009, 63, 808–811. [Google Scholar] [CrossRef] [PubMed]
- NUTRIS. The Content of Trans Fats in Foods and Population Intakes—Public Health Implications. Available online: https://www.nutris.org/en/projects/trans-fats-in-foods (accessed on 28 December 2020).
- Poslusna, K.; Ruprich, J.; de Vries, J.H.; Jakubikova, M.; van’t Veer, P. Misreporting of energy and micronutrient intake estimated by food records and 24 hour recalls, control and adjustment methods in practice. Br. J. Nutr. 2009, 101, S73–S85. [Google Scholar] [CrossRef]
- Remig, V.; Franklin, B.; Margolis, S.; Kostas, G.; Nece, T.; Street, J.C. Trans fats in America: A review of their use, consumption, health implications, and regulation. J. Am. Diet. Assoc. 2010, 110, 585–592. [Google Scholar] [CrossRef]


Publisher’s Note: MDPI stays neutral with regard to jurisdictional claims in published maps and institutional affiliations. |
© 2021 by the authors. Licensee MDPI, Basel, Switzerland. This article is an open access article distributed under the terms and conditions of the Creative Commons Attribution (CC BY) license (http://creativecommons.org/licenses/by/4.0/).