Development and Validation of a Salt Food Frequency Questionnaire (FFQ-Na) and a Discretionary Salt Questionnaire (DSQ) for the Evaluation of Salt Intake among French-Canadian Population

 ,
, 
Abstract
1. Introduction
2. Materials and Methods
2.1. Development of the Tools
2.1.1. FFQ-Na
2.1.2. DSQ
2.2. FFQ-Na and DSQ—Reliability
2.3. FFQ-Na and DSQ—Validity
2.3.1. 24 h Uri-Na
2.3.2. 3-Day Food Record
2.4. Anthropometry and Body Composition
2.5. Hemodynamic Profile
2.6. Ethical Aspects
2.7. Statistical Analyses
3. Results
3.1. Reliability
3.2. Validity
4. Discussion
5. Conclusions
Supplementary Materials
Author Contributions
Funding
Institutional Review Board Statement
Informed Consent Statement
Conflicts of Interest
References
- Barberio, A.M.; Sumar, N.; Trieu, K.; Lorenzetti, D.L.; Tarasuk, V.; Webster, J.; Campbell, N.R.C.; McLaren, L. Population-level interventions in government jurisdictions for dietary sodium reduction: A Cochrane Review. Int. J. Epidemiol. 2017, 46, 1405–1551. [Google Scholar] [CrossRef] [PubMed]
- He, F.J.; Campbell, N.R.; MacGregor, G.A. Reducing salt intake to prevent hypertension and cardiovascular disease. Rev. Panam. Salud Publica 2012, 32, 293–300. [Google Scholar] [CrossRef] [PubMed]
- He, F.J.; MacGregor, G.A. Reducing population salt intake worldwide: From evidence to implementation. Prog. Cardiovasc. Dis. 2010, 52, 363–382. [Google Scholar] [CrossRef] [PubMed]
- Strazzullo, P.; D’Elia, L.; Kandala, N.B.; Cappuccio, F.P. Salt intake, stroke, and cardiovascular disease: Meta-analysis of prospective studies. BMJ 2009, 339, b4567. [Google Scholar] [CrossRef] [PubMed]
- Campbell, N.R.; Lackland, D.T.; Niebylski, M.L. 2014 dietary salt fact sheet of the World Hypertension League, International Society of Hypertension, Pan American Health Organization technical advisory group on cardiovascular disease prevention through dietary salt reduction, the World Health Organization collaborating centre on population salt reduction, and World Action on Salt & Health. J. Clin. Hypertens. 2015, 17, 7–9. [Google Scholar]
- Cappuccio, F.P.; Campbell, N.R. Population Dietary Salt Reduction and the Risk of Cardiovascular Disease: A Commentary on Recent Evidence. J. Clin. Hypertens. 2017, 19, 4–5. [Google Scholar] [CrossRef] [PubMed]
- Campbell, N.R.; Lackland, D.T.; Niebylski, M.L.; Orias, M.; Redburn, K.A.; Nilsson, P.M.; Zhang, X.H.; Burrell, L.; Horiuchi, M.; Poulter, N.R.; et al. 2016 Dietary Salt Fact Sheet and Call to Action: The World Hypertension League, International Society of Hypertension, and the International Council of Cardiovascular Prevention and Rehabilitation. J. Clin. Hypertens. 2016, 18, 1082–1085. [Google Scholar] [CrossRef]
- WHO. Guidelines Approved by the Guidelines Review Committee. In Guideline: Sodium Intake for Adults and Children; World Health Organization: Geneva, Switzerland, 2012. [Google Scholar]
- Forte, J.G.; Miguel, J.M.; Miguel, M.J.; de Pádua, F.; Rose, G. Salt and blood pressure: A community trial. J. Hum. Hypertens. 1989, 3, 179–184. [Google Scholar]
- Tian, H.G.; Guo, Z.Y.; Hu, G.; Yu, S.J.; Sun, W.; Pietinen, P.; Nissinen, A. Changes in sodium intake and blood pressure in a community-based intervention project in China. J. Hum. Hypertens. 1995, 9, 959–968. [Google Scholar]
- He, F.J.; Li, J.; Macgregor, G.A. Effect of longer term modest salt reduction on blood pressure: Cochrane systematic review and meta-analysis of randomised trials. BMJ 2013, 346, f1325. [Google Scholar] [CrossRef]
- WHO. Strategies to Monitor and Evaluate Population Sodium Consumption and Sources of Sodium in the Diet: Report of a Joint Technical Meeting Convened by WHO and the Government of Canada; WHO Press: Geneva, Switzerland, 2011. [Google Scholar]
- Arcand, J.; Webster, J.; Johnson, C.; Raj, T.S.; Neal, B.; McLean, R.; Trieu, K.; Wong, M.M.; Leung, A.A.; Campbell, N.R. Announcing “Up to Date in the Science of Sodium”. J. Clin. Hypertens. 2016, 18, 85–88. [Google Scholar] [CrossRef] [PubMed]
- Ferreira-Sae, M.C.; Gallani, M.C.; Nadruz, W.; Rodrigues, R.C.; Franchini, K.G.; Cabral, P.C.; Sales, M.L. Reliability and validity of a semi-quantitative FFQ for sodium intake in low-income and low-literacy Brazilian hypertensive subjects. Public Health Nutr. 2009, 12, 2168–2173. [Google Scholar] [CrossRef] [PubMed]
- McLean, R.M.; Farmer, V.L.; Nettleton, A.; Cameron, C.M.; Cook, N.R.; Campbell, N.R.C. Assessment of dietary sodium intake using a food frequency questionnaire and 24-hour urinary sodium excretion: A systematic literature review. J. Clin. Hypertens. 2017, 19, 1214–1230. [Google Scholar] [CrossRef] [PubMed]
- Campbell, N.R.; Correa-Rotter, R.; Cappuccio, F.P.; Webster, J.; Lackland, D.T.; Neal, B.; MacGregor, G.A. Proposed nomenclature for salt intake and for reductions in dietary salt. J. Clin. Hypertens. 2015, 17, 247–251. [Google Scholar] [CrossRef] [PubMed]
- Cade, J.E.; Burley, V.J.; Warm, D.L.; Thompson, R.L.; Margetts, B.M. Food-frequency questionnaires: A review of their design, validation and utilisation. Nutr. Res. Rev. 2004, 17, 5–22. [Google Scholar] [CrossRef] [PubMed]
- Naska, A.; Lagiou, A.; Lagiou, P. Dietary assessment methods in epidemiological research: Current state of the art and future prospects. F1000Research 2017, 6, 926. [Google Scholar] [CrossRef] [PubMed]
- Prentice, R.L.; Mossavar-Rahmani, Y.; Huang, Y.; Van Horn, L.; Beresford, S.A.; Caan, B.; Tinker, L.; Schoeller, D.; Bingham, S.; Eaton, C.B.; et al. Evaluation and comparison of food records, recalls, and frequencies for energy and protein assessment by using recovery biomarkers. Am. J. Epidemiol. 2011, 174, 591–603. [Google Scholar] [CrossRef]
- Hawkes, C.; Webster, J. National approaches to monitoring population salt intake: A trade-off between accuracy and practicality? PLoS ONE 2012, 7, e46727. [Google Scholar] [CrossRef]
- Willett, W. Nutritional Epidemiology; Oxford University Press: Oxford, UK, 2012. [Google Scholar]
- Health Canada. Canadian Community Health Survey, Cycle 2.2, Nutrition (2004)—A Guide to Accessing and Interpreting the Data; Santé Canada: Ottawa, ON, Canada, 2006. [Google Scholar]
- Cade, J.; Thompson, R.; Burley, V.; Warm, D. Development, validation and utilisation of food-frequency questionnaires—A review. Public Health Nutr. 2002, 5, 567–587. [Google Scholar] [CrossRef]
- Katamay, S.W.; Esslinger, K.A.; Vigneault, M.; Johnston, J.L.; Junkins, B.A.; Robbins, L.G.; Sirois, I.V.; Jones-Mclean, E.M.; Kennedy, A.F.; Bush, M.A.; et al. Eating well with Canada’s Food Guide (2007): Development of the food intake pattern. Nutr. Rev. 2007, 65, 155–166. [Google Scholar] [CrossRef]
- Expert Panel on the Identification, Evaluation, and Treatment of Overweight and Obesity in Adults. Clinical Guidelines on the Identification, Evaluation, and Treatment of Overweight and Obesity in Adults—The Evidence Report. National Institutes of Health. Obes. Res. 1998, 6 (Suppl. 2), 51s–209s. [Google Scholar]
- Lohman, T.G.; Roche, A.F.; Martorell, R. Anthropometric Standardization Reference Manual; Human Kinetics Books: Champaign, IL, USA, 1988. [Google Scholar]
- Prud’homme, D.; Després, J.P.; Landry, J.F.; Moorjani, S.; Lupien, P.J.; Tremblay, A.; Nadeau, A.; Bouchard, C. Systolic blood pressure during submaximal exercise: An important correlate of cardiovascular disease risk factors in normotensive obese women. Metabolism 1994, 43, 18–23. [Google Scholar] [CrossRef]
- Watkins, M.P. Foundations of Clinical Research: Applications to Practice; Pearson/Prentice Hall: Upper Saddle River, NJ, USA, 2009. [Google Scholar]
- Lombard, M.J.; Steyn, N.P.; Charlton, K.E.; Senekal, M. Application and interpretation of multiple statistical tests to evaluate validity of dietary intake assessment methods. Nutr. J. 2015, 14, 40. [Google Scholar] [CrossRef]
- McLean, R.M. Measuring population sodium intake: A review of methods. Nutrients 2014, 6, 4651–4662. [Google Scholar] [CrossRef] [PubMed]
- Charlton, K.E.; Steyn, K.; Levitt, N.S.; Jonathan, D.; Zulu, J.V.; Nel, J.H. Development and validation of a short questionnaire to assess sodium intake. Public Health Nutr. 2008, 11, 83–94. [Google Scholar] [CrossRef] [PubMed]
- Li, J.; Lu, Z.; Yan, L.; Zhang, J.; Tang, J.; Cai, X.; Guo, X.; Ma, J.; Xu, A. Comparison of dietary survey, frequency and 24 hour urinary Na methods in evaluation of salt intake in the population. Zhonghua Yu Fang Yi Xue Za Zhi 2014, 48, 1093–1097. [Google Scholar] [PubMed]
- Murakami, K.; Sasaki, S.; Uenishi, K. The degree of misreporting of the energy-adjusted intake of protein, potassium, and sodium does not differ among under-, acceptable, and over-reporters of energy intake. Nutr. Res. 2012, 32, 741–750. [Google Scholar] [CrossRef]
- Sasaki, S.; Yanagibori, R.; Amano, K. Validity of a self-administered diet history questionnaire for assessment of sodium and potassium: Comparison with single 24-hour urinary excretion. Jpn. Circ. J. 1998, 62, 431–435. [Google Scholar] [CrossRef]
- Mattes, R.D.; Donnelly, D. Relative contributions of dietary sodium sources. J. Am. Coll. Nutr. 1991, 10, 383–393. [Google Scholar] [CrossRef]
- Kelly, C.; Geaney, F.; Fitzgerald, A.P.; Browne, G.M.; Perry, I.J. Validation of diet and urinary excretion derived estimates of sodium excretion against 24-h urine excretion in a worksite sample. Nutr. Metab. Cardiovasc. Dis. 2015, 25, 771–779. [Google Scholar] [CrossRef]
- Statistics Canada. Adjusting the Scales: Obesity in the Canadian Population after Correcting for Respondent Bias; Statistics Canada: Ottawa, ON, Canada, 2014. [Google Scholar]
- Statistics Canada. High Blood Pressure, 2014; Statistics Canada: Ottawa, ON, Canada, 2014. [Google Scholar]
- Lerchl, K.; Rakova, N.; Dahlmann, A.; Rauh, M.; Goller, U.; Basner, M.; Dinges, D.F.; Beck, L.; Agureev, A.; Larina, I.; et al. Agreement between 24-hour salt ingestion and sodium excretion in a controlled environment. Hypertension 2015, 66, 850–857. [Google Scholar] [CrossRef] [PubMed]


| Test | Retest | ICC (95% CI) | |
|---|---|---|---|
| DSQ (g/day) | 1.7 ± 1.2 | 1.5 ± 1.0 | 0.73 (0.56, 0.85) |
| FFQ-Na (g/day) | 4.7 ± 2.3 | 4.6 ± 2.2 | 0.97 (0.94, 0.98) |
| FFQ-Na+ DSQ (g/day) | 6.4 ± 2.7 | 6.3 ± 2.7 | 0.98 (0.95, 0.99) |
| Total Sample (n = 164) | Male (n = 95) | Female (n = 69) | ||||
|---|---|---|---|---|---|---|
| Mean (SD) | Median (IQR) | Mean (SD) | Median (IQR) | Mean (SD) | Median (IQR) | |
| Age (years) | 51.4 (8.0) | 52.1 (14.2) | 51.1 (7.9) | 51.6 (13.5) | 51.9 (8.1) | 53.3 (14.6) |
| BMI (kg/m2) | 26.0 (3.6) | 25.8 (4.6) | 26.3 (2.9) | 26.3 (3.6) | 25.5 (4.4) | 24.6 (5.8) |
| WC (cm) | 89.5 (11.1) | 90.3 (16.9) | 93.5 (9.3) | 92.7 (11.2) | 83.7 (11.0) | 82.4 (18.4) |
| SBP (mmHg) | 117 (12) | 118 (8) | 120 (10) | 120 (15) | 113 (12) | 114 (18) |
| DBP (mmHg) | 73 (9) | 72 (12) | 75 (8) | 75 (12) | 70 (9) | 68 (13) |
| Total Sample | Male | Female | p Value | ||||
|---|---|---|---|---|---|---|---|
| Mean(SD) | Median(IQR) | Mean(SD) | Median(IQR) | Mean(SD) | Median(IQR) | ||
| DSQ *(n = 164) | 2.0(1.6) | 1.6(1.7) | 1.8(1.4) | 1.4(1.1) | 2.4(1.9) | 1.8(1.8) | p = 0.022 |
| FFQ-Na *(n = 164) | 4.7(2.3) | 4.3(2.6) | 5.6(2.4) | 5.1(2.5) | 3.6(1.7) | 3.3(1.6) | p < 0.0001 |
| 3-day food record *(n = 142) | 7.9(2.8) | 7.7(1.7) | 8.9(2.8) | 8.8(2.0) | 6.6(2.2) | 6.4(1.4) | p < 0.0001 |
| 24 h Uri-Na *(n = 162) | 9.1(4.2) | 8.2(4.5) | 10.3(4.5) | 9.4(4.6) | 7.6(3.2) | 7.1(3.6) | p < 0.0001 |
| DSQ | FFQ-Na | FFQ-Na + DSQ | |
|---|---|---|---|
| FFQ | 0.13 | ||
| 3-day food record | 0.03 | 0.35 * | 0.31 * |
| 24 h Uri-Na | 0.09 | 0.30 * | 0.29 * |
| Difference (SD); (mean − 2SD, mean + 2SD) | Correlation | |
|---|---|---|
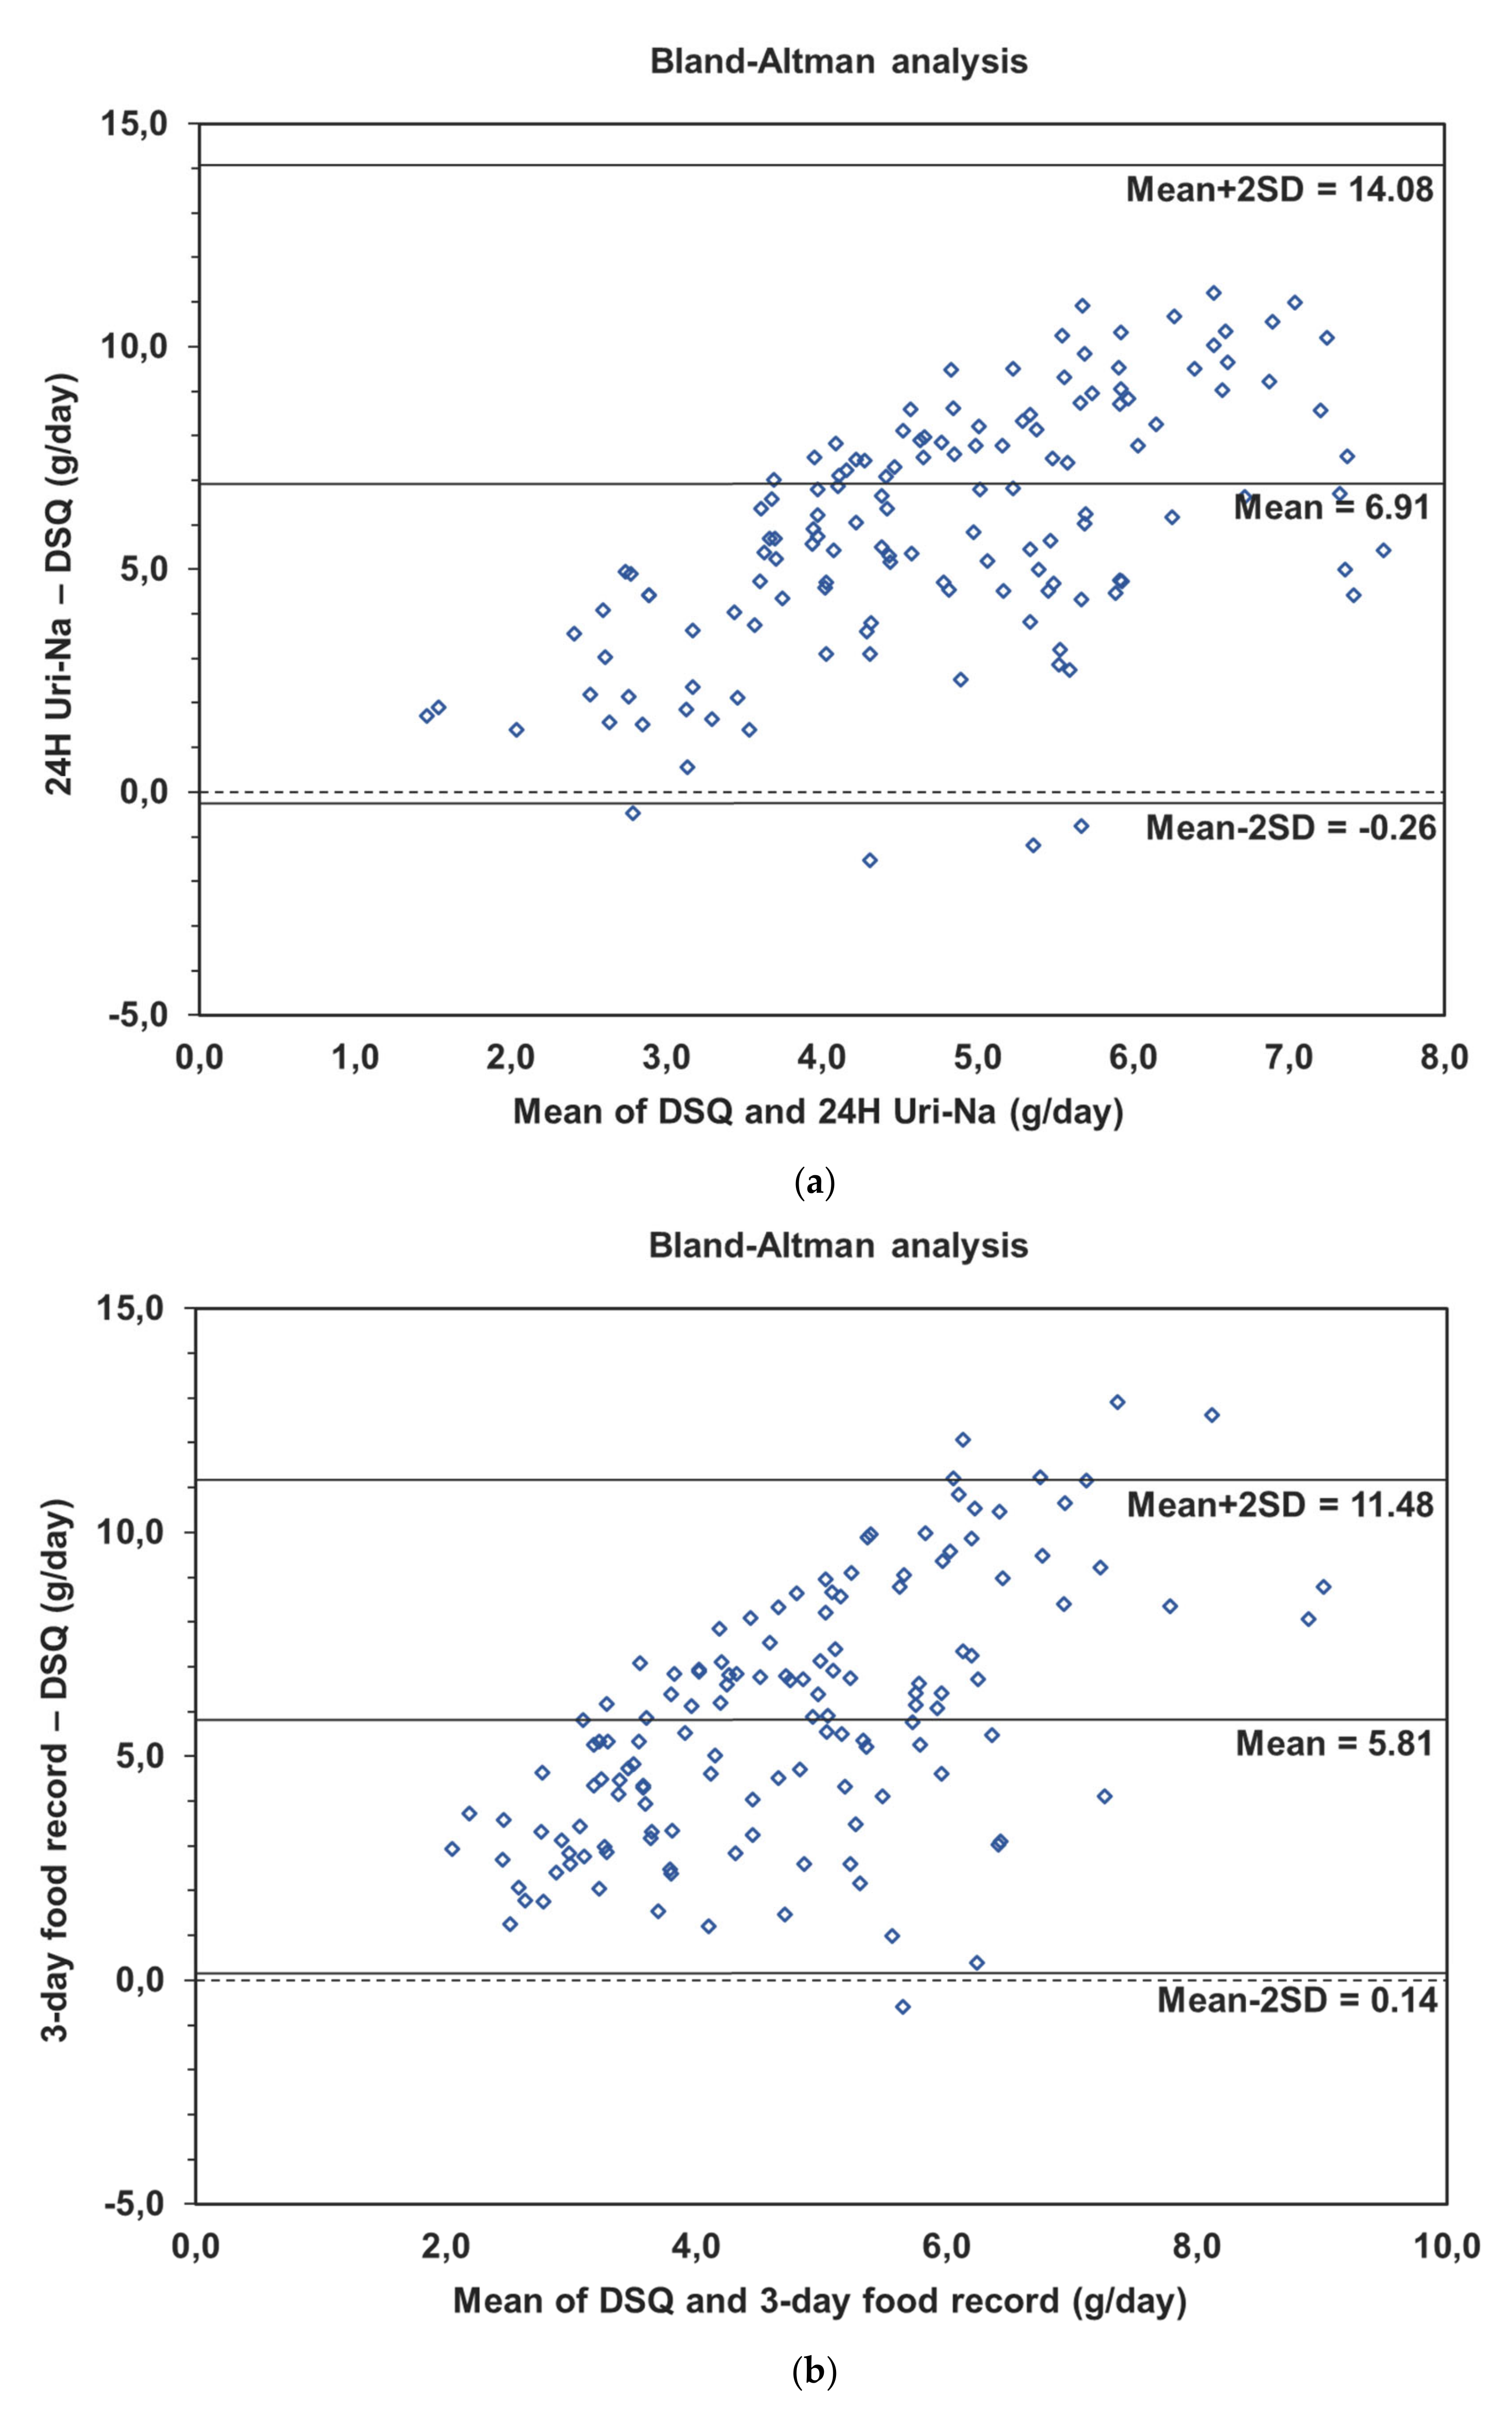
| DSQ and 3-day food record (n = 136) | 5.8 (2.8); (0.1, 11.5) | 0.56 p < 0.0001 |
| DSQ and 24 h Uri-Na (n = 141) | 6.9 (3.6); (−0.3, 14.1) | 0.61 p < 0.0001 |
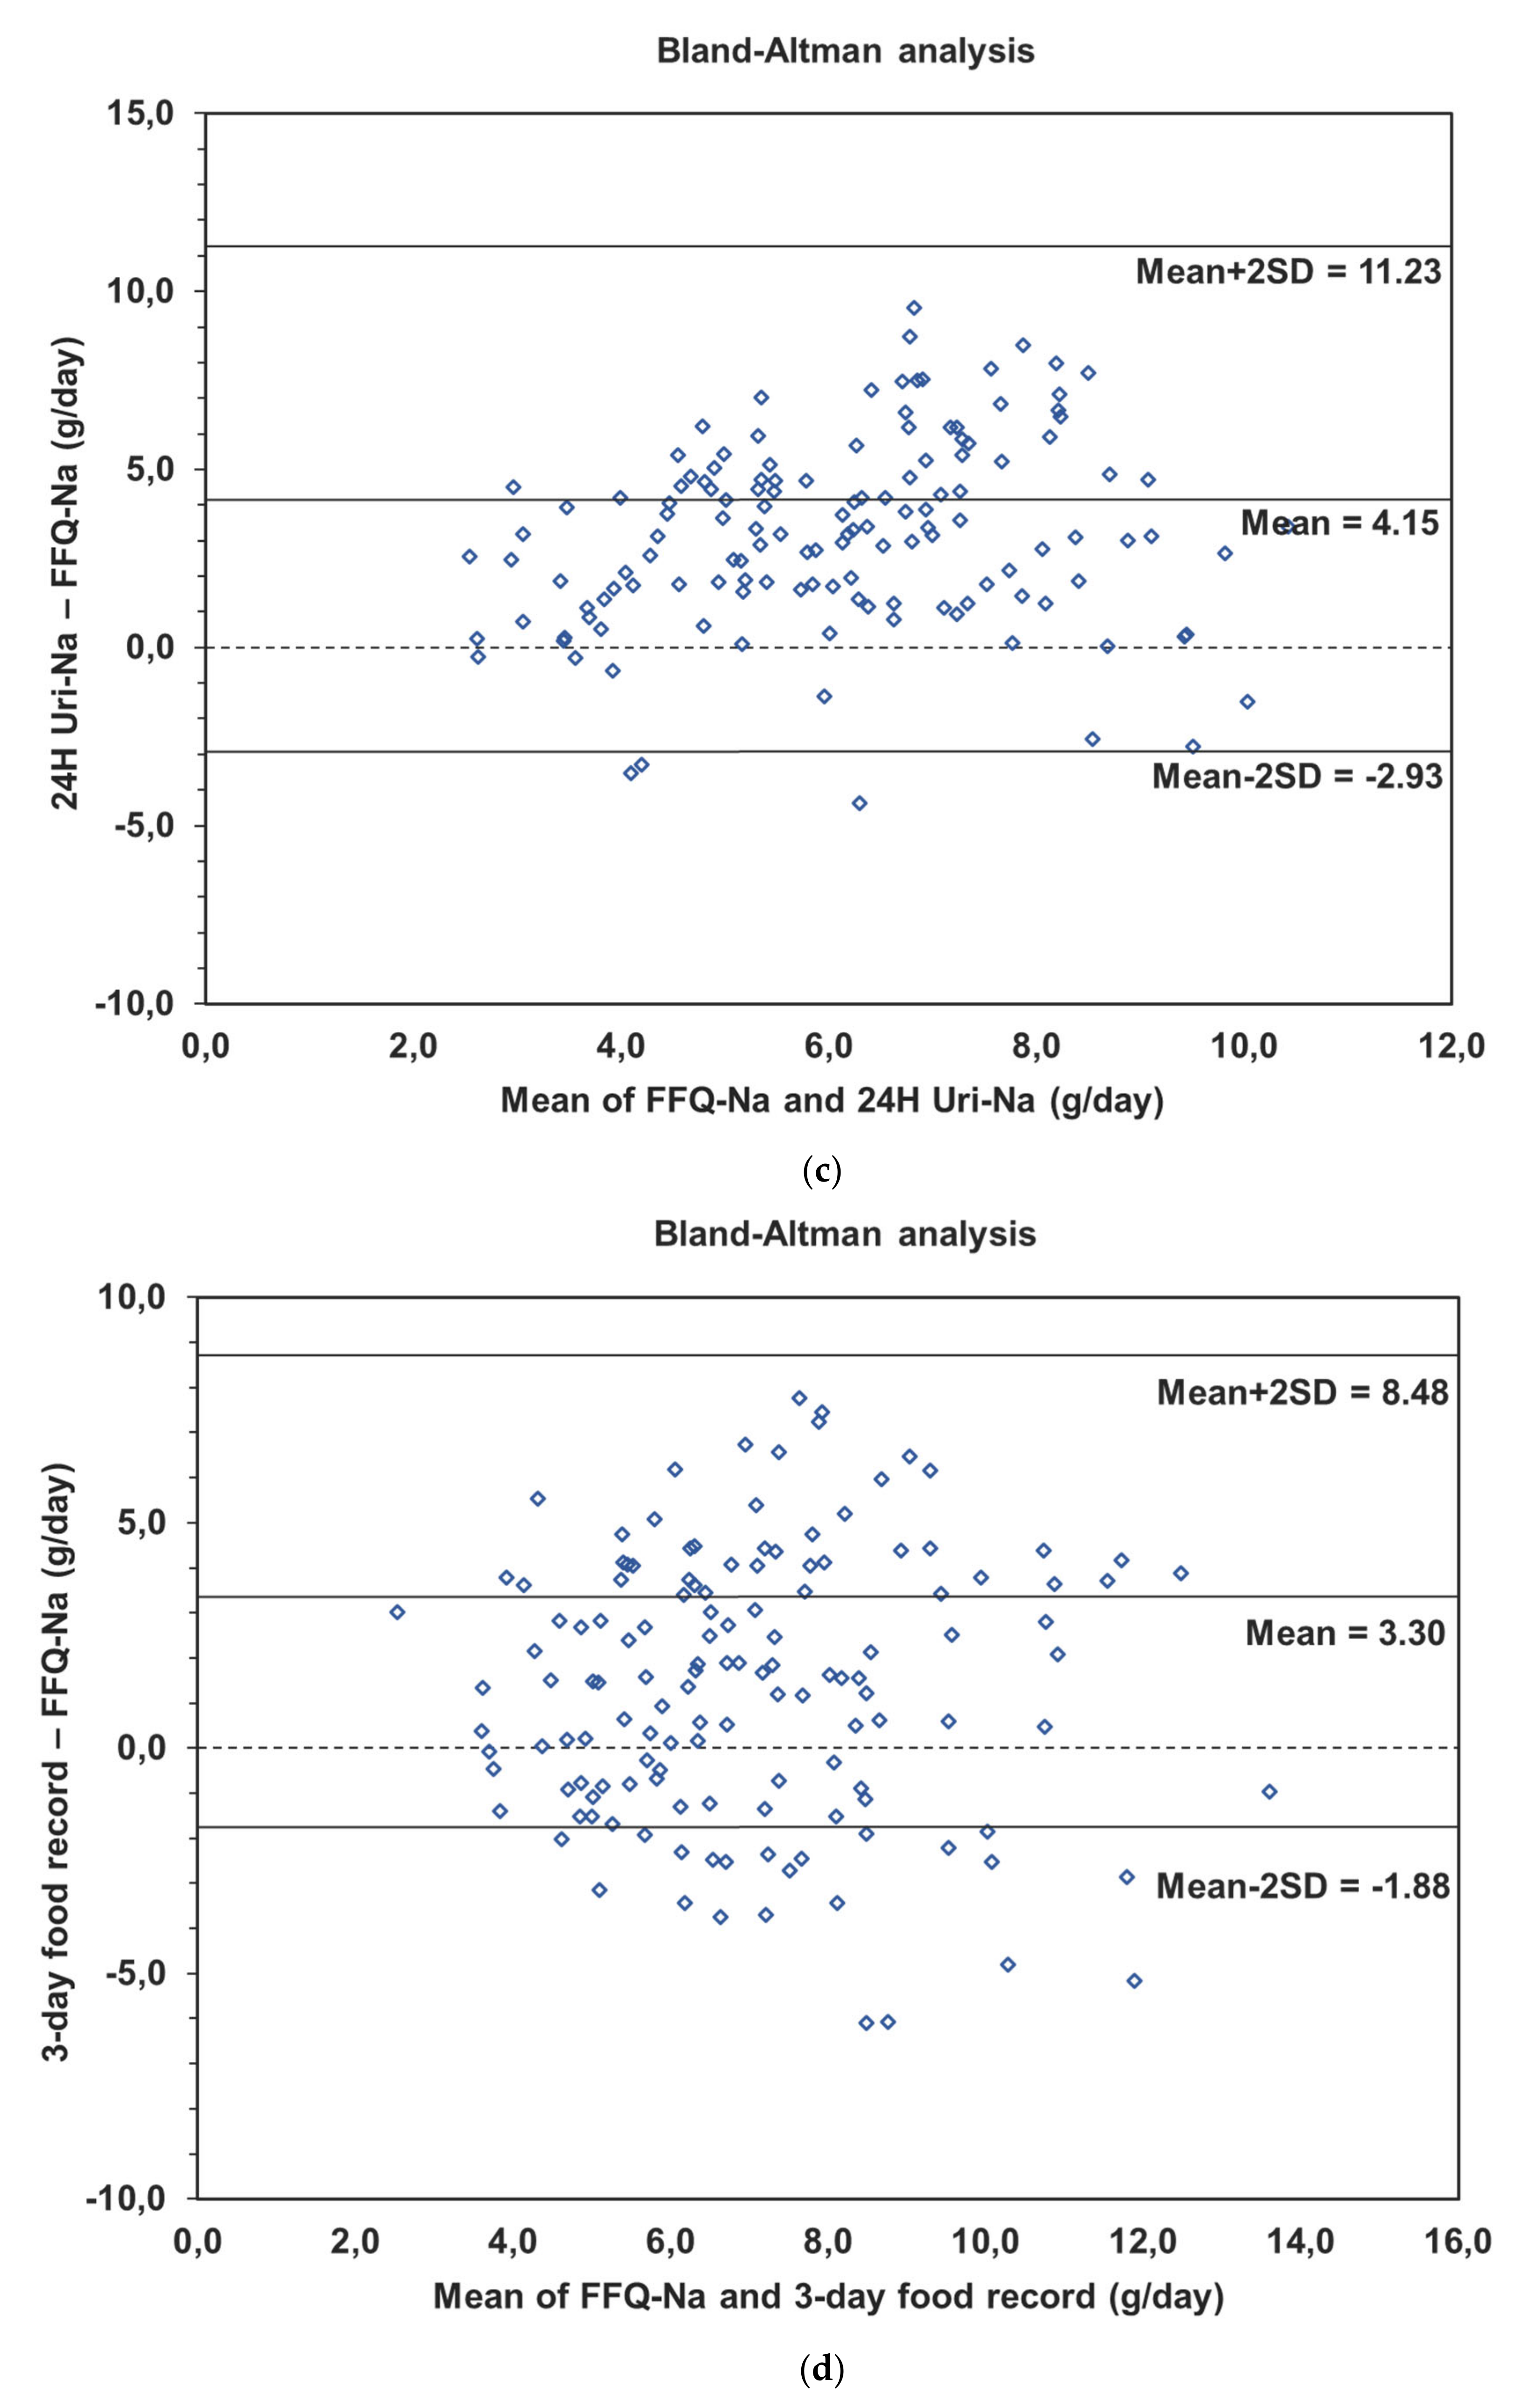
| FFQ-Na and 3-day food record (n = 138) | 3.3 (2.6); (−1.9, 8.5) | 0.38 p < 0.0001 |
| FFQ-Na and 24 h Uri-Na (n = 144) | 4.2 (3.5); (−2.9, 11.2) | 0.28 p = 0.0006 |
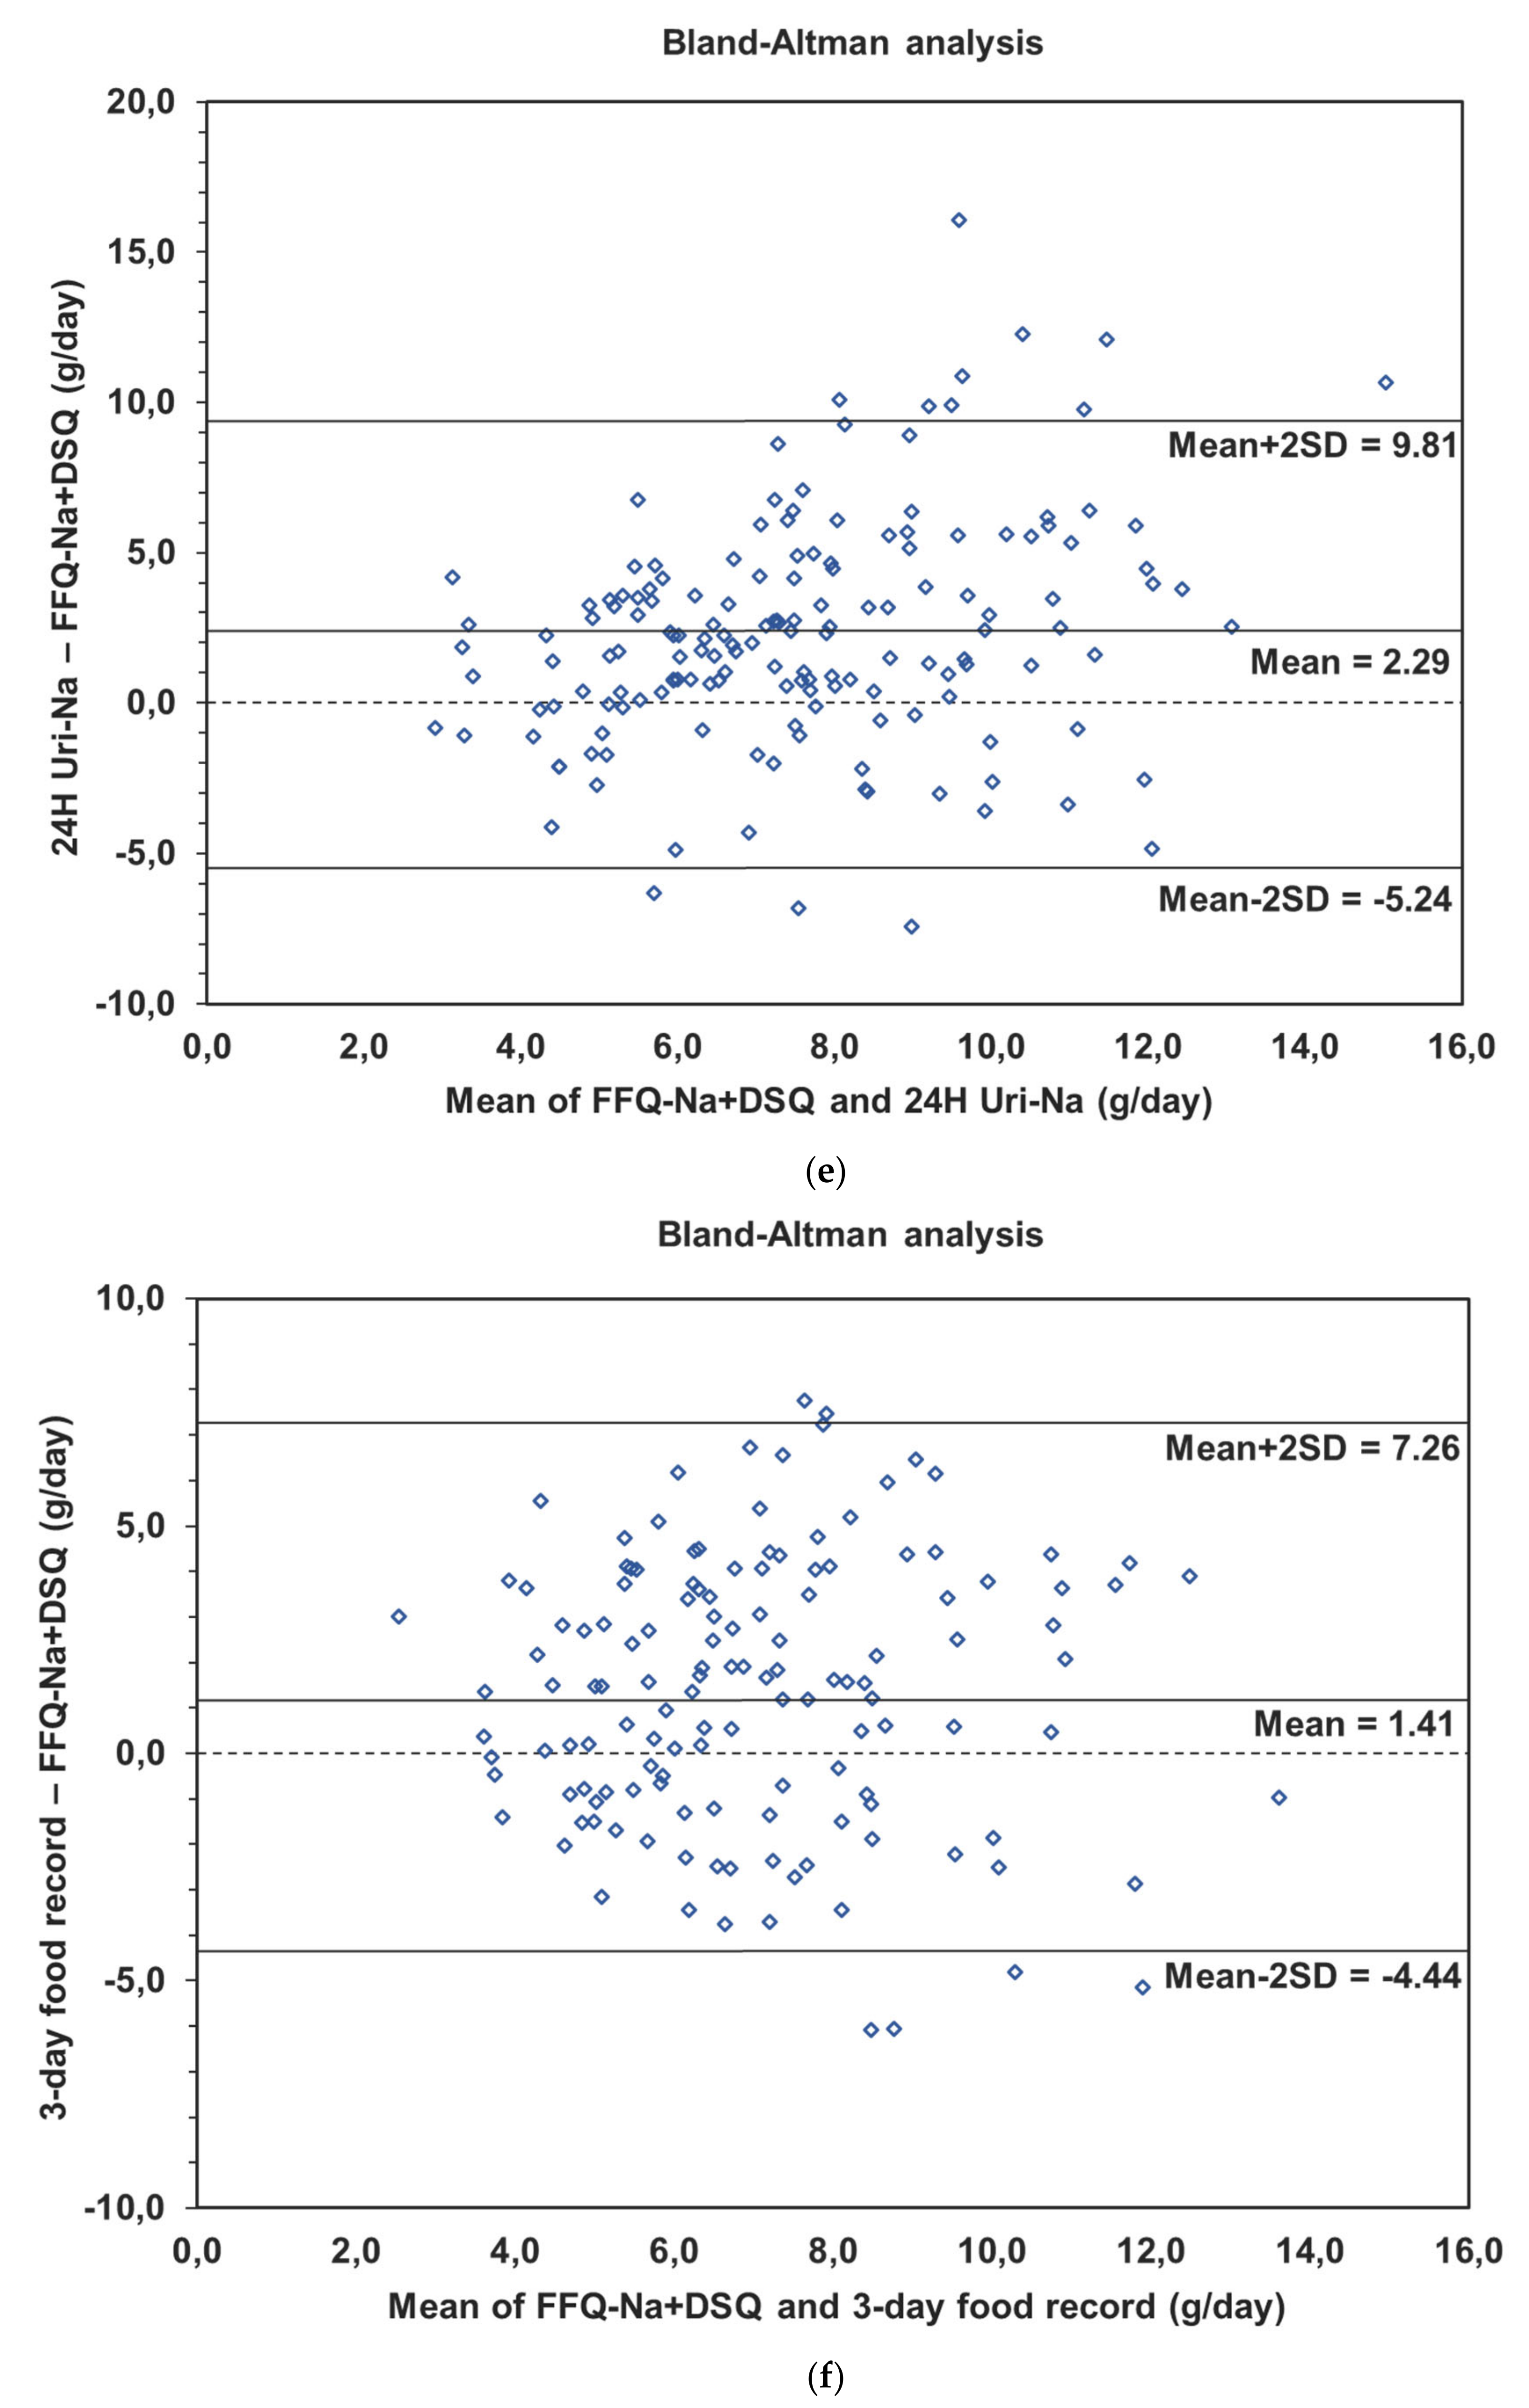
| FFQ-Na + DSQ and 3-day food record (n = 137) | 1.4 (2.9); (−4.4, 7.3) | 0.06 p = 0.4649 |
| FFQ-Na + DSQ and 24 h Uri-Na (n = 144) | 2.3 (3.8); (−5.2, 9.8) | 0.08 p = 0.3451 |
| Proportion of Agreement | Proportion of Opposite Quartile | |
|---|---|---|
| DSQ and 24 h Uri-Na | 41.4% | 33.8% |
| DSQ and 3-day food record | 43.8% | 32.3% |
| FFQ-Na and 24 h Uri-Na | 53.3% | 23.1% |
| FFQ-Na and 3-day food record | 48.3% | 27.6% |
| FFQ-Na + DSQ and 24 h Uri-Na | 49.2% | 27.1% |
| FFQ-Na + DSQ and 3-day food record | 48.0% | 27.8% |
| 24 h Uri-Na and 3-day food record | 54.3% | 22.0% |
Publisher’s Note: MDPI stays neutral with regard to jurisdictional claims in published maps and institutional affiliations. |
© 2020 by the authors. Licensee MDPI, Basel, Switzerland. This article is an open access article distributed under the terms and conditions of the Creative Commons Attribution (CC BY) license (http://creativecommons.org/licenses/by/4.0/).
Share and Cite
Gallani, M.C.; Proulx-Belhumeur, A.; Almeras, N.; Després, J.-P.; Doré, M.; Giguère, J.-F. Development and Validation of a Salt Food Frequency Questionnaire (FFQ-Na) and a Discretionary Salt Questionnaire (DSQ) for the Evaluation of Salt Intake among French-Canadian Population. Nutrients 2021, 13, 105. https://doi.org/10.3390/nu13010105
Gallani MC, Proulx-Belhumeur A, Almeras N, Després J-P, Doré M, Giguère J-F. Development and Validation of a Salt Food Frequency Questionnaire (FFQ-Na) and a Discretionary Salt Questionnaire (DSQ) for the Evaluation of Salt Intake among French-Canadian Population. Nutrients. 2021; 13(1):105. https://doi.org/10.3390/nu13010105
Chicago/Turabian StyleGallani, Maria Cecilia, Alexandra Proulx-Belhumeur, Natalie Almeras, Jean-Pierre Després, Michel Doré, and Jean-François Giguère. 2021. "Development and Validation of a Salt Food Frequency Questionnaire (FFQ-Na) and a Discretionary Salt Questionnaire (DSQ) for the Evaluation of Salt Intake among French-Canadian Population" Nutrients 13, no. 1: 105. https://doi.org/10.3390/nu13010105
APA StyleGallani, M. C., Proulx-Belhumeur, A., Almeras, N., Després, J.-P., Doré, M., & Giguère, J.-F. (2021). Development and Validation of a Salt Food Frequency Questionnaire (FFQ-Na) and a Discretionary Salt Questionnaire (DSQ) for the Evaluation of Salt Intake among French-Canadian Population. Nutrients, 13(1), 105. https://doi.org/10.3390/nu13010105