Lifestyle Risk Factors for Type 2 Diabetes Mellitus and National Diabetes Care Systems in European Countries


Abstract
1. Introduction
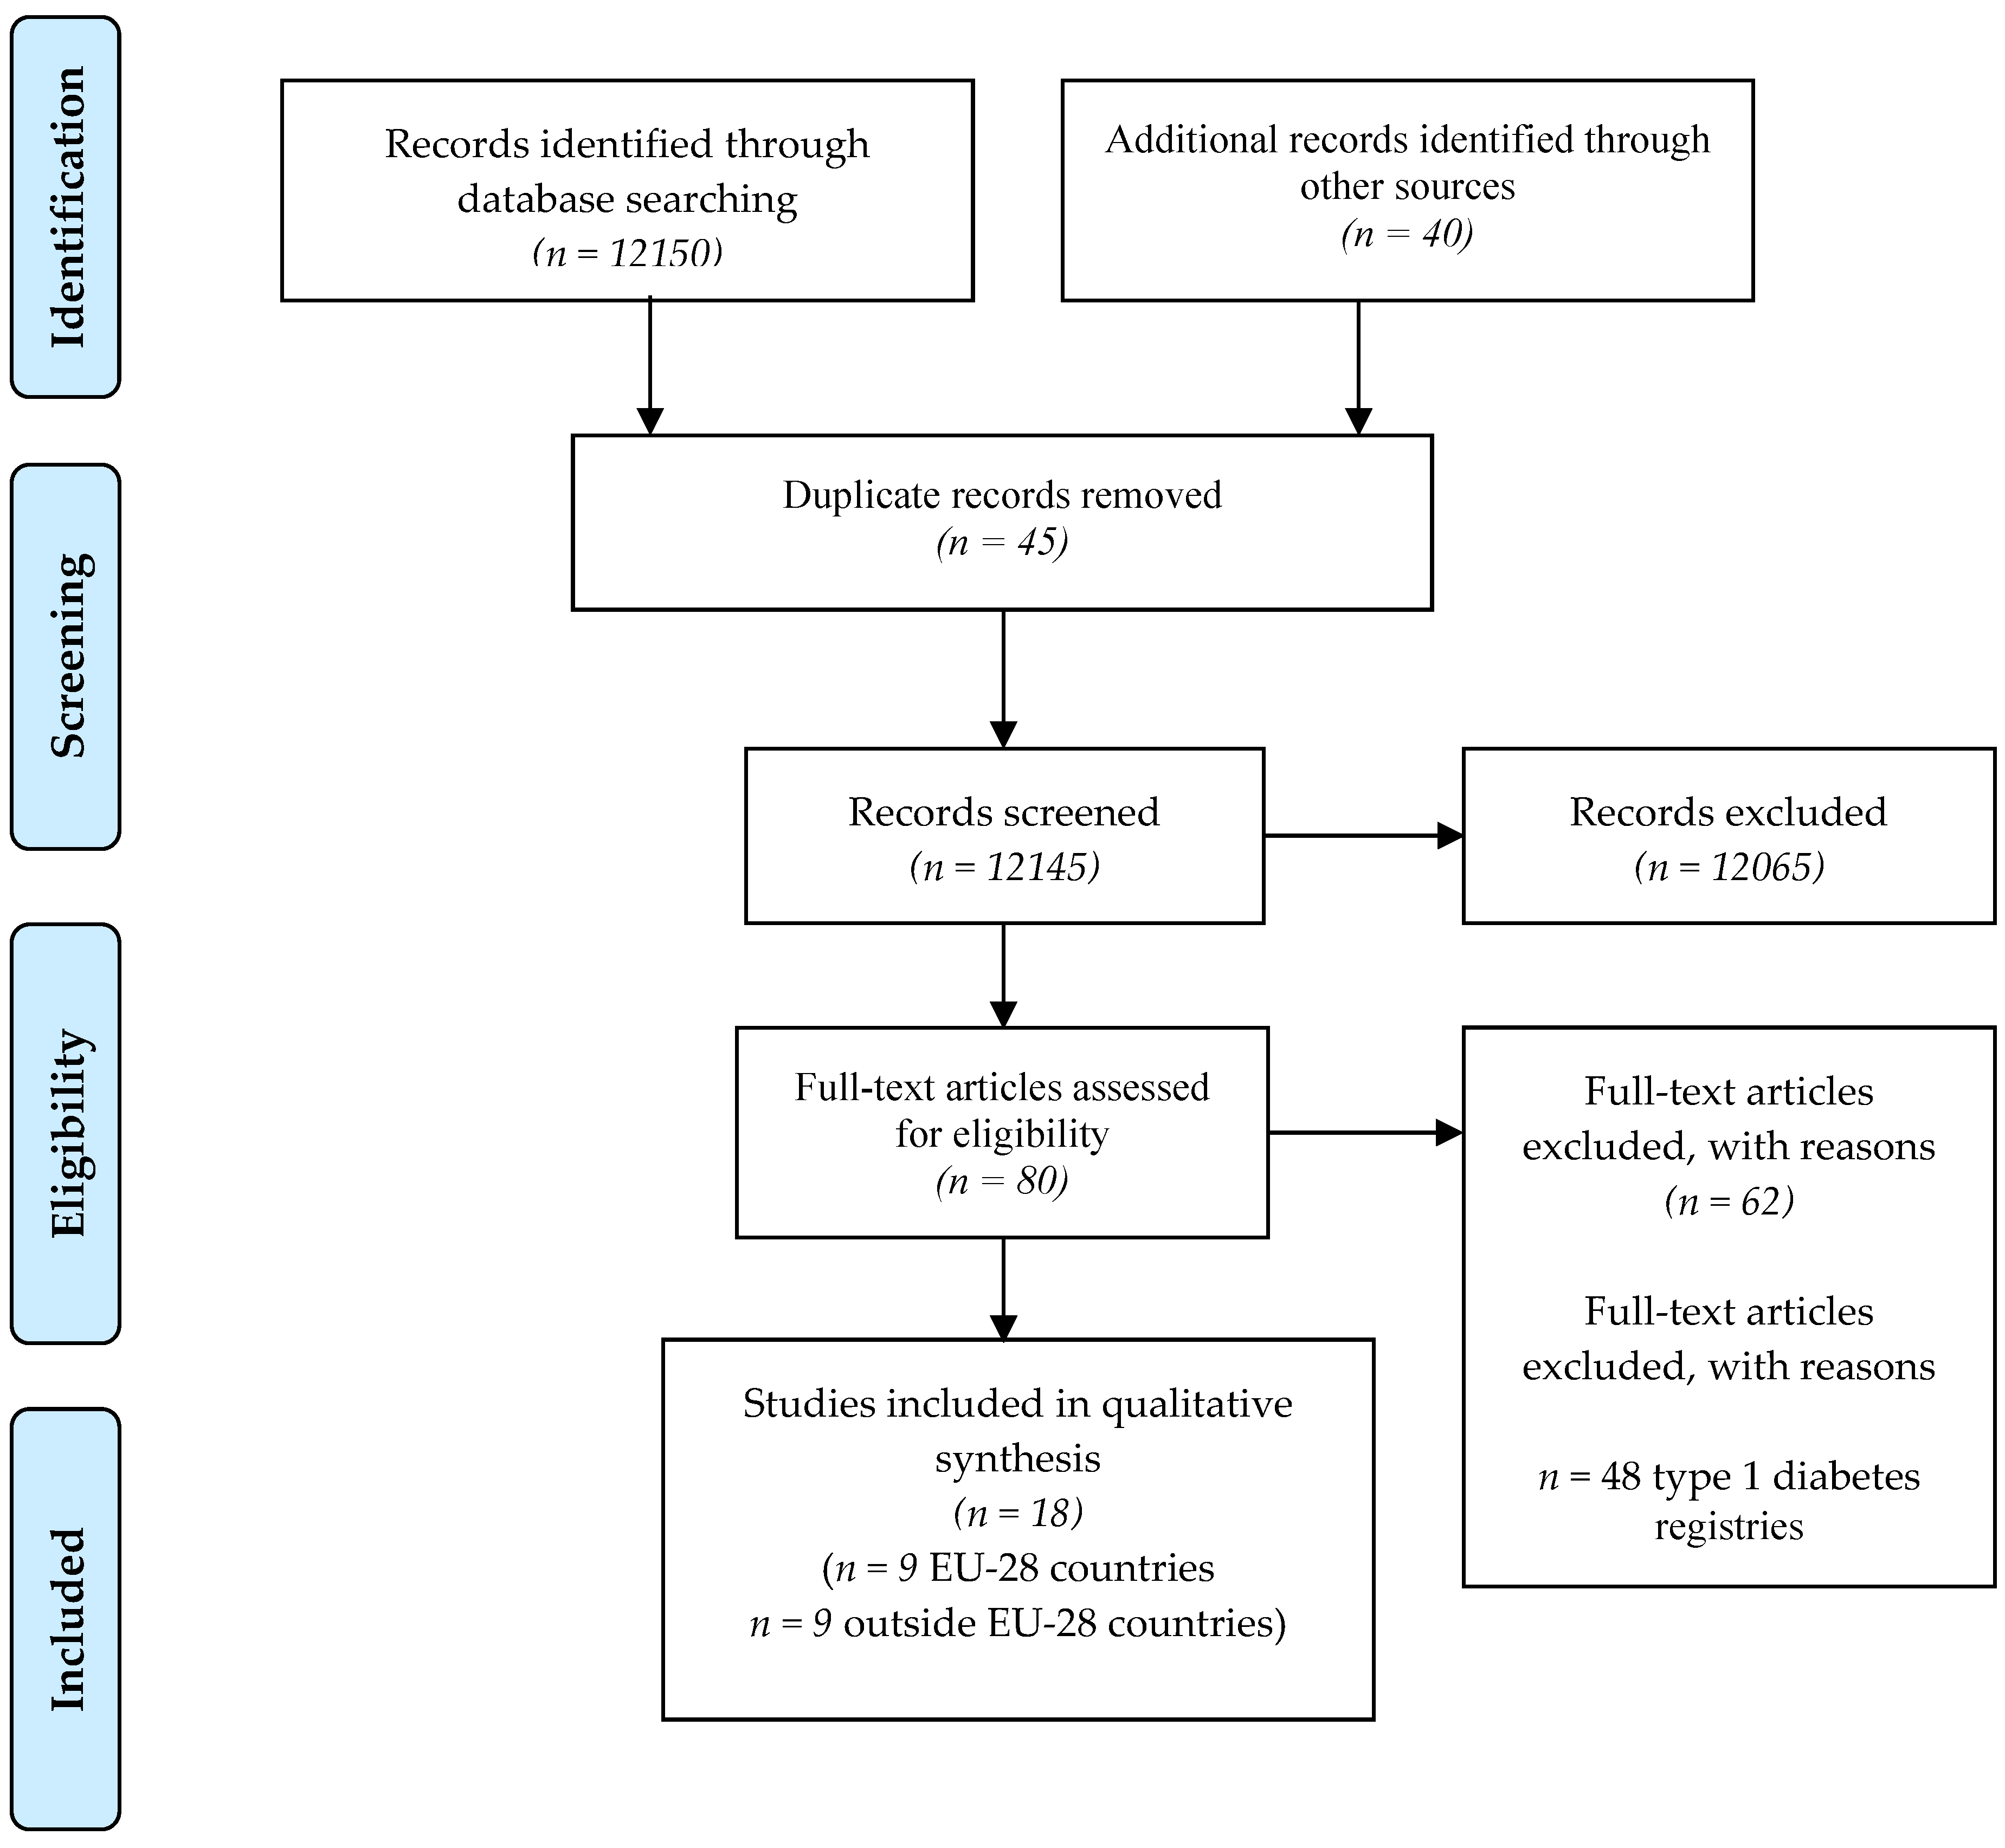
2. Materials and Methods
3. Results
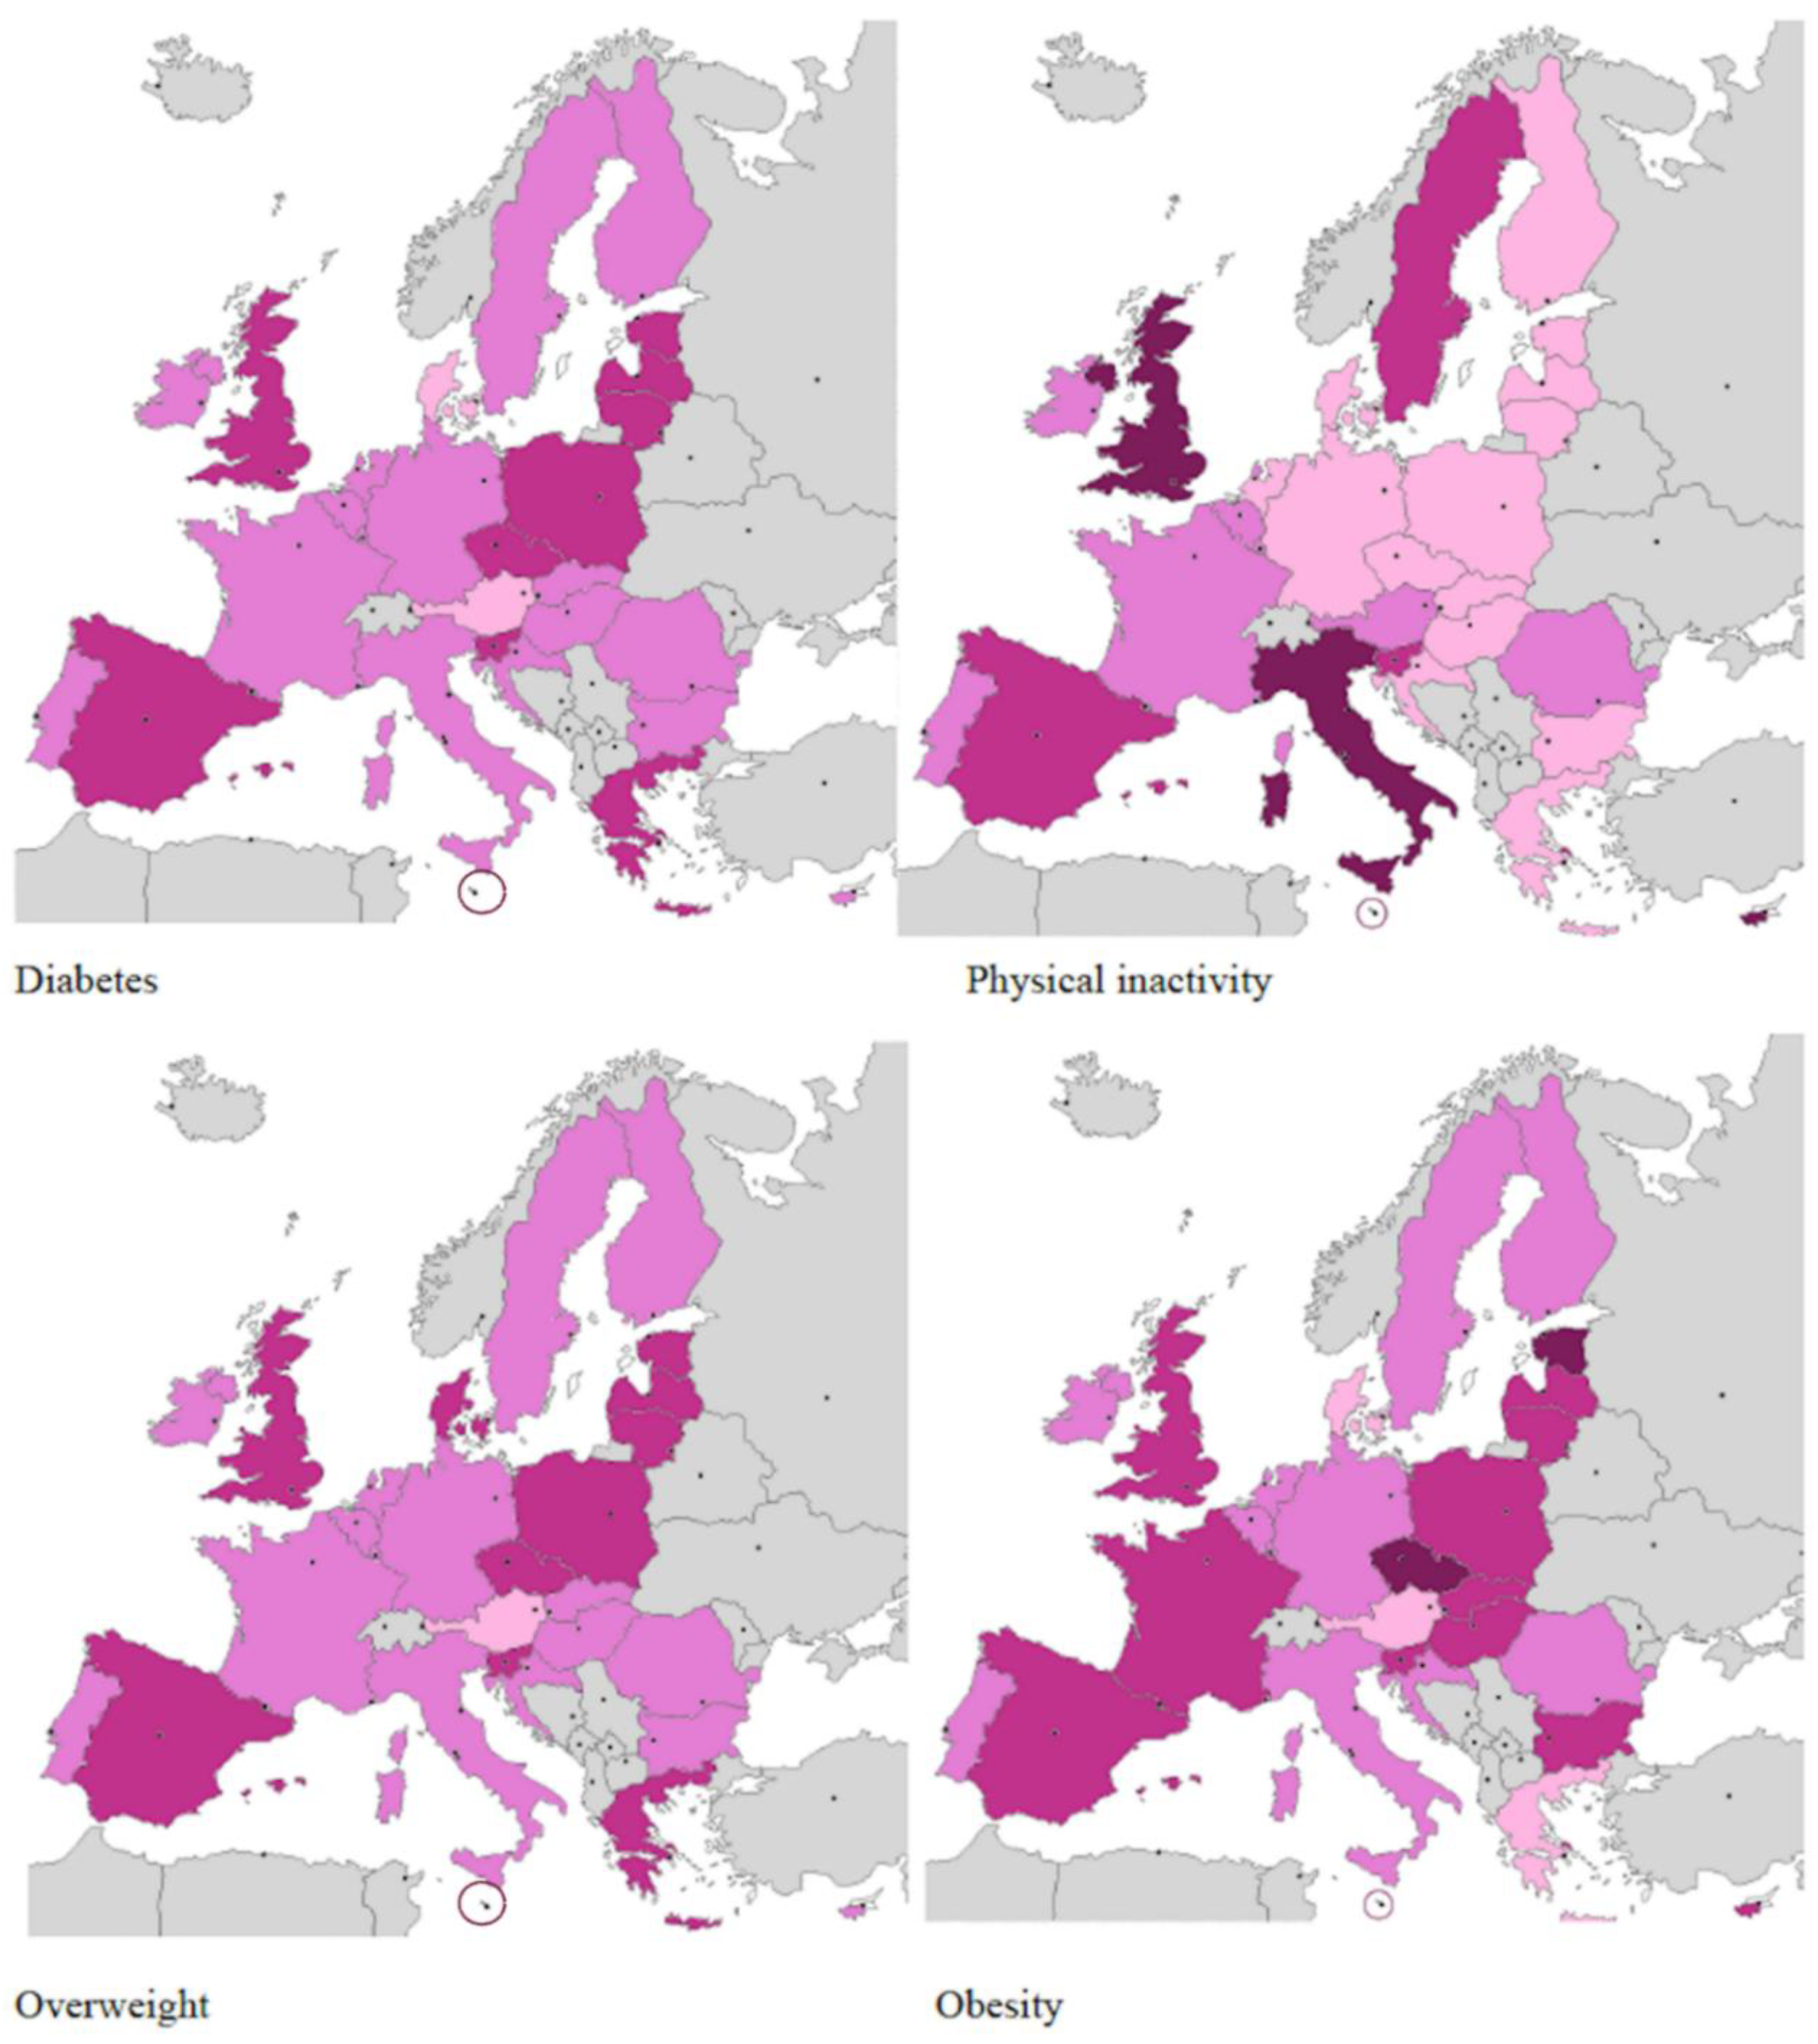
3.1. Risk Factors and Diabetes
3.2. Registries
3.3. Organization of Countries and Costs
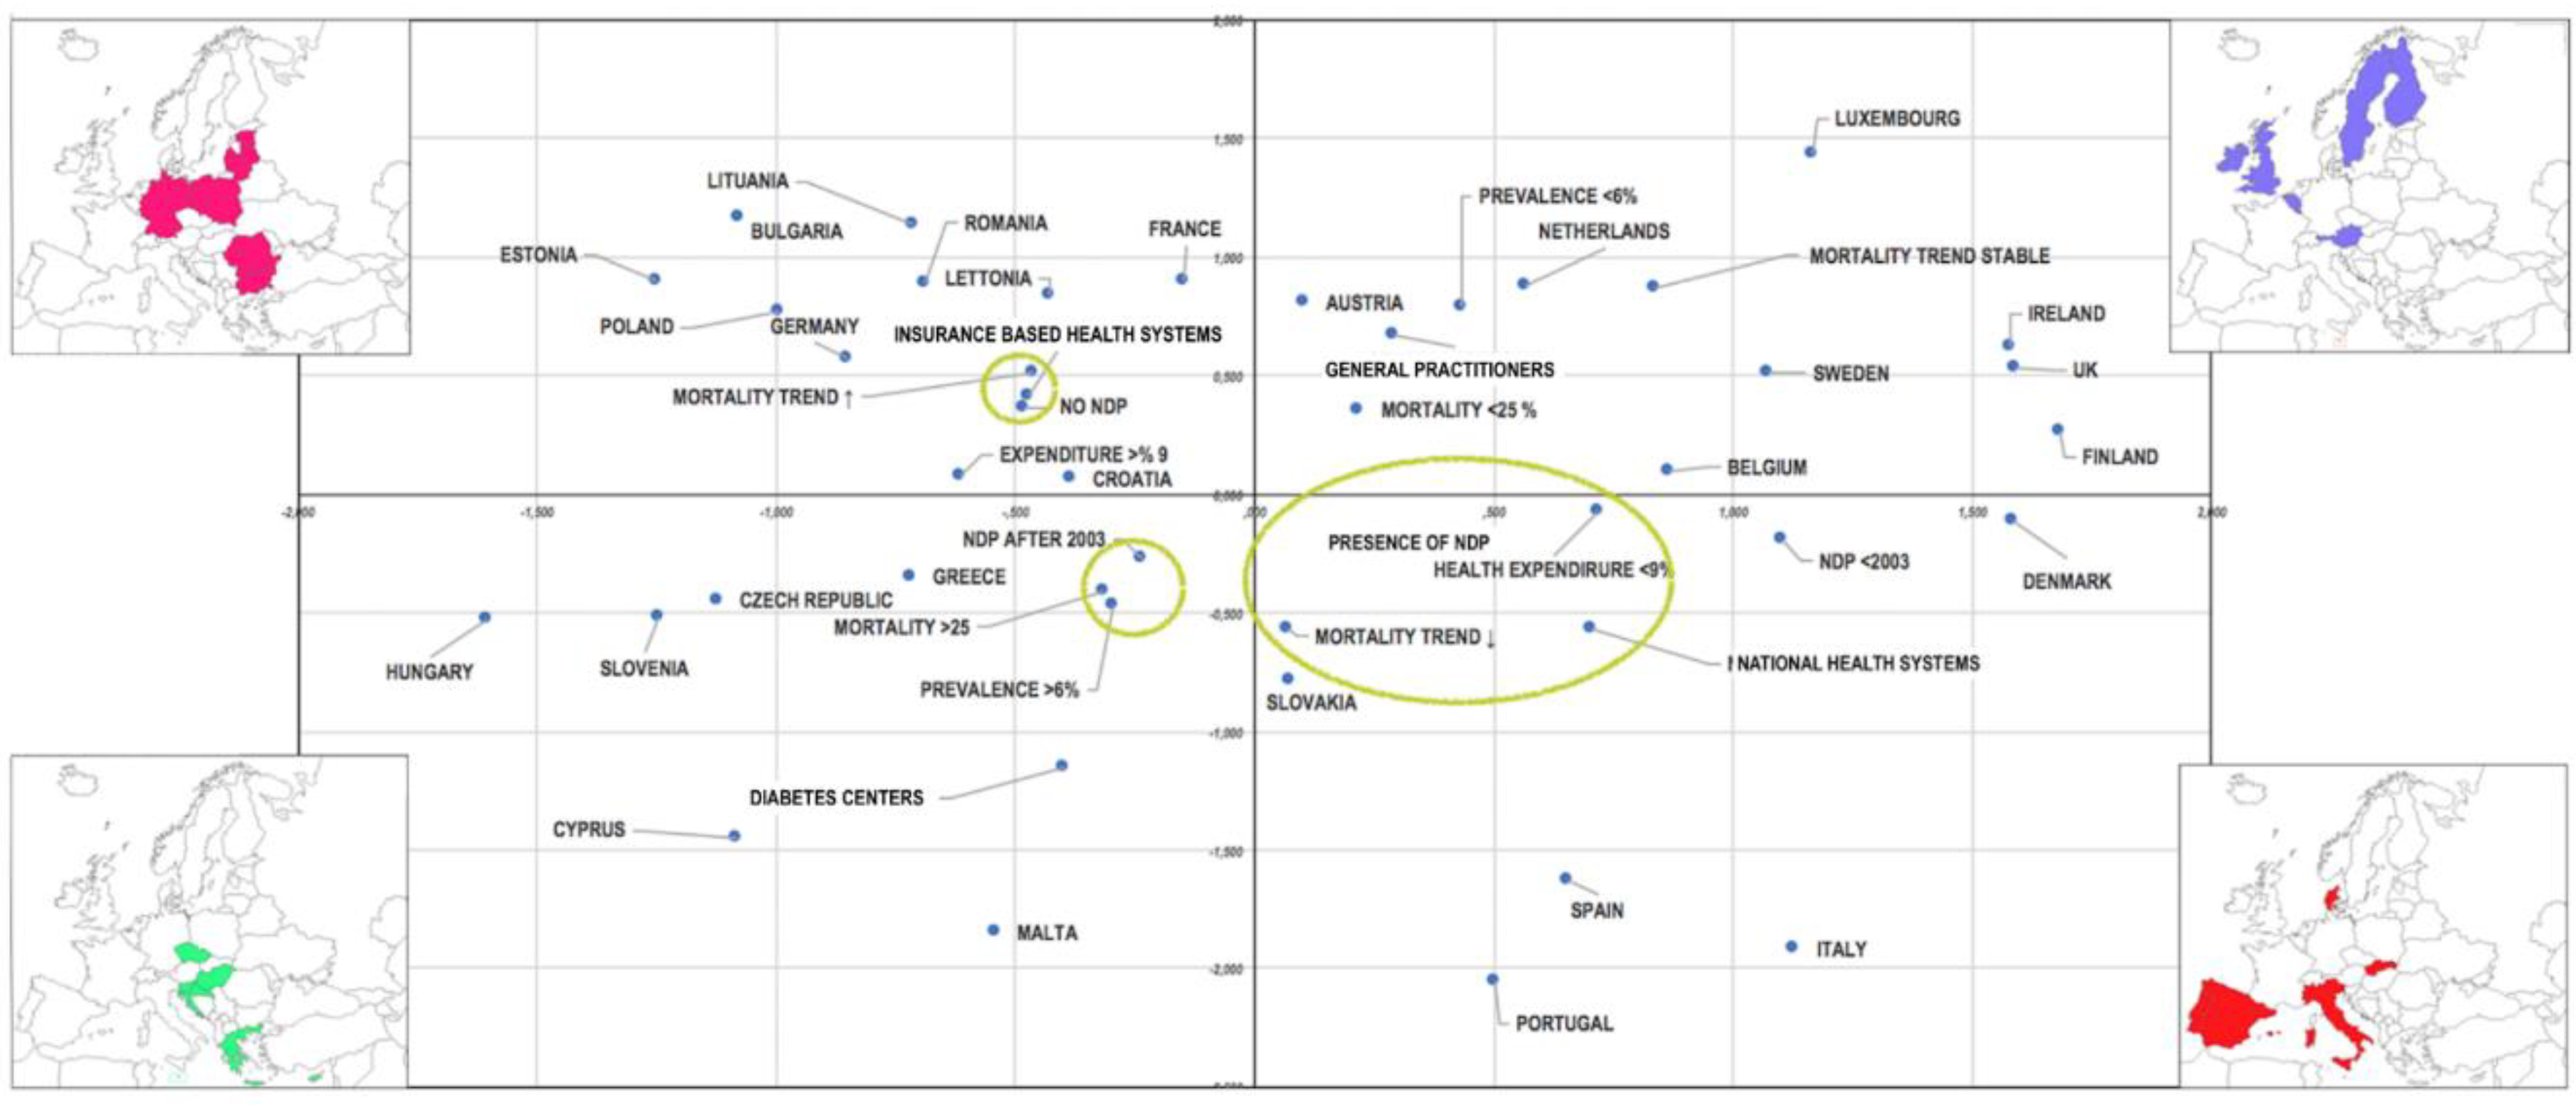
3.4. Multiple Correspondence Analysis
4. Discussion
5. Conclusions
Author Contributions
Funding
Conflicts of Interest
References
- Brussels. IDF Diabetes Atlas, 8th ed.; International Diabetes Federation: Brussels, Belgium, 2017. [Google Scholar]
- Van Der Zijl, N.J.; Goossens, G.H.; Moors, C.C.; van Raalte, D.H.; Muskiet, M.H.; Pouwels, P.J.W.; Blaak, E.E.; Diamant, M. Ectopic fat storage in the pancreas, liver, and abdominal fat depots: Impact on β-cell function in individuals with impaired glucose metabolism. J. Clin. Endocrinol. Metab. 2011, 96, 459–467. [Google Scholar] [CrossRef] [PubMed]
- Kolb, H.; Martin, S. Environmental/lifestyle factors in the pathogenesis and prevention of type 2 diabetes. BMC Med. 2017, 15, 131. [Google Scholar] [CrossRef] [PubMed]
- Eurodiab ACE Study Group. Variation and Trends in Incidence of Childhood Diabetes in Europe. Lancet 2000, 355, 873–876. [Google Scholar] [CrossRef]
- Altobelli, E.; Petrocelli, R.; Verrotti, A.; Chiarelli, F.; Marziliano, C. Genetic and environmental factors affect the onset of type 1 diabetes mellitus. Pediatr. Diabetes 2016, 17, 559–566. [Google Scholar] [CrossRef] [PubMed]
- Bruno, G.; Maule, M.; Merletti, F.; Falorni, A.; Iannilli, A.; Iughetti, L.; Altobelli, E.; d’Annunzio, G.; Piffer, S.; Pozzilli, P.; et al. Age-period-cohort analysis of 1990–2003 incidence time trends of childhood diabetes in Italy: The RIDI study. Diabetes 2010, 59, 2281–2287. [Google Scholar] [CrossRef]
- Facts about diabetes in Denmark. Available online: https://diabetes.dk/diabetesforeningen/in-english/facts-about-diabetes-in-denmark.aspx (accessed on 7 July 2020).
- Vinagre, I.; Mata-Cases, M.; Hermosilla, E.; Morros, R.; Fina, F.; Rosell, R.; Castell, C.; Franch-Nadal, J.; Bolíbar, B.; Mauricio, D. Control of glycemia and cardiovascular risk factors in patients with type 2 diabetes in primary care in Catalonia (Spain). Diabetes Care 2012, 35, 774–779. [Google Scholar] [CrossRef]
- Ballotari, P.; Vicentini, M.; Manicardi, V.; Gallo, M.; Chiatamone Ranieri, S.; Greci, M.; Giorgi Rossi, P. Diabetes and risk of cancer incidence: Results from a population-based cohort study in northern Italy. BMC Cancer 2017, 17, 703. [Google Scholar] [CrossRef]
- Tamayo, T.; Brinks, R.; Hoyer, A.; Kuß, O.S.; Rathmann, W. The Prevalence and Incidence of Diabetes in Germany. Dtsch. Arztebl. Int. 2016, 113, 177–182. [Google Scholar]
- Diabetes facts and numbers 2012. Annual Report Diabetes Observatory. Available online: https://www.dgs.pt/estatisticas-de-saude/estatisticas-de-saude/publicacoes/diabetes-facts-and-numbers-20121.aspx (accessed on 7 July 2020).
- Marja, N.; Klas, W. Diabetes in Finland Prevalence and Variation in Quality of Care. Finnish Diabetes Association STAKES—National Research and Development Centre for Welfare and Health. Available online: https://www.diabetes.fi/files/1105/Diabetes_in_Finland._Prevalence_and_Variation_in_Quality_of_Care (accessed on 7 July 2020).
- Bruno, G.; Karaghiosoff, L.; Merletti, F.; Costa, G.; De Maria, M.; Panero, F.; Segre, O.; Cavallo-Perin, P.; Gnavi, R. The impact of diabetes on prescription drug costs: The population-based Turin study. Diabetologia 2008, 51, 795–801. [Google Scholar] [CrossRef]
- Osservatorio ARNO Diabete. Il profilo assistenziale della popolazione con diabete Rapporto 2017. Available online: http://arno.cineca.it/journal/wpcontent/uploads/2017/10/Diabete_2017_con-copertina.pdf (accessed on 7 July 2020).
- Andersson, T.; Ahlbom, A.; Carlsson, S. Diabetes Prevalence in Sweden at Present and Projections for Year 2050. PLoS ONE 2015, 10, e0143084. [Google Scholar] [CrossRef]
- Centre for Health protection. Non-communicable disease watch. Diabetes Mellitus: A Major Public Health Challenge in the 21st Century. Available online: https://www.chp.gov.hk/files/pdf/ncd_watch_oct2012.pdf (accessed on 7 July 2020).
- Statistics Canada. Health Fact Sheets. Diabetes 2017. Available online: https://www150.statcan.gc.ca/n1/pub/82-625-x/2018001/article/54982-eng.htm (accessed on 7 July 2020).
- Information Paper on Diabetes in Singapore. Available online: https://www.nrdo.gov.sg/docs/librariesprovider3/default-document-library/diabetes-info-paper-v6.pdf?sfvrsn= (accessed on 7 July 2020).
- National Diabetes Registry Report. Available online: https://www.moh.gov.my/moh/resources/Penerbitan/Rujukan/NCD/Diabetes/National_Diabetes_Registry_Report_Vol_1_2009_2012.pdf (accessed on 7 July 2020).
- State of Israel. Ministry of Health. The national diabetes registry. Available online: https://www.health.gov.il/English/MinistryUnits/ICDC/disease_Registries/Pages/diabetes_reg.aspx (accessed on 7 July 2020).
- Cooper, G.J.; Thue, G.; Claudi, T.; Løvaas, K.; Carlsen, S.; Sandberg, S. The Norwegian Diabetes Register for Adults—An overview of the first years. Nor. Epidemiol. 2013, 23, 29–34. [Google Scholar] [CrossRef]
- US Department of Health and Human Services. Centre for Disease Control and Prevention. National Diabetes Statistics report 2020. Available online: https://www.cdc.gov/diabetes/pdfs/data/statistics/national-diabetes-statistics-report.pdf (accessed on 7 July 2020).
- National (insulin-treated) Diabetes Register (NDR) *. Available online: https://www.aihw.gov.au/about-our-data/our-data-collections/national-insulin-treated-diabetes-register (accessed on 7 July 2020).
- Dedov, I.I.; Shestakova, M.V.; Vikulova, O.K. Epidemiology of diabetes mellitus in Russian Federation: Clinical and statistical report according to the federal diabetes registry. Available online: https://endojournals.ru/index.php/dia/article/view/8664 (accessed on 7 July 2020).
- Richardson, E.; Zaletel, J.; Nolte, E. National Diabetes Plan in Europe. What lessons are there for the prevention and control of chronic diseases in Europe, CHORDIS. Available online: http://chrodis.eu/ (accessed on 7 July 2020).
- Gupta, N.; Ayles, H.M. Effects di pay-for-performance for primary care physicians on Diabetes outcomes in single-payer health systems: A systematic review. Eur. J. Health Econ. 2019, 20, 1303–1315. [Google Scholar] [CrossRef] [PubMed]
- Glechner, A.; Keuchel, L.; Affengruber, L.; Titscher, V.; Sommer, I.; Matyas, N.; Wagner, G.; Kien, C.; Klerings, I.; Gartlehner, G. Effects di lifestyle changes on adults with pre Diabete: A systematic review and meta-analysis. Prim. Care Diabetes 2018, 12, 393–408. [Google Scholar] [CrossRef] [PubMed]
- Nishtar, S.; Niinistö, S.; Sirisena, M.; Vázquez, T.; Skvortsova, V.; Rubinstein, A.; Mogae, F.G.; Mattila, P.; Ghazizadeh Hashemi, S.H.; Kariuki, S.; et al. Commissioners di the WHO Independent Alta-Level Commission on NCDs. Time to deliver: Report di the WHO Independent Alta-Level Commission on NCDs. Lancet 2018, 392, 245–252. [Google Scholar] [CrossRef]
- Tsigos, C.; Bitzur, R.; Kleinman, Y.; Cohen, H.; Cahn, A.; Brambilla, G.; Mancia, G.; Grassi, G. Targets for body fat, blood pressure, lipids, and glucose-Bassaering interventions in healthy older people. Diabetes Care 2013, 36, S292–S300. [Google Scholar] [CrossRef]
- Krzysztoszek, J.; Laudańska-Krzemińska, I.; Bronikowski, M. Assessment di epidemiological Obesity among adults in EU countries. Ann. Agric. Environ. Med. 2019, 26, 341–349. [Google Scholar] [CrossRef]
- Altobelli, E.; Rapacchietta, L.; Angeletti, P.M.; Barbante, L.; Profeta, F.V.; Fagnano, R. Breast Cancer Screening Programmes across the WHO European Region: Differences among Countries Based on National Income Level. Int. J. Environ. Res. Public Health 2017, 14, 452. [Google Scholar] [CrossRef]
- Moher, D.; Liberati, A.; Tetzlaff, J.; Altman, D.G.; PRISMA Group. Preferred reporting items for systematic reviews and meta-analyses: The PRISMA statement. PLoS Med. 2009, 6, e1000097. [Google Scholar] [CrossRef]
- Eurostat. Death Due To Diabetes Mellitus, by Sex. Available online: https://ec.europa.eu/eurostat/databrowser/view/tps00137/default/table?lang=en (accessed on 7 July 2020).
- WHO. Diabetes Country Profiles. Available online: https://www.who.int/diabetes/country-profiles/en/ (accessed on 7 July 2020).
- EU Research on Diabetes. Available online: https://ec.europa.eu/info/research-and-innovation/research-area/health-research-and-innovation/diabetes_en (accessed on 7 July 2020).
- Felton, A.-M.; Hall, M. Diabetes in Europe policy puzzle: The state we are in. Int. Diabetes Nurs. 2015, 12, 3–7. [Google Scholar] [CrossRef]
- World Bank. Country and Lending Groups. Available online: https://datahelpdesk.worldbank.org/knowledgebase/articles/906519-world-bank-country-and-lending-groups (accessed on 7 July 2020).
- Zhang, P.; Zhang, X.; Brown, J.; Vistisen, D.; Sicree, R.; Shaw, J.; Nichols, G. Global healthcare expenditure on diabetes for 2010 and 2030. Diabetes Res. Clin. Pract. 2010, 87, 293–301. [Google Scholar] [CrossRef]
- Wagner, E.H.; Austin, B.T.; Von Korff, M. Organizing care for patients with chronic illness. Milbank Q. 1996, 74, 511–544. [Google Scholar] [CrossRef] [PubMed]
- Wagner, E.H. Organizing Care for Patients with Chronic Illness Revisited. Milbank Q. 2019, 97, 659–664. [Google Scholar] [CrossRef] [PubMed]
- Bongaerts, B.W.; Müssig, K.; Wens, J.; Lang, C.; Schwarz, P.; Roden, M.; Rathmann, W. Effectiveness of chronic care models for the management of type 2 diabetes mellitus in Europe: A systematic review and meta-analysis. BMJ Open 2017, 7, e013076. [Google Scholar] [CrossRef] [PubMed]
- Sørensen, M.; Korsmo-Haugen, H.K.; Maggini, M.; Kuske, S.; Icks, A.; Rothe, U.; Lindström, J.; Zaletel, J. Joint Action on Chronic Diseases and Promoting Healthy Ageing across the Life Cycle (JA-CHRODIS). Health promotion interventions in type 2 diabetes. Ann. IST Super Sanita. 2015, 51, 192–198. [Google Scholar] [PubMed]
- Gentile, S.; Strollo, F.; Ceriello, A. COVID-19 infection in Italian people with diabetes: Lessons learned for our future (an experience to be used). Diabetes Res. Clin. Pract. 2020, 162, 108137. [Google Scholar] [CrossRef] [PubMed]
- Knapp, S. Diabetes and infection: Is there a link?—A mini-review. Gerontology 2013, 59, 99–104. [Google Scholar] [CrossRef] [PubMed]
- Lee, J.Y.; Lee, S.W.H. Telemedicine Cost—Effectiveness for Diabetes Management: A Systematic Review. Diabetes Technol. Ther. 2018, 20, 492–500. [Google Scholar] [CrossRef]
- Su, D.; Zhou, J.; Kelley, M.S.; Michaud, T.L.; Siahpush, M.; Kim, J.; Wilson, F.; Stimpson, J.P.; Pagán, J.A. Does telemedicine improve treatment outcomes for diabetes? A meta-analysis of results from 55 randomized controlled trials. Diabetes Res. Clin. Pract. 2016, 116, 136–148. [Google Scholar] [CrossRef]
- Action to Control Cardiovascular Risk in Diabete Study Group; Gerstein, H.C.; Miller, M.E.; Byington, R.P.; Gdif, D.C., Jr.; Bigger, J.T.; Buse, J.B.; Cushman, W.C.; Genuth, S.; Ismail-Beigi, F.; et al. Effects di intensive glucose Bassaering in type 2 Diabetes. N. Engl. J. Med. 2008, 358, 2545–2559. [Google Scholar]
- Karanikolos, M.; Mladovsky, P.; Cylus, J. Financial crisis, austerity, and health in Europe. Lancet 2013, 381, 1323–1331. [Google Scholar] [CrossRef]
- Devisch, I.; Vanheule, S. Foucault at the bedside: A critical analysis of empowering a healthy lifestyle. J. Eval. Clin. Pract. 2015, 21, 427–432. [Google Scholar] [CrossRef] [PubMed]
- The Lancet Public Health. Time to tackle the physical activity gender gap. Lancet Public Health 2019, 4, e360. [Google Scholar] [CrossRef]
- Althoff, T.; Sosič, R.; Hicks, J.L.; King, A.C.; Delp, S.L.; Leskovec, J. Large-scale physical activity data reveal worldwide activity inequality. Nature 2017, 547, 336–339. [Google Scholar] [CrossRef] [PubMed]
- Robroek, S.J.; van den Berg, T.I.; Plat, J.F.; Burdorf, A. The role of obesity and lifestyle behaviours in a productive workforce. Occup. Environ. Med. 2011, 68, 134–139. [Google Scholar] [CrossRef]
- OECD. The Heavy Burden of Obesity: The Economics of Prevention, OECD Health Policy Studies; OECD Publishing: Paris, France, 2019. [Google Scholar] [CrossRef]

| LEGEND | ||||
|---|---|---|---|---|
| Diabetes (%) | 7.1–7.9 | 8.0–8.9 | 9.0–10.9 | >11 |
| Physical Inactivity (%) | <20 | 20.1–29.9 | 30–39.9 | >4 |
| Overweight (%) | <60 | 60.1–64.9 | 65–69.9 | >70 |
| Obesity (%) | <22 | 22.1–25.9 | 26–28.9 | >29 |

| LEGEND | ||||
|---|---|---|---|---|
| Diabetes (%) | <6 | 6.1–7.9 | 8.0–9.9 | >10 |
| Physical Inactivity (%) | <30 | 30.1–34.9 | 35–39.9 | >40 |
| Overweight (%) | <50 | 50.1–59.9 | 60–66.9 | >70 |
| Obesity (%) | <20 | 20.1–24.9 | 25–29.9 | >30 |


| Nation | Income | Overweight (%) | Obesity (%) | Physical Inactivity (%) | Diabetes (%) | ||||||||
|---|---|---|---|---|---|---|---|---|---|---|---|---|---|
| Total | Men | Women | Total | Men | Women | Total | Men | Women | Total | Men | Women | ||
| Austria | High | 56.6 | 64.4 | 49.2 | 20.1 | 22.1 | 18.1 | 26.4 | 21.1 | 31.3 | 6 | 7.1 | 5 |
| Belgium | High | 60.5 | 69 | 52.3 | 22.1 | 24 | 20.2 | 37.4 | 31.5 | 42.9 | 6.4 | 7.5 | 5.4 |
| Bulgaria | Upper-Middle | 63.6 | 67.8 | 59.7 | 25.6 | 23.6 | 27.5 | 23 | 19 | 26.7 | 10.3 | 10.7 | 10 |
| Croatia | High | 62.9 | 67.8 | 58.4 | 25.6 | 24.3 | 26.8 | 19.8 | 16.8 | 22.5 | 9.9 | 10.7 | 9.2 |
| Cyprus | High | 61.8 | 64.7 | 58.7 | 24.5 | 22.3 | 26.8 | 35.3 | 29.3 | 41.5 | 7.8 | 8.9 | 6.7 |
| Czech Republic | High | 67.2 | 72.8 | 61.8 | 29.1 | 28.1 | 30.1 | 26.2 | 24.1 | 28.2 | 9.9 | 10.7 | 9.2 |
| Denmark | High | 58.7 | 67.5 | 60 | 210 | 23.3 | 18.8 | 26.6 | 24.3 | 28.9 | 6.1 | 7.2 | 5 |
| Estonia | High | 67.2 | 72.8 | 61.8 | 29.1 | 28.1 | 30.1 | 26.2 | 24 | 28.2 | 9.6 | 10.2 | 9.1 |
| Finland | High | 59.4 | 65.6 | 53.4 | 22.8 | 23.4 | 22.2 | 26.2 | 24.2 | 28.1 | 7.7 | 8.7 | 6.8 |
| France | High | 64.1 | 69.6 | 58.6 | 25.7 | 25.3 | 26.1 | 26.4 | 21.2 | 31.2 | 8 | 9.5 | 6.6 |
| Germany | High | 59.7 | 67 | 52.7 | 22.7 | 24.1 | 21.4 | 23.4 | 20.1 | 26.5 | 7.4 | 8.4 | 6.4 |
| Greece | High | 64.29 | 69.6 | 60.2 | 25.1 | 23.6 | 18.2 | 15.4 | 12.4 | 15.4 | 9.1 | 9.5 | 8.8 |
| Hungary | High | 63.3 | 69.4 | 57.8 | 26 | 25.5 | 26.5 | 20 | 18.5 | 23 | 10 | 10.6 | 9.4 |
| Ireland | High | 62.9 | 68.8 | 57.1 | 27 | 27.3 | 26.8 | 36 | 30.6 | 41.2 | 7.3 | 8.4 | 6.2 |
| Italy | High | 64 | 68.7 | 59.5 | 23.7 | 22.5 | 24.8 | 35.9 | 30 | 41.3 | 8.5 | 9.6 | 7.4 |
| Latvia | High | 64.3 | 59.1 | 61.5 | 25.6 | 23.2 | 27.7 | 23.8 | 19.3 | 27.3 | 9.4 | 9.2 | 9.6 |
| Lithuania | High | 62.8 | 64.2 | 61.7 | 27.5 | 23.2 | 27.7 | 23.8 | 19.3 | 27.3 | 9.7 | 9.8 | 9.5 |
| Luxemburg | High | 61 | 70.7 | 51.5 | 24.8 | 28.3 | 21.3 | 30 | 28.2 | 31.7 | 6.8 | 8.3 | 5.3 |
| Malta | High | 69.6 | 71.6 | 63.7 | 28.7 | 26.2 | 31.1 | 45.2 | 40.3 | 49.4 | 10.1 | 11.4 | 8.8 |
| Poland | High | 64.2 | 68.2 | 60.5 | 27 | 24.8 | 29.1 | 20.5 | 14.4 | 26 | 9.5 | 9.8 | 9.3 |
| Portugal | High | 59.8 | 65 | 55 | 22.1 | 21.4 | 22.8 | 37.3 | 33.5 | 40.8 | 9.2 | 10.7 | 7.8 |
| Romania | Upper-Middle | 60.8 | 65.2 | 56.5 | 23.4 | 21.8 | 24.9 | 26.5 | 19.1 | 33.3 | 8.4 | 8.5 | 8.4 |
| Slovakia | High | 64 | 68.5 | 59.7 | 27.4 | 25.9 | 28.3 | 19.2 | 16.8 | 21.4 | 9.5 | 9.8 | 9.8 |
| Slovenia | High | 64.8 | 69.9 | 59.7 | 27.4 | 26.7 | 28.2 | 24.1 | 18.5 | 29.2 | 8.6 | 9.2 | 8.1 |
| Spain | High | 65.6 | 70.3 | 60.9 | 26.5 | 24.9 | 28 | 33.4 | 29.2 | 37.4 | 9.4 | 10.6 | 8.2 |
| Sweden | High | 59.2 | 65.9 | 52.4 | 22 | 23.6 | 20.4 | 31.1 | 26.2 | 35.8 | 6.9 | 7.8 | 6 |
| The Netherlands | High | 59.8 | 67.2 | 52.6 | 21.9 | 23.2 | 20.6 | 19.9 | 16 | 19.7 | 6.1 | 7.0 | 6.1 |
| United Kingdom | High | 66.7 | 71.1 | 62.4 | 29.8 | 28.5 | 31.1 | 40.4 | 35.4 | 44.3 | 7.7 | 5.4 | 6.9 |
| Country | % Case Ascertainment | Year | Primary Source | Secondary Source | Others Sources | Prevalence | ||
|---|---|---|---|---|---|---|---|---|
| Male | Female | Total | ||||||
| EU-28 | ||||||||
| Denmark [7] | 100% | 2007 | Hospital database | Pharmaceutical database | 4.3 | 4.1 | 4.2 | |
| Spain, Catalonia [8] | - | 2009 | SIDIAP database (general practitioners) | Pharmaceutical database | - | - | 7.6 | |
| Italy, Reggio-Emilia [9] | 80% | 2009 | Medical tax exemption database | Hospital database | Hospital database | 5.3 | 4.4 | 4.8 |
| Germany [10] | 2010 | Medical database | Pharmaceutical database | 7.4 | 6.9 | - | ||
| Portugal [11] | - | 2012 | - | - | - | - | - | 12.7 |
| Finland, North Karelia [12] | - | 2012 | Regional surveillance system | Laboratory database | - | - | 6.2 | |
| Italy, Piedmont [13] | 79% | 2013 | Regional surveillance system | Medical tax exemption database | Hospital database | 4.6 | 4.8 | - |
| Italy, ARNO Consortium [14] | - | 2015 | Pharmaceutical database | Hospital database | Medical tax exemption database | - | - | 6.2 |
| Sweden [15] | 2015 | Pharmaceutical database | Hospital database | 7.9 | 5.8 | 6.8 | ||
| OUTSIDE EU-28 | ||||||||
| Hong Kong [16] | - | 1999–2008 | Insurance database | Laboratory database | pharmacological prescriptions | 11.4 | 9.3 | 10.4 |
| Canada [17] | - | 2009 | National surveillance diabetes system | Insurance database | Hospital database | - | - | 6.4 |
| Singapore [18] | - | 2010 | Insurance database | Laboratory database on HbA1c, pharmacological prescriptions | Insurance database | - | - | 13.3 |
| Malesia [19] | - | 2011 | Patients registration to surveillance system | Medical follow-up | Clinical audit, laboratory database on HbA1c, pharmacological prescriptions | - | - | 15.2 |
| Israel [20] | - | 2014 | Laboratory database on HbA1c | Pharmacological prescriptions | - | - | 9.0 | |
| Norway [21] | - | 2014 | Database Noklus (general practitioners and diabetologist) | Laboratory database | Pharmaceutical database | 6.8 | 5.3 | 6.1 |
| United States [22] | - | 2015 | National surveillance diabetes system | 9.4 | 9.2 | 9.3 | ||
| Australia [23] | - | 2016 | National surveillance diabetes system | Country or regional database | National survey | 6.8 | 5.4 | 6.1 |
| Russian Federation [24] | - | 2016 | National surveillance diabetes system | National statistical data | 4.7 | 6.1 | 5.5 | |
| Nation | Health System | National Diabetic Plan (NDP) | Registry | Setting | Drugs Reimbursement | Device Reimbursement | Coverage of Comorbidity | Prevalence/1000 | Mortality/100.000 |
|---|---|---|---|---|---|---|---|---|---|
| Austria | Health Insurance System | Yes | No | General Practitioners | Total | Total | Partial | 4.9 | 39.0 |
| Belgium | Health Insurance System | Yes | No | General Practitioners | Total | Total | Total | 6.3 | 12.9 |
| Bulgaria | Health Insurance System | No | No | General Practitioners | Partial | Partial | Partial | 5.3 | 22.6 |
| Croatia | National Health System | Yes | Yes | General Practitioners | Total | Total | Total | 7.1 | 47.7 |
| Cyprus | National Health System | No | Yes | Diabetes Centers | Partial | Partial | Partial | 6.1 | 50.3 |
| Czech Republic | Health Insurance System | Yes | No | General Practitioners | Partial | Partial | Partial | 7.7 | 43.7 |
| Denmark | National Health System | Yes | Yes | General Practitioners | Total | Total | Total | 4.6 | 27.3 |
| Estonia | Health Insurance System | No | No | General Practitioners | Partial | Partial | Partial | 7.2 | 14.2 |
| Finland | National Health System | Yes | Yes | General Practitioners | Total | Total | Total | 7.7 | 9.7 |
| France | Health Insurance System | No | No | General Practitioners | Partial | Partial | Partial | 10.0 | 16.7 |
| Germany | Health Insurance System | No | Yes | General Practitioners | Partial | Partial | Partial | 7.2 | 25.4 |
| Greece | National Health System | Yes | No | Diabetes Centers | Partial | Partial | Partial | 9.2 | 14.1 |
| Hungary | Health Insurance System | No | No | Diabetes Centers | Partial | Partial | Partial | 8.1 | 30.6 |
| Ireland | National Health System | Yes | No | General Practitioners | Total | Total | Total | 5.5 | 17.5 |
| Italy | National Health System | Yes | yes | Diabetes Centers | Total | Total | Total | 6.7 | 28.8 |
| Latvia | National Health System | No | Yes | General Practitioners | Partial | Partial | Partial | 4.7 | 28.0 |
| Lithuania | Health Insurance System | Yes | No | General Practitioners | Partial | Partial | Partial | 4.4 | 10.6 |
| Luxemburg | Health Insurance System | No | No | General Practitioners | Total | Total | Total | 5.6 | 14.0 |
| Malta | Health Insurance System | Yes | No | Diabetes Centers | Partial | Total | Partial | 8.3 | 44.6 |
| Poland | Health Insurance System | Yes | No | General Practitioners | Partial | Partial | Partial | 6.6 | 26.1 |
| Romania | Health Insurance System | Yes | Yes | General Practitioners | Partial | Partial | Partial | 5.3 | 14.4 |
| Slovakia | Health Insurance System | Yes | No | Diabetes Centers | Total | Total | Partial | 6.9 | 18.7 |
| Slovenia | Health Insurance System | Yes | No | Diabetes Centers | Partial | Partial | Partial | 6.9 | 15.21 |
| Portugal | National Health System | Yes | Yes | Diabetes Centers | Total | Total | Total | 9.3 | 38.7 |
| Spain | National Health System | Yes | Yes | Diabetes Centers | Total | Total | Total | 6.8 | 18.6 |
| Sweden | National Health System | No | Yes | General Practitioners | Total | Total | Total | 4.8 | 20.8 |
| The Netherlands | Health Insurance System | Yes | No | General Practitioners | Total | Partial | Partial | 5.3 | 19.2 |
| United Kingdom | National Health System | Yes | Yes | General Practitioners | Total | Total | Total | 5.8 | 11.2 |
© 2020 by the authors. Licensee MDPI, Basel, Switzerland. This article is an open access article distributed under the terms and conditions of the Creative Commons Attribution (CC BY) license (http://creativecommons.org/licenses/by/4.0/).
Share and Cite
Altobelli, E.; Angeletti, P.M.; Profeta, V.F.; Petrocelli, R. Lifestyle Risk Factors for Type 2 Diabetes Mellitus and National Diabetes Care Systems in European Countries. Nutrients 2020, 12, 2806. https://doi.org/10.3390/nu12092806
Altobelli E, Angeletti PM, Profeta VF, Petrocelli R. Lifestyle Risk Factors for Type 2 Diabetes Mellitus and National Diabetes Care Systems in European Countries. Nutrients. 2020; 12(9):2806. https://doi.org/10.3390/nu12092806
Chicago/Turabian StyleAltobelli, Emma, Paolo Matteo Angeletti, Valerio F. Profeta, and Reimondo Petrocelli. 2020. "Lifestyle Risk Factors for Type 2 Diabetes Mellitus and National Diabetes Care Systems in European Countries" Nutrients 12, no. 9: 2806. https://doi.org/10.3390/nu12092806
APA StyleAltobelli, E., Angeletti, P. M., Profeta, V. F., & Petrocelli, R. (2020). Lifestyle Risk Factors for Type 2 Diabetes Mellitus and National Diabetes Care Systems in European Countries. Nutrients, 12(9), 2806. https://doi.org/10.3390/nu12092806