The Association between Seafood Intake and Fecundability: Analysis from Two Prospective Studies

 ,
,  ,
,  ,
,  and
and
Abstract
1. Introduction
2. Methods
2.1. Study Population
2.2. Assessment of Seafood and Marine Fatty Acid Intake
2.3. Assessment of Time to Pregnancy
2.4. Assessment of Covariates
2.5. Data Analysis
3. Results
4. Discussion
Supplementary Materials
Author Contributions
Funding
Acknowledgments
Conflicts of Interest
References
- Thoma, M.E.; McLain, A.C.; Louis, J.F.; King, R.B.; Trumble, A.C.; Sundaram, R.; Buck Louis, G.M. Prevalence of infertility in the United States as estimated by the current duration approach and a traditional constructed approach. Fertil. Steril. 2013, 99, 1324–1331. [Google Scholar] [CrossRef] [PubMed]
- Wathes, D.C.; Abayasekara, D.R.; Aitken, R.J. Polyunsaturated fatty acids in male and female reproduction. Biol. Reprod. 2007, 77, 190–201. [Google Scholar] [CrossRef]
- Pischon, T.; Hankinson, S.E.; Hotamisligil, G.S.; Rifai, N.; Willett, W.C.; Rimm, E.B. Habitual dietary intake of n-3 and n-6 fatty acids in relation to inflammatory markers among US men and women. Circulation 2003, 108, 155–160. [Google Scholar] [CrossRef] [PubMed]
- Simopoulos, A.P. The omega-6/omega-3 fatty acid ratio, genetic variation, and cardiovascular disease. Asia Pac. J. Clin. Nutr. 2008, 17 (Suppl. 1), 131–134. [Google Scholar] [PubMed]
- Mumford, S.L.; Chavarro, J.E.; Zhang, C.; Perkins, N.J.; Sjaarda, L.A.; Pollack, A.Z.; Schliep, K.C.; Michels, K.A.; Zarek, S.M.; Plowden, T.C.; et al. Dietary fat intake and reproductive hormone concentrations and ovulation in regularly menstruating women. Am. J. Clin. Nutr. 2016, 103, 868–877. [Google Scholar] [CrossRef] [PubMed]
- Braga, D.P.; Halpern, G.; Setti, A.S.; Figueira, R.C.; Iaconelli, A., Jr.; Borges, E., Jr. The impact of food intake and social habits on embryo quality and the likelihood of blastocyst formation. Reprod. Biomed. Online 2015, 31, 30–38. [Google Scholar] [CrossRef]
- Kermack, A.J.; Lowen, P.; Wellstead, S.J.; Fisk, H.L.; Montag, M.; Cheong, Y.; Osmond, C.; Houghton, F.D.; Calder, P.C.; Macklon, N.S. Effect of a 6-week “Mediterranean” dietary intervention on in vitro human embryo development: The Preconception Dietary Supplements in Assisted Reproduction double-blinded randomized controlled trial. Fertil Steril 2020, 113, 260–269. [Google Scholar] [CrossRef]
- Hammiche, F.; Vujkovic, M.; Wijburg, W.; de Vries, J.H.; Macklon, N.S.; Laven, J.S.; Steegers-Theunissen, R.P. Increased preconception omega-3 polyunsaturated fatty acid intake improves embryo morphology. Fertil. Steril. 2011, 95, 1820–1823. [Google Scholar] [CrossRef]
- Wise, L.A.; Wesselink, A.K.; Tucker, K.L.; Saklani, S.; Mikkelsen, E.M.; Cueto, H.; Riis, A.H.; Trolle, E.; McKinnon, C.J.; Hahn, K.A.; et al. Dietary fat intake and fecundability in two preconception cohort studies. Am. J. Epidemiol. 2017, 187, 60–64. [Google Scholar] [CrossRef]
- Chiu, Y.H.; Karmon, A.E.; Gaskins, A.J.; Arvizu, M.; Williams, P.L.; Souter, I.; Rueda, B.R.; Hauser, R.; Chavarro, J.E.; Team, E.S. Serum omega-3 fatty acids and treatment outcomes among women undergoing assisted reproduction. Hum. Reprod. 2018, 33, 156–165. [Google Scholar] [CrossRef]
- Mumford, S.L.; Browne, R.W.; Kim, K.; Nichols, C.; Wilcox, B.; Silver, R.M.; Connell, M.T.; Holland, T.L.; Kuhr, D.L.; Omosigho, U.R.; et al. Preconception Plasma Phospholipid Fatty Acids and Fecundability. J. Clin. Endocrinol. Metab. 2018, 103, 4501–4510. [Google Scholar] [CrossRef]
- Jungheim, E.S.; Frolova, A.I.; Jiang, H.; Riley, J.K. Relationship between serum polyunsaturated fatty acids and pregnancy in women undergoing in vitro fertilization. J. Clin. Endocrinol. Metab. 2013, 98, E1364–E1368. [Google Scholar] [CrossRef] [PubMed]
- Chavarro, J.E.; Rich-Edwards, J.W.; Rosner, B.A.; Willett, W.C. Dietary fatty acid intakes and the risk of ovulatory infertility. Am. J. Clin. Nutr. 2007, 85, 231–237. [Google Scholar] [CrossRef] [PubMed]
- Bushkin-Bedient, S.; Carpenter, D.O. Benefits versus risks associated with consumption of fish and other seafood. Rev. Environ. Health 2010, 25, 161–191. [Google Scholar] [CrossRef] [PubMed]
- Wang, A.; Padula, A.; Sirota, M.; Woodruff, T.J. Environmental influences on reproductive health: The importance of chemical exposures. Fertil. Steril. 2016, 106, 905–929. [Google Scholar] [CrossRef] [PubMed]
- Buck Louis, G.M.; Sundaram, R.; Schisterman, E.F.; Sweeney, A.M.; Lynch, C.D.; Gore-Langton, R.E.; Chen, Z.; Kim, S.; Caldwell, K.L.; Barr, D.B. Heavy metals and couple fecundity, the LIFE Study. Chemosphere 2012, 87, 1201–1207. [Google Scholar] [CrossRef]
- Gerhard, I.; Monga, B.; Waldbrenner, A.; Runnebaum, B. Heavy metals and fertility. J. Toxicol. Environ. Health Part A 1998, 54, 593–611. [Google Scholar]
- Ma, Y.; He, X.; Qi, K.; Wang, T.; Qi, Y.; Cui, L.; Wang, F.; Song, M. Effects of environmental contaminants on fertility and reproductive health. J. Environ. Sci 2019, 77, 210–217. [Google Scholar] [CrossRef]
- De Franciscis, P.; Guadagno, M.; Miraglia, N.; D’Eufemia, M.; Schiattarella, A.; Labriola, D.; Cucinella, G.; Colacurci, N. Follicular PB levels in women attending in vitro fertilization: Role of endometriosis on the outcome. Ital. J. Gynaecol. Obstet. 2018, 30, 21. [Google Scholar]
- Chevrier, C.; Warembourg, C.; Gaudreau, E.; Monfort, C.; Le Blanc, A.; Guldner, L.; Cordier, S. Organochlorine Pesticides, Polychlorinated Biphenyls, Seafood Consumption, and Time-to-Pregnancy. Epidemiology 2013, 24, 251–260. [Google Scholar] [CrossRef]
- Buck, G.M.; Sever, L.E.; Mendola, P.; Zielezny, M.; Vena, J.E. Consumption of contaminated sport fish from Lake Ontario and time-to-pregnancy. New York State Angler Cohort. Am. J. Epidemiol. 1997, 146, 949–954. [Google Scholar] [CrossRef] [PubMed][Green Version]
- Axmon, A.; Rylander, L.; Stromberg, U.; Hagmar, L. Female fertility in relation to the consumption of fish contaminated with persistent organochlorine compounds. Scand. J. Work Environ. Health 2002, 28, 124–132. [Google Scholar] [CrossRef] [PubMed]
- Gaskins, A.J.; Sundaram, R.; Buck Louis, G.M.; Chavarro, J.E. Seafood Intake, Sexual Activity, and Time to Pregnancy. J. Clin. Endocrinol. Metab. 2018, 103, 2680–2688. [Google Scholar] [CrossRef] [PubMed]
- Nassan, F.L.; Chiu, Y.H.; Vanegas, J.C.; Gaskins, A.J.; Williams, P.L.; Ford, J.B.; Attaman, J.; Hauser, R.; Chavarro, J.E.; Team, E.S. Intake of protein-rich foods in relation to outcomes of infertility treatment with assisted reproductive technologies. Am. J. Clin. Nutr. 2018, 108, 1104–1112. [Google Scholar] [CrossRef]
- Huybrechts, K.F.; Mikkelsen, E.M.; Christensen, T.; Riis, A.H.; Hatch, E.E.; Wise, L.A.; Sorensen, H.T.; Rothman, K.J. A successful implementation of e-epidemiology: The Danish pregnancy planning study ‘Snart-Gravid’. Eur. J. Epidemiol. 2010, 25, 297–304. [Google Scholar] [CrossRef]
- Mikkelsen, E.M.; Hatch, E.E.; Wise, L.A.; Rothman, K.J.; Riis, A.; Sorensen, H.T. Cohort Profile: The Danish Web-based Pregnancy Planning Study—‘Snart-Gravid’. Int. J. Epidemiol. 2009, 38, 938–943. [Google Scholar] [CrossRef]
- Knudsen, V.K.; Hatch, E.E.; Cueto, H.; Tucker, K.L.; Wise, L.; Christensen, T.; Mikkelsen, E.M. Relative validity of a semi-quantitative, web-based FFQ used in the ‘Snart Foraeldre’ cohort—A Danish study of diet and fertility. Public Health Nutr. 2016, 19, 1027–1034. [Google Scholar] [CrossRef]
- Wise, L.A.; Rothman, K.J.; Mikkelsen, E.M.; Stanford, J.B.; Wesselink, A.K.; McKinnon, C.; Gruschow, S.M.; Horgan, C.E.; Wiley, A.S.; Hahn, K.A.; et al. Design and Conduct of an Internet-Based Preconception Cohort Study in North America: Pregnancy Study Online. Paediatr. Perinat. Epidemiol. 2015, 29, 360–371. [Google Scholar] [CrossRef]
- Subar, A.F.; Thompson, F.E.; Kipnis, V.; Midthune, D.; Hurwitz, P.; McNutt, S.; McIntosh, A.; Rosenfeld, S. Comparative validation of the Block, Willett, and National Cancer Institute food frequency questionnaires: The Eating at America’s Table Study. Am. J. Epidemiol. 2001, 154, 1089–1099. [Google Scholar] [CrossRef]
- Millen, A.E.; Midthune, D.; Thompson, F.E.; Kipnis, V.; Subar, A.F. The National Cancer Institute diet history questionnaire: Validation of pyramid food servings. Am. J. Epidemiol. 2006, 163, 279–288. [Google Scholar] [CrossRef]
- Diet*Calc Software Version 1.5.0. National Cancer Institute. 2012. Available online: http://riskfactor.cancer.gov/DHQ/dietcalc/ (accessed on 19 October 2012).
- Craig, C.L.; Marshall, A.L.; Sjostrom, M.; Bauman, A.E.; Booth, M.L.; Ainsworth, B.E.; Pratt, M.; Ekelund, U.; Yngve, A.; Sallis, J.F.; et al. International physical activity questionnaire: 12-country reliability and validity. Med. Sci. Sports Exerc. 2003, 35, 1381–1395. [Google Scholar] [CrossRef]
- Ainsworth, B.E.; Haskell, W.L.; Whitt, M.C.; Irwin, M.L.; Swartz, A.M.; Strath, S.J.; O’Brien, W.L.; Bassett, D.R., Jr.; Schmitz, K.H.; Emplaincourt, P.O.; et al. Compendium of physical activities: An update of activity codes and MET intensities. Med. Sci. Sports Exerc. 2000, 32, S498–S504. [Google Scholar] [CrossRef] [PubMed]
- McKinnon, C.J.; Hatch, E.E.; Rothman, K.J.; Mikkelsen, E.M.; Wesselink, A.K.; Hahn, K.A.; Wise, L.A. Body mass index, physical activity and fecundability in a North American preconception cohort study. Fertil. Steril. 2016, 106, 451–459. [Google Scholar] [CrossRef] [PubMed]
- Drewnowski, A. Defining nutrient density: Development and validation of the nutrient rich foods index. J. Am. Coll. Nutr. 2009, 28, 421S–426S. [Google Scholar] [CrossRef] [PubMed]
- Guenther, P.M.; Kirkpatrick, S.I.; Reedy, J.; Krebs-Smith, S.M.; Buckman, D.W.; Dodd, K.W.; Casavale, K.O.; Carroll, R.J. The Healthy Eating Index-2010 is a valid and reliable measure of diet quality according to the 2010 Dietary Guidelines for Americans. J. Nutr. 2014, 144, 399–407. [Google Scholar] [CrossRef]
- Schisterman, E.F.; Cole, S.R.; Ye, A.; Platt, R.W. Accuracy loss due to selection bias in cohort studies with left truncation. Paediatr. Perinat. Epidemiol. 2013, 27, 491–502. [Google Scholar] [CrossRef]
- Howards, P.P.; Hertz-Picciotto, I.; Poole, C. Conditions for bias from differential left truncation. Am. J. Epidemiol. 2007, 165, 444–452. [Google Scholar] [CrossRef]
- Therneau, T.M. Modeling Survival Data: Extending the Cox Model; Springer: New York, NY, USA, 2000. [Google Scholar]
- Cox, D.R. Regression models and life-tables. R. Stat. Soc. J. B 1972, 34, 187–220. [Google Scholar] [CrossRef]
- Weinberg, C.R.; Wilcox, A.J.; Baird, D.D. Reduced fecundability in women with prenatal exposure to cigarette smoking. Am. J. Epidemiol. 1989, 129, 1072–1078. [Google Scholar] [CrossRef]
- Rothman, K.J.; Greenland, S.; Lash, T.L. Modern Epidemiology, 3rd ed.; Wolters Kluwer Health/Lippincott Williams & Wilkins: Philadelphia, PA, USA, 2008. [Google Scholar]
- Willett, W. Nutritional Epidemiology, 2nd ed.; Oxford University Press: New York, NY, USA, 1998. [Google Scholar]
- Wesselink, A.K.; Bethea, T.N.; McClean, M.; Weuve, J.; Williams, P.L.; Hauser, R.; Sjodin, A.; Brasky, T.M.; Baird, D.D.; Wise, L.A. Predictors of plasma polychlorinated biphenyl concentrations among reproductive-aged black women. Int. J. Hyg. Environ. Health 2019, 222, 1001–1010. [Google Scholar] [CrossRef]
- Barr, D.B.; Wang, R.Y.; Needham, L.L. Biologic monitoring of exposure to environmental chemicals throughout the life stages: Requirements and issues for consideration for the National Children’s Study. Environ. Health Perspect. 2005, 113, 1083–1091. [Google Scholar] [CrossRef] [PubMed]
- Weinberg, C.R. Toward a clearer definition of confounding. Am. J. Epidemiol. 1993, 137, 1–8. [Google Scholar] [CrossRef] [PubMed]
- Howards, P.P.; Schisterman, E.F.; Poole, C.; Kaufman, J.S.; Weinberg, C.R. “Toward a clearer definition of confounding” revisited with directed acyclic graphs. Am. J. Epidemiol. 2012, 176, 506–511. [Google Scholar] [CrossRef] [PubMed]
- Zhou, X.H.; Eckert, G.J.; Tierney, W.M. Multiple imputation in public health research. Stat. Med. 2001, 20, 1541–1549. [Google Scholar] [CrossRef] [PubMed]
- Sterne, J.A.; White, I.R.; Carlin, J.B.; Spratt, M.; Royston, P.; Kenward, M.G.; Wood, A.M.; Carpenter, J.R. Multiple imputation for missing data in epidemiological and clinical research: Potential and pitfalls. BMJ 2009, 338, b2393. [Google Scholar] [CrossRef] [PubMed]
- AS. SAS Institute Inc. 2014. SAS/STAT® 9.4 User’s Guide; SAS Institute: Cary, NC, USA, 2014. [Google Scholar]
- Rohrmann, S.; Linseisen, J.; Becker, N.; Norat, T.; Sinha, R.; Skeie, G.; Lund, E.; Martinez, C.; Barricarte, A.; Mattisson, I.; et al. Cooking of meat and fish in Europe--results from the European Prospective Investigation into Cancer and Nutrition (EPIC). Eur. J. Clin. Nutr. 2002, 56, 1216–1230. [Google Scholar] [CrossRef] [PubMed]
- Wallin, A.; Di Giuseppe, D.; Orsini, N.; Akesson, A.; Forouhi, N.G.; Wolk, A. Fish consumption and frying of fish in relation to type 2 diabetes incidence: A prospective cohort study of Swedish men. Eur. J. Nutr. 2017, 56, 843–852. [Google Scholar] [CrossRef]
- Stott-Miller, M.; Neuhouser, M.L.; Stanford, J.L. Consumption of deep-fried foods and risk of prostate cancer. Prostate 2013, 73, 960–969. [Google Scholar] [CrossRef]
- Nahab, F.; Pearson, K.; Frankel, M.R.; Ard, J.; Safford, M.M.; Kleindorfer, D.; Howard, V.J.; Judd, S. Dietary fried fish intake increases risk of CVD: The REasons for Geographic And Racial Differences in Stroke (REGARDS) study. Public Health Nutr. 2016, 19, 3327–3336. [Google Scholar] [CrossRef]
- Sun, Y.; Liu, B.; Snetselaar, L.G.; Robinson, J.G.; Wallace, R.B.; Peterson, L.L.; Bao, W. Association of fried food consumption with all cause, cardiovascular, and cancer mortality: Prospective cohort study. BMJ 2019, 364, k5420. [Google Scholar] [CrossRef]
- Zamani, S.A.; McClain, K.M.; Graubard, B.I.; Liao, L.M.; Abnet, C.C.; Cook, M.B.; Petrick, J.L. Dietary polyunsaturated fat intake in relation to head and neck, esophageal, and gastric cancer incidence in the NIH-AARP Diet and Health Study. Am. J. Epidemiol. 2020. [Google Scholar] [CrossRef]
- Bayen, S.; Barlow, P.; Lee, H.K.; Obbard, J.P. Effect of cooking on the loss of persistent organic pollutants from salmon. J. Toxicol. Environ. Health A 2005, 68, 253–265. [Google Scholar] [CrossRef]
- De Boer, J.; Lammertse, N.; Koekkoek, J.; van Hattum, B. PCB and organochlorine pesticide concentrations in eel increase after frying. Chemosphere 2013, 90, 139–142. [Google Scholar] [CrossRef] [PubMed]
- Wilson, N.D.; Shear, N.M.; Paustenbach, D.J.; Price, P.S. The effect of cooking practices on the concentration of DDT and PCB compounds in the edible tissue of fish. J. Expo. Anal. Environ. Epidemiol. 1998, 8, 423–440. [Google Scholar]
- Rawn, D.F.; Breakell, K.; Verigin, V.; Tittlemier, S.A.; Del Gobbo, L.; Diamond, M.; Vanderlinden, L.; Sit, D. Impacts of cooking technique on polychlorinated biphenyl and polychlorinated dioxins/furan concentrations in fish and fish products with intake estimates. J. Agric. Food Chem. 2013, 61, 989–997. [Google Scholar] [CrossRef] [PubMed]
- Shen, H.; Starr, J.; Han, J.; Zhang, L.; Lu, D.; Guan, R.; Xu, X.; Wang, X.; Li, J.; Li, W.; et al. The bioaccessibility of polychlorinated biphenyls (PCBs) and polychlorinated dibenzo-p-dioxins/furans (PCDD/Fs) in cooked plant and animal origin foods. Environ. Int. 2016, 94, 33–42. [Google Scholar] [CrossRef] [PubMed]
- Knize, M.G.; Felton, J.S. Formation and human risk of carcinogenic heterocyclic amines formed from natural precursors in meat. Nutr. Rev. 2005, 63, 158–165. [Google Scholar] [CrossRef]
- Sugimura, T.; Wakabayashi, K.; Nakagama, H.; Nagao, M. Heterocyclic amines: Mutagens/carcinogens produced during cooking of meat and fish. Cancer Sci. 2004, 95, 290–299. [Google Scholar] [CrossRef]
- Kazerouni, N.; Sinha, R.; Hsu, C.H.; Greenberg, A.; Rothman, N. Analysis of 200 food items for benzo [a] pyrene and estimation of its intake in an epidemiologic study. Food Chem. Toxicol. 2001, 39, 423–436. [Google Scholar] [CrossRef]
- Tareke, E.; Rydberg, P.; Karlsson, P.; Eriksson, S.; Tornqvist, M. Analysis of acrylamide, a carcinogen formed in heated foodstuffs. J. Agric. Food Chem. 2002, 50, 4998–5006. [Google Scholar] [CrossRef]
- Willett, W. Invited Commentary: OPEN Questions. Am. J. Epidemiol. 2003, 158, 22–24. [Google Scholar] [CrossRef]
- Willett, W.C.; Sampson, L.; Stampfer, M.J.; Rosner, B.; Bain, C.; Witschi, J.; Hennekens, C.H.; Speizer, F.E. Reproducibility and validity of a semiquantitative food frequency questionnaire. Am. J. Epidemiol. 1985, 122, 51–65. [Google Scholar] [CrossRef] [PubMed]
- Zalata, A.A.; Christophe, A.B.; Depuydt, C.E.; Schoonjans, F.; Comhaire, F.H. The fatty acid composition of phospholipids of spermatozoa from infertile patients. Mol. Hum. Reprod. 1998, 4, 111–118. [Google Scholar] [CrossRef] [PubMed]
- Conquer, J.A.; Martin, J.B.; Tummon, I.; Watson, L.; Tekpetey, F. Fatty acid analysis of blood serum, seminal plasma, and spermatozoa of normozoospermic vs. asthenozoospermic males. Lipids 1999, 34, 793–799. [Google Scholar] [CrossRef]
- Eslamian, G.; Amirjannati, N.; Rashidkhani, B.; Sadeghi, M.R.; Baghestani, A.R.; Hekmatdoost, A. Dietary fatty acid intakes and asthenozoospermia: A case-control study. Fertil. Steril. 2015, 103, 190–198. [Google Scholar] [CrossRef]
- Schartup, A.T.; Thackray, C.P.; Qureshi, A.; Dassuncao, C.; Gillespie, K.; Hanke, A.; Sunderland, E.M. Climate change and overfishing increase neurotoxicant in marine predators. Nature 2019, 572, 648–650. [Google Scholar] [CrossRef]
- U.S. Environmental Protection Agency. National Coastal Condition Report IV. EPA-842-R-10-003. April 2012. Available online: https://www.epa.gov/national-aquatic-resource-surveys/national-coastal-condition-report-iv-2012 (accessed on 3 June 2020).
- Duedahl-Olesen, L.; Cederberg, T.L.; Christensen, T.; Fagt, S.; Fromberg, A.; Granby, K.; Hansen, M.; Boberg, J.; Sloth, J.J.; Petersen, A. Dietary exposure to selected chemical contaminants in fish for the Danish population. Food Addit. Contam. Part A Chem. Anal. Control Expo. Risk Assess 2020, 37, 1–13. [Google Scholar] [CrossRef]
- Rothman, K.J.; Gallacher, J.E.; Hatch, E.E. Why representativeness should be avoided. Int. J. Epidemiol. 2013, 42, 1012–1014. [Google Scholar] [CrossRef]
- Hatch, E.E.; Hahn, K.A.; Wise, L.A.; Mikkelsen, E.M.; Kumar, R.; Fox, M.P.; Brooks, D.R.; Riis, A.H.; Sorensen, H.T.; Rothman, K.J. Evaluation of Selection Bias in an Internet-based Study of Pregnancy Planners. Epidemiology 2016, 27, 98–104. [Google Scholar] [CrossRef]
- Nohr, E.A.; Frydenberg, M.; Henriksen, T.B.; Olsen, J. Does low participation in cohort studies induce bias? Epidemiology 2006, 17, 413–418. [Google Scholar] [CrossRef]
- Nilsen, R.M.; Vollset, S.E.; Gjessing, H.K.; Skjaerven, R.; Melve, K.K.; Schreuder, P.; Alsaker, E.R.; Haug, K.; Daltveit, A.K.; Magnus, P. Self-selection and bias in a large prospective pregnancy cohort in Norway. Paediatr. Perinat. Epidemiol. 2009, 23, 597–608. [Google Scholar] [CrossRef] [PubMed]


| Total Seafood Intake (g/week) | ||||||||
|---|---|---|---|---|---|---|---|---|
| Snart Foraeldre (n = 2709) | PRESTO (n = 5127) | |||||||
| <50 | 50–99 | 100–199 | ≥200 | <50 | 50–99 | 100–199 | ≥200 | |
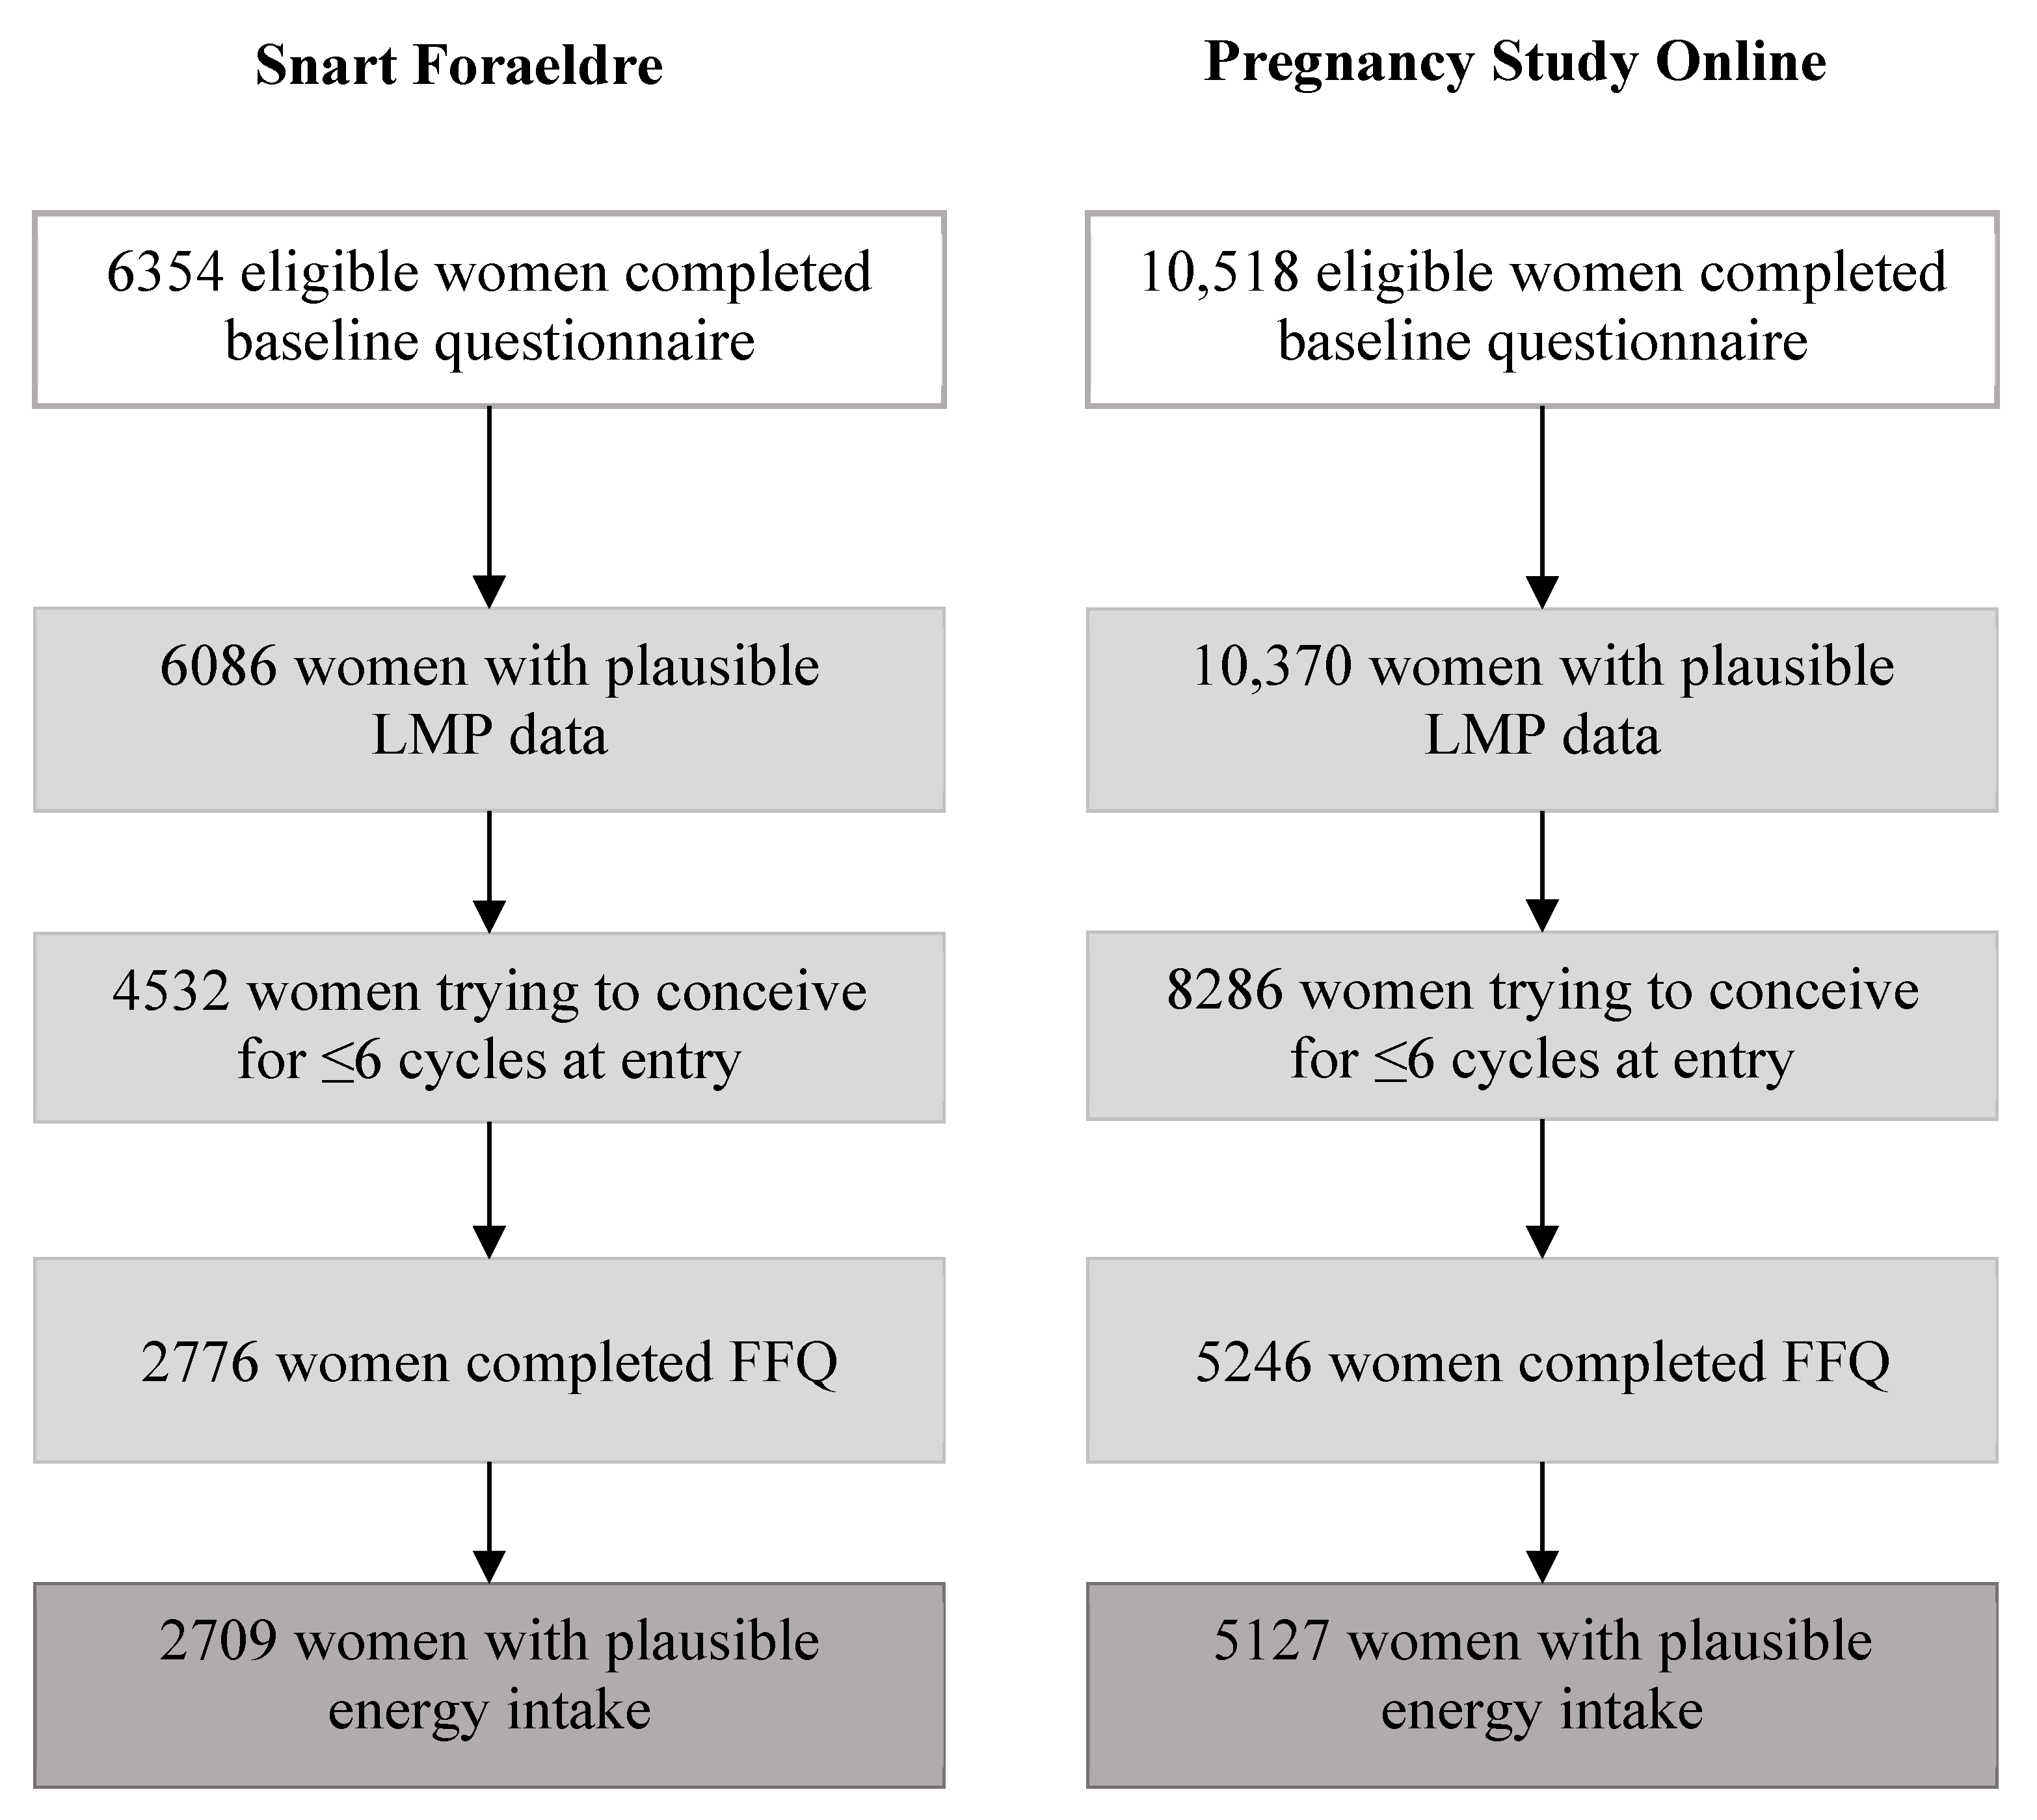
| Number of women (n) | 316 | 509 | 1117 | 767 | 2343 | 1257 | 1020 | 507 |
| Age, mean (years) | 28.4 | 28.8 | 28.9 | 29.4 | 29.6 | 30.3 | 30.5 | 30.7 |
| Body mass index, mean (kg/m2) | 25.0 | 24.0 | 24.0 | 23.8 | 27.9 | 26.8 | 26.5 | 26.6 |
| Energy, mean (kcal/day) | 1675 | 1714 | 1824 | 2097 | 1466 | 1572 | 1718 | 1842 |
| Current smoker (%) | 6.8 | 8.3 | 5.0 | 3.6 | 6.1 | 3.1 | 3.9 | 3.0 |
| Parous (%) | 32.0 | 32.0 | 33.2 | 31.1 | 34.8 | 30.8 | 28.2 | 21.3 |
| Alcohol intake, mean (drinks/week) | 2.6 | 2.8 | 2.7 | 2.8 | 2.7 | 3.5 | 3.6 | 4.0 |
| Physical activity, mean (METs/week) | 64.9 | 62.8 | 59.7 | 71.9 | 31.9 | 34.5 | 38.3 | 43.6 |
| Last contraceptive: hormonal (%) | 57.6 | 60.9 | 59.5 | 54.1 | 39.2 | 38.4 | 38.1 | 37.1 |
| Intercourse (frequency/week) (%) | ||||||||
| ≤1 | 44.1 | 41.7 | 39.2 | 36.8 | 40.3 | 42.5 | 41.6 | 36.2 |
| 2–3 | 43.6 | 46.0 | 47.2 | 46.9 | 45.4 | 43.0 | 45.3 | 48.7 |
| ≥4 | 12.3 | 12.3 | 13.6 | 16.3 | 14.3 | 14.5 | 13.1 | 15.1 |
| Daily multivitamin use (%) | 65.3 | 66.7 | 70.0 | 75.5 | 81.4 | 84.7 | 86.6 | 87.4 |
| Fish oil supplement intake (%) | 17.6 | 19.7 | 17.9 | 21.2 | 16.4 | 21.2 | 20.3 | 24.8 |
| Healthy diet indices, NRDS/HEI (mean) | 979 | 1015 | 1033 | 1062 | 63.1 | 67.1 | 69.0 | 71.0 |
| Sugar-sweetened beverages/week (mean) | 1.3 | 0.9 | 0.8 | 0.6 | 2.8 | 2.2 | 2.1 | 1.9 |
| White/non-Hispanic (%) | 100 | 100 | 100 | 100 | 88.4 | 86.5 | 85.8 | 82.9 |
| Education, years (%) | ||||||||
| ≤12 | 10.0 | 3.4 | 4.6 | 3.6 | 4.2 | 2.1 | 1.7 | 2.6 |
| 13–15 | 21.4 | 15.3 | 12.9 | 11.9 | 22.7 | 15.9 | 15.9 | 13.4 |
| 16 | 36.5 | 38.4 | 37.7 | 37.8 | 33.7 | 36.8 | 35.4 | 31.2 |
| ≥17 | 32.0 | 42.9 | 44.7 | 46.7 | 39.3 | 45.2 | 47.0 | 52.7 |
| Income, DKK/month or USD/year (%) | ||||||||
| <25,000/<50,000 | 16.1 | 12.8 | 12.1 | 12.5 | 18.8 | 16.1 | 13.3 | 15.1 |
| 25,000–39,999/50,000–99,999 | 24.3 | 22.2 | 21.2 | 22.8 | 42.2 | 37.6 | 36.7 | 32.7 |
| 40,000–64,999/100,000–149,999 | 39.6 | 45.6 | 43.3 | 41.8 | 24.4 | 31.0 | 28.8 | 24.4 |
| ≥65,000/≥150,000 | 20.0 | 19.3 | 23.4 | 23.0 | 14.6 | 15.4 | 21.3 | 27.8 |
| Snart Foraeldre | PRESTO | |||||||||||
|---|---|---|---|---|---|---|---|---|---|---|---|---|
| No. of Pregnancies | No. of Cycles | FR a | 95% CI a | FR b | 95% CI b | No. of Pregnancies | No. of Cycles | FR a | 95% CI a | FR b | 95% CI b | |
| Total seafood, g/week | ||||||||||||
| <50 | 201 | 1070 | 1.00 | Ref | 1.00 | Ref | 1425 | 9847 | 1.00 | Ref | 1.00 | Ref |
| 50–99 | 356 | 1844 | 1.02 | 0.87–1.20 | 0.97 | 0.82–1.14 | 830 | 5014 | 1.11 | 1.03–1.20 | 1.06 | 0.98–1.14 |
| 100–199 | 745 | 3980 | 1.00 | 0.87–1.15 | 0.94 | 0.81–1.08 | 688 | 4125 | 1.11 | 1.02–1.21 | 1.05 | 0.96–1.14 |
| ≥200 | 516 | 2715 | 1.03 | 0.88–1.20 | 0.94 | 0.79–1.10 | 324 | 2090 | 1.06 | 0.95–1.19 | 1.00 | 0.90–1.13 |
| Total unfried seafood, g/week c | ||||||||||||
| <20 | 978 | 6839 | 1.00 | Ref | 1.00 | Ref | ||||||
| 20–49 | 676 | 4440 | 1.05 | 0.96–1.15 | 1.04 | 0.95–1.13 | ||||||
| 50–99 | 748 | 4511 | 1.12 | 1.02–1.22 | 1.05 | 0.96–1.15 | ||||||
| 100–199 | 591 | 3557 | 1.11 | 1.01–1.22 | 1.04 | 0.95–1.15 | ||||||
| ≥200 | 274 | 1729 | 1.09 | 0.96–1.23 | 1.03 | 0.91–1.17 | ||||||
| Total fried seafood, g/week c | ||||||||||||
| None | 1726 | 11,079 | 1.00 | Ref | 1.00 | Ref | ||||||
| 1–4 | 593 | 3615 | 1.01 | 0.93–1.10 | 1.02 | 0.94–1.11 | ||||||
| 5–19 | 676 | 4573 | 0.94 | 0.87–1.02 | 0.97 | 0.90–1.05 | ||||||
| ≥20 | 272 | 1809 | 0.97 | 0.86–1.09 | 0.97 | 0.86–1.09 | ||||||
| Shellfish, g/week | ||||||||||||
| None | 107 | 655 | 1.00 | Ref | 1.00 | Ref | 1388 | 9347 | 1.00 | Ref | 1.00 | Ref |
| 1–9 | 880 | 4472 | 1.19 | 0.99–1.43 | 1.22 | 1.01–1.46 | 724 | 4471 | 1.06 | 0.98–1.15 | 1.01 | 0.93–1.10 |
| 10–49 | 768 | 4181 | 1.10 | 0.91–1.33 | 1.16 | 0.96–1.41 | 890 | 5501 | 1.07 | 0.99–1.16 | 1.02 | 0.94–1.10 |
| ≥50 | 63 | 301 | 1.23 | 0.93–1.63 | 1.21 | 0.91–1.61 | 265 | 1757 | 1.00 | 0.89–1.13 | 0.96 | 0.85–1.09 |
| Unfried shellfish, g/week c | ||||||||||||
| None | 1494 | 10,052 | 1.00 | Ref | 1.00 | Ref | ||||||
| 1–9 | 881 | 5449 | 1.06 | 0.98–1.15 | 1.01 | 0.94–1.09 | ||||||
| 10–19 | 374 | 2246 | 1.10 | 0.99–1.22 | 1.05 | 0.95–1.16 | ||||||
| ≥20 | 518 | 3329 | 1.02 | 0.93–1.12 | 0.98 | 0.89–1.07 | ||||||
| Fried shellfish, g/week c | ||||||||||||
| None | 2306 | 14,764 | 1.00 | Ref | 1.00 | Ref | ||||||
| 1–4 | 558 | 3548 | 0.98 | 0.91–1.07 | 0.98 | 0.90–1.06 | ||||||
| 5–9 | 341 | 2245 | 0.98 | 0.88–1.09 | 1.00 | 0.90–1.11 | ||||||
| ≥10 | 62 | 519 | 0.79 | 0.62–1.00 | 0.77 | 0.61–0.98 | ||||||
| Fish oil supplementation | ||||||||||||
| No | 1480 | 7746 | 1.00 | Ref | 1.00 | Ref | 2622 | 17,134 | 1.00 | Ref | 1.00 | Ref |
| Yes | 338 | 1863 | 0.97 | 0.87–1.08 | 0.94 | 0.84–1.06 | 645 | 3942 | 1.04 | 0.96–1.13 | 0.98 | 0.91–1.06 |
| Snart Foraeldre | PRESTO | |||||||||||||
|---|---|---|---|---|---|---|---|---|---|---|---|---|---|---|
| g/week | No. of Pregs | No. of Cycles | FR a | 95% CI a | FR b | 95% CI b | g/week | No. of Pregs | No. of Cycles | FR a | 95% CI a | FR b | 95% CI b | |
| Total marine fatty acids, percentile | ||||||||||||||
| <25th | <1.00 | 448 | 2358 | 1.00 | Ref | 1.00 | Ref | <0.37 | 775 | 5293 | 1.00 | Ref | 1.00 | Ref |
| 25th–49th | 1.00–1.83 | 458 | 2484 | 0.96 | 0.86–1.08 | 0.93 | 0.83–1.04 | 0.37–0.60 | 779 | 5595 | 0.96 | 0.87–1.05 | 0.93 | 0.85–1.02 |
| 50th–74th | 1.84–2.91 | 469 | 2411 | 1.02 | 0.91–1.15 | 0.98 | 0.87–1.10 | 0.61–1.03 | 845 | 5116 | 1.08 | 0.99–1.18 | 1.02 | 0.93–1.11 |
| 75th–89th | 2.92–4.30 | 266 | 1434 | 0.97 | 0.84–1.11 | 0.92 | 0.80–1.06 | 1.04–1.64 | 534 | 2977 | 1.16 | 1.05–1.28 | 1.07 | 0.97–1.19 |
| ≥90th | ≥4.31 | 177 | 922 | 1.03 | 0.88–1.21 | 1.00 | 0.85–1.18 | ≥1.65 | 334 | 2095 | 1.04 | 0.93–1.17 | 0.97 | 0.86–1.09 |
| EPA percentile | ||||||||||||||
| <25th | <0.29 | 448 | 2330 | 1.00 | Ref | 1.00 | Ref | <0.09 | 752 | 5401 | 1.00 | Ref | 1.00 | Ref |
| 25th–49th | 0.29–0.52 | 455 | 2540 | 0.94 | 0.83–1.05 | 0.90 | 0.80–1.02 | 0.09–0.16 | 806 | 5453 | 1.05 | 0.96–1.15 | 1.03 | 0.94–1.13 |
| 50th–74th | 0.53–0.82 | 467 | 2413 | 1.01 | 0.90–1.14 | 0.97 | 0.86–1.09 | 0.17–0.31 | 846 | 5195 | 1.12 | 1.03–1.23 | 1.07 | 0.98–1.17 |
| 75th–89th | 0.83–1.19 | 267 | 1441 | 0.95 | 0.83–1.09 | 0.91 | 0.79–1.05 | 0.32–0.54 | 537 | 2923 | 1.22 | 1.11–1.35 | 1.13 | 1.02–1.26 |
| ≥90th | ≥1.20 | 181 | 885 | 1.09 | 0.93–1.27 | 1.06 | 0.90–1.25 | ≥0.55 | 326 | 2104 | 1.08 | 0.96–1.21 | 1.00 | 0.89–1.13 |
| DPA percentile | ||||||||||||||
| <25th | <0.07 | 457 | 2376 | 1.00 | Ref | 1.00 | Ref | <0.07 | 776 | 5407 | 1.00 | Ref | 1.00 | Ref |
| 25th–49th | 0.07–1.13 | 446 | 2484 | 0.95 | 0.84–1.06 | 0.92 | 0.82–1.04 | 0.07 | 838 | 5226 | 1.08 | 0.98–1.17 | 1.08 | 0.98–1.19 |
| 50th–74th | 1.14–0.21 | 468 | 2389 | 1.03 | 0.92–1.15 | 0.99 | 0.88–1.11 | 0.08–0.11 | 797 | 5328 | 1.02 | 0.93–1.12 | 1.05 | 0.93–1.18 |
| 75th–89th | 0.22–0.33 | 266 | 1444 | 0.96 | 0.84–1.11 | 0.92 | 0.80–1.06 | 0.12–0.15 | 512 | 3101 | 1.10 | 0.99–1.21 | 1.07 | 0.97–1.19 |
| ≥90th | ≥0.34 | 181 | 916 | 1.05 | 0.90–1.23 | 1.04 | 0.89–1.22 | ≥0.16 | 344 | 2014 | 1.13 | 1.01–1.27 | 1.08 | 0.96–1.21 |
| DHA percentile | ||||||||||||||
| <25th | <0.64 | 450 | 2353 | 1.00 | Ref | 1.00 | Ref | <0.20 | 769 | 5306 | 1.00 | Ref | 1.00 | Ref |
| 25th–49th | 0.64–1.17 | 458 | 2478 | 0.96 | 0.85–1.07 | 0.92 | 0.82–1.04 | 0.20–0.36 | 784 | 5570 | 0.96 | 0.88–1.06 | 0.94 | 0.86–1.03 |
| 50th–74th | 1.18–1.86 | 468 | 2405 | 1.02 | 0.91–1.14 | 0.97 | 0.86–1.09 | 0.37–0.61 | 840 | 5159 | 1.08 | 0.99–1.18 | 1.01 | 0.92–1.11 |
| 75th–89th | 1.87–2.78 | 264 | 1454 | 0.95 | 0.82–1.09 | 0.90 | 0.78–1.04 | 0.62–0.96 | 535 | 2947 | 1.18 | 1.07–1.30 | 1.09 | 0.98–1.21 |
| ≥90th | ≥2.79 | 178 | 919 | 1.04 | 0.89–1.21 | 1.01 | 0.86–1.18 | ≥0.97 | 339 | 2094 | 1.07 | 0.95–1.20 | 1.00 | 0.89–1.12 |
© 2020 by the authors. Licensee MDPI, Basel, Switzerland. This article is an open access article distributed under the terms and conditions of the Creative Commons Attribution (CC BY) license (http://creativecommons.org/licenses/by/4.0/).
Share and Cite
Wise, L.A.; Willis, S.K.; Mikkelsen, E.M.; Wesselink, A.K.; Sørensen, H.T.; Rothman, K.J.; Tucker, K.L.; Trolle, E.; Vinceti, M.; Hatch, E.E. The Association between Seafood Intake and Fecundability: Analysis from Two Prospective Studies. Nutrients 2020, 12, 2276. https://doi.org/10.3390/nu12082276
Wise LA, Willis SK, Mikkelsen EM, Wesselink AK, Sørensen HT, Rothman KJ, Tucker KL, Trolle E, Vinceti M, Hatch EE. The Association between Seafood Intake and Fecundability: Analysis from Two Prospective Studies. Nutrients. 2020; 12(8):2276. https://doi.org/10.3390/nu12082276
Chicago/Turabian StyleWise, Lauren A., Sydney K. Willis, Ellen M. Mikkelsen, Amelia K. Wesselink, Henrik Toft Sørensen, Kenneth J. Rothman, Katherine L. Tucker, Ellen Trolle, Marco Vinceti, and Elizabeth E. Hatch. 2020. "The Association between Seafood Intake and Fecundability: Analysis from Two Prospective Studies" Nutrients 12, no. 8: 2276. https://doi.org/10.3390/nu12082276
APA StyleWise, L. A., Willis, S. K., Mikkelsen, E. M., Wesselink, A. K., Sørensen, H. T., Rothman, K. J., Tucker, K. L., Trolle, E., Vinceti, M., & Hatch, E. E. (2020). The Association between Seafood Intake and Fecundability: Analysis from Two Prospective Studies. Nutrients, 12(8), 2276. https://doi.org/10.3390/nu12082276