Determination of the Popularity of Dietary Supplements Using Google Search Rankings


Abstract
1. Introduction
2. Materials and Methods
2.1. Data Collection
2.2. Data Analysis
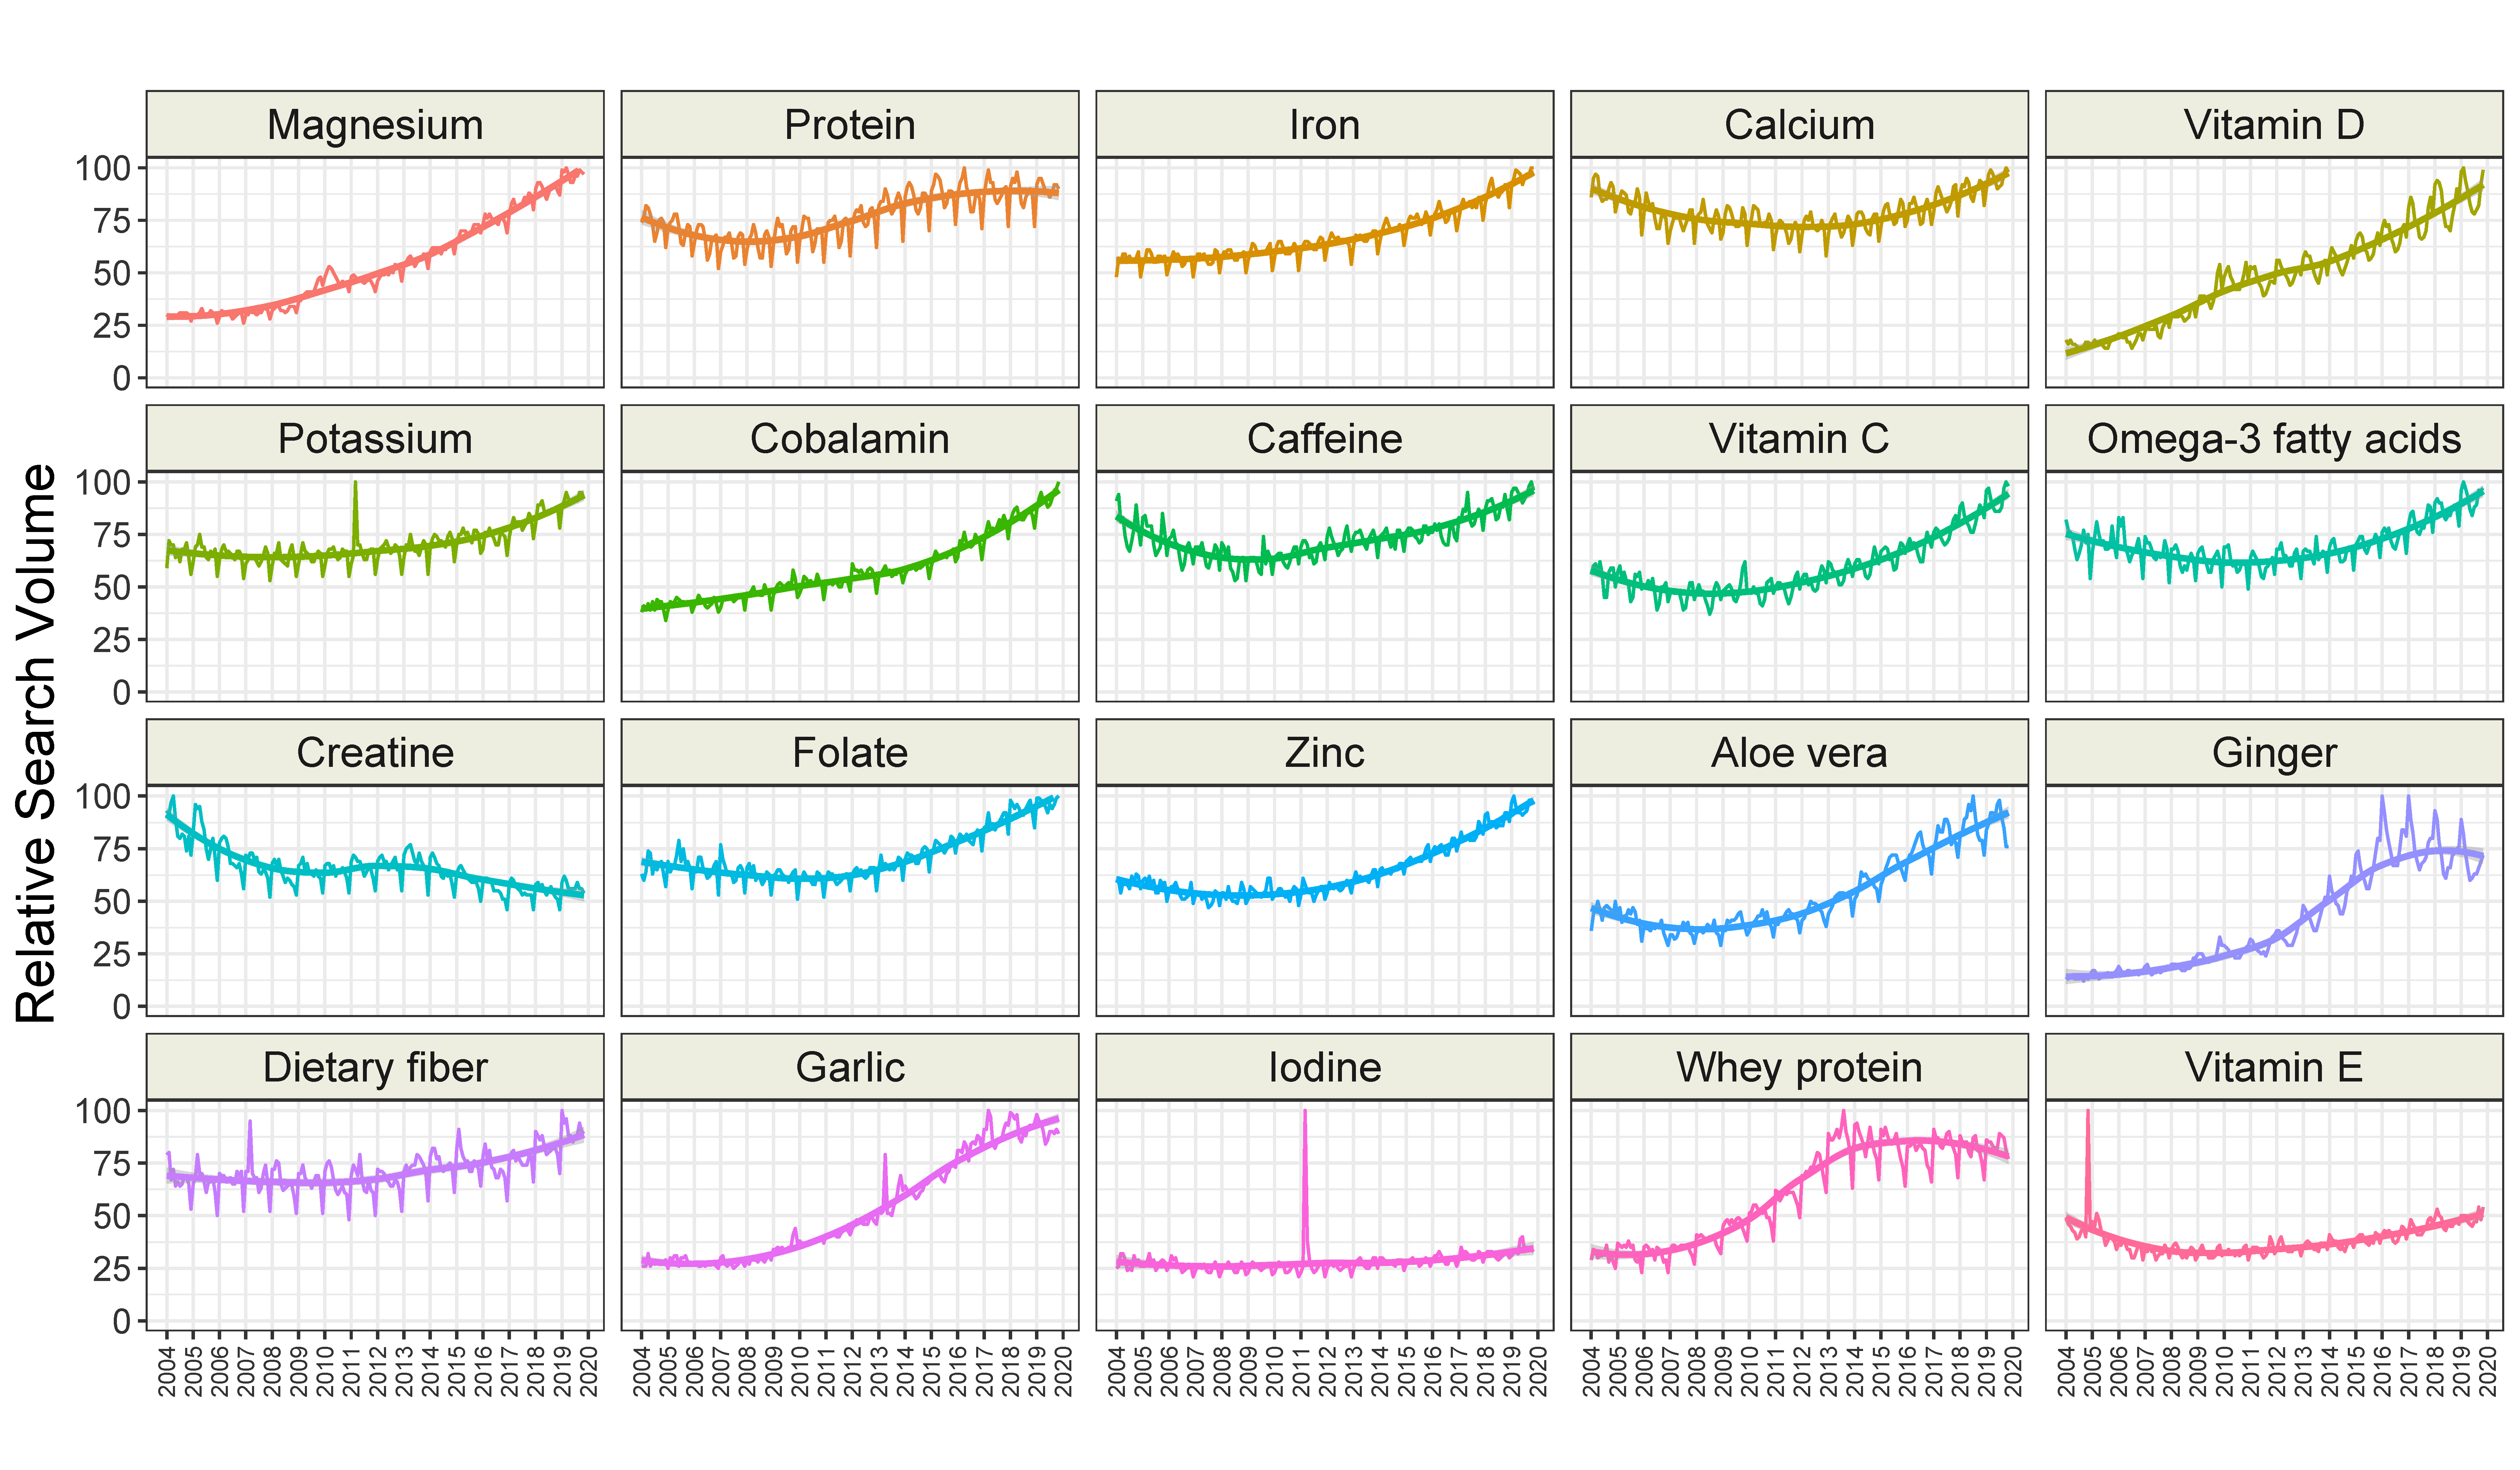
3. Results
4. Discussion
4.1. Main Findings
4.2. Strengths and Practical Implications
4.3. Limitations
5. Conclusions
Supplementary Materials
Author Contributions
Funding
Conflicts of Interest
References
- Binns, C.W.; Lee, M.K.; Lee, A. Problems and Prospects: Public Health Regulation of Dietary Supplements. Annu. Rev. Public Health 2018, 39, 403–420. [Google Scholar] [CrossRef] [PubMed]
- Dietary Supplement Label Database. Alphabetical Listing of Ingredients. Available online: https://dsld.nlm.nih.gov/dsld/lstIngredients.jsp (accessed on 7 December 2019).
- Nowak, R.E. DSHEA’s failure: Why a proactive approach to dietary supplement regulation is needed to effectively protect consumers. Univ. Ill. Law Rev. 2010, 2010, 1045–1081. [Google Scholar]
- Kantor, E.; Rehm, C.D.; Du, M.; White, E.; Giovannucci, E.L. Trends in Dietary Supplement Use among US Adults from 1999–2012. JAMA 2016, 316, 1464–1474. [Google Scholar] [CrossRef] [PubMed]
- Thompson, J.J.; Nichter, M. The compliance paradox: What we need to know about “real-world” dietary supplement use in the United States. Altern. Ther. Heal. Med. 2007, 13, 48–55. [Google Scholar]
- Beck, F.; Richard, J.-B.; Nguyen-Thanh, V.; Montagni, I.; Parizot, I.; Renahy, E.; Singh, P.; Van Mierlo, T. Use of the Internet as a Health Information Resource Among French Young Adults: Results From a Nationally Representative Survey. J. Med. Internet Res. 2014, 16, e128. [Google Scholar] [CrossRef]
- Baudischova, L.; Straznicka, J.; Pokladnikova, J.; Jahodar, L. The quality of information on the internet relating to top-selling dietary supplements in the Czech Republic. Int. J. Clin. Pharm. 2017, 40, 183–189. [Google Scholar] [CrossRef]
- Tejedor-García, N.; García-Pastor, C.; Benito-Martínez, S.; De Lucio-Cazaña, F.J. Medicina herbal china ofertada en páginas web en español: Calidad de la información y riesgos. Gac. Sanit. 2018, 32, 54–60. [Google Scholar] [CrossRef]
- Vamenta-Morris, H.; Dreisbach, A.; Shoemaker-Moyle, M.; Abdel-Rahman, E.M. Internet Claims on Dietary and Herbal Supplements in Advanced Nephropathy: Truth or Myth. Am. J. Nephrol. 2014, 40, 393–398. [Google Scholar] [CrossRef]
- Morris, C.A. Internet Marketing of Herbal Products. JAMA 2003, 290, 1505–1509. [Google Scholar] [CrossRef]
- Owens, C.; Baergen, R.; Puckett, D. Online Sources of Herbal Product Information. Am. J. Med. 2014, 127, 109–115. [Google Scholar] [CrossRef]
- Covolo, L.; Capelli, M.; Ceretti, E.; Feretti, D.; Caimi, L.; Gelatti, U. Nutritional supplements for diabetes sold on the internet: Business or health promotion? BMC Public Health 2013, 13, 777. [Google Scholar] [CrossRef] [PubMed]
- Eysenbach, G. Infodemiology and Infoveillance. Am. J. Prev. Med. 2011, 40, S154–S158. [Google Scholar] [CrossRef] [PubMed]
- StatCounter GlobalStats Search Engine Market Worldwide. 2019. Available online: https://gs.statcounter.com/search-engine-market-share/all (accessed on 5 October 2019).
- Crowson, M.G.; Witsell, D.; Eskander, A. Using Google Trends to Predict Pediatric Respiratory Syncytial Virus Encounters at a Major Health Care System. J. Med. Syst. 2020, 44, 57. [Google Scholar] [CrossRef]
- Sadilek, A.; Hswen, Y.; Bavadekar, S.; Shekel, T.; Brownstein, J.S.; Gabrilovich, E. Lymelight: Forecasting Lyme disease risk using web search data. Npj Digit. Med. 2020, 3, 16. [Google Scholar] [CrossRef] [PubMed]
- Boehm, A.; Pizzini, A.; Sonnweber, T.; Loeffler-Ragg, J.; Lamina, C.; Weiss, G.; Tancevski, I. Assessing global COPD awareness with Google Trends. Eur. Respir. J. 2019, 53, 1900351. [Google Scholar] [CrossRef] [PubMed]
- Kamiński, M.; Łoniewski, I.; Marlicz, W. “Dr. Google, I am in Pain”—Global Internet Searches Associated with Pain: A Retrospective Analysis of Google Trends Data. Int. J. Environ. Res. Public Health 2020, 17, 954. [Google Scholar] [CrossRef] [PubMed]
- Kamiński, M.; Skonieczna-Żydecka, K.; Nowak, J.K.; Stachowska, E. Global and local diet popularity rankings, their secular trends and seasonal variation in Google Trends data. Nutrition 2020, in press. [Google Scholar] [CrossRef]
- Moon, R.J.; Curtis, E.M.; Davies, J.; Cooper, C.; Harvey, N.C. Seasonal variation in Internet searches for vitamin D. Arch. Osteoporos. 2017, 12, 28. [Google Scholar] [CrossRef]
- Kamiński, M.; Łoniewski, I.; Marlicz, W.; Kamiński, M.; Łoniewski, I.; Marlicz, W. Global Internet Data on the Interest in Antibiotics and Probiotics Generated by Google Trends. Antibiotics 2019, 8, 147. [Google Scholar] [CrossRef]
- Nuti, S.V.; Wayda, B.; Ranasinghe, I.; Wang, S.; Dreyer, R.P.; Chen, S.I.; Murugiah, K. The Use of Google Trends in Health Care Research: A Systematic Review. PLoS ONE 2014, 9, e109583. [Google Scholar] [CrossRef]
- Compare Trends Search Terms. Available online: https://support.google.com/trends/answer/4359550?hl=en (accessed on 15 March 2020).
- National Library of Medicine (US) Key MEDLINE Indicators. 2013. Available online: https://www.nlm.nih.gov/bsd/bsd_key.html (accessed on 16 March 2020).
- PubMed, Web of Science, or Google Scholar? A Behind-the-Scenes Guide for Life Scientists. Available online: https://libguides.lib.msu.edu/pubmedvsgooglescholar (accessed on 16 March 2020).
- McLeod, A.I. Kendall Rank Correlation and Mann-Kendall Trend Test. 2011. Available online: https://cran.r-project.org/web/packages/Kendall/Kendall.pdf (accessed on 21 July 2019).
- Hyndman, R. Forecasting Functions for Time Series and Linear Models. 2019. Available online: https://cran.r-project.org/web/packages/forecast/forecast.pdf (accessed on 21 July 2019).
- Opportunities for Vitamins and Dietary Supplements in Asia Pacific. 2017. Available online: https://www.slideshare.net/Euromonitor/opportunities-for-vitamins-and-dietary-supplements-in-asia-pacific?from_action=save (accessed on 14 January 2020).
- Dietary Supplement Use Reaches All-Time High: Available-for-Purchase Consumer Survey Reaffirms the Vital Role Supplementation Plays in the Lives of Most Americans. 2019. Available online: https://www.crnusa.org/newsroom/dietary-supplement-use-reaches-all-time-high-available-purchase-consumer-survey-reaffirms (accessed on 14 January 2020).
- Vos, T.; Abajobir, A.A.; Abate, K.H.; Abbafati, C.; Abbas, K.M.; Abd-Allah, F.; Abdulkader, R.S.; Abdulle, A.M.; Abebo, T.A.; Abera, S.F.; et al. Global, regional, and national incidence, prevalence, and years lived with disability for 328 diseases and injuries for 195 countries, 1990–2016: A systematic analysis for the Global Burden of Disease Study 2016. Lancet 2017, 390, 1211–1259. [Google Scholar] [CrossRef]
- Review and Updating of Current WHO Recommendations on Salt/Sodium and Potassium Consumption. 2011. Available online: https://www.who.int/nutrition/events/NUGAG_dietandhealth_subgroup_call_public_comment_scope_of_Na_K.pdf (accessed on 18 February 2020).
- King, D.E.; Egan, B.M.; Woolson, R.F.; Mainous, A.G.; Al-Solaiman, Y.; Jesri, A. Effect of a High-Fiber Diet vs a Fiber-Supplemented Diet on C-Reactive Protein Level. Arch. Intern. Med. 2007, 167, 502. [Google Scholar] [CrossRef] [PubMed]
- Qidwai, W.; Ashfaq, T. Role of Garlic Usage in Cardiovascular Disease Prevention: An Evidence-Based Approach. Evid. -Based Complement. Altern. Med. 2013, 2013, 125649. [Google Scholar] [CrossRef] [PubMed]
- Hensley, S. Why Iodine Tablets Come Out When Radiation Threatens, National Public Radio, US. Available online: https://www.npr.org/sections/health-shots/2011/03/14/134533079/why-iodine-tablets-come-out-when-radiation-threatens?t=1578598453832 (accessed on 9 January 2020).
- Miller, E.R.; Pastor-Barriuso, R.; Dalal, D.; Riemersma, R.A.; Appel, L.J.; Guallar, E. Meta-analysis: High-dosage vitamin E supplementation may increase all-cause mortality. Ann. Intern. Med. 2004, 142, 37–46. [Google Scholar] [CrossRef] [PubMed]
- Search Engine Market Share. Available online: https://netmarketshare.com/search-engine-market-share.aspx (accessed on 10 October 2019).
- Levy, I.; Attias, S.; Ben-Arye, E.; Goldstein, L.; Schiff, E. Adverse events associated with interactions with dietary and herbal supplements among inpatients. Br. J. Clin. Pharmacol. 2016, 83, 836–845. [Google Scholar] [CrossRef]
- Unapproved Pharmaceuticals and Supplements. Advertising Policies Help. Available online: https://support.google.com/adspolicy/answer/2423645?hl=en (accessed on 9 January 2020).
- Kontos, E.; Blake, K.D.; Chou, W.-Y.S.; Prestin, A.; Nagler, R.; Egea, J.O. Predictors of eHealth Usage: Insights on The Digital Divide From the Health Information National Trends Survey 2012. J. Med. Internet Res. 2014, 16, e172. [Google Scholar] [CrossRef]
- Percheski, C.; Hargittai, E. Health Information-Seeking in the Digital Age. J. Am. Coll. Health 2011, 59, 379–386. [Google Scholar] [CrossRef]


| No. | Topic | Number of Supplements in Category | Ratio of RSV to “Lutein” |
|---|---|---|---|
| 1. | Protein | 2 | 9.64 |
| 2. | Mineral | 16 | 5.24 |
| 3. | Vitamin | 17 | 3.47 |
| 4. | Fiber | 2 | 3.01 |
| 5. | Chemical | 19 | 1.76 |
| 6. | Bacterial | 3 | 1.34 |
| 7. | Fat or fatty acid | 18 | 1.13 |
| 8. | Botanical | 91 | 0.97 |
| 9. | Amino acid | 24 | 0.86 |
| 10. | Enzyme | 8 | 0.48 |
| No. | Topic | Category | Ratio of RSV to “Lutein” |
|---|---|---|---|
| 1. | Magnesium | Mineral | 23.72 |
| 2. | Protein | Protein | 15.22 |
| 3. | Iron | Mineral | 15.12 |
| 4. | Calcium | Mineral | 13.74 |
| 5. | Vitamin D | Vitamin | 12.22 |
| 6. | Potassium | Mineral | 9.71 |
| 7. | Cobalamin | Vitamin | 9.36 |
| 8. | Caffeine | Chemical | 8.06 |
| 9. | Vitamin C | Vitamin | 7.38 |
| 10. | Omega-3 fatty acids | Fat or fatty acid | 6.80 |
| 11. | Creatine | Chemical | 6.77 |
| 12. | Folate | Vitamin | 6.67 |
| 13. | Zinc | Mineral | 6.36 |
| 14. | Aloe vera | Botanical | 6.11 |
| 15. | Ginger | Botanical | 5.91 |
| 16. | Dietary fiber | Fiber | 5.67 |
| 17. | Garlic | Botanical | 5.63 |
| 18. | Iodine | Mineral | 4.89 |
| 19. | Whey protein | Protein | 4.05 |
| 20. | Vitamin E | Vitamin | 3.86 |
| Topic | Seasonal Mann–Kendall Test | Slope (RSV/Year) | TBATS (Seasonality Present, Period (month)) | Month with the Highest Seasonal Component (RSV) | Month with the Lowest Seasonal Component (RSV) | Seasonal Component Amplitude (RSV) |
|---|---|---|---|---|---|---|
| Amino acid | tau = 0.44; *** | 0.47; *** | YES, 12 | March (3.04) | December (−6.57) | 9.61 |
| Bacterial | tau = 0.77; *** | 2.91; *** | YES, 12 | February (3.97) | December (−3.73) | 7.70 |
| Botanical | tau = 0.76; *** | 1.66; *** | YES, 12 | March (1.88) | December (−5.36) | 7.24 |
| Chemical | tau = 0.05; 0.307 | - | YES, 12 | February (2.51) | December (−6.08) | 8.59 |
| Enzyme | tau = −0.06; 0.228 | - | YES, 12 | October (4.06) | August (−6.82) | 10.88 |
| Fat or fatty acid | tau = −0.58; *** | −1.05; *** | YES, 12 | March (4.51) | December (−8.40) | 12.91 |
| Fiber | tau = 0.39; *** | 0.77; *** | YES, 12 | March (4.66) | December (−9.91) | 14.57 |
| Mineral | tau = 0.37; *** | 0.68; *** | YES, 12 | March (3.47) | December (−6.55) | 10.02 |
| Protein | tau = 0.74; *** | 3.11; *** | YES, 12 | March (5.07) | December (−14.02) | 19.09 |
| Vitamin | tau = 0.52; *** | 1.31; *** | YES, 12 | March (3.37) | December (−6.31) | 9.68 |
© 2020 by the authors. Licensee MDPI, Basel, Switzerland. This article is an open access article distributed under the terms and conditions of the Creative Commons Attribution (CC BY) license (http://creativecommons.org/licenses/by/4.0/).
Share and Cite
Kamiński, M.; Kręgielska-Narożna, M.; Bogdański, P. Determination of the Popularity of Dietary Supplements Using Google Search Rankings. Nutrients 2020, 12, 908. https://doi.org/10.3390/nu12040908
Kamiński M, Kręgielska-Narożna M, Bogdański P. Determination of the Popularity of Dietary Supplements Using Google Search Rankings. Nutrients. 2020; 12(4):908. https://doi.org/10.3390/nu12040908
Chicago/Turabian StyleKamiński, Mikołaj, Matylda Kręgielska-Narożna, and Paweł Bogdański. 2020. "Determination of the Popularity of Dietary Supplements Using Google Search Rankings" Nutrients 12, no. 4: 908. https://doi.org/10.3390/nu12040908
APA StyleKamiński, M., Kręgielska-Narożna, M., & Bogdański, P. (2020). Determination of the Popularity of Dietary Supplements Using Google Search Rankings. Nutrients, 12(4), 908. https://doi.org/10.3390/nu12040908