Protein-Related Dietary Parameters and Frailty Status in Older Community-Dwellers across Different Frailty Instruments

 ,
,  ,
,  ,
, 


Abstract
1. Introduction
2. Materials and Methods
2.1. Study Participants
2.2. Disease Conditions
2.3. Assessment of Frailty Status
2.3.1. Modified Frailty Phenotype
2.3.2. FRAIL Scale
2.3.3. Study of Osteoporotic Fracture Index
2.4. Dietary Assessment
2.5. Statistical Analysis
3. Results
3.1. Characteristics of Study Participants
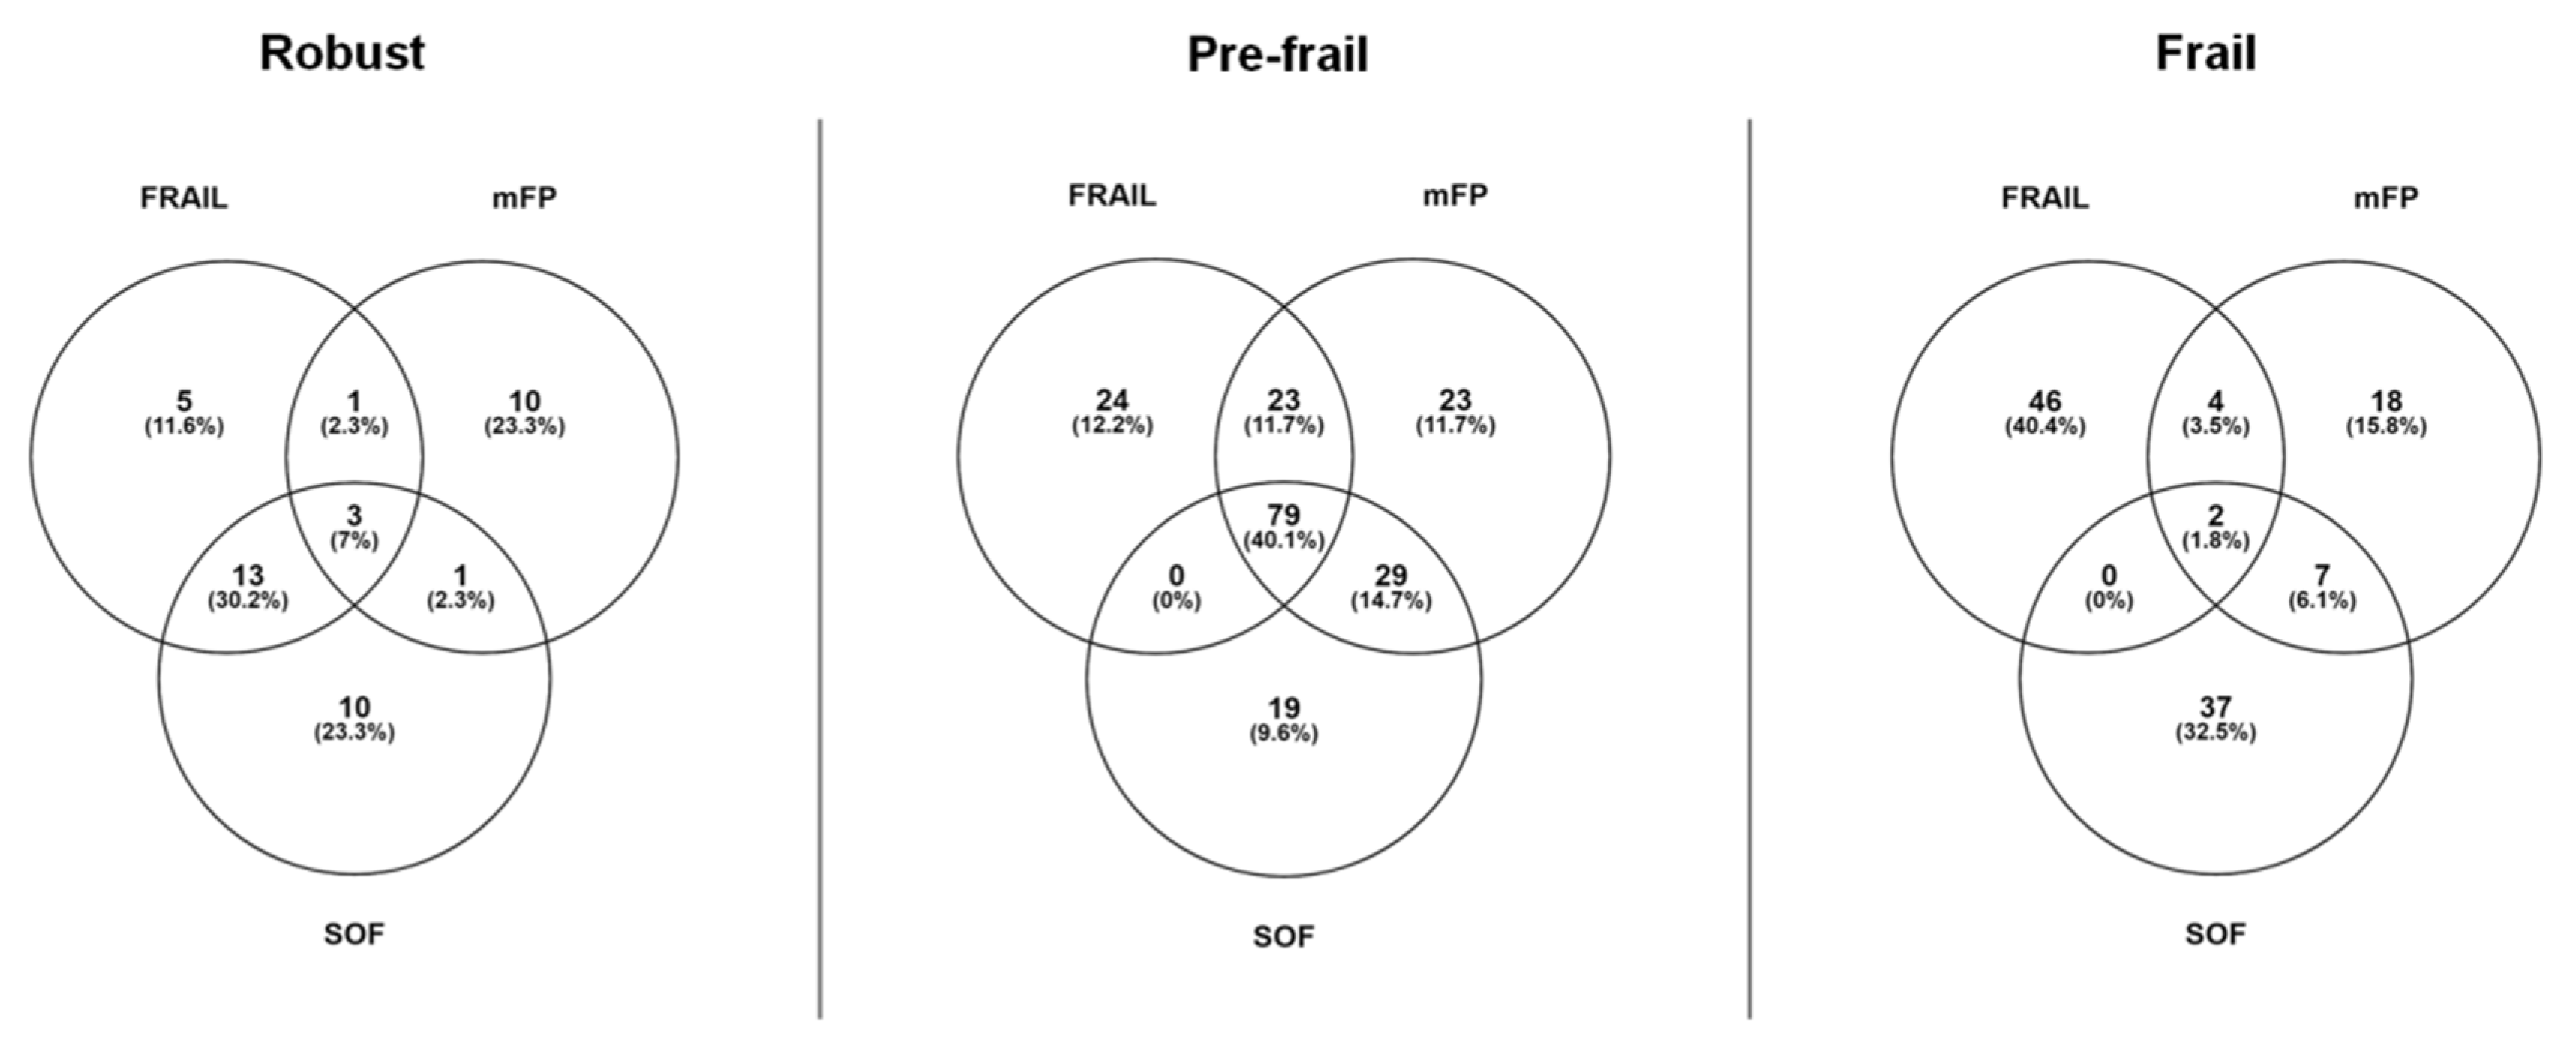
3.2. Participant Distribution According to Dietary Parameters and Frailty Status
4. Discussion
5. Conclusions
Author Contributions
Funding
Conflicts of Interest
References
- Collard, R.M.; Boter, H.; Schoevers, R.A.; Oude Voshaar, R.C. Prevalence of frailty in community-dwelling older persons: A systematic review. J. Am. Geriatr. Soc. 2012, 60, 1487–1492. [Google Scholar] [CrossRef]
- van Kan, G.A.; Rolland, Y.; Houles, M.; Gillette-Guyonnet, S.; Soto, M.; Vellas, B. The assessment of frailty in older adults. Clin. Geriatr. Med. 2010, 26, 275–286. [Google Scholar] [CrossRef]
- Clegg, A.; Young, J.; Iliffe, S.; Rikkert, M.O.; Rockwood, K. Frailty in elderly people. Lancet 2013, 381, 752–762. [Google Scholar] [CrossRef]
- Coelho-Junior, H.J.; Picca, A.; Calvani, R.; Uchida, M.C.; Marzetti, E. If my muscle could talk: Myokines as a biomarker of frailty. Exp. Gerontol. 2019, 127, 110715. [Google Scholar] [CrossRef]
- Kojima, G. Frailty as a predictor of hospitalisation among community-dwelling older people: A systematic review and meta-analysis. J. Epidemiol. Community Health 2016, 70, 722–729. [Google Scholar] [CrossRef]
- Kojima, G. Frailty as a predictor of disabilities among community-dwelling older people: A systematic review and meta-analysis. Disabil. Rehabil. 2017, 39, 1897–1908. [Google Scholar] [CrossRef] [PubMed]
- Buta, B.J.; Walston, J.D.; Godino, J.G.; Park, M.; Kalyani, R.R.; Xue, Q.-L.; Bandeen-Roche, K.; Varadhan, R. Frailty assessment instruments: Systematic characterization of the uses and contexts of highly-cited instruments. Ageing Res. Rev. 2016, 26, 53–61. [Google Scholar] [CrossRef] [PubMed]
- Faller, J.W.; do Nascimento Pereira, D.; de Souza, S.; Nampo, F.K.; de Souza Orlandi, F.; Matumoto, S. Instruments for the detection of frailty syndrome in older adults: A systematic review. PLoS ONE 2019, 14, e0216166. [Google Scholar] [CrossRef] [PubMed]
- Fried, L.P.; Tangen, C.M.; Walston, J.; Newman, A.B.; Hirsch, C.; Gottdiener, J.; Seeman, T.; Tracy, R.; Kop, W.J.; Burke, G.; et al. Frailty in older adults: Evidence for a phenotype. J. Gerontol. A Biol. Sci. Med. Sci. 2001, 56, M146–M157. [Google Scholar] [CrossRef] [PubMed]
- Ensrud, K.E. Comparison of 2 frailty indexes for prediction of falls, disability, fractures, and death in older women. Arch. Intern. Med. 2008, 168, 382–389. [Google Scholar] [CrossRef] [PubMed]
- Morley, J.E.; Malmstrom, T.K.; Miller, D.K. A simple frailty questionnaire (FRAIL) predicts outcomes in middle aged African Americans. J. Nutr. Health Aging 2012, 16, 601–608. [Google Scholar] [CrossRef] [PubMed]
- Ensrud, K.E.; Ewing, S.K.; Cawthon, P.M.; Fink, H.A.; Taylor, B.C.; Cauley, J.A.; Dam, T.-T.; Marshall, L.M.; Orwoll, E.S.; Cummings, S.R.; et al. A comparison of frailty indexes for the prediction of falls, disability, fractures, and mortality in older men. J. Am. Geriatr. Soc. 2009, 57, 492–498. [Google Scholar] [CrossRef] [PubMed]
- Rosado-Artalejo, C.; Carnicero, J.A.; Losa-Reyna, J.; Guadalupe-Grau, A.; Castillo-Gallego, C.; Gutierrez-Avila, G.; Alfaro-Acha, A.; Rodríguez-Artalejo, F.; Rodríguez-Mañas, L.; García-García, F.J. Cognitive performance across 3 frailty phenotypes: Toledo study for healthy aging. J. Am. Med. Dir. Assoc. 2017, 18, 785–790. [Google Scholar] [CrossRef]
- Lin, S.M.; Aliberti, M.J.R.; de Queiroz Fortes-Filho, S.; de Araújo Melo, J.; Aprahamian, I.; Suemoto, C.K.; Jacob Filho, W. Comparison of 3 frailty instruments in a geriatric acute care setting in a low-middle income country. J. Am. Med. Dir. Assoc. 2018, 19, 310–314. [Google Scholar] [CrossRef]
- Lorenzo-López, L.; Maseda, A.; de Labra, C.; Regueiro-Folgueira, L.; Rodríguez-Villamil, J.L.; Millán-Calenti, J.C. Nutritional determinants of frailty in older adults: A systematic review. BMC Geriatr. 2017, 17, 108. [Google Scholar] [CrossRef]
- Calvani, R.; Miccheli, A.; Landi, F.; Bossola, M.; Cesari, M.; Leeuwenburgh, C.; Sieber, C.C.; Bernabei, R.; Marzetti, E. Current nutritional recommendations and novel dietary strategies to manage sarcopenia. J. Frailty Aging 2013, 2, 38–53. [Google Scholar] [CrossRef]
- Ward, R.E.; Orkaby, A.R.; Chen, J.; Hshieh, T.T.; Driver, J.A.; Gaziano, J.M.; Djousse, L. Association between diet quality and frailty prevalence in the Physicians’ Health Study. J. Am. Geriatr. Soc. 2019. (Epub ahead of print). [Google Scholar] [CrossRef]
- Coelho-Junior, H.J.; Calvani, R.; Gonçalves, I.O.; Rodrigues, B.; Picca, A.; Landi, F.; Bernabei, R.; Uchida, M.C.; Marzetti, E. High relative consumption of vegetable protein is associated with faster walking speed in well-functioning older adults. Aging Clin. Exp. Res. 2019, 31, 837–844. [Google Scholar] [CrossRef]
- Coelho-Júnior, H.; Milano-Teixeira, L.; Rodrigues, B.; Bacurau, R.; Marzetti, E.; Uchida, M. Relative protein intake and physical function in older adults: A systematic review and meta-analysis of observational studies. Nutrients 2018, 10, 1330. [Google Scholar] [CrossRef]
- Houston, D.K.; Nicklas, B.J.; Ding, J.; Harris, T.B.; Tylavsky, F.A.; Newman, A.B.; Lee, J.S.; Sahyoun, N.R.; Visser, M.; Kritchevsky, S.B.; et al. Dietary protein intake is associated with lean mass change in older, community-dwelling adults: The Health, Aging, and Body Composition (Health ABC) study. Am. J. Clin. Nutr. 2008, 87, 150–155. [Google Scholar] [CrossRef]
- Beasley, J.M.; Lacroix, A.Z.; Neuhouser, M.L.; Huang, Y.; Tinker, L.; Woods, N.; Michael, Y.; Curb, J.D.; Prentice, R.L. Protein intake and incident frailty in the women’s health initiative observational study. J. Am. Geriatr. Soc. 2010, 58, 1063–1071. [Google Scholar] [CrossRef] [PubMed]
- Sandoval-Insausti, H.; Perez-Tasigchana, R.F.; Lopez-Garcia, E.; Garcia-Esquinas, E.; Rodriguez-Artalejo, F.; Guallar-Castillon, P. Macronutrients intake and incident frailty in older adults: A prospective cohort study. J. Gerontol. A Biol. Sci. Med. Sci. 2016, 71, 1329–1334. [Google Scholar] [CrossRef] [PubMed]
- Cholewa, J.M.; Dardevet, D.; Lima-Soares, F.; de Araújo Pessôa, K.; Oliveira, P.H.; dos Santos Pinho, J.R.; Nicastro, H.; Xia, Z.; Cabido, C.E.T.; Zanchi, N.E. Dietary proteins and amino acids in the control of the muscle mass during immobilization and aging: Role of the MPS response. Amino Acids 2017, 49, 811–820. [Google Scholar] [CrossRef] [PubMed]
- Coelho-Júnior, H.; Rodrigues, B.; Uchida, M.; Marzetti, E.; Coelho-Júnior, H.J.; Rodrigues, B.; Uchida, M.; Marzetti, E. Low protein intake is associated with frailty in older adults: A systematic review and meta-analysis of observational studies. Nutrients 2018, 10, 1334. [Google Scholar] [CrossRef]
- Volkert, D.; Beck, A.M.; Cederholm, T.; Cruz-Jentoft, A.; Goisser, S.; Hooper, L.; Kiesswetter, E.; Maggio, M.; Raynaud-Simon, A.; Sieber, C.C.; et al. ESPEN guideline on clinical nutrition in the intensive care unit. Clin. Nutr. 2018. [Google Scholar] [CrossRef]
- Deutz, N.E.P.; Bauer, J.M.; Barazzoni, R.; Biolo, G.; Boirie, Y.; Bosy-Westphal, A.; Cederholm, T.; Cruz-Jentoft, A.; Krznariç, Z.; Nair, K.S.; et al. Protein intake and exercise for optimal muscle function with aging: Recommendations from the ESPEN Expert Group. Clin. Nutr. 2014, 33, 929–936. [Google Scholar] [CrossRef]
- Bauer, J.; Biolo, G.; Cederholm, T.; Cesari, M.; Cruz-Jentoft, A.J.; Morley, J.E.; Phillips, S.; Sieber, C.; Stehle, P.; Teta, D.; et al. Evidence-based recommendations for optimal dietary protein intake in older people: A position paper from the prot-age study group. J. Am. Med. Dir. Assoc. 2013, 14, 542–559. [Google Scholar] [CrossRef]
- Wolfe, R.R.; Miller, S.L.; Miller, K.B. Optimal protein intake in the elderly. Clin. Nutr. 2008, 27, 675–684. [Google Scholar] [CrossRef]
- Xu, Z.; Tan, Z.; Zhang, Q.; Gui, Q.; Yang, Y. The effectiveness of leucine on muscle protein synthesis, lean body mass and leg lean mass accretion in older people: A systematic review and meta-analysis. Br. J. Nutr. 2015, 113, 25–34. [Google Scholar] [CrossRef]
- Katsanos, C.S.; Kobayashi, H.; Sheffield-Moore, M.; Aarsland, A.; Wolfe, R.R. A high proportion of leucine is required for optimal stimulation of the rate of muscle protein synthesis by essential amino acids in the elderly. Am. J. Physiol. Metab. 2006, 291, E381–E387. [Google Scholar] [CrossRef]
- Loenneke, J.P.; Loprinzi, P.D.; Murphy, C.H.; Phillips, S.M. Per meal dose and frequency of protein consumption is associated with lean mass and muscle performance. Clin. Nutr. 2016, 35, 1506–1511. [Google Scholar] [CrossRef] [PubMed]
- Gingrich, A.; Spiegel, A.; Gradl, J.E.; Skurk, T.; Hauner, H.; Sieber, C.C.; Volkert, D.; Kiesswetter, E. Daily and per-meal animal and plant protein intake in relation to muscle mass in healthy older adults without functional limitations: An enable study. Aging Clin. Exp. Res. 2019, 31, 1271–1281. [Google Scholar] [CrossRef] [PubMed]
- Ten Haaf, D.S.M.; van Dongen, E.J.I.; Nuijten, M.A.H.; Eijsvogels, T.M.H.; de Groot, L.C.P.G.M.; Hopman, M.T.E. Protein intake and distribution in relation to physical functioning and quality of life in community-dwelling elderly people: Acknowledging the role of physical activity. Nutrients 2018, 10, 506. [Google Scholar] [CrossRef] [PubMed]
- Moore, D.R.; Churchward-Venne, T.A.; Witard, O.; Breen, L.; Burd, N.A.; Tipton, K.D.; Phillips, S.M. Protein ingestion to stimulate myofibrillar protein synthesis requires greater relative protein intakes in healthy older versus younger men. J. Gerontol. Ser. A Biol. Sci. Med. Sci. 2015, 70, 57–62. [Google Scholar] [CrossRef]
- Gaytán-González, A.; Ocampo-Alfaro, M.D.J.; Torres-Naranjo, F.; Arroniz-Rivera, M.; González-Mendoza, R.G.; Gil-Barreiro, M.; López-Taylor, J.R. The consumption of two or three meals per day with adequate protein content is associated with lower risk of physical disability in mexican adults aged 60 years and older. Geriatrics 2020, 5, 1. [Google Scholar] [CrossRef]
- Instituto Brasileiro de Geografia e Estatística. IBGE—Poá, São Paulo, Brazil. 2019. Available online: https://censo2010.ibge.gov.br/sinopse/webservice/frm_piramide.php?codigo=353980&corhomem=3d4590&cormulher=9cdbfc (accessed on 3 February 2020).
- Lorenzi, M.; Lorenzi, T.; Marzetti, E.; Landi, F.; Vetrano, D.L.; Settanni, S.; Antocicco, M.; Bonassi, S.; Valdiglesias, V.; Bernabei, R.; et al. Association of frailty with the serine protease HtrA1 in older adults. Exp. Gerontol. 2016, 81, 8–12. [Google Scholar] [CrossRef]
- Coelho-Junior, H.J.; Rodrigues, B.; Gonçalves, I.D.O.; Asano, R.Y.; Uchida, M.C.; Marzetti, E. The physical capabilities underlying timed “Up and Go” test are time-dependent in community-dwelling older women. Exp. Gerontol. 2018, 104. [Google Scholar] [CrossRef]
- Marcellino, C.; Henn, R.L.; Olinto, M.T.; Bressan, A.W.; Paniz, V.M.; Pattussi, M.P. Physical inactivity and associated factors among women from a municipality in southern Brazil. J. Phys. Act. Health 2014, 11, 777–783. [Google Scholar] [CrossRef]
- Aprahamian, I.; de Castro Cezar, N.O.; Izbicki, R.; Lin, S.M.; Paulo, D.L.V.; Fattori, A.; Biella, M.M.; Jacob Filho, W.; Yassuda, M.S. Screening for frailty with the FRAIL scale: A comparison with the phenotype criteria. J. Am. Med. Dir. Assoc. 2017, 18, 592–596. [Google Scholar] [CrossRef]
- Boushey, C.J.; Coulston, A.M.; Rock, C.L.; Monsen, E. (Eds.) Nutrition in The Prevention and Treatment of Disease; Academic Press: Cambridge, MA, USA, 2001. [Google Scholar]
- Katsanos, C.S.; Kobayashi, H.; Sheffield-Moore, M.; Aarsland, A.; Wolfe, R.R. Aging is associated with diminished accretion of muscle proteins after the ingestion of a small bolus of essential amino acids. Am. J. Clin. Nutr. 2005, 82, 1065–1073. [Google Scholar] [CrossRef]
- Hoeymans, N.; Feskens, E.J.; van den Bos, G.A.; Kromhout, D. Measuring functional status: Cross-sectional and longitudinal associations between performance and self-report (Zutphen Elderly Study 1990–1993). J. Clin. Epidemiol. 1996, 49, 1103–1110. [Google Scholar] [CrossRef]
- Cress, M.E.; Buchner, D.M.; Questad, K.A.; Esselman, P.C.; deLateur, B.J.; Schwartz, R.S. Exercise: Effects on physical functional performance in independent older adults. J. Gerontol. A Biol. Sci. Med. Sci. 1999, 54, M242–M248. [Google Scholar] [CrossRef]
- Fors, S.; Thorslund, M.; Parker, M.G. Do actions speak louder than words? Self-assessed and performance-based measures of physical and visual function among old people. Eur. J. Ageing 2006, 3, 15–21. [Google Scholar] [CrossRef] [PubMed]
- Melzer, I.; Kurz, I.; Sarid, O.; Jette, A.M. Relationship between self-reported function and disability and balance performance measures in the elderly. J. Rehabil. Res. Dev. 2007, 44, 685–692. [Google Scholar] [CrossRef] [PubMed]
- Van Den Brink, C.L.; Tijhuis, M.; Kalmijn, S.; Klazinga, N.S.; Nissinen, A.; Giampaoli, S.; Kivinen, P.; Kromhout, D.; Van Den Bos, G.A.M. Self-reported disability and its association with performance-based limitation in elderly men: A comparison of three european countries. J. Am. Geriatr. Soc. 2003, 51, 782–788. [Google Scholar] [CrossRef] [PubMed]
- Wittink, H.; Rogers, W.; Sukiennik, A.; Carr, D.B. Physical functioning: Self-report and performance measures are related but distinct. Spine (Phila Pa 1976) 2003, 28, 2407–2413. [Google Scholar] [CrossRef] [PubMed]
- Daltroy, L.H.; Larson, M.G.; Eaton, H.M.; Phillips, C.B.; Liang, M.H. Discrepancies between self-reported and observed physical function in the elderly: The influence of response shift and other factors. Soc. Sci. Med. 1999, 48, 1549–1561. [Google Scholar] [CrossRef]
- van den Ende, C.H.; Hazes, J.M.W.; Cessie, S.L.E.; Breedveld, F.; Dijikmans, B.A.C. Discordance between objective and subjective assessment of functional ability of patients with rheumatoid arthritis. Rheumatology 1995, 34, 951–955. [Google Scholar] [CrossRef]
- Estévez-López, F.; Álvarez-Gallardo, I.C.; Segura-Jiménez, V.; Soriano-Maldonado, A.; Borges-Cosic, M.; Pulido-Martos, M.; Aparicio, V.A.; Carbonell-Baeza, A.; Delgado-Fernández, M.; Geenen, R. The discordance between subjectively and objectively measured physical function in women with fibromyalgia: Association with catastrophizing and self-efficacy cognitions. The al-Ándalus project. Disabil. Rehabil. 2018, 40, 329–337. [Google Scholar] [CrossRef]
- Coman, L.; Richardson, J. Relationship between self-report and performance measures of function: A systematic review. Can. J. Aging/La Revue Canadienne du Vieillissement 2006, 25, 253–270. [Google Scholar] [CrossRef]
- Kobayashi, S.; Asakura, K.; Suga, H.; Sasaki, S.; Three-generation Study of Women on Diets and Health Study Group. High protein intake is associated with low prevalence of frailty among old Japanese women: A multicenter cross-sectional study. Nutr. J. 2013, 12, 164. [Google Scholar] [CrossRef] [PubMed]
- Landi, F.; Calvani, R.; Cesari, M.; Tosato, M.; Martone, A.M.; Ortolani, E.; Savera, G.; Salini, S.; Sisto, A.; Picca, A.; et al. Sarcopenia: An overview on current definitions, diagnosis and treatment. Curr. Protein Pept. Sci. 2018, 19, 633–638. [Google Scholar] [CrossRef] [PubMed]
- Lustgarten, M.S.; Price, L.L.; Chale, A.; Phillips, E.M.; Fielding, R.A. Branched chain amino acids are associated with muscle mass in functionally limited older adults. J. Gerontol. Ser. A Biol. Sci. Med. Sci. 2014, 69, 717. [Google Scholar] [CrossRef]
- Ottestad, I.; Ulven, S.M.; Øyri, L.K.L.; Sandvei, K.S.; Gjevestad, G.O.; Bye, A.; Sheikh, N.A.; Biong, A.S.; Andersen, L.F.; Holven, K.B. Reduced plasma concentration of branched-chain amino acids in sarcopenic older subjects: A cross-sectional study. Br. J. Nutr. 2018, 120, 445–453. [Google Scholar] [CrossRef] [PubMed]
- Farsijani, S.; Payette, H.; Morais, J.A.; Shatenstein, B.; Gaudreau, P.; Chevalier, S. Even mealtime distribution of protein intake is associated with greater muscle strength, but not with 3-y physical function decline, in free-living older adults: The Quebec longitudinal study on Nutrition as a Determinant of Successful Aging (NuAge study). Am. J. Clin. Nutr. 2017, 106, 113–124. [Google Scholar] [CrossRef] [PubMed]
- Gingrich, A.; Spiegel, A.; Kob, R.; Schoene, D.; Skurk, T.; Hauner, H.; Siebe, C.C.; Volkert, D.; Kiesswetter, E. Amount, distribution, and quality of protein intake are not associated with muscle mass, strength, and power in healthy older adults without functional limitations—An enable study. Nutrients 2017, 9, 1358. [Google Scholar] [CrossRef]
- Bollwein, J.; Diekmann, R.; Kaiser, M.J.; Bauer, J.M.; Uter, W.; Sieber, C.C.; Volkert, D. Distribution but not amount of protein intake is associated with frailty: A cross-sectional investigation in the region of Nurnberg. Nutr. J. 2013, 12, 109. [Google Scholar] [CrossRef]
- Theou, O.; Cann, L.; Blodgett, J.; Wallace, L.M.K.; Brothers, T.D.; Rockwood, K. Modifications to the frailty phenotype criteria: Systematic review of the current literature and investigation of 262 frailty phenotypes in the survey of health, ageing, and retirement in Europe. Ageing Res. Rev. 2015, 21, 78–94. [Google Scholar] [CrossRef]
- Rockwood, K.; Song, X.; MacKnight, C.; Bergman, H.; Hogan, D.B.; McDowell, I.; Mitnitski, A. A global clinical measure of fitness and frailty in elderly people. CMAJ 2005, 173, 489–495. [Google Scholar] [CrossRef]


| FRAIL | mFP | SOF | |||||||
|---|---|---|---|---|---|---|---|---|---|
| Variables | Robust (n = 22) | Pre-Frail (n = 126) | Frail (n = 52) | Robust (n = 15) | Pre-Frail (n = 154) | Frail (n = 31) | Robust (n = 27) | Pre-Frail (n = 127) | Frail (n = 46) |
| General Characteristics | |||||||||
| Age, years | 66.0 ± 4.5 | 68.8 ± 7.3 | 67.6 ± 6.4 | 65.1 ± 7.5 | 67.8 ± 6.1 | 71.2 ± 9.1 | 68.6 ± 8.0 | 68.2 ± 6.9 | 68.0 ± 6.1 |
| Body weight, kg | 66.5 ± 11.7 | 69.6 ± 12.7 | 68.2 ± 10.4 | 63.5 ± 9.2 | 69.9 ± 12.1 a | 66.4 ± 12.4 | 68.8 ± 12.2 | 69.7 ± 12.0 | 66.7 ± 12.0 |
| BMI, kg/m2 | 28.1 ± 4.4 | 28.9 ± 5.3 | 28.5 ± 4.3 | 27.7 ± 3.6 | 28.9 ± 5.0 | 28.4 ± 5.5 | 29.4 ± 5.2 | 29.0 ± 4.8 | 27.5 ± 5.1 |
| Physical activity levels, min/week | 490.7 ± 112.3 | 487.5 ± 92.4 | 473.4 ± 100.0 | 476.4 ± 81.9 | 497.1 ± 88 | 430.0 ± 123.2 b | 490.7 ± 112.3 | 487.5 ± 92.4 | 473.4 ± 100.6 |
| Sex, female | 18 (81.8) | 103 (81.7) | 45 (86.5) | 13 (92.9) | 125 (81.2) | 27 (87.1) | 22 (81.5) | 106 (83.5) | 38 (82.6) |
| Current smokers | 0 (0.0) | 3 (2.4) | 3 (5.8) | 1 (7.1) | 4 (2.6) | 1 (3.2) | 0 (0.0) | 3 (2.4) | 3 (6.5) |
| Multimorbidity | 0 (0.0) | 7 (5.6) | 7 (13.5) | 2 (14.3) | 6 (3.9) | 6 (19.4) | 4 (14.8) | 9 (7.1) | 1 (2.2) |
| Ethnicity | |||||||||
| Asian | 0 (0.0) | 8 (6.3) | 3 (5.8) | 0 (0.0) | 9 (5.8) | 2 (6.5) | 0 (0.0) | 7 (5.5) | 4 (8.7) |
| Black | 3 (13.6) | 22 (17.5) | 12 (23.1) | 2 (14.3) | 28 (18.2) | 7 (22.6) | 6 (22.2) | 22 (17.3) | 9 (19.6) |
| Caucasian | 19 (86.4) | 96 (76.2) | 37 (71.2) | 12 (85.7) | 117 (76.0) | 22 (71.0) | 21 (77.8) | 98 (77.2) | 33 (71.7) |
| Diet | |||||||||
| Protein, g | 112.6 ± 47.3 | 105.4 ± 40.8 | 104.9 ± 38.7 | 122.2 ± 37.3 | 108.2 ± 41.4 | 89.7 ± 36.4 a,b | 106.4 ± 43.8 | 107.4 ± 41.4 | 102.4 ± 38.3 |
| Protein, g/kg | 1.7 ± 0.8 | 1.5 ± 0.6 | 1.5 ± 0.5 | 1.9 ± 0.6 | 1.5 ± 0.6 | 1.3 ± 0.4 a | 1.6 ± 0.7 | 1.5 ± 0.6 | 1.5 ± 0.5 |
| Valine, g | 5.5 ± 2.3 | 5.2 ± 2.1 | 5.3 ± 2.1 | 6.1 ± 1.9 | 5.4 ± 2.1 | 4.4 ± 1.9ab | 5.2 ± 2.1 | 5.3 ± 2.1 | 5.0 ± 2.0 |
| Isoleucine, g | 4.6 ± 2.9 | 4.7 ± 2.3 | 4.7 ± 2.0 | 5.3 ± 2.2 | 4.8 ± 2.3 | 3.9 ± 1.9ab | 4.4 ± 2.7 | 4.8 ± 2.3 | 4.6 ± 1.9 |
| Leucine, g | 8.4 ± 3.5 | 7.9 ± 3.2 | 7.9 ± 3.0 | 9.3 ± 2.9 | 8.2 ± 3.2 | 6.7 ± 2.9ab | 7.9 ± 3.2 | 8.1 ± 3.2 | 7.7 ± 3.0 |
| Protein breakfast, g | 11.4 ± 5.2 | 13.3 ± 7.1 | 12.9 ± 7.4 | 12.8 ± 5.2 | 12.9 ± 7.7 | 12.6 ± 7.1 | 11.7 ± 4.7 | 13.1 ± 7.1 | 12.8 ± 9.4 |
| Protein lunch, g | 59.5 ± 33.6 | 54.8 ± 26.4 | 58.5 ± 28.4 | 70.2 ± 28.4 | 56.2 ± 28.5 | 50.8 ± 22.0 | 56.4 ± 30.8 | 56.3 ± 28.1 | 56.3 ± 27.7 |
| Protein dinner, g | 31.0 ± 29.7 | 23.9 ± 27.2 | 21.7 ± 25.7 | 28.3 ± 30.9 | 25.8 ± 27.7 | 14.9 ± 21.0 | 25.4 ± 29.3 | 24.8 ± 27.6 | 21.6 ± 24.8 |
| Protein breakfast, g/kg | 0.17 ± 0.09 | 0.19 ± 0.10 | 0.17 ± 0.12 | 0.20 ± 0.09 | 0.18 ± 0.11 | 0.18 ± 0.10 | 0.17 ± 0.81 | 0.19 ± 0.11 | 0.18 ± 0.11 |
| Protein lunch, g/kg | 0.90 ± 0.55 | 0.81 ± 0.41 | 0.86 ± 0.41 | 1.1 ± 0.46 | 0.82 ± 0.44 | 0.76 ± 0.30 | 0.82 ± 0.50 | 0.83 ± 0.43 | 0.85 ± 0.3. |
| Protein dinner, g/kg | 0.49 ± 0.49 | 0.35 ± 0.40 | 0.30 ± 0.37 | 0.46 ± 0.51 | 0.38 ± 0.41 | 0.20 ± 0.29 | 0.40 ± 0.48 | 0.36 ± 0.41 | 0.30 ± 0.37 |
| FRAIL | mFP | SOF | |||||||
|---|---|---|---|---|---|---|---|---|---|
| Variables | Robust (n = 22) | Pre-Frail (n = 126) | Frail (n = 52) | Robust (n = 15) | Pre-Frail (n = 154) | Frail (n = 31) | Robust (n = 27) | Pre-Frail (n = 127) | Frail (n = 46) |
| Protein, g/kg | |||||||||
| <0.8 | 0 (0.0) | 8 (4.0) | 3 (1.5) | 0 (0.0) | 10 (5.0) | 1 (5.0) | 0 (0.0) | 7 (3.5) | 4 (2.0) |
| ≥0.8 | 22 (11.0) | 118 (59.0) | 49 (24.5) | 14 (7.0) | 144 (72.4) | 30 (15.1) | 27 (13.5) | 120 (60.0) | 42 (21.0) |
| Protein, g/kg | |||||||||
| <1.0 | 2 (1.0) | 27 (13.5) | 10 (5.0) | 0 (0.0) | 30 (15.1) | 9 (4.5) | 4 (2.0) | 26 (13.0) | 9 (4.5) |
| ≥1.0 | 20 (10.0) | 99 (49.5) | 42 (21.0) | 14 (7.0) | 124 (62.3) | 22 (11.1) | 23 (11.5) | 101 (50.5) | 37 (18.5) |
| Protein, g/kg | |||||||||
| <1.2 | 10 (5.0) | 39 (19.5) | 16 (8.0) | 2 (1.0) | 50 (25.1) | 12 (6.0) | 12 (6.0) | 38 (19.0) | 15 (7.5) |
| ≥1.2 | 12 (6.0) | 87 (43.5) | 36 (18.0) | 12 (6.0) | 104 (52.3) | 19 (9.5) | 15 (7.5) | 89 (44.5) | 31 (15.5) |
| Protein, g/kg | |||||||||
| <1.5 | 12 (6.0) | 66 (33.0) | 25 (12.5) | 4 (2.0) | 78 (39.2) | 20 (10.1) | 17 (8.5) | 65 (32.5) | 21 (10.5) |
| ≥1.5 | 10 (5.0) | 60 (30.0) | 27 (13.5) | 10 (5.0) | 76 (38.2) | 11 (5.5) | 10 (5.0) | 62 (31.0) | 25 (12.5) |
| Isoleucine, g | |||||||||
| <4.4 | 12 (6.0) | 62 (31.0) | 25 (12.5) | 5 (2.5) | 67 (33.7) | 26 (13.1) | 17 (8.5) | 56 (28.0) | 26 (13.0) |
| ≥4.4 | 10 (5.0) | 64 (32.0) | 27 (13.5) | 9 (4.5) | 87 (43.7)* | 5 (2.5)* | 10 (5.0) | 71 (35.5) | 20 (10.0) |
| Leucine, g | |||||||||
| <7.1 | 11 (5.5) | 62 (31.0) | 26 (13.0) | 5 (2.5) | 67 (33.7) | 26 (13.1) | 16 (8.0) | 56 (28.0) | 27 (13.5) |
| ≥7.1 | 11 (5.5) | 64 (32.0) | 26 (13.0) | 9 (4.5) | 87 (43.7)* | 5 (2.5)* | 11 (5.5) | 71 (35.5) | 19 (9.5) |
| Valine, g | |||||||||
| <4.7 | 12 (6.0) | 62 (31.0) | 26 (13.0) | 5 (2.5) | 68 (34.2) | 26 (13.1) | 17 (8.5) | 57 (28.5) | 26 (13.0) |
| ≥4.7 | 10 (5.0) | 64 (32.0) | 26 (13.0) | 9 (4.5) | 86 (43.2) * | 5 (2.5) * | 10 (5.0) | 70 (35.0) | 20 (10.0) |
| CV | |||||||||
| <0.38 | 6 (3.0) | 52 (26.0) | 18 (9.0) | 6 (3.0) | 57 (28.6) | 13 (6.5) | 6 (3.0) | 53 (26.5) | 17 (8.5) |
| 0.38–0.45 | 16 (8.0) | 71 (35.5) | 32 (16.0) | 8 (4.0) | 94 (47.2) | 16 (8.0) | 21 (10.5) | 71 (35.5) | 27 (13.5) |
| >0.45 | 0 (0.0) | 3 (1.5) | 2 (1.0) | 0 (0.0) | 3 (1.5) | 2 (1.0) | 0 (0.0) | 3 (1.5) | 2 (1.0) |
| ≥0.4 g protein/kg/meal | |||||||||
| 0 | 1 (5.0) | 15 (7.5) | 8 (4.0) | 1 (5.0) | 19 (9.5) | 4 (2.0) | 1 (5.0) | 16 (8.0) | 7 (3.5) |
| 1 | 14 (7.0) | 74 (37.0) | 28 (14.0) | 9 (4.5) | 84 (42.2) | 22 (11.1) | 19 (9.5) | 72 (36.0 | 25 (12.5) |
| ≥2 | 7 (3.5) | 37 (18.5) | 16 (8.0) | 4 (2.0) | 51 (25.6) | 5 (2.5) | 7 (3.5) | 39 (19.5) | 14 (7.0) |
| ≥30 g protein/meal | |||||||||
| 0 | 1 (5.0) | 15 (7.5) | 8 (4.0) | 1 (5.0) | 19 (9.5) | 4 (2.0) | 1 (5.0) | 16 (8.0) | 7 (3.5) |
| 1 | 14 (7.0) | 74 (37.0) | 28 (14.0) | 9 (4.5) | 84 (42.2) | 22 (11.1) | 19 (9.5) | 72 (36.0 | 25 (12.5) |
| ≥2 | 7 (3.5) | 37 (18.5) | 16 (8.0) | 4 (2.0) | 51 (25.6) | 5 (2.5) | 7 (3.5) | 39 (19.5) | 14 (7.0) |
© 2020 by the authors. Licensee MDPI, Basel, Switzerland. This article is an open access article distributed under the terms and conditions of the Creative Commons Attribution (CC BY) license (http://creativecommons.org/licenses/by/4.0/).
Share and Cite
Coelho-Júnior, H.J.; Calvani, R.; Picca, A.; Gonçalves, I.O.; Landi, F.; Bernabei, R.; Cesari, M.; Uchida, M.C.; Marzetti, E. Protein-Related Dietary Parameters and Frailty Status in Older Community-Dwellers across Different Frailty Instruments. Nutrients 2020, 12, 508. https://doi.org/10.3390/nu12020508
Coelho-Júnior HJ, Calvani R, Picca A, Gonçalves IO, Landi F, Bernabei R, Cesari M, Uchida MC, Marzetti E. Protein-Related Dietary Parameters and Frailty Status in Older Community-Dwellers across Different Frailty Instruments. Nutrients. 2020; 12(2):508. https://doi.org/10.3390/nu12020508
Chicago/Turabian StyleCoelho-Júnior, Hélio J., Riccardo Calvani, Anna Picca, Ivan O. Gonçalves, Francesco Landi, Roberto Bernabei, Matteo Cesari, Marco C. Uchida, and Emanuele Marzetti. 2020. "Protein-Related Dietary Parameters and Frailty Status in Older Community-Dwellers across Different Frailty Instruments" Nutrients 12, no. 2: 508. https://doi.org/10.3390/nu12020508
APA StyleCoelho-Júnior, H. J., Calvani, R., Picca, A., Gonçalves, I. O., Landi, F., Bernabei, R., Cesari, M., Uchida, M. C., & Marzetti, E. (2020). Protein-Related Dietary Parameters and Frailty Status in Older Community-Dwellers across Different Frailty Instruments. Nutrients, 12(2), 508. https://doi.org/10.3390/nu12020508