Effect of High Versus Low Carbohydrate Intake in the Morning on Glycemic Variability and Glycemic Control Measured by Continuous Blood Glucose Monitoring in Women with Gestational Diabetes Mellitus—A Randomized Crossover Study

 , , ,
, , ,
Abstract
1. Introduction
2. Materials and Methods
2.1. Study Design and Population
2.2. Intervention
2.3. CGM-Measurements and -Parameter Calculation
2.4. Blood Samples
2.5. Sample Size and Power Analysis
2.6. Statistical Analysis
3. Results
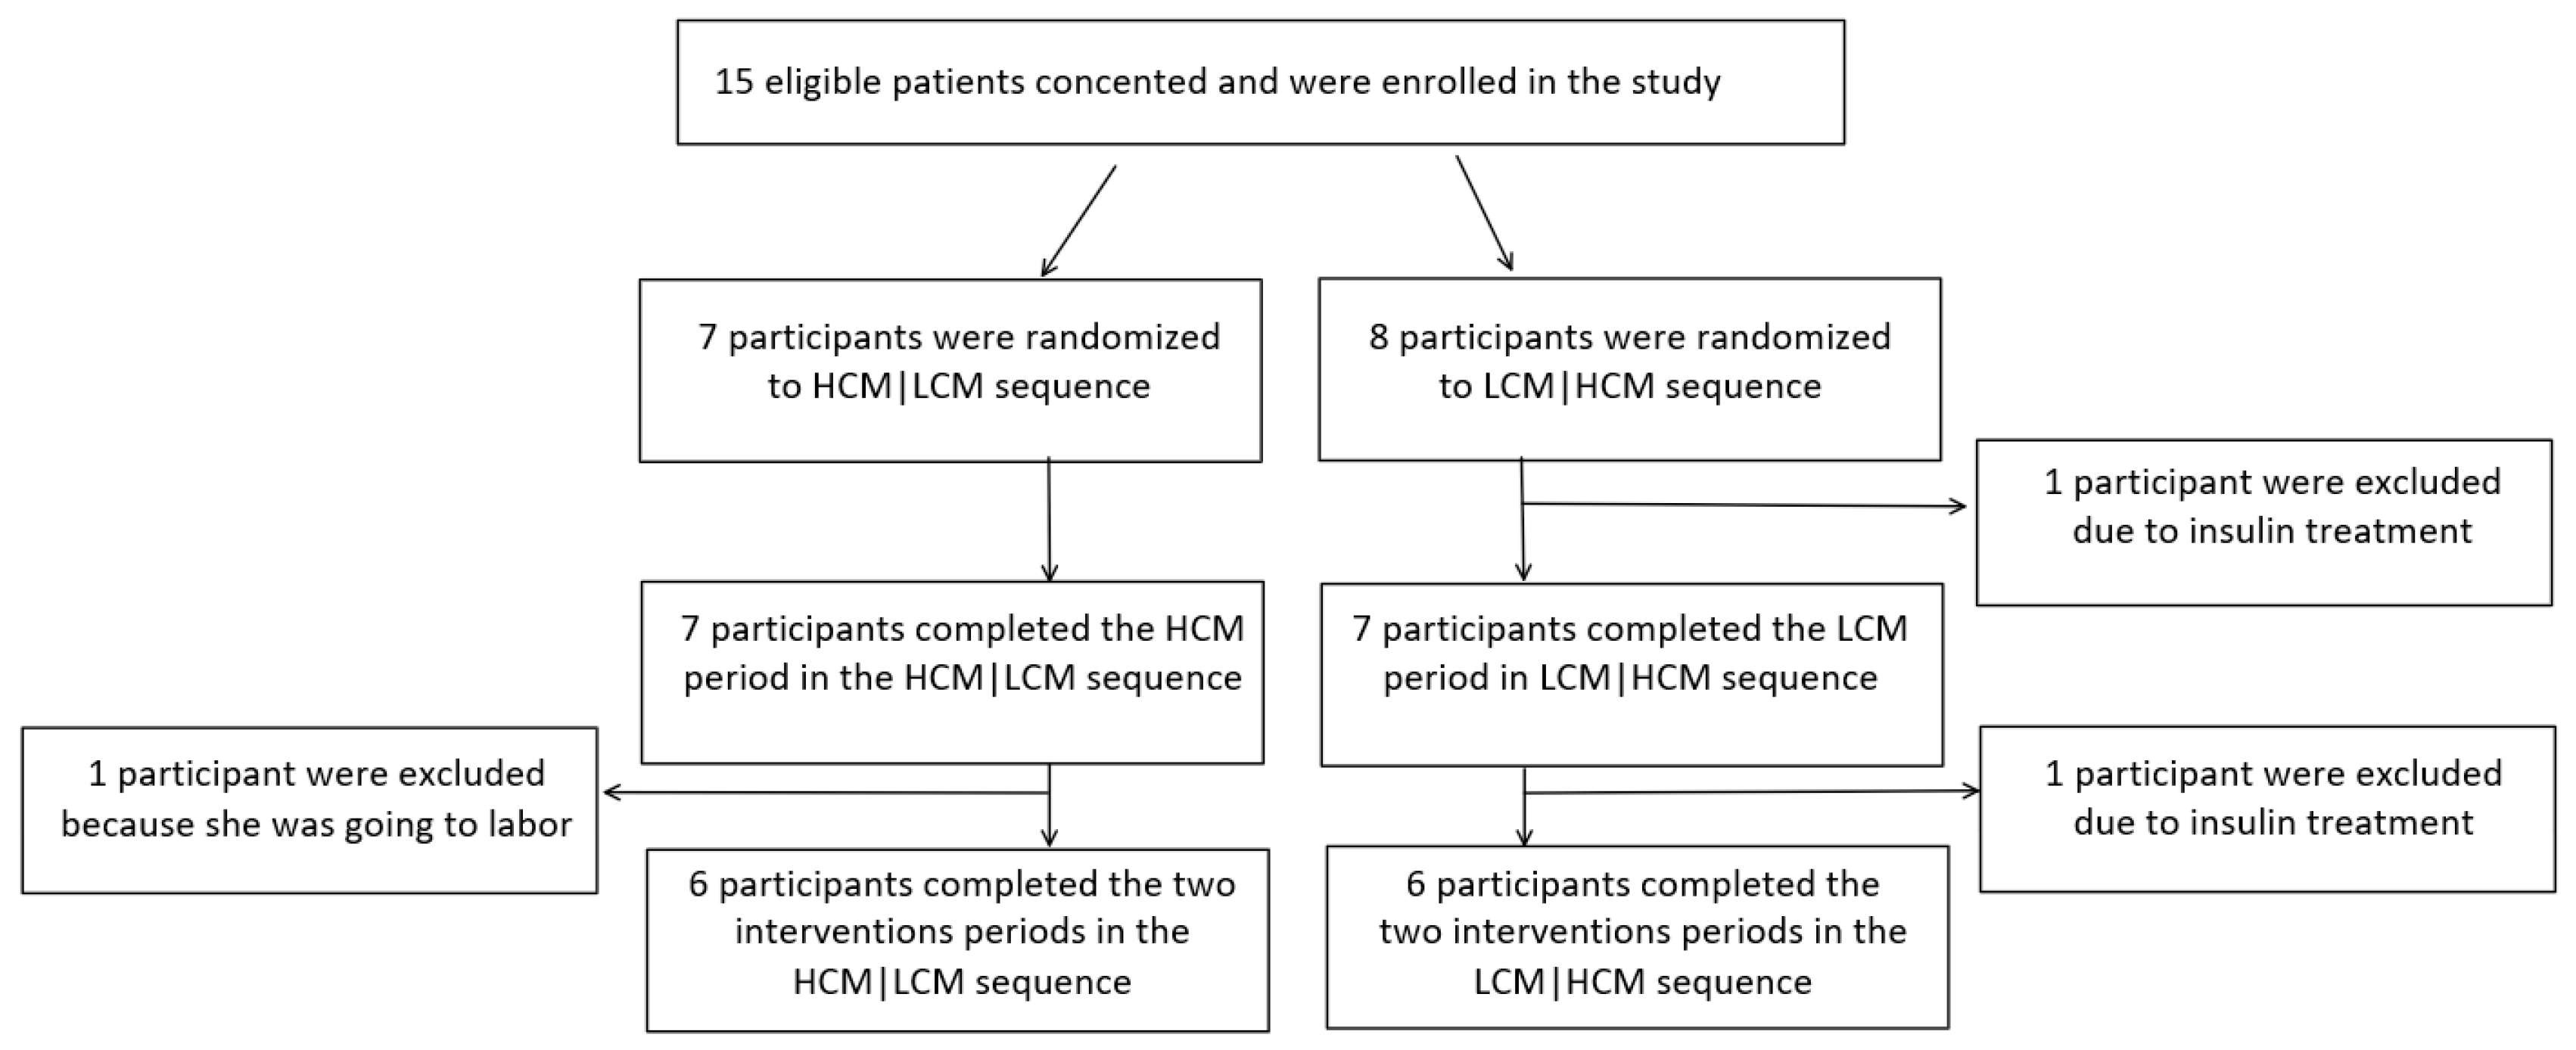
3.1. Participants
3.2. Comparison between HCM and LCM-Diet on Parameters of Glycemic Variability and Glycemic Control
3.3. HOMA-IR
3.4. Tertiary Outcomes
3.5. Food Intake
4. Discussion
4.1. Glycemic Variability and Glycemic Control
4.2. Carbohydrate Content of the Two Diets
4.3. CGM Data
5. Conclusions
Author Contributions
Funding
Acknowledgments
Conflicts of Interest
References
- Sonagra, A.D.; Biradar, S.M.; Dattatreya, K.; Murthy, D.S.J. Normal pregnancy- a state of insulin resistance. J. Clin. Diagn. Res. 2014, 8, C01–C03. [Google Scholar] [CrossRef]
- Wendland, E.M.; Torloni, M.R.; Falavigna, M.; Trujillo, J.; Dode, M.A.; Campos, M.A.; Duncan, B.B.; Schmidt, M.I. Gestational diabetes and pregnancy outcomes--a systematic review of the World Health Organization (WHO) and the International Association of Diabetes in Pregnancy Study Groups (IADPSG) diagnostic criteria. BMC Pregnancy Childbirth 2012, 12, 23. [Google Scholar] [CrossRef]
- Ulla Kampmann, S.K.; Jens, F.; Per, O. Determinants of Maternal Insulin Resistance during Pregnancy: An Updated Overview. J. Diabetes Res. 2019, 2019, 9. [Google Scholar] [CrossRef] [PubMed]
- Ovesen, P.G.; Fuglsang, J.; Andersen, M.B.; Wolff, C.; Petersen, O.B.; David McIntyre, H. Temporal trends in gestational diabetes prevalence, treatment, and outcomes at Aarhus university hospital, skejby, between 2004 and 2016. J. Diabetes Res. 2018, 2018, 5937059. [Google Scholar] [CrossRef] [PubMed]
- McIntyre, H.D.; Catalano, P.; Zhang, C.; Desoye, G.; Mathiesen, E.R.; Damm, P. Gestational diabetes mellitus. Nat. Rev. Dis. Primers 2019, 5, 47. [Google Scholar] [CrossRef] [PubMed]
- Mathiesen, E.R.; Vaz, J.A. Insulin treatment in diabetic pregnancy. Diabetes/Metab. Res. Rev. 2008, 24, S3–S20. [Google Scholar] [CrossRef]
- Dalfra, M.G.; Sartore, G.; Di Cianni, G.; Mello, G.; Lencioni, C.; Ottanelli, S.; Sposato, J.; Valgimigli, F.; Scuffi, C.; Scalese, M.; et al. Glucose variability in diabetic pregnancy. Diabetes Technol. Ther. 2011, 13, 853–859. [Google Scholar] [CrossRef] [PubMed]
- Zawiejska, A.; Wender-Ozegowska, E.; Radzicka, S.; Brazert, J. Maternal hyperglycemia according to IADPSG criteria as a predictor of perinatal complications in women with gestational diabetes: A retrospective observational study. J. Matern. Fetal. Neonatal Med. 2014, 27, 1526–1530. [Google Scholar] [CrossRef]
- Kampmann, U.; Madsen, L.R.; Skajaa, G.O.; Iversen, D.S.; Moeller, N.; Ovesen, P. Gestational diabetes: A clinical update. World J. Diabetes 2015, 6, 1065–1072. [Google Scholar] [CrossRef]
- Ceriello, A.; Ihnat, M.A. ’Glycaemic variability’: A new therapeutic challenge in diabetes and the critical care setting. Diabet. Med. J. Br. Diabet. Assoc. 2010, 27, 862–867. [Google Scholar] [CrossRef]
- Herranz, L.; Pallardo, L.F.; Hillman, N.; Martin-Vaquero, P.; Villarroel, A.; Fernandez, A. Maternal third trimester hyperglycaemic excursions predict large-for-gestational-age infants in type 1 diabetic pregnancy. Diabetes Res. Clin. Pract. 2007, 75, 42–46. [Google Scholar] [CrossRef] [PubMed]
- Kestila, K.K.; Ekblad, U.U.; Ronnemaa, T. Continuous glucose monitoring versus self-monitoring of blood glucose in the treatment of gestational diabetes mellitus. Diabetes Res. Clin. Pract. 2007, 77, 174–179. [Google Scholar] [CrossRef]
- Su, J.B.; Wang, X.Q.; Chen, J.F.; Wu, G.; Jin, Y.; Xu, F.; Wang, X.H.; Liu, Y.T. Glycemic variability in gestational diabetes mellitus and its association with beta cell function. Endocrine 2013, 43, 370–375. [Google Scholar] [CrossRef] [PubMed]
- Moreno-Castilla, C.; Mauricio, D.; Hernandez, M. Role of Medical Nutrition Therapy in the Management of Gestational Diabetes Mellitus. Curr. Diabetes Rep. 2016, 16, 22. [Google Scholar] [CrossRef] [PubMed]
- Peterson, C.M.; Jovanovic-Peterson, L. Percentage of carbohydrate and glycemic response to breakfast, lunch, and dinner in women with gestational diabetes. Diabetes 1991, 40, 172–174. [Google Scholar] [CrossRef] [PubMed]
- Gunderson, E.P. Gestational diabetes and nutritional recommendations. Curr. Diabetes Rep. 2004, 4, 377–386. [Google Scholar] [CrossRef]
- Ovesen, P.; Damm, P.; Renault, K.; Holm, A.M.; Wolff, C.; Knold, B.; Jensen, B.P.; Møller, M.; Svare, J.; Bødker, B.; et al. Sandbjerg 2007–GUIDELINE; Behandling af gestationel diabetes mellitus; DSOG (Danish Society of Obstetrics and Gynecology): Middelfart, Denmark, 2007. [Google Scholar]
- Jakubowicz, D.; Wainstein, J.; Ahren, B.; Bar-Dayan, Y.; Landau, Z.; Rabinovitz, H.R.; Froy, O. High-energy breakfast with low-energy dinner decreases overall daily hyperglycaemia in type 2 diabetic patients: A randomised clinical trial. Diabetologia 2015, 58, 912–919. [Google Scholar] [CrossRef]
- 1Tamas, G.; Kerenyi, Z. Gestational diabetes: Current aspects on pathogenesis and treatment. Exp. Clin. Endocrinol. Diabetes 2001, 109, S400–S411. [Google Scholar] [CrossRef]
- Read, K.; LaPolla, F.W.Z. A new hat for librarians: providing REDCap support to establish the library as a central data hub. J. Med. Libr. Assoc. 2018, 106, 120–126. [Google Scholar] [CrossRef]
- WHO. Diagnostic criteria and classification of hyperglycaemia first detected in pregnancy: A World Health Organization Guideline. Diabetes Res. Clin. Pract. 2014, 103, 341–363. [Google Scholar] [CrossRef]
- Henry, C.J. Basal metabolic rate studies in humans: Measurement and development of new equations. Public Health Nutr. 2005, 8, 1133–1152. [Google Scholar] [CrossRef]
- Ann, L.Y.; Kathleen, M.; Rasmussen; National Research Council; Institute of Medicine; Board on Children; Youth, F.; Committee to Reexamine IOM Pregnancy Weight Guidelines. Weight Gain During Pregnancy: Reexamining the Guidelines (2009); Rasmussen, K.M., Yaktine, A.L., Eds.; The National Academies Press: Washington, DC, USA, 2009. [Google Scholar]
- Oxford, U.o. HOMA2 CALCULATOR. Available online: https://www.dtu.ox.ac.uk/homacalculator/download.php (accessed on 18 August 2019).
- Dalfra, M.G.; Chilelli, N.C.; Di Cianni, G.; Mello, G.; Lencioni, C.; Biagioni, S.; Scalese, M.; Sartore, G.; Lapolla, A. Glucose Fluctuations during Gestation: An Additional Tool for Monitoring Pregnancy Complicated by Diabetes. Int. J. Endocrinol. 2013, 2013, 279021. [Google Scholar] [CrossRef]
- Yu, X.; Lin, L.; Shen, J.; Chen, Z.; Jian, J.; Li, B.; Xin, S.X. Calculating the Mean Amplitude of Glycemic Excursions from Continuous Glucose Data Using an Open-Code Programmable Algorithm Based on the Integer Nonlinear Method. Comput. Math. Methods Med. 2018, 2018, 6286893. [Google Scholar] [CrossRef] [PubMed]
- Panyakat, W.S.; Phatihattakorn, C.; Sriwijitkamol, A.; Sunsaneevithayakul, P.; Phaophan, A.; Phichitkanka, A. Correlation Between Third Trimester Glycemic Variability in Non-Insulin-Dependent Gestational Diabetes Mellitus and Adverse Pregnancy and Fetal Outcomes. J. Diabetes Sci. Technol. 2018, 12, 622–629. [Google Scholar] [CrossRef] [PubMed]
- Danne, T.; Nimri, R.; Battelino, T.; Bergenstal, R.M.; Close, K.L.; DeVries, J.H.; Garg, S.; Heinemann, L.; Hirsch, I.; Amiel, S.A.; et al. International Consensus on Use of Continuous Glucose Monitoring. Diabetes Care 2017, 40, 1631–1640. [Google Scholar] [CrossRef] [PubMed]
- Kerssen, A.; de Valk, H.W.; Visser, G.H. The Continuous Glucose Monitoring System during pregnancy of women with type 1 diabetes mellitus: Accuracy assessment. Diabetes Technol. Ther. 2004, 6, 645–651. [Google Scholar] [CrossRef] [PubMed]
- Kerssen, A.; De Valk, H.W.; Visser, G.H. Validation of the Continuous Glucose Monitoring System (CGMS) by the use of two CGMS simultaneously in pregnant women with type 1 diabetes mellitus. Diabetes Technol. Ther. 2005, 7, 699–706. [Google Scholar] [CrossRef] [PubMed]


| Nutrient | |
|---|---|
| Carbohydrates | 45–60 E% |
| Fibers | >28 g |
| Sugar (added) | 10 E% |
| Protein | 10–20 E% |
| Fat | 25–40 E% |
| SFA | <10 E% |
| PUFA | 5–10 E% |
| MUFA | 10–20 E% |
| HCM | LCM | |
|---|---|---|
| Energy distribution Calories as a percentage of total calorie content during the day | Breakfast: 25%–30% | Breakfast: 15%–20% |
| morning-snack: 15%–20% | Lunch: 25%–30% | |
| Lunch: 25%–30% | Afternoon-snack: 10%–15% | |
| Afternoon-snack: 10%–15% | Dinner: 30%–35% | |
| Dinner: 15%–20% | Late-night-snack: 15%–20% | |
| Carbohydrate distribution Carbohydrate as a percentage of total carbohydrate content during the day | morning: 50%
| morning: 10% Lunch: 40%
|
| All Study Participants (n = 12) | |
|---|---|
| Age at Debut (year) | 33.6 (6.7) |
| Pregestational weight (kg) | 68.6 (11.3) |
| GA (weeks) | 33.5 (2.3) |
| Parity (n (%)) | |
| 0 | 6 (50) |
| 1 | 2 (17) |
| 2 | 4 (33) |
| BMI (kg/m2) | 25.2 (4.0) |
| GWG (kg) | 12.8 (7.7) |
| OGTT (mmol/L) | 9.7 (0.7) |
| HbA1C | 5.3 (2.5) |
| (%) (mmol/mol) | (34.4 (4.2)) |
| Average BS (mmol/mol) | 5.8 (0.6) |
| Systolic BP (mmHg) | 115.1 (9.4) |
| Diastolic BP (mmHg) | 75.4 (6.3) |
| HCM (n = 12) Mean (SD) | LCM (n = 12) Mean (SD) | Difference (95% CI) | p-Value | |
|---|---|---|---|---|
| Glycemic Variability | ||||
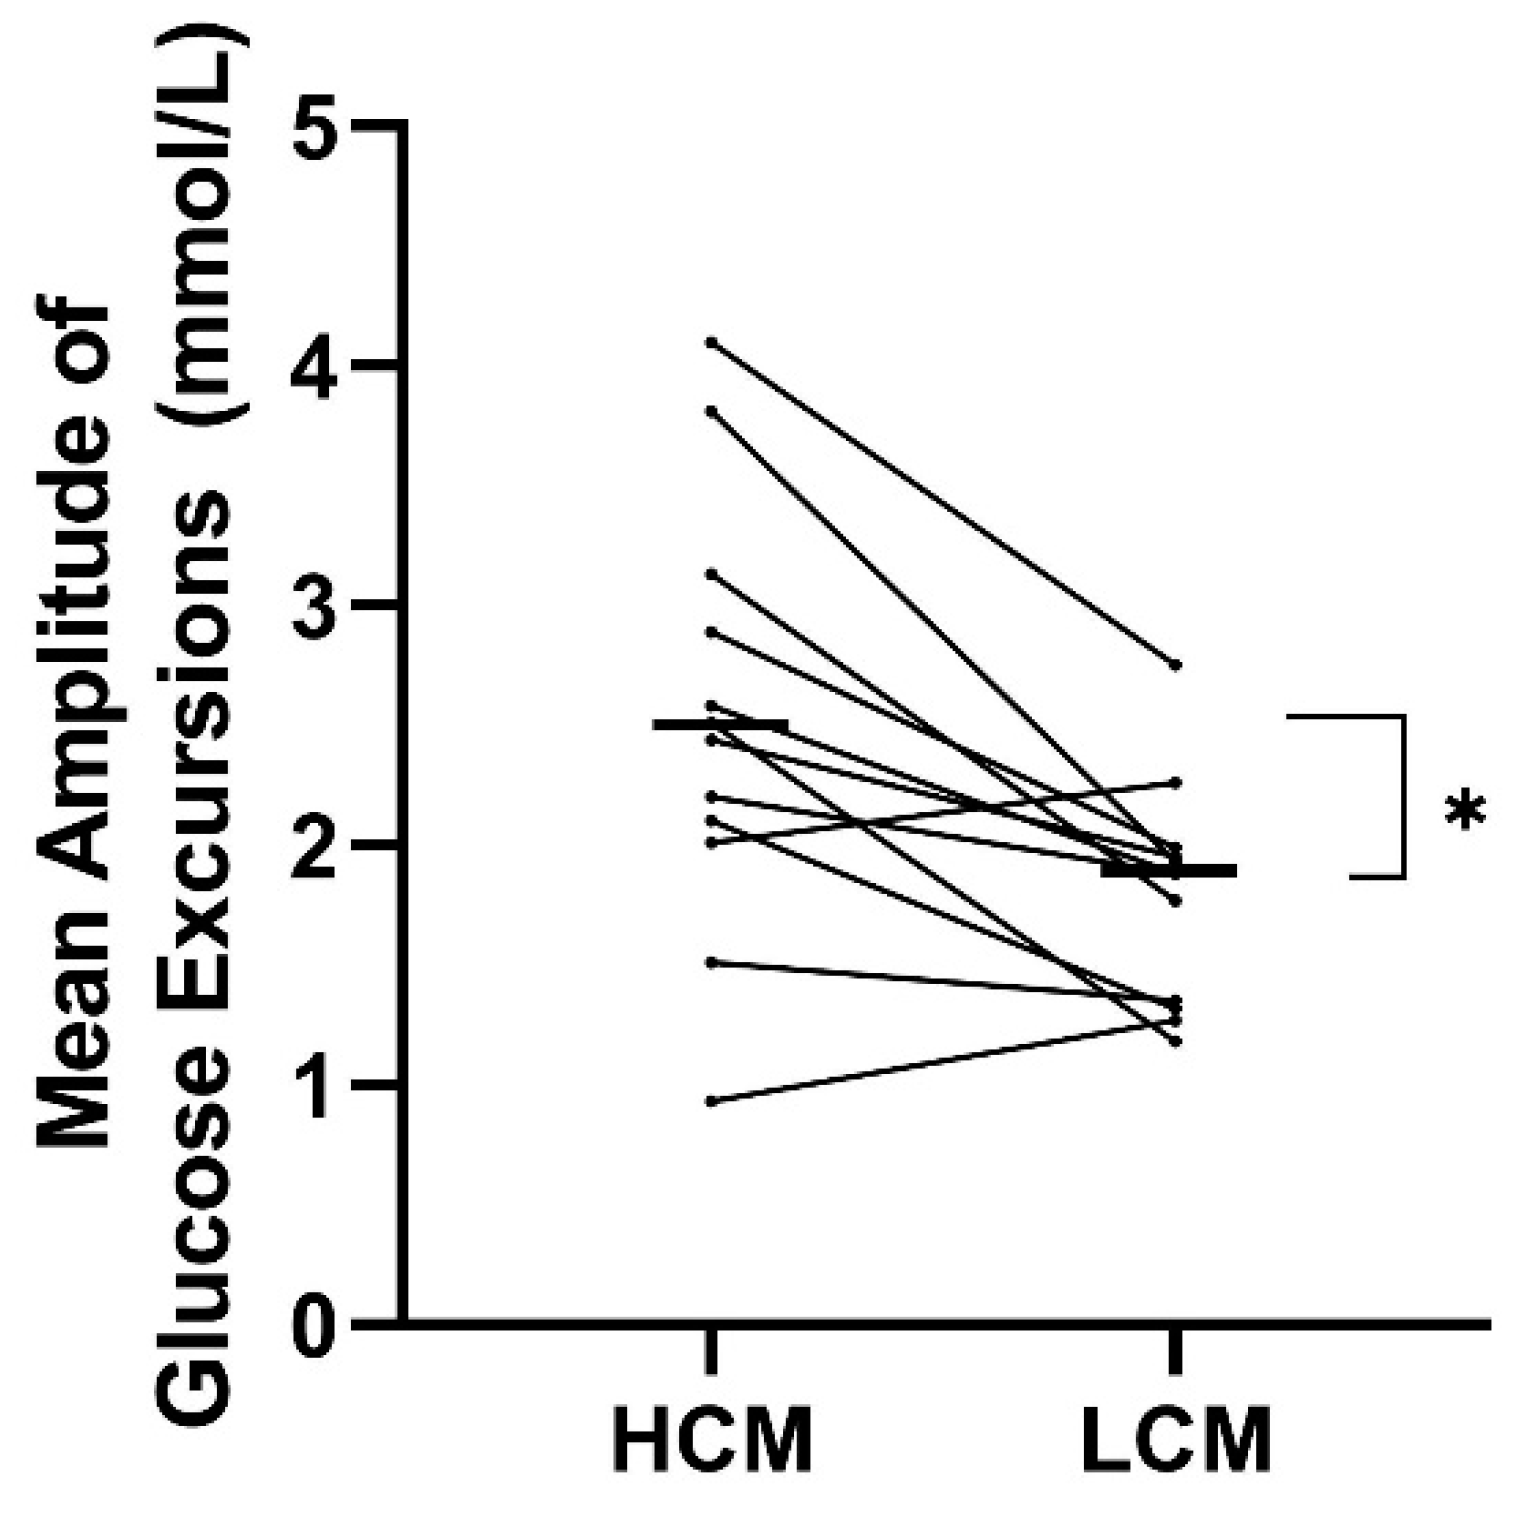
| MAGE (mmol/L) | 2.5 (1.8) | 1.9 (0.5) | 0.7 (0.3;1.2) | 0.004 |
| CV (%) | 20.1 (5.9) | 14.9 (3.6) | 5.1 (1.5;8.8) | 0.01 |
| SD | 1.0 (0.3 | 0.8 (0.2) | 0.2 (0.0;0.4) | 0.02 |
| TIR (%) | 93.46(8.7) | 97.96(3.2) | −4.5(−9.7;0.7) | 0.08 |
| TBR (%) | 6.42(8.5) | 2.04(3.2) | 4.38(-0.7-9.5) | 0.09 |
| TAR (%) | 1.64(2.6) | 1.06(2.5) | 0.58(-0.78;1.93) | 0.37 |
| Glycemic Control | ||||
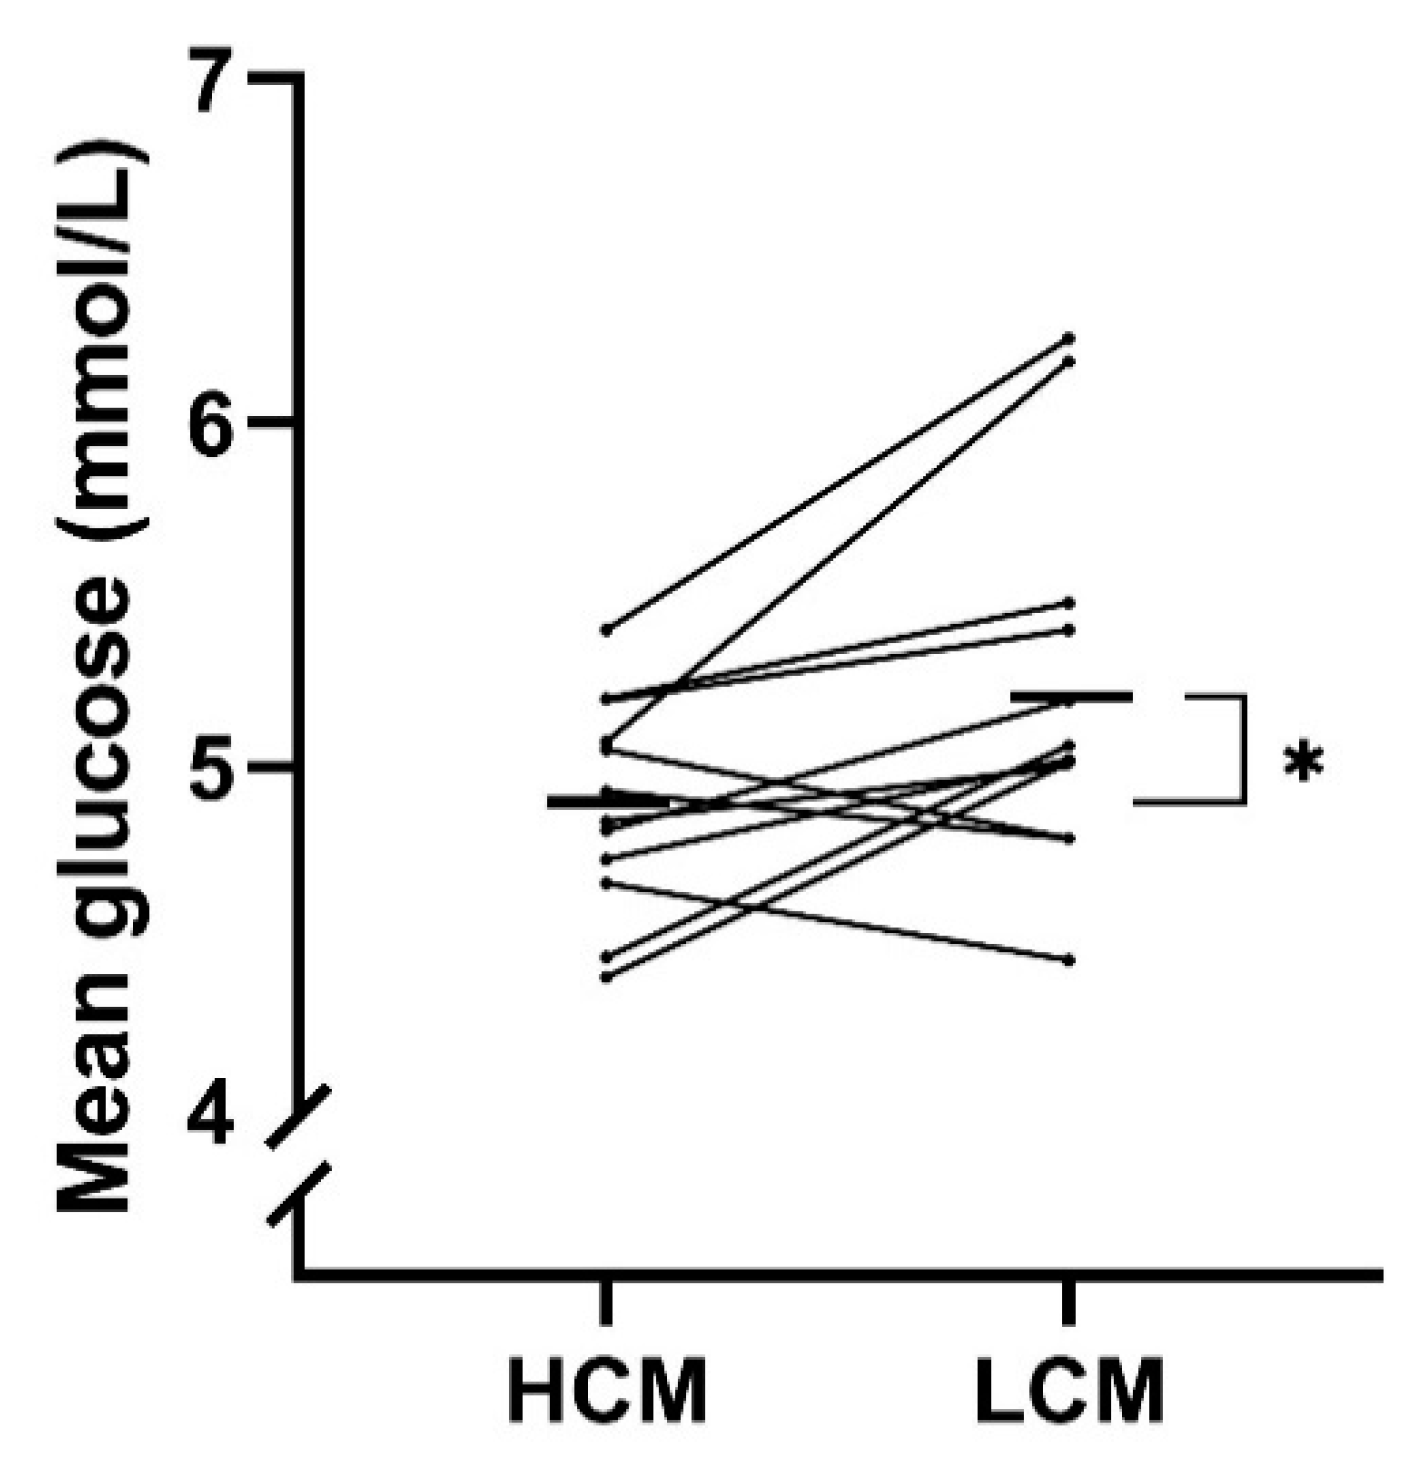
| MG (mmol/L) | 4.9 (0.3) | 5.2 (0.5) | −0.3 (−0.6; −0.1) | 0.02 |
| ∆C-peptide (pmol/L) | −82.3 (109.1) | 71.9 (363.9) | −154.2 (−381.4;73.0) | 0.16 |
| FBGstart | 4.85(0.5) | 4.88(0.6) | −0.025(−0.2;0.1) | 0.75 |
| FBGend | 4.62(0.4) | 5.07(0.5) | −0.45(−0.7; −02) | 0.0007 |
| ∆FBG (mmol/L) | −0.2 (0.2) | 0.2 (0.5) | −0.4 (−0.7; −0.1) | 0.01 |
| HCM (n = 12) Mean (SD) | LCM (n = 12) Mean (SD) | Difference (95% CI) | p-Value | |
|---|---|---|---|---|
| ∆p-total cholesterol (mmol/L) | 0.0 (0.250) | 0.1 (0.2) | −0.0 (−0.2; 0.2) | 0.87 |
| ∆p-LDL cholesterol (mmol/L) | −0.2 (0.408) | 0.2 (0.4) | −0.4 (−0.9; 0.0) | 0.07 |
| ∆p-HDL cholesterol (mmol/L) | 0.0 (0.1) | 0.1 (0.1) | −0.0 (−0.1; 0.1) | 0.83 |
| ∆p-triglycerides (mmol/L) | −0.0 (0.3) | −0.2 (0.5) | 0.3 (−0.1; 0.6) | 0.15 |
| ∆CRP (mg/L) | −0.8 (2.1) | 1.4 (4.5) | −2.2 (−6.3; 1.9) | 0.27 |
| ∆3-hydroxy-byturat (mmol/L) | −0.2 (0.8) | −0.5 (1.0) | 0.2 (−0.7; 1.1) | 0.57 |
| HCM Mean (SD) | LCM Mean (SD) | Difference (95% CI) | p-Value | |
|---|---|---|---|---|
| Energy, kcal | 2012 (263) | 2055 (2740) | −43.33 (−126.6; 40.0) | p = 0.28 |
| Carbohydrates, g | 222 (28) | 215 (36) | 6.2 g (−2.9; 15.4) | p = 0.16 |
| Dietary fiber, g | 38.79 (5.8) | 39.50 (8.0) | −0.71(4.3; 2.9) | p = 0.68 |
| Fat, g | 73 (10) | 82 (10) | −9.9 g (−16.5; −3.2) | p = 0.007 |
| Protein, g | 98 (15) | 94 (14) | 4.2 g (−0.6; 8.9) | p = 0.08 |
© 2020 by the authors. Licensee MDPI, Basel, Switzerland. This article is an open access article distributed under the terms and conditions of the Creative Commons Attribution (CC BY) license (http://creativecommons.org/licenses/by/4.0/).
Share and Cite
Rasmussen, L.; Christensen, M.L.; Poulsen, C.W.; Rud, C.; Christensen, A.S.; Andersen, J.R.; Kampmann, U.; Ovesen, P.G. Effect of High Versus Low Carbohydrate Intake in the Morning on Glycemic Variability and Glycemic Control Measured by Continuous Blood Glucose Monitoring in Women with Gestational Diabetes Mellitus—A Randomized Crossover Study. Nutrients 2020, 12, 475. https://doi.org/10.3390/nu12020475
Rasmussen L, Christensen ML, Poulsen CW, Rud C, Christensen AS, Andersen JR, Kampmann U, Ovesen PG. Effect of High Versus Low Carbohydrate Intake in the Morning on Glycemic Variability and Glycemic Control Measured by Continuous Blood Glucose Monitoring in Women with Gestational Diabetes Mellitus—A Randomized Crossover Study. Nutrients. 2020; 12(2):475. https://doi.org/10.3390/nu12020475
Chicago/Turabian StyleRasmussen, Louise, Maria Lund Christensen, Charlotte Wolff Poulsen, Charlotte Rud, Alexander Sidelmann Christensen, Jens Rikardt Andersen, Ulla Kampmann, and Per Glud Ovesen. 2020. "Effect of High Versus Low Carbohydrate Intake in the Morning on Glycemic Variability and Glycemic Control Measured by Continuous Blood Glucose Monitoring in Women with Gestational Diabetes Mellitus—A Randomized Crossover Study" Nutrients 12, no. 2: 475. https://doi.org/10.3390/nu12020475
APA StyleRasmussen, L., Christensen, M. L., Poulsen, C. W., Rud, C., Christensen, A. S., Andersen, J. R., Kampmann, U., & Ovesen, P. G. (2020). Effect of High Versus Low Carbohydrate Intake in the Morning on Glycemic Variability and Glycemic Control Measured by Continuous Blood Glucose Monitoring in Women with Gestational Diabetes Mellitus—A Randomized Crossover Study. Nutrients, 12(2), 475. https://doi.org/10.3390/nu12020475