Taste Changes in Patients with Inflammatory Bowel Disease: Associations with PROP Phenotypes and polymorphisms in the salivary protein, Gustin and CD36 Receptor Genes


 ,
,  , , , and
Abstract
1. Introduction
2. Materials and Methods
2.1. Subjects
2.2. Experimental Procedure
2.3. PROP Taster Status Classification
2.4. Sweet, Salty, Sour, Bitter and Umami Taste Sensitivity Assessments
2.5. Oleic Acid Threshold Assessment
2.6. Molecular Analysis
2.7. Data Analyses
3. Results
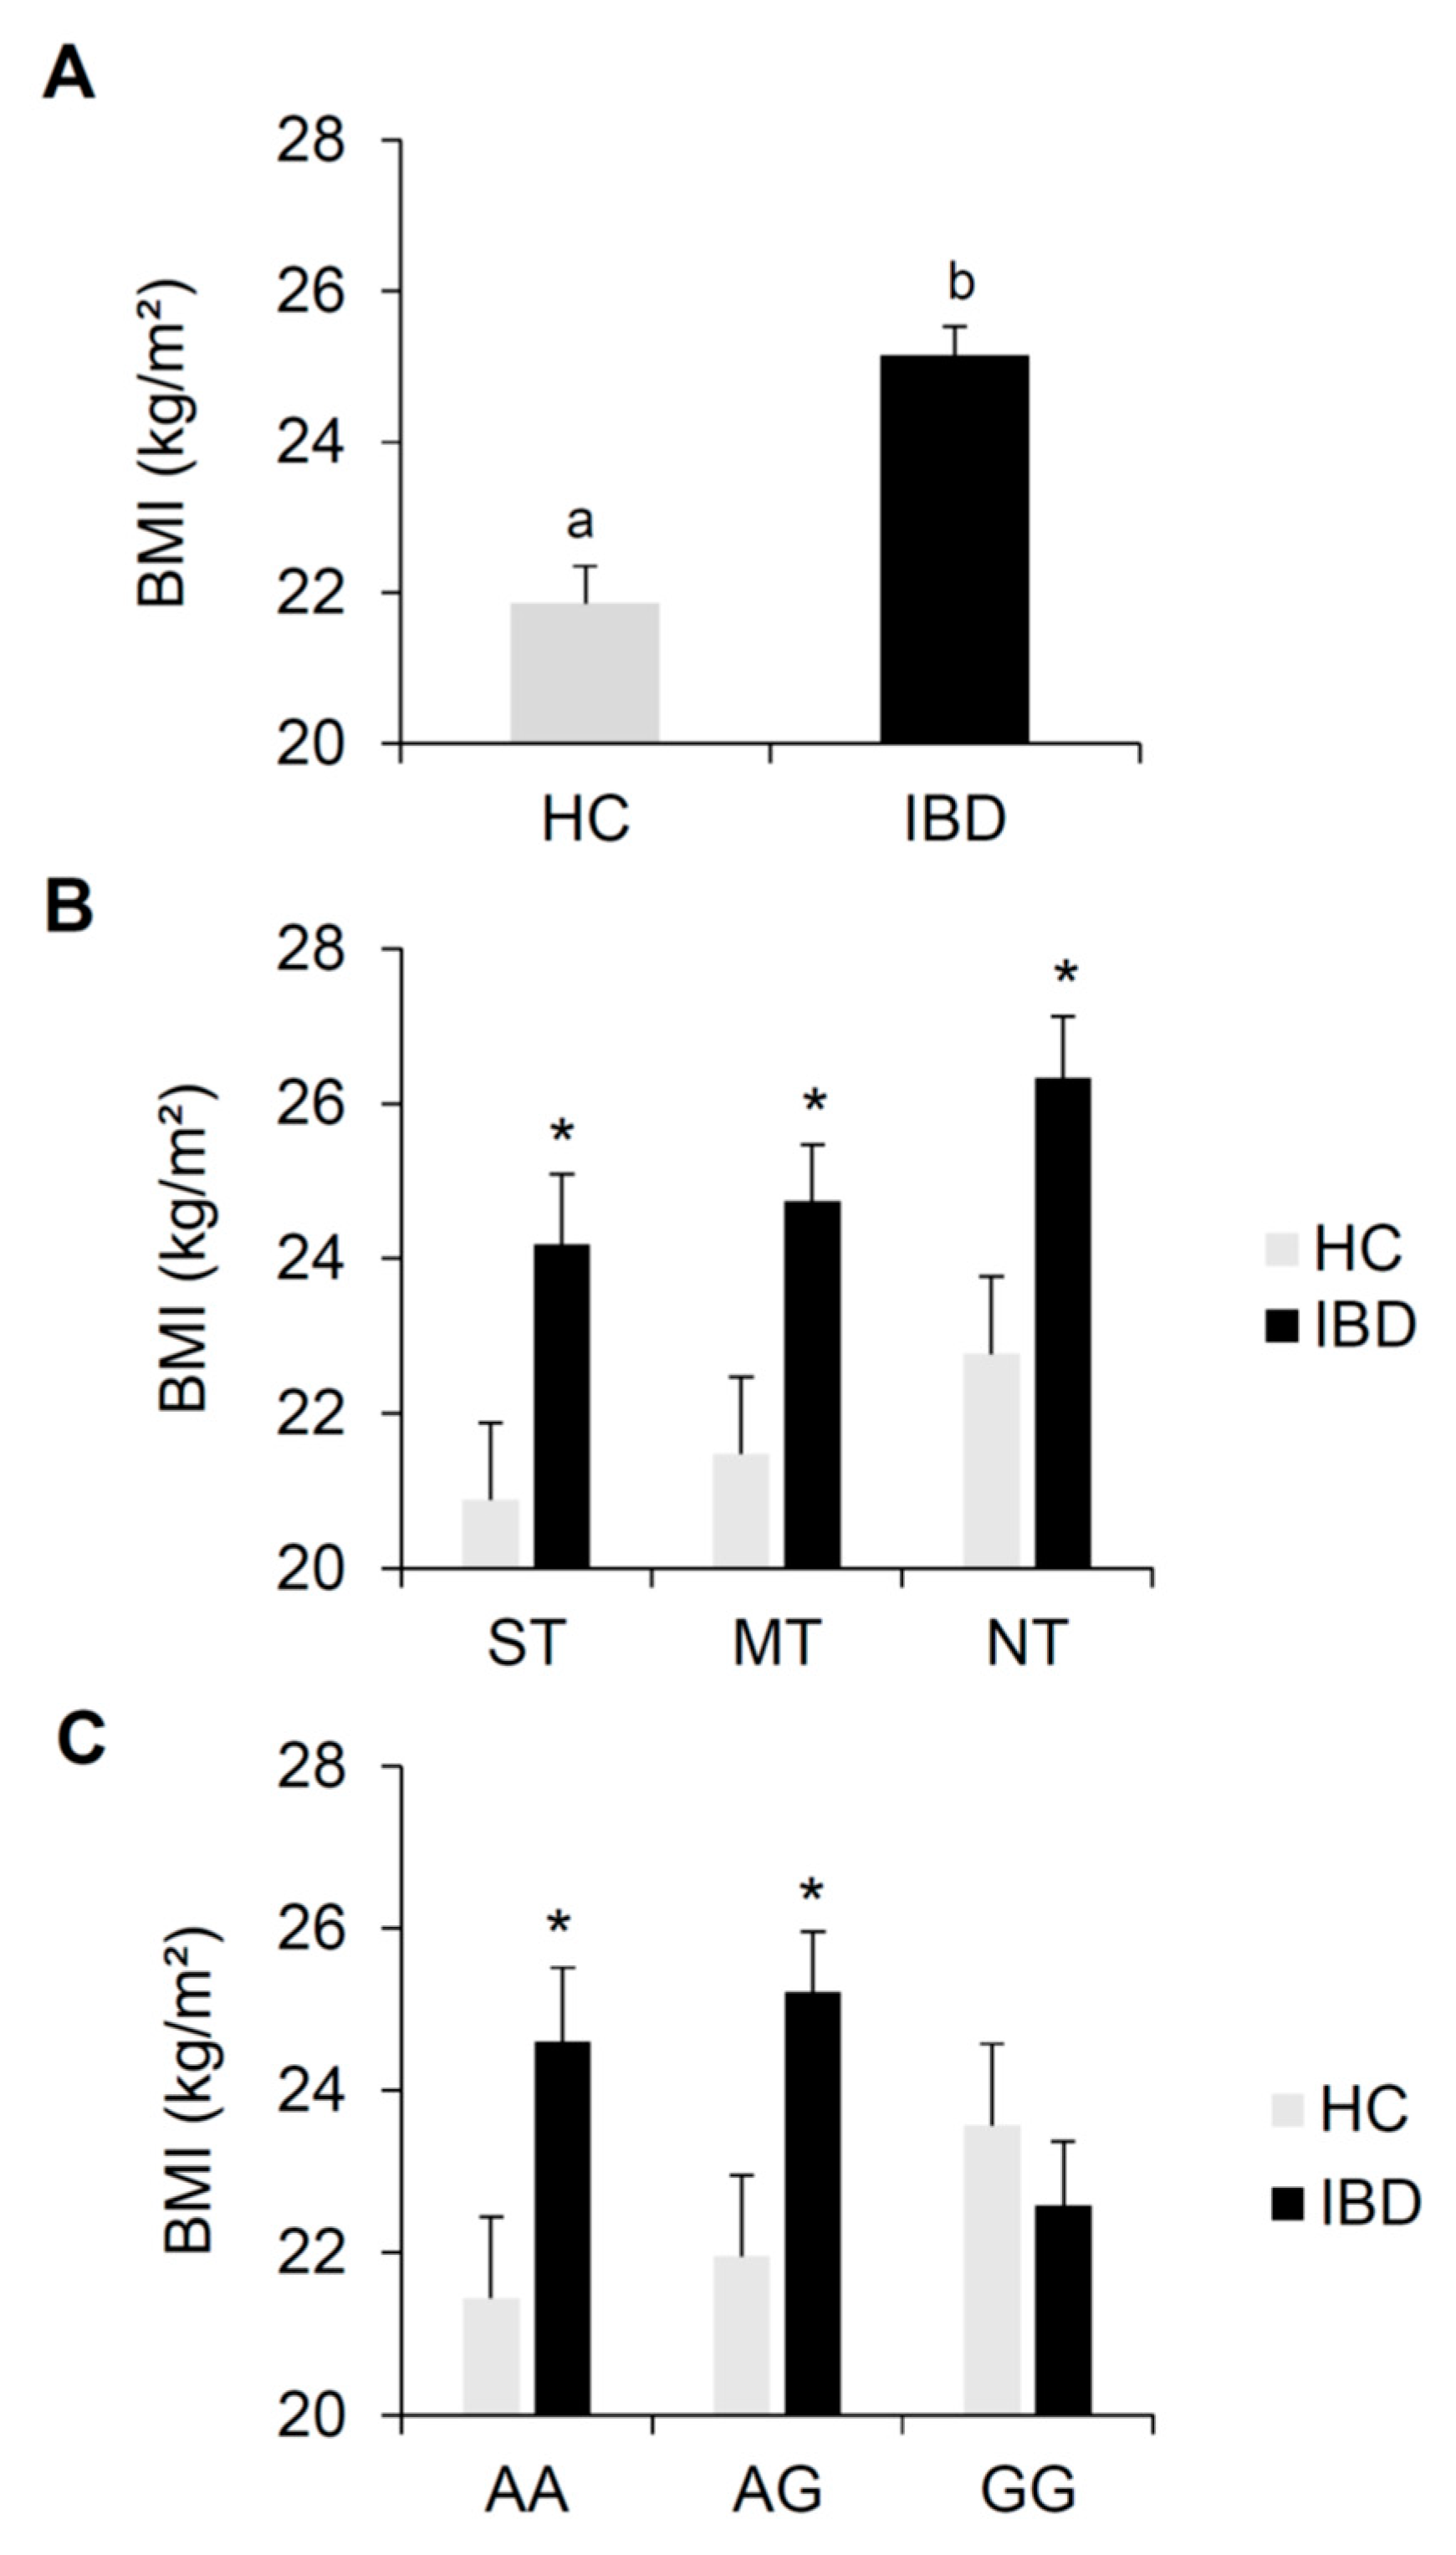
3.1. BMI Effects
3.2. Total Taste Scores
3.3. Sweet, Salty, Sour, Bitter and Umami Taste Scores
3.4. Oleic Acid Threshold and Genotyping for CD36 Polymorphism, rs1761667 (A/G).
4. Discussion
5. Conclusions
6. Limitations and Future Directions
Author Contributions
Funding
Acknowledgments
Conflicts of Interest
References
- Molodecky, N.A.; Kaplan, G.G. Environmental risk factors for inflammatory bowel disease. Gastroenterol. Hepatol. (N. Y.) 2010, 6, 339–346. [Google Scholar]
- Cosnes, J.; Gower-Rousseau, C.; Seksik, P.; Cortot, A. Epidemiology and natural history of inflammatory bowel diseases. Gastroenterology 2011, 140, 1785–1794. [Google Scholar] [CrossRef]
- Elsherif, Y.; Alexakis, C.; Mendall, M. Determinants of Weight Loss prior to Diagnosis in Inflammatory Bowel Disease: A Retrospective Observational Study. Gastroenterol. Res. Pract. 2014, 2014, 762191. [Google Scholar] [CrossRef] [PubMed]
- Steinbach, S.; Reindl, W.; Dempfle, A.; Schuster, A.; Wolf, P.; Hundt, W.; Huber, W. Smell and taste in inflammatory bowel disease. PLoS ONE 2013, 8, e73454. [Google Scholar] [CrossRef] [PubMed]
- de Souza, H.S.; Fiocchi, C. Immunopathogenesis of IBD: Current state of the art. Nat. Rev. Gastroenterol. Hepatol. 2016, 13, 13–27. [Google Scholar] [CrossRef] [PubMed]
- Sugihara, K.; Morhardt, T.L.; Kamada, N. The Role of Dietary Nutrients in Inflammatory Bowel Disease. Front. Immunol. 2019, 9, 3183. [Google Scholar] [CrossRef]
- Ananthakrishnan, A.N. Epidemiology and risk factors for IBD. Nat. Rev. Gastroenterol. Hepatol. 2015, 12, 205–217. [Google Scholar] [CrossRef]
- Loddo, I.; Romano, C. Inflammatory Bowel Disease: Genetics, Epigenetics, and Pathogenesis. Front. Immunol. 2015, 6, 551. [Google Scholar] [CrossRef]
- Reif, S.; Klein, I.; Lubin, F.; Farbstein, M.; Hallak, A.; Gilat, T. Pre-illness dietary factors in inflammatory bowel disease. Gut 1997, 40, 754–760. [Google Scholar] [CrossRef]
- Sakamoto, N.; Kono, S.; Wakai, K.; Fukuda, Y.; Satomi, M.; Shimoyama, T.; Inaba, Y.; Miyake, Y.; Sasaki, S.; Okamoto, K.; et al. Dietary risk factors for inflammatory bowel disease: A multicenter case-control study in Japan. Inflamm. Bowel Dis. 2005, 11, 154–163. [Google Scholar] [CrossRef]
- Amre, D.K.; D’Souza, S.; Morgan, K.; Seidman, G.; Lambrette, P.; Grimard, G.; Israel, D.; Mack, D.; Ghadirian, P.; Deslandres, C.; et al. Imbalances in dietary consumption of fatty acids, vegetables, and fruits are associated with risk for Crohn’s disease in children. Am. J. Gastroenterol. 2007, 102, 2016–2025. [Google Scholar] [CrossRef]
- Geerling, B.J.; Dagnelie, P.C.; Badart-Smook, A.; Russel, M.G.; Stockbrugger, R.W.; Brummer, R.J. Diet as a risk factor for the development of ulcerative colitis. Am. J. Gastroenterol. 2000, 95, 1008–1013. [Google Scholar] [CrossRef]
- Plat, J.; Mensink, R.P. Food components and immune function. Curr. Opin. Lipidol. 2005, 16, 31–37. [Google Scholar] [CrossRef]
- Lee, J.Y.; Zhao, L.; Youn, H.S.; Weatherill, A.R.; Tapping, R.; Feng, L.; Lee, W.H.; Fitzgerald, K.A.; Hwang, D.H. Saturated fatty acid activates but polyunsaturated fatty acid inhibits Toll-like receptor 2 dimerized with Toll-like receptor 6 or 1. J. Biol. Chem. 2004, 279, 16971–16979. [Google Scholar] [CrossRef] [PubMed]
- Loftus, E.V., Jr. Clinical epidemiology of inflammatory bowel disease: Incidence, prevalence, and environmental influences. Gastroenterology 2004, 126, 1504–1517. [Google Scholar] [CrossRef] [PubMed]
- Gilat, T.; Hacohen, D.; Lilos, P.; Langman, M.J. Childhood factors in ulcerative colitis and Crohn’s disease. An international cooperative study. Scand. J. Gastroenterol. 1987, 22, 1009–1024. [Google Scholar] [CrossRef] [PubMed]
- Russel, M.G.; Engels, L.G.; Muris, J.W.; Limonard, C.B.; Volovics, A.; Brummer, R.J.; Stockbrugger, R.W. Modern life’ in the epidemiology of inflammatory bowel disease: A case-control study with special emphasis on nutritional factors. Eur. J. Gastroenterol. Hepatol. 1998, 10, 243–249. [Google Scholar] [CrossRef] [PubMed]
- Lauritano, D.; Boccalari, E.; Di Stasio, D.; Della Vella, F.; Carinci, F.; Lucchese, A.; Petruzzi, M. Prevalence of Oral Lesions and Correlation with Intestinal Symptoms of Inflammatory Bowel Disease: A Systematic Review. Diagnostics (Basel) 2019, 9, 77. [Google Scholar] [CrossRef] [PubMed]
- Schutz, T.; Drude, C.; Paulisch, E.; Lange, K.P.; Lochs, H. Sugar intake, taste changes and dental health in Crohn’s disease. Dig. Dis. 2003, 21, 252–257. [Google Scholar] [CrossRef]
- Tiomny, E.; Horwitz, C.; Graff, E.; Rozen, P.; Gilat, T. Serum zinc and taste acuity in Tel-Aviv patients with inflammatory bowel disease. Am. J. Gastroenterol. 1982, 77, 101–104. [Google Scholar]
- Penny, W.J.; Mayberry, J.F.; Aggett, P.J.; Gilbert, J.O.; Newcombe, R.G.; Rhodes, J. Relationship between trace elements, sugar consumption, and taste in Crohn’s disease. Gut 1983, 24, 288–292. [Google Scholar] [CrossRef] [PubMed]
- Solomons, N.W.; Rosenberg, I.H.; Sandstead, H.H.; Vo-Khactu, K.P. Zinc deficiency in Crohn’s disease. Digestion 1977, 16, 87–95. [Google Scholar] [CrossRef] [PubMed]
- Kasper, H.; Sommer, H. Taste thresholds in patients with Crohn’s disease. J. Hum. Nutr. 1980, 34, 455–456. [Google Scholar] [PubMed]
- McClain, C.; Soutor, C.; Zieve, L. Zinc deficiency: A complication of Crohn’s disease. Gastroenterology 1980, 78, 272–279. [Google Scholar] [CrossRef]
- Martini, G.A.; Brandes, J.W. Increased consumption of refined carbohydrates in patients with Crohn’s disease. Klin. Wochenschr. 1976, 54, 367–371. [Google Scholar] [CrossRef] [PubMed]
- Calò, C.; Padiglia, A.; Zonza, A.; Corrias, L.; Contu, P.; Tepper, B.J.; Barbarossa, I.T. Polymorphisms in TAS2R38 and the taste bud trophic factor, gustin gene co-operate in modulating PROP taste phenotype. Physiol. Behav. 2011, 104, 1065–1071. [Google Scholar] [CrossRef]
- Melis, M.; Atzori, E.; Cabras, S.; Zonza, A.; Calò, C.; Muroni, P.; Nieddu, M.; Padiglia, A.; Sogos, V.; Tepper, B.J.; et al. The gustin (CA6) gene polymorphism, rs2274333 (A/G), as a mechanistic link between PROP tasting and fungiform taste papilla density and maintenance. PLoS ONE 2013, 8, e74151. [Google Scholar] [CrossRef]
- Padiglia, A.; Zonza, A.; Atzori, E.; Chillotti, C.; Calò, C.; Tepper, B.J.; Barbarossa, I.T. Sensitivity to 6-n-propylthiouracil is associated with gustin (carbonic anhydrase VI) gene polymorphism, salivary zinc, and body mass index in humans. Am. J. Clin. Nutr. 2010, 92, 539–545. [Google Scholar] [CrossRef]
- Henkin, R.I.; Martin, B.M.; Agarwal, R.P. Efficacy of exogenous oral zinc in treatment of patients with carbonic anhydrase VI deficiency. Am. J. Med. Sci. 1999, 318, 392–405. [Google Scholar] [CrossRef]
- Mattes, R.D. Fat Taste in Humans: Is It a Primary. In Fat Detection: Taste, Texture, and Post Ingestive Effects; Montmayeur, J.P., le Coutre, J., Eds.; CRC Press: Boca Raton, FL, USA, 2010; pp. 167–193. [Google Scholar]
- Khan, N.A.; Besnard, P. Oro-sensory perception of dietary lipids: New insights into the fat taste transduction. Biochim. Biophys. Acta 2009, 1791, 149–155. [Google Scholar] [CrossRef]
- Martin, C.; Chevrot, M.; Poirier, H.; Passilly-Degrace, P.; Niot, I.; Besnard, P. CD36 as a lipid sensor. Physiol. Behav. 2011, 105, 36–42. [Google Scholar] [CrossRef] [PubMed]
- Laugerette, F.; Passilly-Degrace, P.; Patris, B.; Niot, I.; Febbraio, M.; Montmayeur, J.P.; Besnard, P. CD36 involvement in orosensory detection of dietary lipids, spontaneous fat preference, and digestive secretions. J. Clin. Investig. 2005, 115, 3177–3184. [Google Scholar] [CrossRef] [PubMed]
- Ibrahimi, A.; Abumrad, N.A. Role of CD36 in membrane transport of long-chain fatty acids. Curr. Opin. Clin. Nutr. Metab. Care 2002, 5, 139–145. [Google Scholar] [CrossRef] [PubMed]
- Gaillard, D.; Laugerette, F.; Darcel, N.; El-Yassimi, A.; Passilly-Degrace, P.; Hichami, A.; Khan, N.A.; Montmayeur, J.P.; Besnard, P. The gustatory pathway is involved in CD36-mediated orosensory perception of long-chain fatty acids in the mouse. FASEB J. 2008, 22, 1458–1468. [Google Scholar] [CrossRef]
- El-Yassimi, A.; Hichami, A.; Besnard, P.; Khan, N.A. Linoleic acid induces calcium signaling, Src kinase phosphorylation, and neurotransmitter release in mouse CD36-positive gustatory cells. J. Biol. Chem. 2008, 283, 12949–12959. [Google Scholar] [CrossRef]
- Simons, P.J.; Kummer, J.A.; Luiken, J.J.; Boon, L. Apical CD36 immunolocalization in human and porcine taste buds from circumvallate and foliate papillae. Acta Histochem. 2011, 113, 839–843. [Google Scholar] [CrossRef]
- Ozdener, M.H.; Subramaniam, S.; Sundaresan, S.; Sery, O.; Hashimoto, T.; Asakawa, Y.; Besnard, P.; Abumrad, N.A.; Khan, N.A. CD36- and GPR120-mediated Ca(2)(+) signaling in human taste bud cells mediates differential responses to fatty acids and is altered in obese mice. Gastroenterology 2014, 146, 995–1005. [Google Scholar] [CrossRef]
- Melis, M.; Sollai, G.; Muroni, P.; Crnjar, R.; Barbarossa, I.T. Associations between orosensory perception of oleic acid, the common single nucleotide polymorphisms (rs1761667 and rs1527483) in the CD36 gene, and 6-n-propylthiouracil (PROP) tasting. Nutrients 2015, 7, 2068–2084. [Google Scholar] [CrossRef]
- Keller, K.L.; Liang, L.C.; Sakimura, J.; May, D.; van Belle, C.; Breen, C.; Driggin, E.; Tepper, B.J.; Lanzano, P.C.; Deng, L.; et al. Common variants in the CD36 gene are associated with oral fat perception, fat preferences, and obesity in African Americans. Obesity 2012, 20, 1066–1073. [Google Scholar] [CrossRef]
- Pepino, M.Y.; Love-Gregory, L.; Klein, S.; Abumrad, N.A. The fatty acid translocase gene CD36 and lingual lipase influence oral sensitivity to fat in obese subjects. J. Lipid Res. 2012, 53, 561–566. [Google Scholar] [CrossRef]
- Tepper, B.J. Nutritional implications of genetic taste variation: The role of PROP sensitivity and other taste phenotypes. Annu. Rev. Nutr. 2008, 28, 367–388. [Google Scholar] [CrossRef] [PubMed]
- Tepper, B.J.; Nurse, R.J. PROP taster status is related to fat perception and preference. Ann. N. Y. Acad. Sci. 1998, 855, 802–804. [Google Scholar] [CrossRef]
- Kirkmeyer, S.V.; Tepper, B.J. Understanding creaminess perception of dairy products using free-choice profiling and genetic responsivity to 6-n-propylthiouracil. Chem. Senses 2003, 28, 527–536. [Google Scholar] [CrossRef]
- Hayes, J.E.; Duffy, V.B. Revisiting sugar-fat mixtures: Sweetness and creaminess vary with phenotypic markers of oral sensation. Chem. Senses 2007, 32, 225–236. [Google Scholar] [CrossRef] [PubMed]
- Keller, K.L.; Steinmann, L.; Nurse, R.J.; Tepper, B.J. Genetic taste sensitivity to 6-n-propylthiouracil influences food preference and reported intake in preschool children. Appetite 2002, 38, 3–12. [Google Scholar] [CrossRef] [PubMed]
- Bell, K.I.; Tepper, B.J. Short-term vegetable intake by young children classified by 6-n-propylthoiuracil bitter-taste phenotype. Am. J. Clin. Nutr. 2006, 84, 245–251. [Google Scholar] [CrossRef] [PubMed]
- Dinehart, M.E.; Hayes, J.E.; Bartoshuk, L.M.; Lanier, S.L.; Duffy, V.B. Bitter taste markers explain variability in vegetable sweetness, bitterness, and intake. Physiol. Behav. 2006, 87, 304–313. [Google Scholar] [CrossRef] [PubMed]
- Tepper, B.J.; Koelliker, Y.; Zhao, L.; Ullrich, N.V.; Lanzara, C.; d’Adamo, P.; Ferrara, A.; Ulivi, S.; Esposito, L.; Gasparini, P. Variation in the bitter-taste receptor gene TAS2R38, and adiposity in a genetically isolated population in Southern Italy. Obesity 2008, 16, 2289–2295. [Google Scholar] [CrossRef]
- Tepper, B.J.; Neilland, M.; Ullrich, N.V.; Koelliker, Y.; Belzer, L.M. Greater energy intake from a buffet meal in lean, young women is associated with the 6-n-propylthiouracil (PROP) non-taster phenotype. Appetite 2011, 56, 104–110. [Google Scholar] [CrossRef]
- Tepper, B.J.; Williams, T.Z.; Burgess, J.R.; Antalis, C.J.; Mattes, R.D. Genetic variation in bitter taste and plasma markers of anti-oxidant status in college women. Int. J. Food Sci. Nutr. 2009, 60 (Suppl. S2), 35–45. [Google Scholar] [CrossRef]
- Basson, M.D.; Bartoshuk, L.M.; Dichello, S.Z.; Panzini, L.; Weiffenbach, J.M.; Duffy, V.B. Association between 6-n-propylthiouracil (PROP) bitterness and colonic neoplasms. Dig. Dis. Sci. 2005, 50, 483–489. [Google Scholar] [CrossRef] [PubMed]
- Carrai, M.; Steinke, V.; Vodicka, P.; Pardini, B.; Rahner, N.; Holinski-Feder, E.; Morak, M.; Schackert, H.K.; Gorgens, H.; Stemmler, S.; et al. Association between TAS2R38 gene polymorphisms and colorectal cancer risk: A case-control study in two independent populations of Caucasian origin. PLoS ONE 2011, 6, e20464. [Google Scholar] [CrossRef] [PubMed]
- Lucock, M.; Ng, X.; Boyd, L.; Skinner, V.; Wai, R.; Tang, S.; Naylor, C.; Yates, Z.; Choi, J.H.; Roach, P.; et al. TAS2R38 bitter taste genetics, dietary vitamin C, and both natural and synthetic dietary folic acid predict folate status, a key micronutrient in the pathoaetiology of adenomatous polyps. Food Funct. 2011, 2, 457–465. [Google Scholar] [CrossRef]
- Webb, J.; Bolhuis, D.P.; Cicerale, S.; Hayes, J.E.; Keast, R. The Relationships Between Common Measurements of Taste Function. Chemosens. Percept. 2015, 8, 11–18. [Google Scholar] [CrossRef] [PubMed]
- Tepper, B.J.; Melis, M.; Koelliker, Y.; Gasparini, P.; Ahijevych, K.L.; Tomassini Barbarossa, I. Factors Influencing the Phenotypic Characterization of the Oral Marker, PROP. Nutrients 2017, 9, 1275. [Google Scholar] [CrossRef] [PubMed]
- Bartoshuk, L.M.; Duffy, V.B.; Miller, I.J. PTC/PROP tasting: Anatomy, psychophysics, and sex effects. Physiol. Behav. 1994, 56, 1165–1171. [Google Scholar] [CrossRef]
- Bajec, M.R.; Pickering, G.J. Thermal taste, PROP responsiveness, and perception of oral sensations. Physiol. Behav. 2008, 95, 581–590. [Google Scholar] [CrossRef]
- Yeomans, M.R.; Tepper, B.J.; Rietzschel, J.; Prescott, J. Human hedonic responses to sweetness: Role of taste genetics and anatomy. Physiol. Behav. 2007, 91, 264–273. [Google Scholar] [CrossRef]
- Essick, G.; Chopra, A.; Guest, S.; McGlone, F. Lingual tactile acuity, taste perception, and the density and diameter of fungiform papillae in female subjects. Physiol. Behav. 2003, 80, 289–302. [Google Scholar] [CrossRef]
- Shahbake, M.; Hutchinson, I.; Laing, D.G.; Jinks, A.L. Rapid quantitative assessment of fungiform papillae density in the human tongue. Brain Res. 2005, 1052, 196–201. [Google Scholar] [CrossRef]
- Elahi, M.; Telkabadi, M.; Samadi, V.; Vakili, H. Association of oral manifestations with ulcerative colitis. Gastroenterol. Hepatol. Bed Bench. 2012, 5, 155–160. [Google Scholar] [PubMed]
- Laranjeira, N.; Fonseca, J.; Meira, T.; Freitas, J.; Valido, S.; Leitao, J. Oral mucosa lesions and oral symptoms in inflammatory bowel disease patients. Arq. Gastroenterol. 2015, 52, 105–110. [Google Scholar] [CrossRef] [PubMed]
- Katz, J.; Shenkman, A.; Stavropoulos, F.; Melzer, E. Oral signs and symptoms in relation to disease activity and site of involvement in patients with inflammatory bowel disease. Oral Dis. 2003, 9, 34–40. [Google Scholar] [CrossRef] [PubMed]
- Sollai, G.; Melis, M.; Mastinu, M.; Pani, D.; Cosseddu, P.; Bonfiglio, A.; Crnjar, R.; Tepper, B.J.; Tomassini Barbarossa, I. Human Tongue Electrophysiological Response to Oleic Acid and Its Associations with PROP Taster Status and the CD36 Polymorphism (rs1761667). Nutrients 2019, 11, 315. [Google Scholar] [CrossRef] [PubMed]
- Burgess, B.; Melis, M.; Scoular, K.; Driver, M.; Schaich, K.M.; Keller, K.L.; Tomassini Barbarossa, I.; Tepper, B.J. Effects of CD36 Genotype on Oral Perception of Oleic Acid Supplemented Safflower Oil Emulsions in Two Ethnic Groups: A Preliminary Study. J. Food Sci. 2018, 83, 1373–1380. [Google Scholar] [CrossRef]
- Melis, M.; Carta, G.; Pintus, S.; Pintus, P.; Piras, C.A.; Murru, E.; Manca, C.; Di Marzo, V.; Banni, S.; Tomassini Barbarossa, I. Polymorphism rs1761667 in the CD36 Gene Is Associated to Changes in Fatty Acid Metabolism and Circulating Endocannabinoid Levels Distinctively in Normal Weight and Obese Subjects. Front. Physiol. 2017, 8, 1006. [Google Scholar] [CrossRef]
- Love-Gregory, L.; Sherva, R.; Schappe, T.; Qi, J.S.; McCrea, J.; Klein, S.; Connelly, M.A.; Abumrad, N.A. Common CD36 SNPs reduce protein expression and may contribute to a protective atherogenic profile. Hum. Mol. Genet. 2011, 20, 193–201. [Google Scholar] [CrossRef]
- Ghosh, A.; Murugesan, G.; Chen, K.; Zhang, L.; Wang, Q.; Febbraio, M.; Anselmo, R.M.; Marchant, K.; Barnard, J.; Silverstein, R.L. Platelet CD36 surface expression levels affect functional responses to oxidized LDL and are associated with inheritance of specific genetic polymorphisms. Blood 2011, 117, 6355–6366. [Google Scholar] [CrossRef]
- Zhao, L.; Kirkmeyer, S.V.; Tepper, B.J. A paper screening test to assess genetic taste sensitivity to 6-n-propylthiouracil. Physiol. Behav. 2003, 78, 625–633. [Google Scholar] [CrossRef]
- Barbarossa, I.T.; Melis, M.; Mattes, M.Z.; Calò, C.; Muroni, P.; Crnjar, R.; Tepper, B.J. The gustin (CA6) gene polymorphism, rs2274333 (A/G), is associated with fungiform papilla density, whereas PROP bitterness is mostly due to TAS2R38 in an ethnically-mixed population. Physiol. Behav. 2015, 138, 6–12. [Google Scholar] [CrossRef]
- Sollai, G.; Melis, M.; Pani, D.; Cosseddu, P.; Usai, I.; Crnjar, R.; Bonfiglio, A.; Tomassini Barbarossa, I. First objective evaluation of taste sensitivity to 6-n-propylthiouracil (PROP), a paradigm gustatory stimulus in humans. Sci. Rep. 2017, 7, 40353. [Google Scholar] [CrossRef] [PubMed]
- Green, B.G.; Shaffer, G.S.; Gilmore, M.M. Derivation and evaluation of a semantic scale of oral sensation magnitude with apparent ratio properties. Chem. Senses 1993, 18, 683–702. [Google Scholar] [CrossRef]
- Tepper, B.J.; Christensen, C.M.; Cao, J. Development of brief methods to classify individuals by PROP taster status. Physiol. Behav. 2001, 73, 571–577. [Google Scholar] [CrossRef]
- Landis, B.N.; Welge-Luessen, A.; Bramerson, A.; Bende, M.; Mueller, C.A.; Nordin, S.; Hummel, T. “Taste Strips”—A rapid, lateralized, gustatory bedside identification test based on impregnated filter papers. J. Neurol. 2009, 256, 242–248. [Google Scholar] [CrossRef]
- Mueller, C.; Kallert, S.; Renner, B.; Stiassny, K.; Temmel, A.F.; Hummel, T.; Kobal, G. Quantitative assessment of gustatory function in a clinical context using impregnated "taste strips". Rhinology 2003, 41, 2–6. [Google Scholar]
- Banerjee, M.; Gautam, S.; Saxena, M.; Bid, H.K.; Agrawal, C.G. Association of CD36 gene variants rs1761667 (G > A) and rs1527483 (C > T) with Type 2 diabetes in North Indian population. Int. J. Diabetes Mellit. 2010, 2, 179–183. [Google Scholar] [CrossRef]
- Melis, M.; Mastinu, M.; Arca, M.; Crnjar, R.; Tomassini Barbarossa, I. Effect of chemical interaction between oleic acid and L-Arginine on oral perception, as a function of polymorphisms of CD36 and OBPIIa and genetic ability to taste 6-n-propylthiouracil. PLoS ONE 2018, 13, e0194953. [Google Scholar] [CrossRef]
- Chan, S.S.; Luben, R.; Olsen, A.; Tjonneland, A.; Kaaks, R.; Teucher, B.; Lindgren, S.; Grip, O.; Key, T.; Crowe, F.L.; et al. Body mass index and the risk for Crohn’s disease and ulcerative colitis: Data from a European Prospective Cohort Study (The IBD in EPIC Study). Am. J. Gastroenterol. 2013, 108, 575–582. [Google Scholar] [CrossRef]
- Blain, A.; Cattan, S.; Beaugerie, L.; Carbonnel, F.; Gendre, J.P.; Cosnes, J. Crohn’s disease clinical course and severity in obese patients. Clin. Nutr. 2002, 21, 51–57. [Google Scholar] [CrossRef]
- Moran, G.W.; Dubeau, M.F.; Kaplan, G.G.; Panaccione, R.; Ghosh, S. The increasing weight of Crohn’s disease subjects in clinical trials: A hypothesis-generatings time-trend analysis. Inflamm. Bowel Dis. 2013, 19, 2949–2956. [Google Scholar] [CrossRef]
- Seminerio, J.L.; Koutroubakis, I.E.; Ramos-Rivers, C.; Hashash, J.G.; Dudekula, A.; Regueiro, M.; Baidoo, L.; Barrie, A.; Swoger, J.; Schwartz, M.; et al. Impact of Obesity on the Management and Clinical Course of Patients with Inflammatory Bowel Disease. Inflamm. Bowel Dis. 2015, 21, 2857–2863. [Google Scholar] [CrossRef]
- Lamy, E.; Simoes, C.; Rodrigues, L.; Costa, A.R.; Vitorino, R.; Amado, F.; Antunes, C.; do Carmo, I. Changes in the salivary protein profile of morbidly obese women either previously subjected to bariatric surgery or not. J. Physiol. Biochem. 2015, 71, 691–702. [Google Scholar] [CrossRef] [PubMed]
- Lucas Lopez, R.; Grande Burgos, M.J.; Galvez, A.; Perez Pulido, R. The human gastrointestinal tract and oral microbiota in inflammatory bowel disease: A state of the science review. Apmis 2017, 125, 3–10. [Google Scholar] [CrossRef] [PubMed]
- Esberg, A.; Haworth, S.; Brunius, C.; Lif Holgerson, P.; Johansson, I. Carbonic Anhydrase 6 Gene Variation influences Oral Microbiota Composition and Caries Risk in Swedish adolescents. Sci. Rep. 2019, 9, 452. [Google Scholar] [CrossRef] [PubMed]
- Feeney, E.L.; Hayes, J.E. Exploring associations between taste perception, oral anatomy and polymorphisms in the carbonic anhydrase (gustin) gene CA6. Physiol. Behav. 2014, 128, 148–154. [Google Scholar] [CrossRef]
- Rodrigues, L.; Costa, G.; Cordeiro, C.; Pinheiro, C.; Amado, F.; Lamy, E. Salivary proteome and glucose levels are related with sweet taste sensitivity in young adults. Food. Nutr. Res. 2017, 61, 1389208. [Google Scholar] [CrossRef]
- Lee, R.J.; Xiong, G.; Kofonow, J.M.; Chen, B.; Lysenko, A.; Jiang, P.; Abraham, V.; Doghramji, L.; Adappa, N.D.; Palmer, J.N.; et al. T2R38 taste receptor polymorphisms underlie susceptibility to upper respiratory infection. J. Clin. Investig. 2012, 122, 4145–4159. [Google Scholar] [CrossRef]
- Lee, R.J.; Cohen, N.A. The emerging role of the bitter taste receptor T2R38 in upper respiratory infection and chronic rhinosinusitis. Am. J. Rhinol. Allergy 2013, 27, 283–286. [Google Scholar] [CrossRef]
- Melis, M.; Grzeschuchna, L.; Sollai, G.; Hummel, T.; Tomassini Barbarossa, I. Taste disorders are partly genetically determined: Role of the TAS2R38 gene, a pilot study. Laryngoscope 2019. [Google Scholar] [CrossRef]
- Lee, R.J.; Cohen, N.A. Role of the bitter taste receptor T2R38 in upper respiratory infection and chronic rhinosinusitis. Curr. Opin. Allergy Clin. Immunol. 2015, 15, 14–20. [Google Scholar] [CrossRef]
- Daoudi, H.; Plesnik, J.; Sayed, A.; Sery, O.; Rouabah, A.; Rouabah, L.; Khan, N.A. Oral Fat Sensing and CD36 Gene Polymorphism in Algerian Lean and Obese Teenagers. Nutrients 2015, 7, 9096–9104. [Google Scholar] [CrossRef] [PubMed]
- Karmous, I.; Plesnik, J.; Khan, A.S.; Sery, O.; Abid, A.; Mankai, A.; Aouidet, A.; Khan, N.A. Orosensory detection of bitter in fat-taster healthy and obese participants: Genetic polymorphism of CD36 and TAS2R38. Clin. Nutr. 2017. [Google Scholar] [CrossRef] [PubMed]


| Variables | IBD | HC |
|---|---|---|
| Age (years) | 51.38 ± 1.5 | 48.79 ± 3.06 |
| Gender (n) | ||
| Male | 53 | 26 |
| Female | 44 | 36 |
| CD (n) | 43 | - |
| UC (n) | 54 | - |
| Group | IBD | HC | p-Value | ||
|---|---|---|---|---|---|
| n | % | n | % | ||
| ST | 25 | 25.8 | 14 | 22.6 | 0.741 |
| MT | 39 | 40.2 | 29 | 46.8 | |
| NT | 33 | 34 | 25 | 40.3 | |
| Polymorphisms | IBD | HC | p-Value | ||
|---|---|---|---|---|---|
| n | % | n | % | ||
| Gustin gene | |||||
| Genotype | |||||
| AA | 53 | 54.6 | 29 | 46.8 | 0.531 |
| AG | 36 | 37.1 | 28 | 45.2 | |
| GG | 8 | 8.3 | 5 | 8 | |
| Allele | |||||
| A | 142 | 73.2 | 86 | 69.4 | 0.526 |
| G | 52 | 26.8 | 38 | 30.6 | |
| CD36 | |||||
| Genotype | |||||
| GG | 18 | 23.7 | 19 | 30.6 | 0.049 |
| AG | 36 | 47.4 | 36 | 58.1 | |
| AA | 22 | 28.9 | 7 | 11.3 | |
| Allele | |||||
| G | 72 | 47.4 | 74 | 59.7 | 0.047 |
| A | 80 | 52.6 | 50 | 40.3 | |
© 2020 by the authors. Licensee MDPI, Basel, Switzerland. This article is an open access article distributed under the terms and conditions of the Creative Commons Attribution (CC BY) license (http://creativecommons.org/licenses/by/4.0/).
Share and Cite
Melis, M.; Mastinu, M.; Sollai, G.; Paduano, D.; Chicco, F.; Magrì, S.; Usai, P.; Crnjar, R.; Tepper, B.J.; Tomassini Barbarossa, I. Taste Changes in Patients with Inflammatory Bowel Disease: Associations with PROP Phenotypes and polymorphisms in the salivary protein, Gustin and CD36 Receptor Genes. Nutrients 2020, 12, 409. https://doi.org/10.3390/nu12020409
Melis M, Mastinu M, Sollai G, Paduano D, Chicco F, Magrì S, Usai P, Crnjar R, Tepper BJ, Tomassini Barbarossa I. Taste Changes in Patients with Inflammatory Bowel Disease: Associations with PROP Phenotypes and polymorphisms in the salivary protein, Gustin and CD36 Receptor Genes. Nutrients. 2020; 12(2):409. https://doi.org/10.3390/nu12020409
Chicago/Turabian StyleMelis, Melania, Mariano Mastinu, Giorgia Sollai, Danilo Paduano, Fabio Chicco, Salvatore Magrì, Paolo Usai, Roberto Crnjar, Beverly J. Tepper, and Iole Tomassini Barbarossa. 2020. "Taste Changes in Patients with Inflammatory Bowel Disease: Associations with PROP Phenotypes and polymorphisms in the salivary protein, Gustin and CD36 Receptor Genes" Nutrients 12, no. 2: 409. https://doi.org/10.3390/nu12020409
APA StyleMelis, M., Mastinu, M., Sollai, G., Paduano, D., Chicco, F., Magrì, S., Usai, P., Crnjar, R., Tepper, B. J., & Tomassini Barbarossa, I. (2020). Taste Changes in Patients with Inflammatory Bowel Disease: Associations with PROP Phenotypes and polymorphisms in the salivary protein, Gustin and CD36 Receptor Genes. Nutrients, 12(2), 409. https://doi.org/10.3390/nu12020409