Dietary Sources of Melamine Exposure among US Children and Adults in the National Health and Nutrition Examination Survey 2003–2004


Abstract
: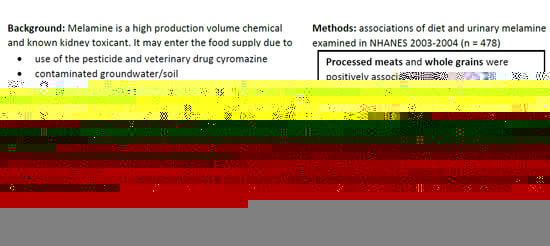
1. Introduction
2. Materials and Methods
2.1. Participants and Study Design
2.2. Dietary Assessment
2.3. Estimation of Food Group Intakes
2.4. Assessment of Dietary Patterns
2.5. Assessment of Melamine and Creatinine Excretion
2.6. Calculation of Estimated Daily Intake (EDI)
2.7. Assessment of Sociodemographic and Lifestyle Characteristics
2.8. Statistical Analyses
3. Results
4. Discussion
5. Conclusions
Author Contributions
Funding
Conflicts of Interest
References
- EFSA Panel on Contaminants in the Food Chain (CONTAM); EFSA Panel on Food Contact Materials, Enzymes, Flavourings and Processing Aids (CEF). Scientific Opinion on Melamine in Food and Feed. EFSA J. 2010, 8, 1–145. [Google Scholar] [CrossRef]
- Wang, T.; Ma, J.; Chen, Y.; Li, Y.; Zhang, L.; Zhang, Y. Analysis of melamine and analogs in complex matrices: Advances and trends. J. Sep. Sci. 2016, 40, 170–182. [Google Scholar] [CrossRef] [PubMed]
- Brown, C.A.; Jeong, K.-S.; Poppenga, R.H.; Puschner, B.; Miller, D.M.; Ellis, A.E.; Kang, K.-I.; Sum, S.; Cistola, A.M.; Brown, S.A. Outbreaks of Renal Failure Associated with Melamine and Cyanuric Acid in Dogs and Cats in 2004 and 2007. J. Vet. Diagn. Investig. 2007, 19, 525–531. [Google Scholar] [CrossRef] [PubMed] [Green Version]
- Schaapveld, M.; Aleman, B.M.P.; Van Eggermond, A.M.; Janus, C.P.M.; Krol, A.D.G.; Van Der Maazen, R.W.M.; Roesink, J.M.; Raemaekers, J.M.M.; De Boer, J.P.; Zijlstra, J.M.; et al. Second Cancer Risk Up to 40 Years after Treatment for Hodgkin’s Lymphoma. N. Engl. J. Med. 2015, 373, 2499–2511. [Google Scholar] [CrossRef] [PubMed]
- Dobson, R.L.M.; Motlagh, S.; Quijano, M.; Cambron, R.T.; Baker, T.R.; Pullen, A.M.; Regg, B.T.; Bigalow-Kern, A.S.; Vennard, T.; Fix, A.; et al. Identification and Characterization of Toxicity of Contaminants in Pet Food Leading to an Outbreak of Renal Toxicity in Cats and Dogs. Toxicol. Sci. 2008, 106, 251–262. [Google Scholar] [CrossRef] [Green Version]
- Thompson, M.E.; Lewin-Smith, M.R.; Kalasinsky, V.F.; Pizzolato, K.M.; Fleetwood, M.L.; McElhaney, M.R.; Johnson, T.O. Characterization of Melamine-containing and Calcium Oxalate Crystals in Three Dogs with Suspected Pet Food-induced Nephrotoxicosis. Vet. Pathol. 2008, 45, 417–426. [Google Scholar] [CrossRef]
- Hau, A.K.-C.; Kwan, T.H.; Li, P.K.-T. Melamine Toxicity and the Kidney. J. Am. Soc. Nephrol. 2009, 20, 245–250. [Google Scholar] [CrossRef] [Green Version]
- Bolden, A.L.; Rochester, J.R.; Kwiatkowski, C.F. Melamine, beyond the kidney: A ubiquitous endocrine disruptor and neurotoxicant? Toxicol. Lett. 2017, 280, 181–189. [Google Scholar] [CrossRef]
- Gossner, C.M.-E.; Schlundt, J.; Ben Embarek, P.; Hird, S.; Lo-Fo-Wong, D.; Beltran, J.J.O.; Teoh, K.N.; Tritscher, A. The Melamine Incident: Implications for International Food and Feed Safety. Environ. Health Perspect. 2009, 117, 1803–1808. [Google Scholar] [CrossRef] [Green Version]
- Wu, C.-F.; Hsiung, C.A.; Tsai, H.-J.; Tsai, Y.-C.; Hsieh, H.-M.; Chen, B.H.; Wu, M.-T. Interaction of melamine and di-(2-ethylhexyl) phthalate exposure on markers of early renal damage in children: The 2011 Taiwan food scandal. Environ. Pollut. 2018, 235, 453–461. [Google Scholar] [CrossRef]
- Qin, Y.; Lv, X.; Li, J.; Qi, G.; Diao, Q.; Liu, G.; Xue, M.; Wang, J.; Tong, J.; Zhang, L.; et al. Assessment of melamine contamination in crop, soil and water in China and risks of melamine accumulation in animal tissues and products. Environ. Int. 2010, 36, 446–452. [Google Scholar] [CrossRef] [PubMed]
- Dorne, J.; Doerge, D.R.; Vandenbroeck, M.; Fink-Gremmels, J.; Mennes, W.; Knutsen, H.; Vernazza, F.; Castle, L.; Edler, L.; Benford, D. Recent advances in the risk assessment of melamine and cyanuric acid in animal feed. Toxicol. Appl. Pharmacol. 2013, 270, 218–229. [Google Scholar] [CrossRef] [PubMed]
- Sun, P.; Wang, J.; Shen, J.; Wei, H. Residues of melamine and cyanuric acid in milk and tissues of dairy cows fed different doses of melamine. J. Dairy Sci. 2011, 94, 3575–3582. [Google Scholar] [CrossRef]
- Tkachenko, A.; Clark, J.; Knutson, N.; Wallace, B.; Bomba, M.; Yacopucci, M.; Rhodes, B.; Nemser, S.M.; Guag, J.; Reimschuessel, R. Investigation of melamine and cyanuric acid deposition in pig tissues using LC-MS/MS methods. Food Chem. Toxicol. 2015, 80, 310–318. [Google Scholar] [CrossRef] [PubMed]
- Yang, T.; Huangfu, W.G.; Wu, Y.L. Melamine residues in eggs of laying hens exposed to melamine-contaminated feed. Poult. Sci. 2011, 90, 701–704. [Google Scholar] [CrossRef] [PubMed]
- Shi, X.; Dong, R.; Chen, J.; Yuan, Y.; Long, Q.; Guo, J.; Li, S.; Chen, B. An assessment of melamine exposure in Shanghai adults and its association with food consumption. Environ. Int. 2020, 135, 105363. [Google Scholar] [CrossRef] [PubMed]
- Zhu, H.; Kannan, K. Melamine and cyanuric acid in foodstuffs from the United States and their implications for human exposure. Environ. Int. 2019, 130, 104950. [Google Scholar] [CrossRef] [PubMed]
- Sathyanarayana, S.; Flynn, J.T.; Messito, M.J.; Gross, R.S.; Whitlock, K.B.; Kannan, K.; Karthikraj, R.; Morrison, D.; Huie, M.; Christakis, D.; et al. Melamine and cyanuric acid exposure and kidney injury in US children. Environ. Res. 2019, 171, 18–23. [Google Scholar] [CrossRef] [PubMed]
- Liu, C.-C.; Wu, C.-F.; Chen, B.-H.; Huang, S.-P.; Goggins, W.; Lee, H.-H.; Chou, Y.-H.; Wu, W.-J.; Huang, C.-H.; Shiea, J.; et al. Low exposure to melamine increases the risk of urolithiasis in adults. Kidney Int. 2011, 80, 746–752. [Google Scholar] [CrossRef] [Green Version]
- Curtin, L.R.; Mohadjer, L.K.; Dohrmann, S.M.; Kruszon-Moran, D.; Mirel, L.B.; Carroll, M.D.; Hirsch, R.; Burt, V.L.; Johnson, C.L. The National Health and Nutrition Examination Survey: Sample Design, 2007–2010. Vital Health Stat. 2 2013, 160, 1–23. [Google Scholar]
- Steinfeldt, L.; Anand, J.; Murayi, T. Food Reporting Patterns in the USDA Automated Multiple-Pass Method. Procedia Food Sci. 2013, 2, 145–156. [Google Scholar] [CrossRef] [Green Version]
- Lin, Y.-T.; Tsai, M.-T.; Chen, Y.-L.; Cheng, C.-M.; Hung, C.-C.; Wu, C.-F.; Liu, C.-C.; Hsieh, T.-J.; Shiea, J.; Chen, B.H.; et al. Can melamine levels in 1-spot overnight urine specimens predict the total previous 24-hour melamine excretion level in school children? Clin. Chim. Acta 2013, 420, 128–133. [Google Scholar] [CrossRef]
- US Department of Agriculture. The USDA Food and Nutrient Database for Dietary Studies, 2.0-Documentation and User Guide; Agricultural Research Service, Food Surveys Research Group: Beltsville, MD, USA, 2006. Available online: https://www.ars.usda.gov/ARSUserFiles/80400530/pdf/fndds/fndds2_doc.pdf (accessed on 1 April 2020).
- Bowman, S.A.; Friday, J.E.; Moshfegh, A.J. MyPyramid Equivalents Database, 2.0 for USDA Survey Foods, 2003–2004: Documentation and User Guide; Beltsville Human Nutrition Research Center, Agricultural Research Service, U.S. Department of Agriculture: Beltsville, MD, USA, 2008. Available online: https://www.ars.usda.gov/ARSUserFiles/80400530/pdf/mped/mped2_doc.pdf (accessed on 1 April 2020).
- Hu, F.B. Dietary pattern analysis: A new direction in nutritional epidemiology. Curr. Opin. Lipidol. 2002, 13, 3–9. [Google Scholar] [CrossRef]
- Schulze, M.B.; Martínez-González, M.A.; Fung, T.T.; Lichtenstein, A.H.; Forouhi, N.G. Food based dietary patterns and chronic disease prevention. BMJ 2018, 361, k2396. [Google Scholar] [CrossRef] [PubMed] [Green Version]
- National Health and Nutrition Examination Survey 2003–2004 Data Documentation, Codebook, and Frequencies: Melamine. 2009. Available online: https://wwwn.cdc.gov/Nchs/Nhanes/2003-2004/SSMEL_C.htm (accessed on 1 September 2020).
- CDC NHANES. Laboratory Procedure Manual: Urinary Creatinine. 2003. Available online: https://www.cdc.gov/nchs/data/nhanes/nhanes_03_04/l16_c_met_creatinine.pdf (accessed on 1 April 2020).
- O’Brien, K.M.; Upson, K.; Cook, N.R.; Weinberg, C.R. Environmental Chemicals in Urine and Blood: Improving Methods for Creatinine and Lipid Adjustment. Environ. Health Perspect. 2016, 124, 220–227. [Google Scholar] [CrossRef] [PubMed]
- VanderWeele, T.J.; Mathur, M.B. Some desirable properties of the bonferroni correction: Is the bonferroni correction really so bad? Am. J. Epidemiol. 2019, 188, 617–618. [Google Scholar] [CrossRef]
- Ogna, V.F.; Swiss Survey on Salt Group; Ogna, A.; Vuistiner, P.; Pruijm, M.; Ponte, B.; Ackermann, D.; Gabutti, L.; Vakilzadeh, N.; Mohaupt, M.; et al. New anthropometry-based age- and sex-specific reference values for urinary 24-hour creatinine excretion based on the adult Swiss population. BMC Med. 2015, 13, 1–10. [Google Scholar] [CrossRef] [Green Version]
- Mast, R.; Jeffcoat, A.; Sadler, B.; Kraska, R.; Friedman, M. Metabolism, disposition and excretion of [14C]melamine in male Fischer 344 rats. Food Chem. Toxicol. 1983, 21, 807–810. [Google Scholar] [CrossRef]
- Centers for Desease Control and Prevention. National Health and Nutrition Examination Survey 2003–2004. Available online: https://wwwn.cdc.gov/nchs/nhanes/continuousnhanes/default.aspx?BeginYear=2003 (accessed on 1 September 2020).
- Centers for Disease Control and Prevention. About Children & Teen BMI. Available online: https://www.cdc.gov/healthyweight/assessing/bmi/childrens_bmi/about_childrens_bmi.html (accessed on 1 April 2020).
- Centers for Disease Control and Prevention. About Adult BMI. Available online: https://www.cdc.gov/healthyweight/assessing/bmi/adult_bmi/index.html (accessed on 1 September 2020).
- National Health and Nutrition Examination Survey. Laboratory Procedures Manual. 2004. Available online: https://wwwn.cdc.gov/nchs/data/nhanes/2003-2004/manuals/lab.pdf (accessed on 1 April 2020).
- Centers for Disease Control and Prevention NHANES. Laboratory Procedure Manual: Serum Cotinine. 2003. Available online: https://www.cdc.gov/nchs/data/nhanes/nhanes_03_04/l06_c_met_cotinine.pdf (accessed on 1 April 2020).
- Kim, S. Overview of Cotinine Cutoff Values for Smoking Status Classification. Int. J. Environ. Res. Public Heal. 2016, 13, 1236. [Google Scholar] [CrossRef]
- Nwosu, B.U.; Kum-Nji, P. Tobacco smoke exposure is an independent predictor of vitamin D deficiency in US children. PLoS ONE 2018, 13, e0205342. [Google Scholar] [CrossRef]
- National Health and Nutrition Examination Survey 2003–2004 Data Documentation, Codebook, and Frequency: Physical Activity Monitor. Available online: https://wwwn.cdc.gov/Nchs/Nhanes/2003-2004/PAXRAW_C.htm (accessed on 1 September 2020).
- Harel, O.; Perkins, N.J.; Schisterman, E.F. The Use of Multiple Imputation for Data Subject to Limits of Detection. Sri Lankan J. Appl. Stat. 2014, 5, 227–246. [Google Scholar] [CrossRef] [PubMed] [Green Version]
- Liu, Y.; De, A. Multiple Imputation by Fully Conditional Specification for Dealing with Missing Data in a Large Epidemiologic Study. Int. J. Stat. Med Res. 2015, 4, 287–295. [Google Scholar] [CrossRef] [PubMed] [Green Version]
- Rubin, D.B. Multiple Imputation for Nonresponse in Surveys; John Wiley & Sons, Inc.: New York, NY, USA, 1987; Available online: https://www.onlinelibrary.wiley.com/doi/pdf/10.1002/9780470316696.fmatter (accessed on 1 April 2020).
- Zhu, H.; Kannan, K. Inter-day and inter-individual variability in urinary concentrations of melamine and cyanuric acid. Environ. Int. 2019, 123, 375–381. [Google Scholar] [CrossRef] [PubMed]
- Joo, J.; Williamson, S.A.; Vazquez, A.I.; Fernández, J.R.; Bray, M.S. Advanced Dietary Patterns Analysis Using Sparse Latent Factor Models in Young Adults. J. Nutr. 2018, 148, 1984–1992. [Google Scholar] [CrossRef] [PubMed]
- Kerver, J.M.; Yang, E.J.; Bianchi, L.; Song, W.O. Dietary patterns associated with risk factors for cardiovascular disease in healthy US adults. Am. J. Clin. Nutr. 2003, 78, 1103–1110. [Google Scholar] [CrossRef] [PubMed] [Green Version]
- Wu, C.-F.; Peng, C.-Y.; Liu, C.-C.; Lin, W.-Y.; Pan, C.-H.; Cheng, C.-M.; Hsieh, H.-M.; Hsieh, T.-J.; Chen, B.-H.; Wu, M.-T. Ambient Melamine Exposure and Urinary Biomarkers of Early Renal Injury. J. Am. Soc. Nephrol. 2015, 26, 2821–2829. [Google Scholar] [CrossRef] [Green Version]
- Ferguson, A.; Penney, R.; Solo-Gabriele, H.M. A Review of the Field on Children’s Exposure to Environmental Contaminants: A Risk Assessment Approach. Int. J. Environ. Res. Public Health 2017, 14, 265. [Google Scholar] [CrossRef]
- Zheng, L.Y.; Sanders, A.P.; Saland, J.M.; Wright, R.O.; Arora, M. Environmental exposures and pediatric kidney function and disease: A systematic review. Environ. Res. 2017, 158, 625–648. [Google Scholar] [CrossRef] [Green Version]
- Choi, L.; Kwak, M.Y.; Kwak, E.H.; Kim, D.H.; Han, E.Y.; Roh, T.; Bae, J.Y.; Ahn, I.Y.; Jung, J.Y.; Kwon, M.J.; et al. Comparative Nephrotoxicitiy Induced by Melamine, Cyanuric Acid, or a Mixture of Both Chemicals in Either Sprague-Dawley Rats or Renal Cell Lines. J. Toxicol. Environ. Health Part A 2010, 73, 1407–1419. [Google Scholar] [CrossRef]
- Guo, J.; Wu, C.-H.; Zhang, J.; Chang, X.; Zhang, Y.; Cao, Y.; Zhou, Z. Associations of melamine and cyanuric acid exposure with markers of kidney function in adults: Results from NHANES 2003–2004. Environ. Int. 2020, 141, 105815. [Google Scholar] [CrossRef]
- Zhang, Q.-X.; Yang, G.-Y.; Li, J.-T.; Li, W.; Zhang, B.; Zhu, W. Melamine induces sperm DNA damage and abnormality, but not genetic toxicity. Regul. Toxicol. Pharmacol. 2011, 60, 144–150. [Google Scholar] [CrossRef] [PubMed]
- Yang, Y.; Xiong, G.-J.; Yu, D.-F.; Cao, J.; Wang, L.-P.; Xu, L.; Mao, R.-R. Acute low-dose melamine affects hippocampal synaptic plasticity and behavior in rats. Toxicol. Lett. 2012, 214, 63–68. [Google Scholar] [CrossRef] [PubMed]
- Cruywagen, C.; Van De Vyver, W.F.J.; Stander, M. Quantification of melamine absorption, distribution to tissues, and excretion by sheep1. J. Anim. Sci. 2011, 89, 2164–2169. [Google Scholar] [CrossRef] [PubMed]
- Rai, N.; Banerjee, D.; Bhattacharyya, R. Urinary melamine: Proposed parameter of melamine adulteration of food. Nutrition 2014, 30, 380–385. [Google Scholar] [CrossRef] [PubMed]
- Zhu, H.; Loganathan, B.G.; Kannan, K. Occurrence and Profiles of Melamine and Cyanuric Acid in Bovine Feed and Urine from China, India, and the United States. Environ. Sci. Technol. 2019, 53, 7029–7035. [Google Scholar] [CrossRef]
- Sun, P.; Wang, J.; Shen, J.; Wei, H. Pathway for the elimination of melamine in lactating dairy cows. J. Dairy Sci. 2012, 95, 266–271. [Google Scholar] [CrossRef]
- Ji, X.; Yang, H.; Lyu, W.; Wang, J.; Wang, X.; Wang, X.; Qian, M. Evaluation of cyromazine transferred from feed to chicken products and subsequent assessment of dietary risks to Chinese consumers. J. Food Sci. 2020. [Google Scholar] [CrossRef]
- Zhu, H.; Halden, R.U.; Kannan, K. A nationwide survey of the occurrence of melamine and its derivatives in archived sewage sludge from the United States. Environ. Pollut. 2019, 245, 994–999. [Google Scholar] [CrossRef]
- Lund, K.H.; Petersen, J.H. Migration of formaldehyde and melamine monomers from kitchen- and tableware made of melamine plastic. Food Addit. Contam. 2006, 23, 948–955. [Google Scholar] [CrossRef] [Green Version]

| Population Group | n | Urinary Melamine (ng/mL) | Urinary Creatinine (mg/dL) | Creatinine-Adjusted Melamine (µg/g) | p-Value 1 | EDI (µg/kg Body Weight) | p-Value 1 |
|---|---|---|---|---|---|---|---|
| Total | 478 | 1.325 (0.143) | 142.4 (4.04) | 11.563 (1.235) | 0.251 (0.026) | ||
| Sex | <0.05 | 0.21 | |||||
| Male | 227 | 1.497 (0.224) | 140.7 (7.71) | 10.642 (1.825) | 0.259 (0.044) | ||
| Female | 251 | 1.176 (0.179) | 93.7 (5.14) | 12.553 (1.759) | 0.244 (0.034) | ||
| Age Group | <0.05 | <0.05 | |||||
| <18 | 124 | 0.689 (0.205) | 119.8 (8.08) | 5.125 (1.551) | 0.119 (0.036) | ||
| ≥18 and <40 | 164 | 1.050 (0.214) | 105.2 (4.57) | 8.765 (1.845) | 0.189 (0.040) | ||
| ≥40 | 190 | 1.958 (0.234) | 75.0 (6.69) | 18.617 (2.476) | 0.397 (0.054) | ||
| BMI Status 2,3 | <0.001 | <0.001 | |||||
| Underweight | 10 | 0.746 (0.548) | 113.1 (6.27) | 8.888 (7.828) | 0.184 (0.164) | ||
| Normal/healthy | 196 | 1.182 (0.235) | 141.9 (7.83) | 11.670 (2.503) | 0.251 (0.054) | ||
| Overweight | 151 | 1.433 (0.254) | 175.0 (48.73) | 12.669 (2.629) | 0.279 (0.057) | ||
| Obese | 115 | 1.489 (0.410) | 165.3 (9.85) | 10.489 (2.839) | 0.227 (0.062) | ||
| Poverty Income Ratio 2 | 0.26 | 0.22 | |||||
| <1.3 | 168 | 1.397 (0.196) | 124.7 (7.64) | 11.181 (1.442) | 0.241 (0.032) | ||
| ≥1.3 and <1.85 | 66 | 1.232 (0.280) | 131.8 (9.41) | 9.238 (2.270) | 0.201 (0.049) | ||
| ≥1.85 and <3.5 | 104 | 1.254 (0.315) | 111.0 (10.22) | 11.252 (2.949) | 0.243 (0.062) | ||
| ≥3.5 | 120 | 1.353 (0.288) | 104.5 (6.62) | 12.955 (3.038) | 0.284 (0.066) | ||
| Race/Hispanic Origin | 0.36 | 0.46 | |||||
| Mexican American | 106 | 1.327 (0.371) | 123.6 (4.29) | 11.547 (2.984) | 0.256 (0.066) | ||
| Other Hispanic | 20 | 0.643 (0.555) | 108.6 (4.88) | 5.201 (4.344) | 0.112 (0.094) | ||
| Non-Hispanic White | 203 | 1.452 (0.185) | 153.7 (12.21) | 13.371 (1.807) | 0.290 (0.039) | ||
| Non-Hispanic Black | 131 | 0.961 (0.154) | 105.5 (27.48) | 6.256 (1.277) | 0.136 (0.028) | ||
| Other including multiracial | 18 | 2.165 (0.462) | 149.0 (38.68) | 20.525 (8.999) | 0.452 (0.195) | ||
| Physical Activity Level 2,4 | <0.05 | <0.05 | |||||
| Inactive | 141 | 1.723 (0.308) | 97.7 (3.79) | 16.756 (2.912) | 0.350 (0.060) | ||
| Slightly Active | 71 | 1.031 (0.345) | 141.3 (16.18) | 7.580 (2.843) | 0.168 (0.062) | ||
| Active | 56 | 1.189 (0.360) | 102.6 (20.16) | 10.249 (3.616) | 0.226 (0.080) | ||
| Highly Active | 30 | 1.273 (0.371) | 105.9 (17.46) | 11.377 (3.854) | 0.258 (0.087) | ||
| Smoking Status 2,5 | 0.44 | 0.35 | |||||
| Nonsmoker | 288 | 1.383 (0.205) | 102.7 (3.62) | 13.466 (1.92) | 0.292 (0.042) | ||
| ETS-exposed | 67 | 1.051 (0.315) | 116.4 (16.45) | 9.033 (2.983) | 0.193 (0.063) | ||
| Active Smoker | 119 | 1.367 (0.259) | 137.7 (5.58) | 10.008 (1.971) | 0.219 (0.043) |
| Food Group | Units | Minimally Adjusted Model 2 | Fully Adjusted Model 3 | ||
|---|---|---|---|---|---|
| Estimate (95% CI) | p-Value 4 | Estimate (95% CI) | p-Value 4 | ||
| Primary Analysis: Meats and Grains | |||||
| Total Meat, Poultry and Fish | ounces | −2.8% (−6.5, 1.1) | 0.16 | −3.2% (−7.3, 1.1) | 0.14 |
| Red Meat | ounces | −4.3% (−10.3, 2.1) | 0.18 | −5.3% (−11.3, 1.2) | 0.11 |
| Processed Meat | ounces | 9.7% (2.3, 17.7) | 0.010 | 10.6% (2.7, 19.0) | 0.007 |
| Poultry | ounces | −2.7% (−9.6, 4.7) | 0.46 | −2.5% (−9.6, 5.1) | 0.50 |
| Fish and Seafood (High ω-3) | ounces | 9.3% (−4.8, 25.6) | 0.21 | 8.3% (−9.2, 29.1) | 0.38 |
| Fish and Seafood (Low ω-3) | ounces | −2.2% (−19.8, 19.1) | 0.82 | −1.8% (−20.3, 21.1) | 0.87 |
| Total Grains | ounces | 2.7% (−1.4, 6.9) | 0.20 | 2.7% (−1.1, 6.6) | 0.16 |
| Whole Grains | ounces | 20.3% (6.2, 36.3) | 0.004 * | 17.4% (4.7, 31.7) | 0.006 * |
| Non-Whole Grains | ounces | 1.7% (−2.6, 6.3) | 0.44 | 1.9% (−2.1, 6.1) | 0.36 |
| Secondary Analysis: Other Main Food Groups | |||||
| Total Dairy | cups | −0.9% (−9, 7.9) | 0.83 | −2.0% (−10.1, 6.8) | 0.64 |
| Total Vegetables | cups | 1.4% (−10.5, 14.9) | 0.83 | 1.2% (−12.2, 16.6) | 0.87 |
| Total Fruits | cups | 11.8% (1.4, 23.3) | 0.026 | 11.9% (−1.9, 27.6) | 0.09 |
| Discretionary Oils | g | −0.3% (−1.1, 0.6) | 0.53 | −0.2% (−1.0, 0.5) | 0.59 |
| Discretionary Solid Fats | g | −0.2% (−0.9, 0.5) | 0.63 | −0.2% (−0.9, 0.5) | 0.53 |
| Added Sugars | teaspoons | −0.1% (−1.2, 1.0) | 0.85 | −0.2% (−1.3, 0.9) | 0.73 |
| Food Group | Western Pattern | Prudent Pattern | American-Healthy Pattern | Convenience Pattern |
|---|---|---|---|---|
| Whole Grains | 0.010 | 0.175 | 0.262 | 0.108 |
| Non-Whole Grains | 0.267 | −0.058 | 0.097 | −0.028 |
| Dark-Green Vegetables | 0.003 | 0.257 | 0.040 | −0.086 |
| Orange Vegetables | 0.000 | 0.254 | 0.002 | −0.142 |
| White Potatoes | 0.066 | 0.066 | −0.326 | 0.195 |
| Other Starchy Vegetables | 0.005 | 0.098 | −0.068 | 0.027 |
| Tomatoes | 0.176 | 0.011 | 0.147 | −0.322 |
| Other Vegetables | 0.107 | 0.263 | −0.038 | −0.327 |
| Citrus, Melons, and Berries | 0.033 | 0.108 | 0.176 | 0.013 |
| Other Fruits | 0.002 | 0.161 | 0.347 | 0.090 |
| Milk | 0.070 | 0.001 | 0.254 | 0.291 |
| Yogurt | −0.007 | 0.060 | 0.176 | 0.038 |
| Cheese | 0.222 | −0.138 | 0.164 | −0.080 |
| Red Meat | 0.103 | −0.007 | −0.222 | −0.261 |
| Organ Meat | 0.017 | 0.006 | −0.030 | 0.036 |
| Processed Meat | 0.103 | −0.111 | 0.048 | 0.146 |
| Poultry | 0.031 | 0.118 | −0.148 | 0.119 |
| Fish and Seafood (High ω-3) | −0.002 | 0.153 | 0.022 | −0.046 |
| Fish and Seafood (Low ω-3) | 0.006 | 0.144 | −0.018 | −0.004 |
| Eggs | 0.063 | 0.012 | −0.077 | −0.038 |
| Soy Products | 0.000 | 0.140 | 0.153 | −0.136 |
| Nuts and Seeds | 0.052 | 0.245 | −0.055 | 0.276 |
| Legumes | 0.047 | 0.030 | 0.037 | −0.138 |
| Discretionary Oils | 0.146 | 0.290 | −0.203 | 0.259 |
| Discretionary Solid Fats | 0.300 | −0.113 | 0.020 | 0.062 |
| Added Sugars | 0.196 | −0.064 | −0.126 | 0.190 |
| Alcoholic Beverages | 0.046 | 0.050 | −0.237 | −0.195 |
| Dietary Pattern | Minimally Adjusted Model 2 | Fully Adjusted Model 3 |
|---|---|---|
| Western | 0.02 (−0.17, 0.20) | 0.01 (−0.18, 0.20) |
| Prudent | −0.02 (−0.13, 0.09) | −0.01 (−0.14, 0.12) |
| American-Healthy | 0.15 (0.05, 0.25) | 0.15 (0.05, 0.24) |
| Convenience | −0.02 (−0.17, 0.14) | −0.01 (−0.16, 0.13) |
Publisher’s Note: MDPI stays neutral with regard to jurisdictional claims in published maps and institutional affiliations. |
© 2020 by the authors. Licensee MDPI, Basel, Switzerland. This article is an open access article distributed under the terms and conditions of the Creative Commons Attribution (CC BY) license (http://creativecommons.org/licenses/by/4.0/).
Share and Cite
Melough, M.M.; Foster, D.; Fretts, A.M.; Sathyanarayana, S. Dietary Sources of Melamine Exposure among US Children and Adults in the National Health and Nutrition Examination Survey 2003–2004. Nutrients 2020, 12, 3844. https://doi.org/10.3390/nu12123844
Melough MM, Foster D, Fretts AM, Sathyanarayana S. Dietary Sources of Melamine Exposure among US Children and Adults in the National Health and Nutrition Examination Survey 2003–2004. Nutrients. 2020; 12(12):3844. https://doi.org/10.3390/nu12123844
Chicago/Turabian StyleMelough, Melissa M., Deborah Foster, Amanda M. Fretts, and Sheela Sathyanarayana. 2020. "Dietary Sources of Melamine Exposure among US Children and Adults in the National Health and Nutrition Examination Survey 2003–2004" Nutrients 12, no. 12: 3844. https://doi.org/10.3390/nu12123844