Assessing Mediterranean Diet Adherence with the Smartphone: The Medipiatto Project

 , , , ,
Abstract
1. Introduction
- (1)
- The introduction of a concrete set of rules regarding the assessment of MDA. This is implemented based on the MD score that we use in the current manuscript. The rules that are introduced take into account the type, frequency, and quantity of the consumed foods and refer to the scoring system chosen for this manuscript.
- (2)
- The design and development of an innovative AI-based system for automatic MDA assessment, which estimates the user’s long- and short-term adherence to MD. To the best of our knowledge, the proposed system is the first AI-based system for MDA assessment. The designed core algorithm embedded in the proposed system is able to recognize multiple food items and their serving sizes simultaneously from a single food image. The experimental results demonstrate the better performance of the designed algorithm compared to the widely used baseline algorithm.
- (3)
- A comparison study between the proposed system and four experienced dietitians for MDA assessment on the food images captured under free-living condition was conducted. The results of the study indicate similar results between the proposed system and the experienced dietitians.
1.1. Related Work
1.1.1. MDA Evaluation
1.1.2. AI in Dietary Assessment
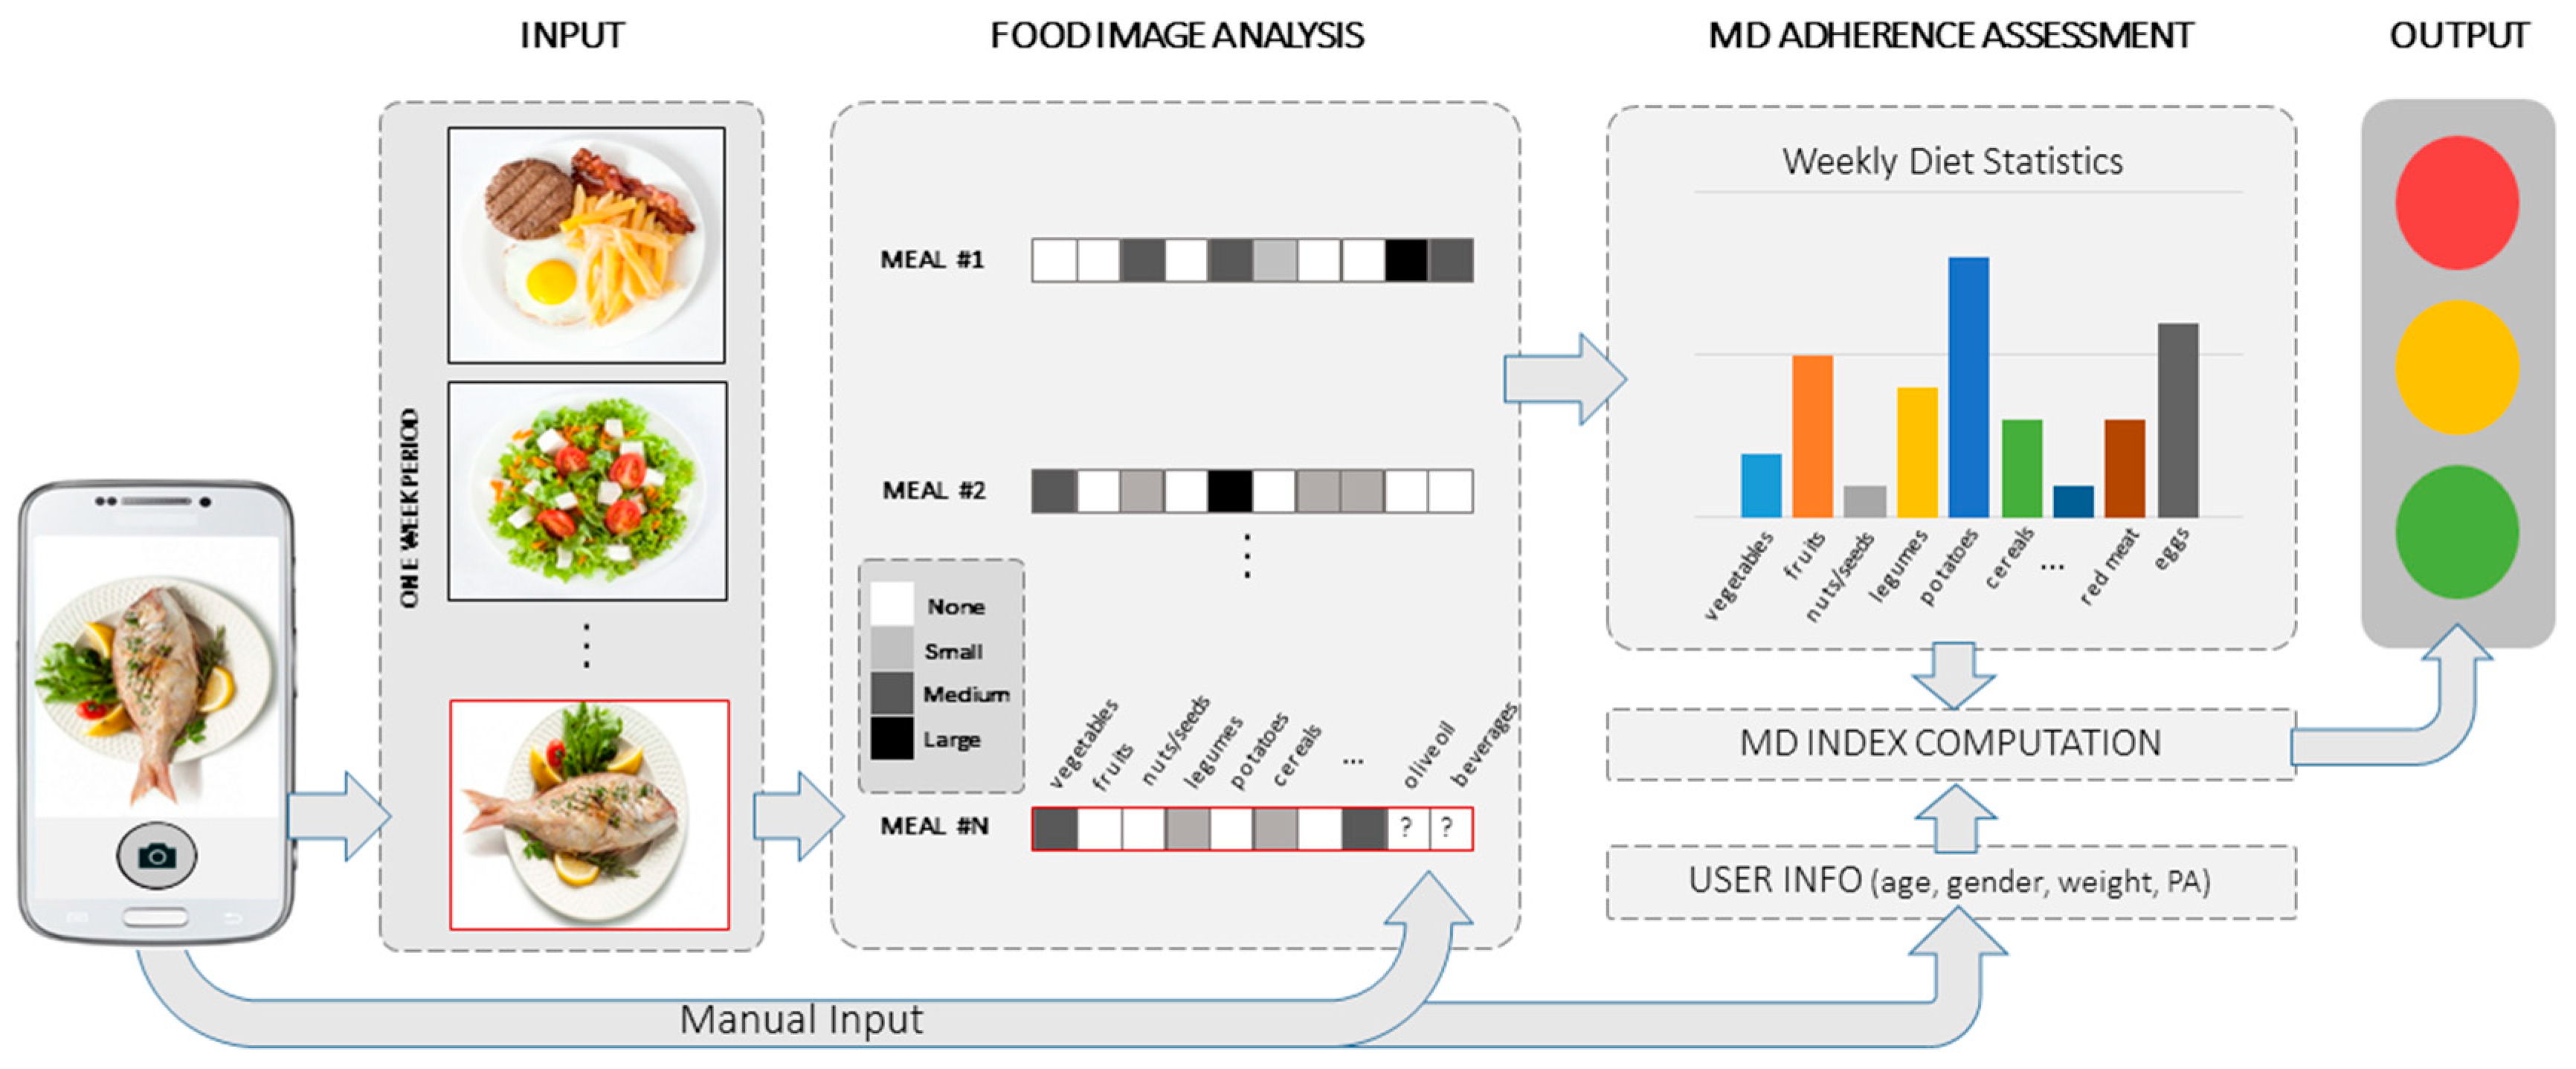
2. Methodology
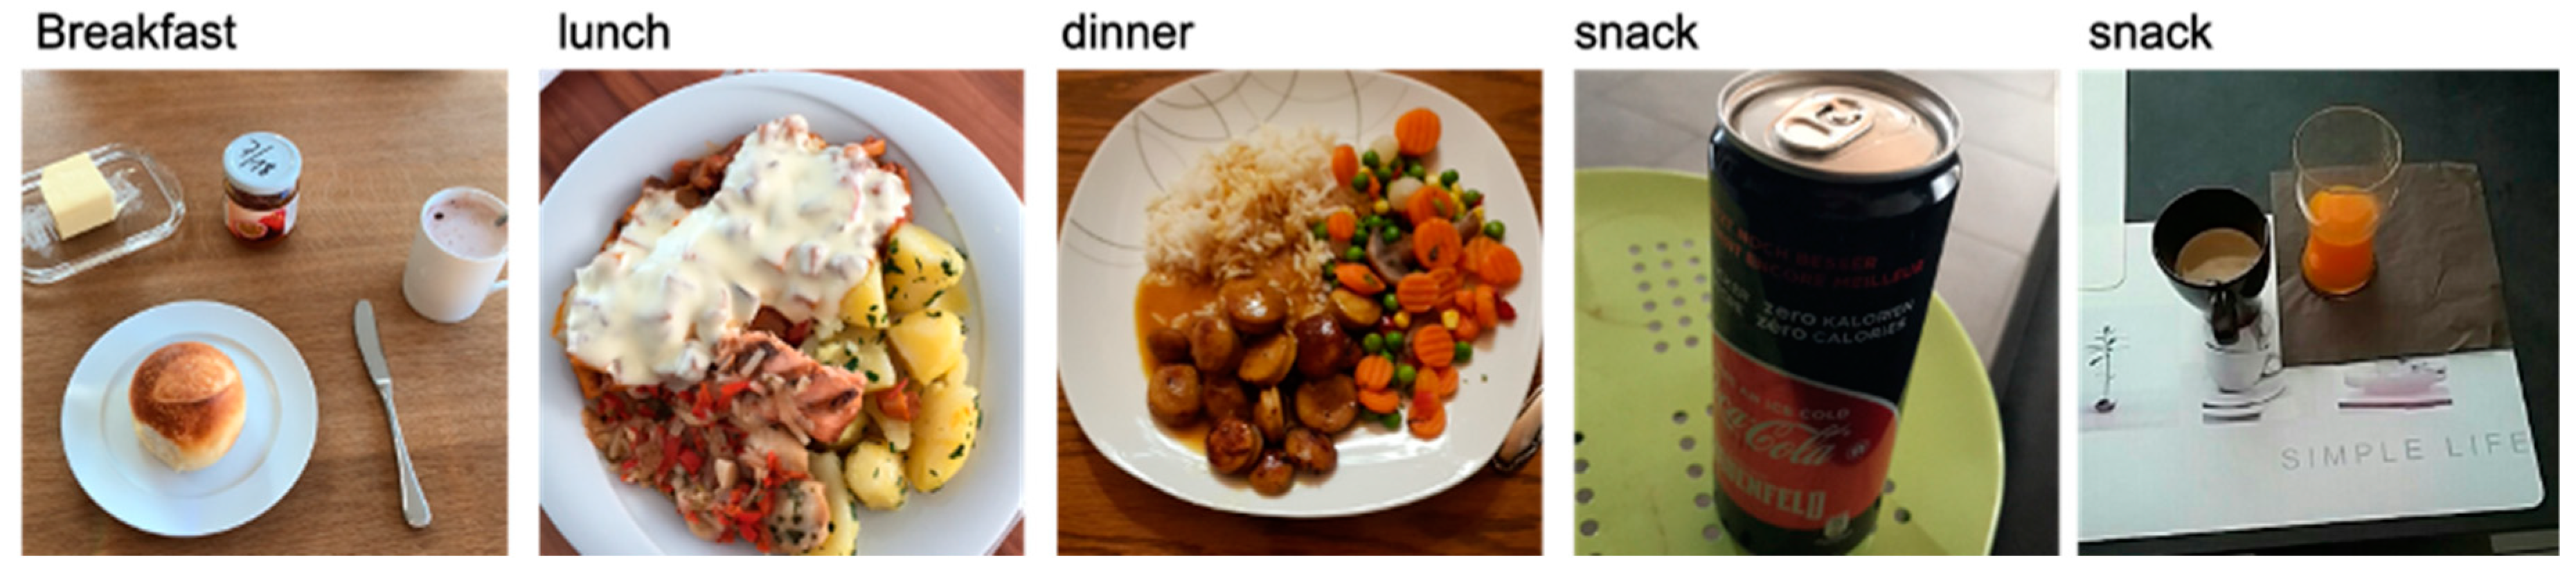
2.1. Data Gathering
2.2. Annotators’ Questionnaire
2.3. Rules’ Definition for MD Scoring
2.3.1. Components That Are Counted Daily or per Meal
2.3.2. Components That Are Counted Weekly
2.3.3. Total Score Calculation
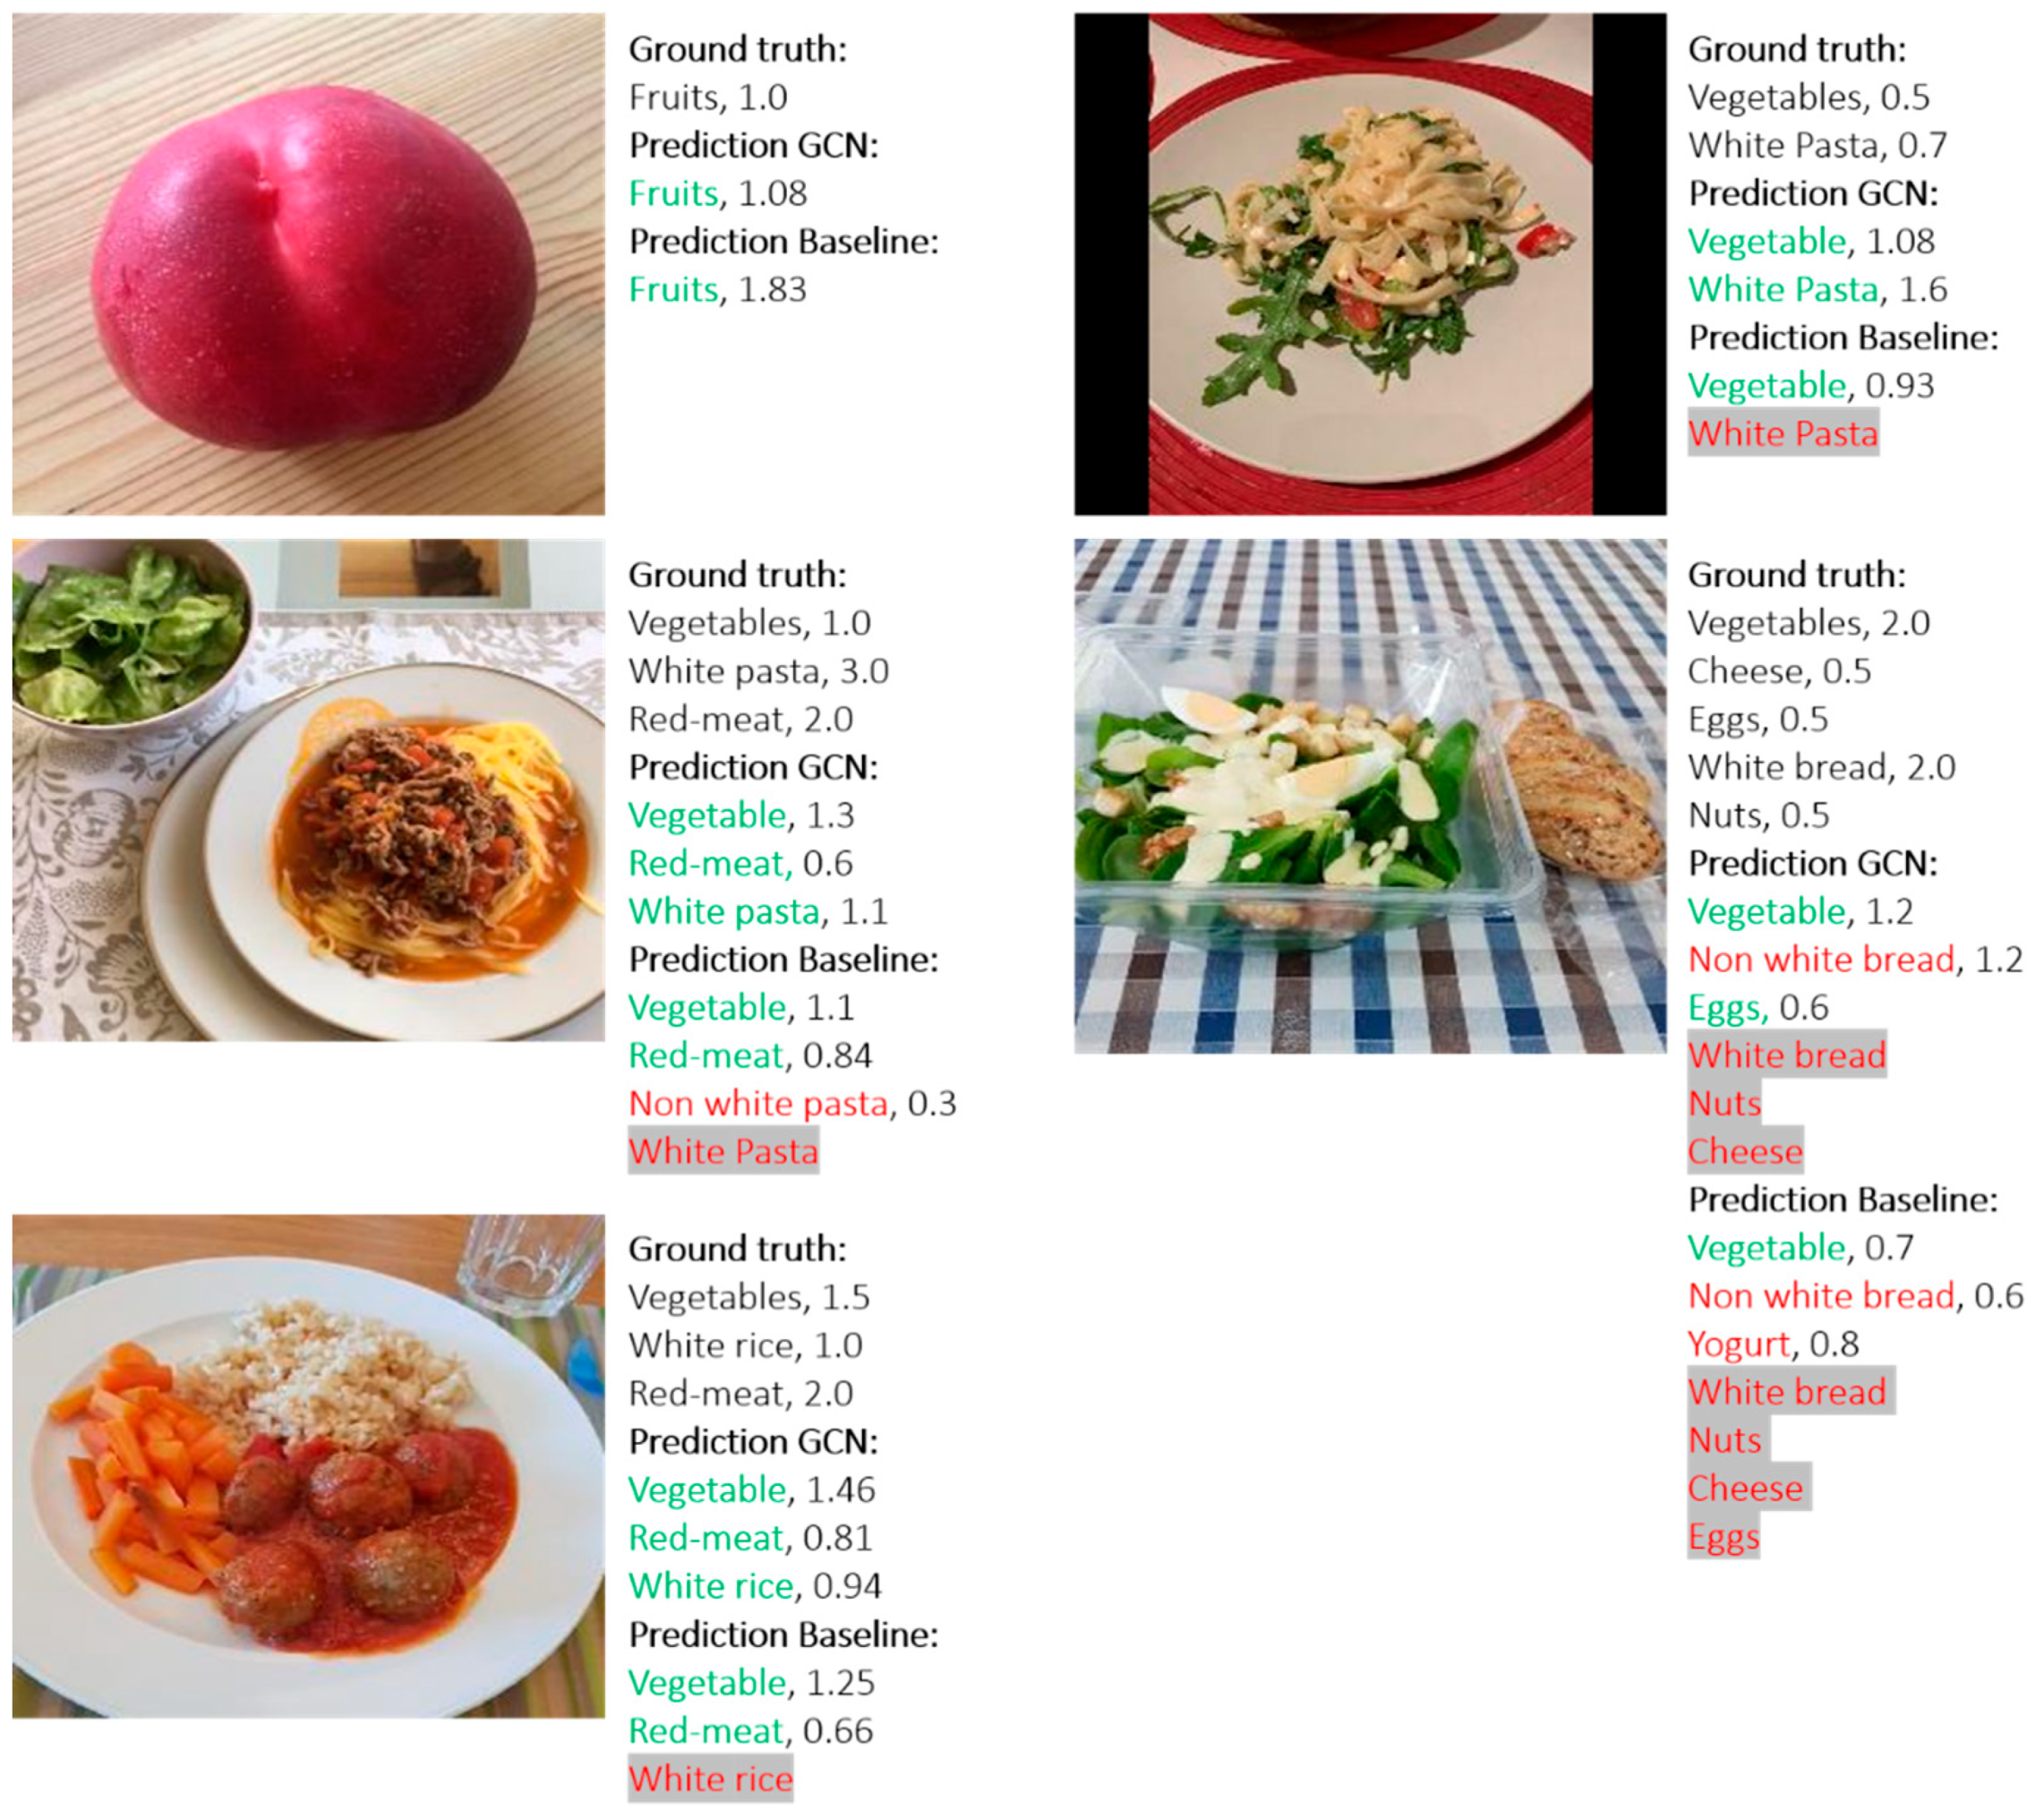
2.3.4. Food Recognition and Serving Size Estimation
3. Results
3.1. Database
3.2. Food Recognition and Serving Size Estimation
3.3. MD Adherence Assessment
4. Conclusions
Author Contributions
Funding
Conflicts of Interest
Appendix A

| Food Category | Meal | Servings per Meal | Point |
|---|---|---|---|
| Fruits Vegetables | Breakfast | 0 | 0 |
| Cereals Olive oil | ≥1 | 1 | |
| Fruits Vegetables | Lunch | 0 | 0 |
| Cereals Olive oil | ≥1 | 1 | |
| Fruit Vegetables | Dinner | 0 | 0 |
| Cereals Olive oil | ≥1 | 1 |
| Food Category | Meals | Servings per Day | Points |
|---|---|---|---|
| Nuts | Any | 0 | 0 |
| ≥1 | 2 | ||
| Dairy | Any | 0 | 0 |
| 1 | 1 | ||
| ≥2 | 2 | ||
| Fermented Beverages | Any | 0 | 0 |
| 1–2 | 1 | ||
| >2 | 0 |
| Food Categories | Meals | Servings per Week | Points |
|---|---|---|---|
| Legumes | Any | <2 | 0 |
| ≥2 | 1 | ||
| Eggs | Any | <2 | 0 |
| ≥2 | 1 | ||
| Fish | Any | <2 | 0 |
| ≥2 | 1 | ||
| White Meat | Any | <2 | 0 |
| ≥2 | 1 | ||
| Red Meat | Any | ≥2 | 0 |
| <2 | 1 | ||
| Sweets | Any | >2 | 0 |
| ≤2 | 1 |
References
- Benetou, V.; Trichopoulou, A.; Orfanos, P.; Naska, A.; Lagiou, P.; Boffetta, P.; Trichopoulos, D. Conformity to traditional Mediterranean diet and cancer incidence: The Greek EPIC cohort. Br. J. Cancer 2008, 99, 191–195. [Google Scholar] [CrossRef] [PubMed]
- Shai, I.; Schwarzfuchs, D.; Henkin, Y.; Sahar, D.R.; Witkow, S.; Greenberg, I.; Golan, R.; Fraser, D.; Bolotin, A.; Vardi, H.; et al. Weight loss with a low-carbohydrate, Mediterranean, or low-fat diet. N. Engl. J. Med. 2008, 359, 229–241. [Google Scholar] [CrossRef] [PubMed]
- Schwarzfuchs, D.; Golan, R.; Shai, I. Four-year follow-up after two-year dietary interventions. N. Engl. J. Med. 2012, 367, 1373–1374. [Google Scholar] [CrossRef] [PubMed]
- Guasch-Ferré, M.; Bulló, M.; Martínez-González, M.A.; Ros, E.; Corella, D.; Estruch, R.; Fitó, M.; Arós, F.; Wärnberg, J.; Fiol, M.; et al. Frequency of nut consumption and mortality risk in the PREDIMED nutrition intervention trial. BMC Med. 2013, 11. [Google Scholar] [CrossRef] [PubMed]
- Salas-Salvadó, J.; Bulló, M.; Babio, N.; Martínez-González, M.; Ibarrola-Jurado, N.; Basora, J.; Estruch, R.; Covas, M.; Corella, D.; Arós, F.; et al. Reduction in the Incidence of Type 2 Diabetes With the Mediterranean Diet: Results of the PREDIMED-Reus nutrition intervention randomized trial. Diabetes Care 2011, 34, 2259–2260. [Google Scholar]
- Serra-Majem, L.; Roman, B.; Estruch, R. Scientific evidence of interventions using the Mediterranean diet: A systematic review. Nutr. Rev. 2006, 64, 27–47. [Google Scholar] [CrossRef]
- Trichopoulos, A.D.; Bamia, C.; Trichopoulos, D. Anatomy of health effects of Mediterranean diet: Greek EPIC prospective cohort study. BMJ 2009, 338, b2337. [Google Scholar] [CrossRef]
- Estruch, R.; Ros, E.; Salas-Salvadó, J.; Covas, M.-I.; Corella, D.; Aros, F.; Gomez-Gracia, E.; Ruiz-Gutierrez, V.; Fiol, M.; Lapetra, J.; et al. Primary Prevention of Cardiovascular Disease with a Mediterranean Diet. N. Engl. J. Med. 2018, 378, e34. [Google Scholar] [CrossRef]
- Corrada, M.M.; Kawas, C.H.; Mozaffar, F.; Paganini-Hill, A. Association of body mass index and weight change with all-cause mortality in the elderly. Am. J. Epidemiol. 2006, 163, 938–949. [Google Scholar] [CrossRef]
- Trichopoulou, A.; Kouris-Blazos, A.; Wahlqvist, M.L.; Gnardellis, C.; Lagiou, P.; Polychronopoulos, E.; Vassilakou, T.; Lipworth, L.; Trichopoulos, D. Diet and overall survival in elderly people. BMJ 1995, 311, 1457–1460. [Google Scholar] [CrossRef]
- Bach-Faig, A.; Berry, E.; Lairon, D.; Reguant, J.; Trichopoulou, A.; Dernini, S.; Medina, F.X.; Battino, M.; Belahsen, R.; Miranda, G.; et al. Mediterranean diet pyramid today. Science and cultural updates. Public Health Nutr. 2011, 14, 2274–2284. [Google Scholar] [CrossRef] [PubMed]
- Zaragoza-Martí, A.; Cabañero-Martínez, M.J.; Hurtado-Sánchez, J.A.; Laguna-Pérez, A.; Ferrer-Cascales, R. Evaluation of Mediterranean diet adherence scores: A systematic review. BMJ Open 2018, 8. [Google Scholar] [CrossRef] [PubMed]
- Horiguchi, S.; Amano, S.; Ogawa, M.; Aizawa, K. Personalized Classifier for Food Image Recognition. IEEE Trans. Multimed. 2018, 20, 2836–2848. [Google Scholar] [CrossRef]
- Dehais, J.; Anthimopoulos, M.; Shevchik, S.; Mougiakakou, S. Two-View 3D Reconstruction for Food Volume Estimation. IEEE Trans. Multimed. 2017, 19, 1090–1099. [Google Scholar] [CrossRef]
- Myers, A.; Johnston, N.; Rathod, V.; Korattikara, A.; Gorban, A.; Silberman, N.; Guadarrama, S.; Papandreou, G.; Huang, J.; Murphy, K. Im2calories: Towards an automated mobile vision food diary. In Proceedings of the IEEE International Conference on Computer Vision (ICCV), Santiago, Chile, 7–13 December 2015; IEEE: Santiago, Chile, 2015. [Google Scholar]
- Fontanellaz, M.; Christodoulidis, S.; Mougiakakou, S. Self-attention and ingredient-attention based model for recipe retrieval from image queries. In Proceedings of the 5th International Workshop on Multimedia Assisted Dietary Management (MADiMa’19), Nice, France, 21–25 October 2019; Association for Computing Machinery: New York, NY, USA. [Google Scholar] [CrossRef]
- Marin, J.; Biswas, A.; Ofli, F.; Hynes, N.; Salvador, A.; Aytar, Y.; Weber, I.; Torralba, A. Recipe1M+: A Dataset for Learning Cross-Modal Embeddings for Cooking Recipes and Food Images. IEEE Trans. Pattern Anal. Mach. Intell. 2020, 1. [Google Scholar] [CrossRef] [PubMed]
- Vasiloglou, M.F.; Mougiakakou, S.; Aubry, E.; Bokelmann, A.; Fricker, R.; Gomes, F.; Guntermann, C.; Meyer, A.; Studerus, D.; Stanga, Z. A Comparative Study on Carbohydrate Estimation: GoCARB vs. Dietitians. Nutrients 2018, 10, 741. [Google Scholar] [CrossRef] [PubMed]
- Chen, H.C.; Jia, W.; Yue, Y.; Li, Z.; Sun, Y.N.; Fernstrom, J.D.; Sun, M. Model-based measurement of food portion size for image-based dietary assessment using 3d/2d registration. Meas. Sci. Technol. 2013, 24, 105701. [Google Scholar] [CrossRef]
- Vasiloglou, M.F.; Christodoulidis, S.; Reber, E.; Stathopoulou, T.; Lu, Y.; Stanga, Z.; Mougiakakou, S. What Healthcare Professionals Think of “Nutrition & Diet” Apps: An International Survey. Nutrients 2020, 12, 2214. [Google Scholar]
- Lu, Y.; Stathopoulou, T.; Vasiloglou, M.F.; Pinault, L.F.; Kiley, C.; Spanakis, E.K.; Mougiakakou, S. goFOODTM: An Artificial Intelligence System for Dietary Assessment. Sensors 2020, 20, 4283. [Google Scholar] [CrossRef]
- Lu, Y.; Stathopoulou, T.; Vasiloglou, M.F.; Christodoulidis, S.; Blum, B.; Walser, T.; Meier, V.; Stanga, Z.; Mougiakakou, S. An artificial intelligence-based system for nutrient intake assessment of hospitalised patients. In Proceedings of the 41st International Engineering in Medicine Biology Conference, IEEE EMBC2019, Berlin, Germany, 23–27 July 2019. [Google Scholar] [CrossRef]
- Burke, L.; Styn, M.; Glanz, K.; Ewing, L.; Elci, O.; Conroy, M.; Sereika, S.; Acharya, S.; Music, E.; Keating, A.; et al. SMART trial: A randomized clinical trial of self-monitoring in behavioral weight management-design and baseline findings. Contemp. Clin. Trials 2009, 30, 540–551. [Google Scholar] [CrossRef]
- Chen, Z.-M.; Wei, X.-S.; Wang, P.; Guo, Y. Multi-Label Image Recognition with Graph Convolutional Networks. In Proceedings of the IEEE/CVF Conference on Computer Vision and Pattern Recognition (CVPR), Long Beach, CA, USA, 16–20 June 2019. [Google Scholar]
- Chen, T.; Xu, M.; Hui, X.; Wu, H. Learning semantic-specific graph representation for multi-labelimage recognition. In Proceedings of the IEEE/CVF International Conference on Computer Vi-sion 2019 (ICCV 2019), Seoul, Korea, 27 October–2 November 2019. [Google Scholar]
- Kipf, T.; Welling, M. Semi-supervised classification with graph convolutional networks. In Proceedings of the ICLR 2017, Toulon, France, 24–26 April 2017. [Google Scholar]
- British Nutrition Foundation, Find your Balance. An Easy Guide for Finding the Right Balance for You. A full List of Portion Sizes. 2019. Available online: https://www.nutrition.org.uk/attachments/article/1193/Find%20your%20balance_%20full%20portion%20size%20list.pdf (accessed on 4 December 2020).
- Bolaños, M.; Ferrà, A.; Radeva, P. Food ingredients recognition through multi-label learning. In Proceedings of the International Conference on Image Analysis and Processing, Catania, Italy, 11–15 September 2017. [Google Scholar] [CrossRef]
- Rumawas, M.E.; Dwyer, J.T.; McKeown, N.M.; Meigs, J.B.; Rogers, G.; Jacques, P.F. The development of the Mediterranean-style dietary pattern score and its application to the American diet in the Framingham Offspring Cohort. J. Nutr. 2009, 139, 1150–1156. [Google Scholar] [CrossRef] [PubMed]
- Benítez-Arciniega, A.A.; Mendez, M.A.; Baena-Díez, J.M.; Rovira Martori, M.A.; Soler, C.; Marrugat, J.; Covas, M.I.; Sanz, H.; Llopis, A.; Schröder, H. Concurrent and construct validity of Mediterranean diet scores as assessed by an FFQ. Public Health Nutr. 2011, 14, 2015–2021. [Google Scholar] [CrossRef] [PubMed]
- CIHEAM/FAO. Mediterranean food consumption patterns: Diet, environment, society, economy and health. In Proceedings of the A White Paper Priority 5 of Feeding Knowledge Programme, Rome, Italy, 2015. [Google Scholar]
- Aguilar, E.; Remeseiro, B.; Bolaos, M.; Radeva, P. Grab, pay, and eat: Semantic food detection for smart restaurants. IEEE Trans. Multimed. 2018, 20, 3266–3275. [Google Scholar] [CrossRef]
- Milà-Villarroel, R.; Bach-Faig, A.; Puig, J.; Puchal, A.; Farran, A.; Serra-Majem, L.; Carrasco, J.L. Comparison and Evaluation of the Reliability of Indexes of Adherence to the Mediterranean Diet. Public Health Nutr. 2011, 14, 2338–2345. [Google Scholar] [CrossRef]
- Ciocca, G.; Napoletano, P.; Schettini, R. Food Recognition: A New Dataset, Experiments, and Results. IEEE J. Biomed. Health Inform. 2017, 21, 588–598. [Google Scholar] [CrossRef]
- Anthimopoulos, M.; Gianola, L.; Scarnato, L.; Diem, P.; Mougiakakou, S. A food recognition system for diabetic patients based on an optimized bag-of-features model. IEEE J. Biomed. Health Inform. 2014, 18, 1261–1271. [Google Scholar] [CrossRef]
- Bossard, L.; Guillaumin, M.; Van Gool, L. Food-101—Mining discriminative components with random forests. In Proceedings of the ECCV 2014, Zurich, Switzerland, 6–12 September 2014; Springer International Publishing: Cham, Switzerland, 2014. [Google Scholar]
- Jiang, S.; Min, W.; Liu, L.; Luo, Z. Multi-scale multi-view deep feature aggregation for food recognition. IEEE Trans. Image Process. 2020, 29, 265–276. [Google Scholar] [CrossRef]
- Kolev, K.; Brox, T.; Cremers, D. Fast Joint Estimation of Silhouettes and Dense 3D Geometry from Multiple Images. IEEE Trans. Pattern Anal. Mach. Intell. 2012, 34, 493–505. [Google Scholar] [CrossRef]
- Furukawa, Y.; Curless, B.; Seitz, S.; Szeliski, R. Towards internet-scale multi-view stereo. In Proceedings of the 2010 IEEE Computer Society Conference on Computer Vision and Pattern Recognition (CVPR 2010), San Francisco, CA, USA, 13–18 June 2010. [Google Scholar] [CrossRef]
- Wu, C. VisualSFM: A Visual Structure from Motion System. Available online: http://ccwu.me/vsfm/ (accessed on 13 October 2020).
- Kong, F.; Tan, J. Dietcam: Automatic dietary assessment with mobile camera phones. Pervasive Mob. Comput. 2012, 8, 147–163. [Google Scholar] [CrossRef]
- Puri, M.; Zhu, Z.; Yu, Q.; Divakaran, A.; Sawhney, H. Recognition and volume estimation of food intake using a mobile device. In Proceedings of the 2009 Workshop on Applications of Computer Vision (WACV), Snowbird, UT, USA, 7–8 December 2009. [Google Scholar] [CrossRef]
- Allegra, D.; Anthimopoulos, M.; Dehais, J.; Lu, Y.; Farinella, G.; Mougiakakou, S. A multimedia database for automatic meal assessment systems. In New Trends in Image Analysis and Processing—ICIAP 2017; Springer International Publishing: Cham, Switzerland, 2017; pp. 474–478. [Google Scholar]
- Lo, F.P.; Sun, Y.; Qiu, J.; Lo, B.P.L. Point2Volume: A Vision-Based Dietary Assessment Approach Using View Synthesis. IEEE Trans. Industr. Inform. 2020, 16, 577–586. [Google Scholar] [CrossRef]
- Lu, Y.; Allegra, D.; Anthimopoulos, M.; Stanco, F.; Farinella, G.; Mougiakakou, S. A multi-task learning approach for meal assessment. In Proceedings of the MADiMa 2018, Stockholm, Sweden, 15 July 2018. [Google Scholar]
- Vilarnau, C.; Stracker, D.M.; Funtikov, A.; da Silva, R.; Estruch, R.; Bach-Faig, A. Worldwide adherence to Mediterranean Diet between 1960 and 2011. Eur. J. Clin. Nutr. 2019, 72, 83–91. [Google Scholar] [CrossRef] [PubMed]
- Monteagudo, C.; Mariscal-Arcas, M.; Rivas, A.; Lorenzo-Tovar, M.L.; Tur, J.A.; Olea-Serrano, F. Proposal of a Mediterranean diet serving score. PLoS ONE 2015, 10. [Google Scholar] [CrossRef] [PubMed]
- Schweizerische Gesellschaft für Ernährung. Schweizer Lebensmittelpyramide Empfehlungen zum Ausgewogenen und Genussvollen Essen und Trinken für Erwachsene. Available online: http://www.sge-ssn.ch/media/sge_pyramid_long_D_2014.pdf (accessed on 4 December 2020).
- He, K.; Zhang, X.; Ren, S.; Sun, J. Deep residual learning for image recognition. In Proceedings of the IEEE/CVF Conference on Computer Vision and Pattern Recognition (CVPR), Las Vegas, NV, USA, 26 June–1 July 2016. [Google Scholar]
- Pennington, J.; Socher, R.; Manning, C. GloVe: Global Vectors for Word Representation. In Proceedings of the 2014 Conference on Empirical Methods in Natural Language Processing (EMNLP), Doha, Qatar, 25–29 October 2014; Association for Computational Linguistics: Stroudsburg, PA, USA; pp. 1532–1543. [Google Scholar]
- Oviva S.A. Altendorf, Switzerland. Available online: https://oviva.com (accessed on 4 December 2020).


| Mediterranean Diet Serving Score (MDSS) | |||
|---|---|---|---|
| Food Category | Recommendation * | Max. Score | Size per Serving *** |
| Meal basis | |||
| Fruit | 1–2 servings or more/main meal ** | 3 | 80 g |
| Vegetables | ≥2 servings/main meal ** | 3 | 80 g |
| Cereals a | 1–2 servings or more/main meal ** | 3 | 50 g |
| Olive Oil b | 1 serving or more/main meal ** | 3 | 10 g, 15 mL |
| Maximum Score: | 12 | ||
| Daily basis | |||
| Nuts | 1–2 servings or more/day | 2 | 20–30 g |
| Dairy products c | 2 servings or more/day | 2 | |
| Milk | 200 mL | ||
| Yoghurt | 120–150 g | ||
| Cheese | 30 g (for soft cheese: 60 g, for cottage cheese: 100 g) | ||
| Fermented beverages g | 1–2 glass/day (0 points for ≥ 2 glasses) | 1 | |
| Wine | 100 mL | ||
| Beer | 250 mL | ||
| Maximum Score: | 5 | ||
| Weekly basis | |||
| Potatoes | ≤3 servings/week | 1 | 200 g |
| Legumes | ≥2 servings/week | 1 | 120 g |
| Eggs | 2–4 servings/week | 1 | 120 g |
| Fish | ≥2 servings/week | 1 | 120 g |
| White meat d | 2 servings/week | 1 | 120 g |
| Red meat e | <2 servings/week | 1 | 120 g |
| Sweets f | ≤2 servings/week | 1 | 20 g |
| Ice-cream | 75 g | ||
| Chocolate | 30 g | ||
| Cookie/pastry | 30 g | ||
| Sweetened Soft drink | 330 mL | ||
| Maximum Score: | 7 | ||
| Total maximum score | 24 | ||
| Food | Drink | |
|---|---|---|
| 1. vegetables | 13. potatoes non-fried | 24. beverage—water |
| 2. fruits | 14. French fries | 25. beverage—coffee |
| 3. nuts | 15. meat white | 26. beverage—tea |
| 4. legumes/pulses | 16. meat red | 27. beverage—wine |
| 5. bread white | 17. fish/seafood | 28. beverage—beer |
| 6. bread non-white | 18. eggs | 29. beverage—alcoholic * |
| 7. pasta white | 19. breaded food | 30. beverage—soft-drink |
| 8. pasta non-white | 20. sweets | 31. beverage—milky coffee |
| 9. rice white | 21. milk | |
| 10. rice non-white | 22. yogurt | |
| 11. cereals unprocessed | 23. cheese | |
| 12. cereals processed | ||
| Method | mAP | MAPE | Time (s) |
|---|---|---|---|
| ResNet-101 | 0.47 | 63% | 0.15 |
| GCN-based | 0.58 | 61% | 0.2 |
| Higher is better | Lower is better |
| Time Period | Proposed System | Experienced Dietitians |
|---|---|---|
| Week 1 | 8.4 | 9.6 |
| Week 2 | 8.9 | 8.8 |
| MD Score | |
|---|---|
| 0–8 | LOW compliance with MD—RED colour |
| 9–15 | MEDIUM compliance with MD—ORANGE colour |
| 16–24 | HIGH compliance with MD—GREEN colour |
Publisher’s Note: MDPI stays neutral with regard to jurisdictional claims in published maps and institutional affiliations. |
© 2020 by the authors. Licensee MDPI, Basel, Switzerland. This article is an open access article distributed under the terms and conditions of the Creative Commons Attribution (CC BY) license (http://creativecommons.org/licenses/by/4.0/).
Share and Cite
Vasiloglou, M.F.; Lu, Y.; Stathopoulou, T.; Papathanail, I.; Faeh, D.; Ghosh, A.; Baumann, M.; Mougiakakou, S. Assessing Mediterranean Diet Adherence with the Smartphone: The Medipiatto Project. Nutrients 2020, 12, 3763. https://doi.org/10.3390/nu12123763
Vasiloglou MF, Lu Y, Stathopoulou T, Papathanail I, Faeh D, Ghosh A, Baumann M, Mougiakakou S. Assessing Mediterranean Diet Adherence with the Smartphone: The Medipiatto Project. Nutrients. 2020; 12(12):3763. https://doi.org/10.3390/nu12123763
Chicago/Turabian StyleVasiloglou, Maria F., Ya Lu, Thomai Stathopoulou, Ioannis Papathanail, David Faeh, Arindam Ghosh, Manuel Baumann, and Stavroula Mougiakakou. 2020. "Assessing Mediterranean Diet Adherence with the Smartphone: The Medipiatto Project" Nutrients 12, no. 12: 3763. https://doi.org/10.3390/nu12123763
APA StyleVasiloglou, M. F., Lu, Y., Stathopoulou, T., Papathanail, I., Faeh, D., Ghosh, A., Baumann, M., & Mougiakakou, S. (2020). Assessing Mediterranean Diet Adherence with the Smartphone: The Medipiatto Project. Nutrients, 12(12), 3763. https://doi.org/10.3390/nu12123763