Identifying the Profile of Orthorexic Behavior and “Normal” Eating Behavior with Cluster Analysis: A Cross-Sectional Study among Polish Adults


Abstract
1. Introduction
2. Materials and Methods
2.1. Participants and Study Design
2.2. Minimal Sample Size Calculation
2.3. Measures
2.3.1. The Düsseldorf Orthorexia Scale (DOS)
2.3.2. The Three-Factor Eating Questionnaire (TFEQ-R18)
2.3.3. The Eating Disorder Inventory (EDI)
2.3.4. The International Physical Activity Questionnaire (IPAQ)
2.3.5. The Obsessive-Compulsive Inventory—Revised (OCI-R)
3. Results
3.1. Statistical Analysis
3.2. Characteristics of the Study Population
3.3. Exploratory Factor Analysis for the Methods Used in the Present Study
3.4. Cluster Analysis
3.5. Bivariate Analysis
3.6. Mulivariable Analysis
4. Discussion
5. Conclusions
Author Contributions
Funding
Acknowledgments
Conflicts of Interest
References
- Crawford, R. Healthism and the medicalization of everyday life. Int. J. Health Serv. 1980, 10, 365–388. [Google Scholar] [CrossRef] [PubMed]
- Haman, L.; Barker-Ruchti, N.; Patriksson, G.; Lindgren, E.C. Orthorexia nervosa: An integrative literature review of a lifestyle syndrome. Int. J. Qual. Stud. Health Well-Being 2015, 10, 26799. [Google Scholar] [CrossRef] [PubMed]
- Kessler, H.S. Simple interventions to improve healthy eating behaviors in the school cafeteria. Nutr. Rev. 2016, 74, 198–209. [Google Scholar] [CrossRef] [PubMed]
- Bratman, S.; Knight, D. Orthorexia nervosa: Overcoming the obsession with healthful eating. Health Food Junkies; Broadway Books: New York, NY, USA, 2000. [Google Scholar]
- Dunn, T.M.; Bratman, S. On orthorexia nervosa: A review of the literature and proposed diagnostic criteria. Eat. Behav. 2016, 21, 11–17. [Google Scholar] [CrossRef] [PubMed]
- Koven, N.S.; Abry, A.W. The clinical basis of orthorexia nervosa: Emerging perspectives. Neuropsychiatr Dis. Treat. 2015, 11, 385–394. [Google Scholar] [CrossRef]
- Bartel, S.J.; Sherry, S.B.; Farthing, G.R.; Stewart, S.H. Classification of orthorexia nervosa: Further evidence for placement within the eating disorders spectrum. Eat. Behav. 2020, 38, 101406. [Google Scholar] [CrossRef]
- Bratman, S. Orthorexia vs. Theories of healthy eating. Eat. Weight Disord. 2017, 22, 381–385. [Google Scholar] [CrossRef]
- Gramaglia, C.; Brytek-Matera, A.; Rogoza, R.; Zeppegno, P. Orthorexia and anorexia nervosa: Two distinct phenomena? A cross-cultural comparison of orthorexic behaviours in clinical and non-clinical samples. BMC Psychiatry 2017, 17, 75. [Google Scholar] [CrossRef]
- Brytek-Matera, A. Healthy eating obsession in women with anorexia nervosa: A case control study. In New Developments in Anorexia Nervosa Research; Gramaglia, C., Zeppegno, P., Eds.; Nova: New York, NY, USA, 2014; pp. 39–50. [Google Scholar]
- Cena, H.; Barthels, F.; Cuzzolaro, M.; Bratman, S.; Brytek-Matera, A.; Dunn, T.; Varga, M.; Missbach, B.; Donini, L.M. Definition and diagnostic criteria for orthorexia nervosa: A narrative review of the literature. Eat. Weight Disord. 2019, 24, 209–246. [Google Scholar] [CrossRef]
- Bert, F.; Gualano, M.R.; Voglino, G.; Rossello, P.; Perret, J.P.; Siliquini, R. Orthorexia nervosa: A cross-sectional study among athletes competing in endurance sports in Northern Italy. PLoS ONE 2019, 14, e0221399. [Google Scholar] [CrossRef]
- Malmborg, J.; Bremander, A.; Olsson, M.C.; Bergman, S. Health status, physical activity, and orthorexia nervosa: A comparison between exercise science students and business students. Appetite 2017, 109, 137–143. [Google Scholar] [CrossRef] [PubMed]
- Oberle, C.D.; Watkins, R.S.; Burkot, A.J. Orthorexic eating behaviors related to exercise addiction and internal motivations in a sample of university students. Eat. Weight Disord. 2018, 23, 67–74. [Google Scholar] [CrossRef] [PubMed]
- Rudolph, S. The connection between exercise addiction and orthorexia nervosa in German fitness sports. Eat. Weight Disord. 2018, 23, 581–586. [Google Scholar] [CrossRef] [PubMed]
- Segura-Garcia, C.; Papaianni, M.C.; Caglioti, F.; Procopio, L.; Nistico, C.G.; Bombardiere, L.; Ammendolia, A.; Rizza, P.; De Fazio, P.; Capranica, L. Orthorexia nervosa: A frequent eating disordered behavior in athletes. Eat. Weight Disord. 2012, 17, e226–e233. [Google Scholar] [PubMed]
- Bundros, J.; Clifford, D.; Silliman, K.; Morris, M.N. Prevalence of orthorexia nervosa among college students based on Bratman’s test and associated tendencies. Appetite 2016, 101, 86–94. [Google Scholar] [CrossRef] [PubMed]
- Hayes, O.; Wu, M.S.; De Nadai, A.S.; Storch, E.A. Orthorexia nervosa: An examination of the prevalence, correlates, and associated impairment in a university sample. J. Cogn. Psychother. 2017, 31, 124–135. [Google Scholar] [CrossRef]
- Oberle, C.D.; Samaghabadi, R.O.; Hughes, E.M. Orthorexia nervosa: Assessment and correlates with gender, BMI, and personality. Appetite 2017, 108, 303–310. [Google Scholar] [CrossRef]
- Koven, N.S.; Senbonmatsu, R. A neuropsychological evaluation of orthorexia nervosa. Open J. Psychiatry 2013, 3, 214–222. [Google Scholar] [CrossRef]
- Scarff, J.R. Orthorexia nervosa: An obsession with healthy eating. Fed. Pract. 2017, 34, 36–39. [Google Scholar]
- Parra-Fernandez, M.L.; Rodriguez-Cano, T.; Onieva-Zafra, M.D.; Perez-Haro, M.J.; Casero-Alonso, V.; Fernandez-Martinez, E.; Notario-Pacheco, B. Prevalence of orthorexia nervosa in university students and its relationship with psychopathological aspects of eating behaviour disorders. BMC Psychiatry 2018, 18, 364. [Google Scholar] [CrossRef]
- Plichta, M.; Jezewska-Zychowicz, M. Orthorexic tendency and eating disorders symptoms in Polish students: Examining differences in eating behaviors. Nutrients 2020, 12, 218. [Google Scholar] [CrossRef] [PubMed]
- Voglino, G.; Parente, E.; Bert, F.; Lo Moro, G.; Corradi, A.; Lapiccirella, M.; Gualano, M.R.; Siliquini, R. Orthorexia nervosa, a challenging evaluation: Analysis of a sample of customers from organic food stores. Psychol. Health Med. 2020, 2020, 1–9. [Google Scholar] [CrossRef] [PubMed]
- Haddad, C.; Hallit, R.; Akel, M.; Honein, K.; Akiki, M.; Kheir, N.; Obeid, S.; Hallit, S. Validation of the arabic version of the ORTO-15 questionnaire in a sample of the Lebanese population. Eat. Weight Disord. 2020, 25, 951–960. [Google Scholar] [CrossRef] [PubMed]
- Haddad, C.; Obeid, S.; Akel, M.; Honein, K.; Akiki, M.; Azar, J.; Hallit, S. Correlates of orthorexia nervosa among a representative sample of the Lebanese population. Eat. Weight Disord. 2019, 24, 481–493. [Google Scholar] [CrossRef] [PubMed]
- Donini, L.M.; Marsili, D.; Graziani, M.P.; Imbriale, M.; Cannella, C. Orthorexia nervosa: Validation of a diagnosis questionnaire. Eat. Weight Disord. 2005, 10, e28–e32. [Google Scholar] [CrossRef]
- Gleaves, D.H.; Graham, E.C.; Ambwani, S. Measuring “orthorexia”: Development of the Eating Habits Questionnaire. Int. J. Educ. Psychol. Assess. 2013, 12, 1–18. [Google Scholar]
- Barthels, F.; Meyer, F.; Pietrowsky, R. Die düsseldorfer Orthorexie Skala–konstruktion und evaluation eines fragebogens zur erfassung ortho-rektischen ernährungsverhaltens [Duesseldorf Orthorexia Scale–construction and evaluation of a questionnaire measuring orthorexic eating behavior]. Z. für Klinische Psychol. und Psychother. 2015, 4, 97–105. [Google Scholar] [CrossRef]
- Dunn, T.M.; Gibbs, J.; Whitney, N.; Starosta, A. Prevalence of orthorexia nervosa is less than 1%: Data from a US sample. Eat. Weight Disord. 2017, 22, 185–192. [Google Scholar] [CrossRef]
- Oberle, C.D.; De Nadai, A.S.; Madrid, A.L. Orthorexia Nervosa Inventory (ONI): Development and validation of a new measure of orthorexic symptomatology. Eat. Weight Disord. 2020, 1–14. [Google Scholar] [CrossRef]
- Meule, A.; Holzapfel, C.; Brandl, B.; Greetfeld, M.; Hessler-Kaufmann, J.B.; Skurk, T.; Quadflieg, N.; Schlegl, S.; Hauner, H.; Voderholzer, U. Measuring orthorexia nervosa: A comparison of four self-report questionnaires. Appetite 2020, 146, 104512. [Google Scholar] [CrossRef]
- Opitz, M.C.; Newman, E.; Mellado, A.S.A.V.; Robertson, M.D.A.; Sharpe, H. The psychometric properties of orthorexia nervosa assessment scales: A systematic review and reliability generalization. Appetite 2020, 155, 104797. [Google Scholar] [CrossRef] [PubMed]
- Howard, M.C.; Hoffman, M.E. Variable-centered, person-centered, and person-specific approaches: Where theory meets the method. Organ. Res. Methods 2018, 21, 846–876. [Google Scholar] [CrossRef]
- Parra-Fernandez, M.L.; Onieva-Zafra, M.D.; Fernandez-Martinez, E.; Abreu-Sanchez, A.; Fernandez-Munoz, J.J. Assessing the prevalence of orthorexia nervosa in a sample of university students using two different self-report measures. Int. J. Environ. Res. Public Health 2019, 16, 2459. [Google Scholar] [CrossRef] [PubMed]
- Hulley, S.; Cummings, S.; Browner, W.; Grady, D.; Newman, T. Designing Clinical Research: An Epidemiologic Approach, 4th ed.; Appendix 6C; Lippincott Williams & Wilkins: Philadelphia, PA, USA, 2013; p. 79. [Google Scholar]
- Brytek-Matera, A. Polish version of the Düsseldorf Orthorexia Scale (PL-DOS) and its comparison with English version of the DOS (E-DOS). Eat Weight Disord. 2020, 1–10. [Google Scholar] [CrossRef] [PubMed]
- Karlsson, J.; Persson, L.-O.; Sjöström, L.; Sullivan, M. Psychometric properties and factor structure of the Three-factor Eating Questionnaire (TFEQ) in obese men and women. Results from the swedish obese subjects (sos) study. Int. J. Obes. 2000, 24, 1715–1725. [Google Scholar] [CrossRef] [PubMed]
- Garner, D.M.; Olmsted, M.P.; Polivy, J. Development and validation of a multidimensional Eating Disorder Inventory for anorexia nervosa and bulimia. Int. J. Eat. Disord. 1983, 2, 15–34. [Google Scholar] [CrossRef]
- Żechowski, C. Polska wersja kwestionariusza zaburzeń odżywiania (EDI)–adaptacja i normalizacja. Psychiatry Pol. 2008, 42, 179–193. [Google Scholar]
- IPAQ Research Committee. Guidelines for Data Processing and Analysis of the International Physical Activity Questionnaire (IPAQ)—Short and Long Forms; Karolinska institutet: Stockholm, Sweden, 2005. [Google Scholar]
- Kim, Y.; Park, I.; Kang, M. Convergent validity of the International Physical Activity Questionnaire (IPAQ): Meta-analysis. Public Health Nutr. 2013, 16, 440–452. [Google Scholar] [CrossRef]
- Loyen, A.; Van Hecke, L.; Verloigne, M.; Hendriksen, I.; Lakerveld, J.; Steene-Johannessen, J.; Vuillemin, A.; Koster, A.; Donnelly, A.; Ekelund, U.; et al. Variation in population levels of physical activity in European adults according to cross-european studies: A systematic literature review within DEDIPAC. Int. J. Behav. Nutr. Phys. Act. 2016, 13, 72. [Google Scholar] [CrossRef]
- Biernat, E.; Stupnicki, R.; Gajewski, A.K. Międzynarodowy Kwestionariusz Aktywności Fizycznej (IPAQ)–wersja polska [International Physical Activity Questionnaire (IPAQ)–Polish version]. Wych. Fiz. Sport 2007, 51, 47–54. [Google Scholar]
- Foa, E.B.; Huppert, J.D.; Leiberg, S.; Langner, R.; Kichic, R.; Hajcak, G.; Salkovskis, P.M. The Obsessive-Compulsive Inventory: Development and validation of a short version. Psychol. Assess. 2002, 14, 485–496. [Google Scholar] [CrossRef] [PubMed]
- Jeśka, M. Narzędzia do pomiaru objawów zaburzenia obsesyjno-kompulsyjnego (zastosowanie, właściwości, wady i zalety) [Tools for measuring the symptoms of obsessive-compulsive disorder (application, properties, advantages and disadvantages)]. Neuropsychiatry Przegląd Klin. 2012, 4, 137–142. [Google Scholar]
- Mojsa-Kaja, J.; Golonka, K.; Gawłowska, M. Preliminary analyses of psychometric characteristics of the Polish version of the Obsessive-Compulsive Inventory-Revised (OCI-R) in a non-clinical sample. Int. J. Occup. Med. Environ. Health 2016, 29, 1011–1021. [Google Scholar] [CrossRef] [PubMed]
- Strahler, J.; Hermann, A.; Walter, B.; Stark, R. Orthorexia nervosa: A behavioral complex or a psychological condition? J. Behav. Addict. 2018, 7, 1143–1156. [Google Scholar] [CrossRef] [PubMed]
- Poyraz, C.A.; Tüfekçioğlu, E.Y.; Özdemir, A.; Baş, A.; Kani, A.S.; Erginöz, E.; Duran, A. Relationship between orthorexia and obsessive-compulsive symptoms in patients with generalised anxiety disorder, panic disorder and obsessive compulsive disorder. Yeni Symp. 2015, 53, 22–26. [Google Scholar] [CrossRef]
- Barnes, M.A.; Caltabiano, M.L. The interrelationship between orthorexia nervosa, perfectionism, body image and attachment style. Eat. Weight Disord. 2017, 22, 177–184. [Google Scholar] [CrossRef]
- Brytek-Matera, A. Restrained eating and vegan, vegetarian and omnivore dietary intakes. Nutrients 2020, 12, 2133. [Google Scholar] [CrossRef]
- McComb, S.E.; Mills, J.S. Orthorexia nervosa: A review of psychosocial risk factors. Appetite 2019, 140, 50–75. [Google Scholar] [CrossRef]
- Barthels, F.; Kisser, J.; Pietrowsky, R. Orthorexic eating behavior and body dissatisfaction in a sample of young females. Eat. Weight Disord. 2020, 1–5. [Google Scholar] [CrossRef]
- Tolin, D.F. Understanding and treating hoarding: A biopsychosocial perspective. J. Clin. Psychol. 2011, 67, 517–526. [Google Scholar] [CrossRef]
- Canale, A.; Klontz, B. Hoarding disorder: It’s more than just an obsession-implications for financial therapists and planners. J. Financ. Ther. 2013, 4, 4. [Google Scholar] [CrossRef]
- Vuillier, L.; Robertson, S.; Greville-Harris, M. Orthorexic tendencies are linked with difficulties with emotion identification and regulation. J. Eat. Disord. 2020, 8, 15. [Google Scholar] [CrossRef] [PubMed]
- Greville-Harris, M.; Smithson, J.; Karl, A. What are people’s experiences of orthorexia nervosa? A qualitative study of online blogs. Eat. Weight Disord. 2019, 25, 1693–1702. [Google Scholar] [CrossRef] [PubMed]
- Greetfeld, M.; Hessler-Kaufmann, J.B.; Brandl, B.; Skurk, T.; Holzapfel, C.; Quadflieg, N.; Schlegl, S.; Hauner, H.; Voderholzer, U. Orthorexic tendencies in the general population: Association with demographic data, psychiatric symptoms, and utilization of mental health services. Eat. Weight Disord. 2020, 1–9. [Google Scholar] [CrossRef]
- Strahler, J.; Haddad, C.; Salameh, P.; Sacre, H.; Obeid, S.; Hallit, S. Cross-cultural differences in orthorexic eating behaviors: Associations with personality traits. Nutrition 2020, 77, 110811. [Google Scholar] [CrossRef]


| Variables | M ± SD |
|---|---|
| Age | 26.52 ± 7.65 |
| Body Mass Index | 24.84 ± 5.31 |
| Orthorexia nervosa (DOS) | 17.66 ± 5.19 |
| Cognitive restraint (TFEQ-R18) | 10.34 ± 2.82 |
| Uncontrolled eating (TFEQ-R18) | 9.19 ± 5.80 |
| Emotional eating (TFEQ-R18) | 3.44 ± 2.64 |
| Drive for thinness (EDI) | 4.29 ± 4.81 |
| Bulimia (EDI) | 2.65 ± 4.39 |
| Body dissatisfaction (EDI) | 8.27 ± 7.36 |
| Ineffectiveness (EDI) | 5.71 ± 5.12 |
| Perfectionism (EDI) | 5.06 ± 4.09 |
| Interpersonal distrust (EDI) | 4.20 ± 4.24 |
| Interoceptive awareness (EDI) | 4.49 ± 5.29 |
| Maturity fear (EDI) | 6.33 ± 5.47 |
| Total physical activity (IPAQ) | 2342.91 ± 2877.45 |
| Hoarding (OCI-R) | 3.19 ± 2.76 |
| Ordering (OCI-R) | 3.47 ± 2.88 |
| Mental neutralizing (OCI-R) | 1.52 ± 2.40 |
| Washing (OCI-R) | 2.28 ± 2.42 |
| Obsessing (OCI-R) | 2.11 ± 2.69 |
| Checking (OCI-R) | 3.80 ± 3.11 |
| Total OCI-R | 16.36 ± 12.62 |
| Variable | Factor 1 Obsessive-Compulsive Disorder Features | Factor 2 Inappropriate Eating and Body-Related Behaviors | Factor 3 Psychological and Affective Traits of Eating Disorders | Factor 4 Perfectionism and Behaviors Associated with Weight Maintenance or Weight Loss | h2 Communalities |
|---|---|---|---|---|---|
| Ordering (OCI-R) | 0.841 | 0.717 | |||
| Mental neutralizing (OCI-R) | 0.808 | 0.682 | |||
| Washing (OCI-R) | 0.785 | 0.549 | |||
| Checking (OCI-R) | 0.775 | 0.578 | |||
| Obsessing (OCI-R) | 0.700 | 0.712 | |||
| Hoarding (OCI-R) | 0.661 | 0.599 | |||
| Emotional eating (TFEQ-R18) | 0.992 | 0.750 | |||
| Uncontrolled eating (TFEQ-R18) | 0.956 | 0.718 | |||
| Bulimia (EDI) | 0.797 | 0.799 | |||
| Drive for thinness (EDI) | 0.500 | 0.683 | |||
| Interoceptive awareness (EDI) | 0.497 | 0.799 | |||
| Ineffectiveness (EDI) | 0.801 | 0.773 | |||
| Interpersonal distrust (EDI) | 0.763 | 0.442 | |||
| Maturity and fear (EDI) | 0.745 | 0.523 | |||
| Body dissatisfaction (EDI) | 0.550 | 0.488 | |||
| Cognitive restraint (TFEQ-R18) | 0.750 | 0.625 | |||
| Perfectionism (EDI) | 0.653 | 0.548 | |||
| Total physical activity (IPAQ) | 0.644 | 0.427 | |||
| Variance explained | 33.74 | 14.40 | 8.50 | 6.76 |
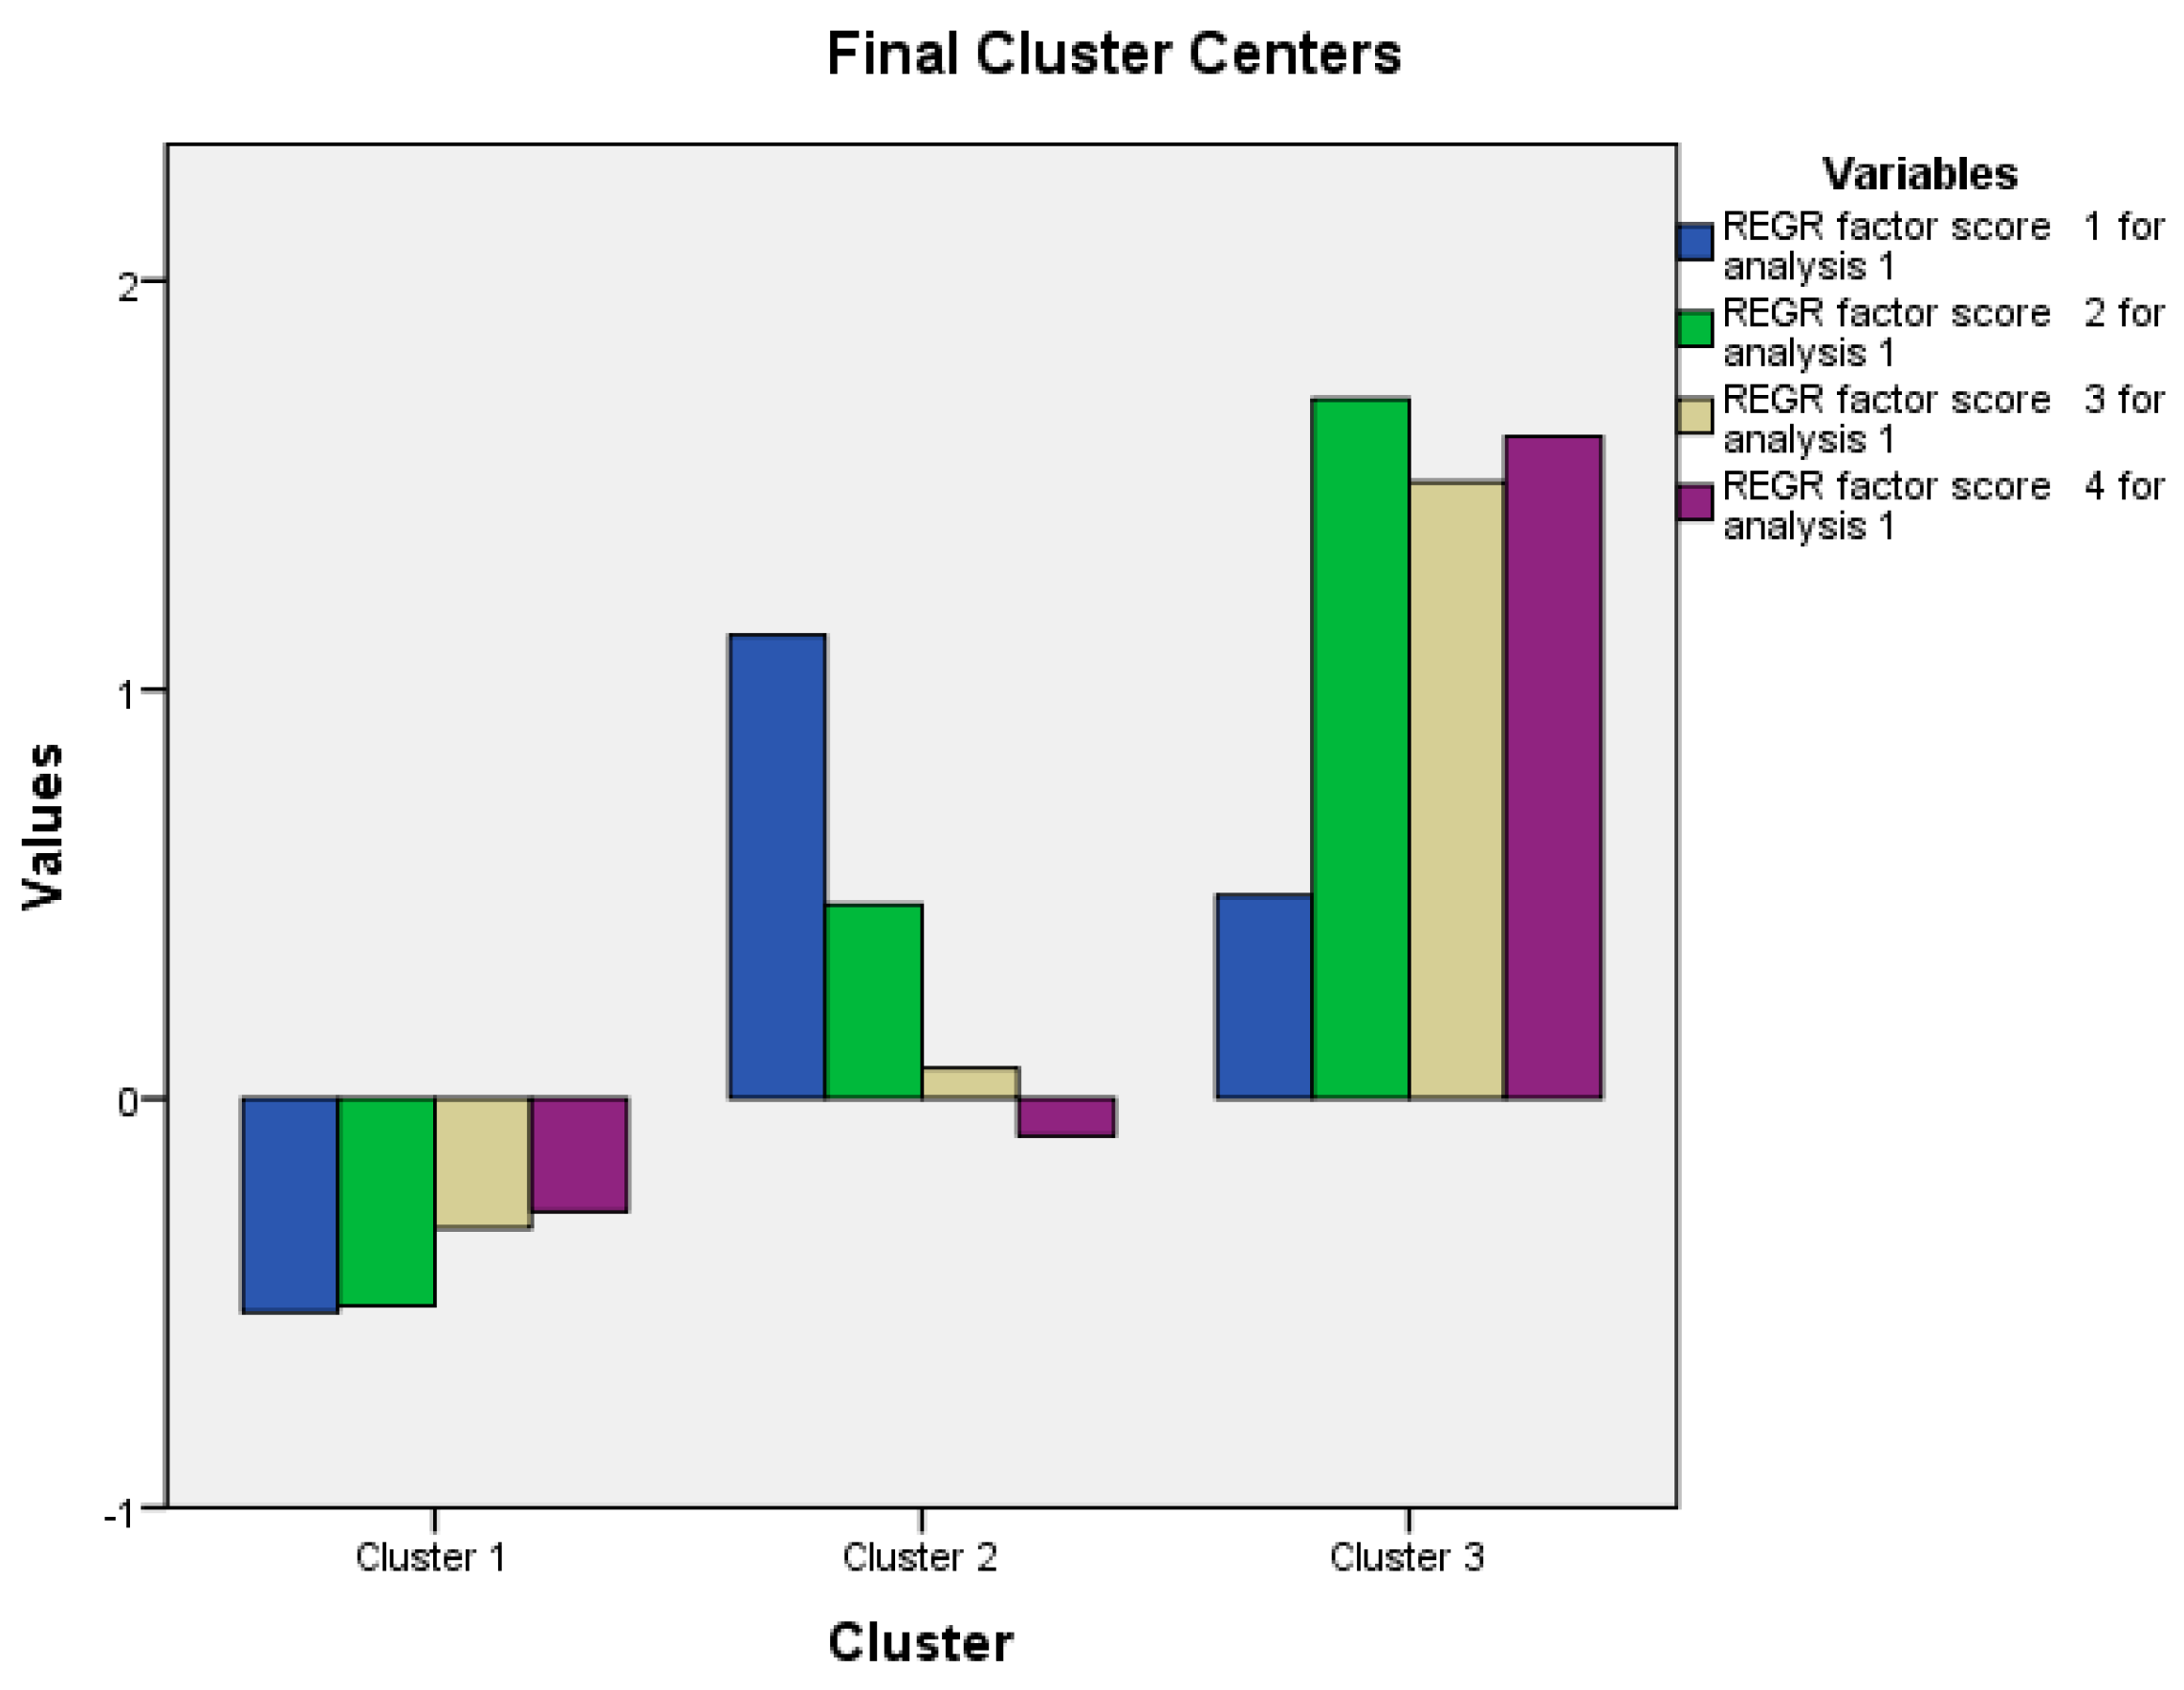
| Factor | Cluster 1 N = 146 (63.75%) | Cluster 2 N = 55 (24.02%) | Cluster 3 N = 28 (12.23%) |
|---|---|---|---|
| Factor 1: Obsessive-compulsive disorder features | −0.52 | 1.13 | 0.49 |
| Factor 2: Inappropriate eating and body-related behaviors | −0.51 | 0.47 | 1.71 |
| Factor 3: Psychological and affective traits of eating disorders | −0.32 | 0.07 | 1.51 |
| Factor 4: Perfectionism and behaviors associated with weight maintenance or weight loss | −0.28 | -0.09 | 1.62 |
| Variable | ON Categories (Based on the DOS) | p | Chi-Square Test | ||
|---|---|---|---|---|---|
| Absence of ON (N = 210) Having a Score <25 | At risk of ON (N = 13) Having a Score at 25–29 | Presence of ON (N = 7) Having a Score ≥30 | |||
| Clusters | 0.038 | 8.50 | |||
| Cluster 1 | 138 (66.0%) | 4 (20.8%) | 4 (57.1%) | ||
| Cluster 2 | 48 (23.0%) | 6 (46.2%) | 1 (14.3%) | ||
| Cluster 3 | 23 (11.0%) | 3 (23.1%) | 2 (28.6%) | ||
| Gender | 0.443 | 1.90 | |||
| Males | 160 (76.2%) | 11 (84.6%) | 4 (57.1%) | ||
| Females | 50 (23.8%) | 2 (15.4%) | 3 (42.9%) | ||
| Age | 26.66 ± 7.57 | 23.54 ± 2.33 | 27.86 ± 14.31 | 0.724 | - |
| Body Mass Index | 24.82 ± 5.35 | 23.59 ± 4.06 | 27.68 ± 5.77 | 0.257 | - |
| Cognitive restraint (TFEQ-R18) | 10.22 ± 2.80 | 12.23 ± 2.97 | 10.57 ± 1.72 | 0.042 | - |
| Uncontrolled eating (TFEQ-R18) | 9.00 ± 5.83 | 9.92 ± 3.77 | 13.57 ± 6.65 | 0.109 | - |
| Emotional eating (TFEQ-R18) | 3.37 ± 2.66 | 4.31 ± 1.97 | 4.14 ± 3.13 | 0.358 | - |
| Drive for thinness (EDI) | 3.99 ± 4.57 | 7.92 ± 5.98 | 6.57 ± 6.75 | 0.007 | - |
| Bulimia (EDI) | 2.57 ± 4.35 | 1.92 ± 2.36 | 6.28 ± 6.97 | 0.393 | - |
| Body dissatisfaction (EDI) | 8.20 ± 7.22 | 8.46 ± 8.78 | 10.14 ± 9.79 | 0.788 | - |
| Ineffectiveness (EDI) | 5.66 ± 5.06 | 3.84 ± 2.19 | 10.57 ± 8.06 | 0.017 | - |
| Perfectionism (EDI) | 4.96 ± 4.07 | 6.61 ± 2.75 | 5.43 ± 6.40 | 0.134 | - |
| Interpersonal distrust (EDI) | 4.14 ± 4.29 | 3.77 ± 3.54 | 6.86 ± 3.67 | 0.234 | - |
| Interoceptive awareness (EDI) | 4.27 ± 5.01 | 5.69 ± 4.46 | 9.00 ± 11.16 | 0.188 | - |
| Maturity fear (EDI) | 6.24 ± 5.41 | 8.08 ± 5.39 | 5.71 ± 7.50 | 0.484 | - |
| Total physical activity (IPAQ) | 2280.91 ± 2890.06 | 2843.24 ± 2465.07 | 3264.86 ± 3355.09 | 0.548 | - |
| Hoarding (OCI-R) | 3.06 ± 2.74 | 5.07 ± 2.69 | 3.71 ± 2.75 | 0.033 | - |
| Ordering (OCI-R) | 3.36 ± 2.88 | 5.23 ± 2.52 | 3.57 ± 2.57 | 0.075 | - |
| Mental neutralizing (OCI-R) | 1.40 ± 2.32 | 2.92 ± 3.33 | 2.43 ± 2.07 | 0.05 | - |
| Washing (OCI-R) | 2.18 ± 2.38 | 3.38 ± 2.87 | 3.00 ± 2.24 | 0.161 | - |
| Obsessing (OCI-R) | 1.99 ± 2.65 | 3.23 ± 2.92 | 3.57 ± 2.99 | 0.093 | - |
| Checking (OCI-R) | 3.70 ± 3.10 | 4.69 ± 3.25 | 4.86 ± 3.29 | 0.357 | - |
| Total OCI-R | 15.70 ± 12.44 | 24.54 ± 13.80 | 21.14 ± 11.00 | 0.029 | - |
| Variable | DOS Total Score | p |
|---|---|---|
| Clusters | 0.003 | |
| Cluster 1 | 16.86 ± 5.02 | |
| Cluster 2 | 18.40 ± 5.03 | |
| Cluster 3 | 20.36 ± 5.51 | |
| Gender | 0.111 | |
| Males | 17.07 ± 6.00 | |
| Females | 17.85 ± 4.91 | |
| Age | 0.001 | 0.997 |
| Body Mass Index | 0.057 | 0.387 |
| Cognitive restraint (TFEQ-R18) | 0.395 | <0.001 |
| Uncontrolled eating (TFEQ-R18) | 0.251 | <0.001 |
| Emotional eating (TFEQ-R18) | 0.275 | <0.001 |
| Drive for thinness (EDI) | 0.350 | <0.001 |
| Bulimia (EDI) | 0.184 | 0.005 |
| Body dissatisfaction (EDI) | 0.089 | 0.179 |
| Ineffectiveness (EDI) | 0.066 | 0.317 |
| Perfectionism (EDI) | 0.070 | 0.289 |
| Interpersonal distrust (EDI) | 0.096 | 0.147 |
| Interoceptive awareness (EDI) | 0.166 | 0.012 |
| Maturity fear (EDI) | 0.049 | 0.464 |
| Total physical activity (IPAQ) | -0.043 | 0.515 |
| Hoarding (OCI-R) | 0.129 | 0.050 |
| Ordering (OCI-R) | 0.218 | 0.001 |
| Mental neutralizing (OCI-R) | 0.213 | 0.001 |
| Washing (OCI-R) | 0.149 | 0.023 |
| Obsessing (OCI-R) | 0.217 | 0.001 |
| Checking (OCI-R) | 0.218 | 0.001 |
| Total OCI-R | 0.253 | <0.001 |
| Model 1: At Risk of ON vs. Absence of ON | |||
| Variable | p | aOR | 95% CI |
| Cognitive restraint (TFEQ-R18) | 0.333 | 1.12 | 0.89–1.42 |
| Drive for thinness (EDI) | 0.011 | 1.17 | 1.04–1.32 |
| Ineffectiveness (EDI) | 0.017 | 0.74 | 0.58–0.95 |
| Hoarding (OCI-R) | 0.024 | 1.30 | 1.04–1.64 |
| Model 2: Presence of ON vs. Absence of ON | |||
| Variable | p | aOR | 95% CI |
| Cognitive restraint (TFEQ-R18) | 0.995 | 0.99 | 0.74–1.34 |
| Drive for thinness (EDI) | 0.862 | 1.02 | 0.84–1.23 |
| Ineffectiveness (EDI) | 0.111 | 1.12 | 0.98–1.28 |
| Hoarding (OCI-R) | 0.808 | 0.97 | 0.72–1.29 |
| Model 1: At Risk of ON vs. Absence of ON | |||
| Variable | p | aOR | 95% CI |
| Factor 1: Obsessive-compulsive disorder features | 0.017 | 1.88 | 1.12–3.16 |
| Factor 2: Inappropriate eating and body-related behavior | 0.848 | 0.94 | 0.47–1.86 |
| Factor 3: Psychological and affective traits of eating disorder | 0.259 | 0.66 | 0.32–1.36 |
| Factor 4: Perfectionism and behaviors associated with weight maintenance or weight loss | 0.02 | 2.05 | 1.12–3.76 |
| Model 2: Presence of ON vs. absence of ON | |||
| Variable | p | aOR | 95% CI |
| Factor 1: Obsessive-compulsive disorder features | 0.727 | 1.15 | 0.53–2.50 |
| Factor 2: Inappropriate eating and body-related behavior | 0.471 | 1.39 | 0.57–3.38 |
| Factor 3: Psychological and affective traits of eating disorder | 0.404 | 1.38 | 0.65–2.91 |
| Factor 4: Perfectionism and behaviors associated with weight maintenance or weight loss | 0.913 | 0.95 | 0.39–2.30 |
| Model 1: At Risk of ON vs. Absence of ON | |||
| Variable | p | aOR | 95% CI |
| Belonging to cluster 2 (yes vs. no) | 0.028 | 4.31 | 1.17–15.94 |
| Belonging to cluster 3 (yes vs. no) | 0.059 | 4.50 | 0.95–21.43 |
| Model 2: Presence of ON vs. Absence of ON | |||
| Variable | p | aOR | 95% CI |
| Belonging to cluster 2 (yes vs. no) | 0.770 | 0.72 | 0.08–6.59 |
| Belonging to cluster 3 (yes vs. no) | 0.220 | 3.00 | 0.52–17.33 |
| Variable | UB | SB | p | 95% CI |
|---|---|---|---|---|
| Drive for thinness | 0.22 | 0.21 | 0.002 | 0.08–0.36 |
| Cognitive restraint | 0.45 | 0.24 | <0.001 | 0.21–0.68 |
| Mental neutralizing | 0.39 | 0.18 | 0.004 | 0.13–0.65 |
Publisher’s Note: MDPI stays neutral with regard to jurisdictional claims in published maps and institutional affiliations. |
© 2020 by the authors. Licensee MDPI, Basel, Switzerland. This article is an open access article distributed under the terms and conditions of the Creative Commons Attribution (CC BY) license (http://creativecommons.org/licenses/by/4.0/).
Share and Cite
Brytek-Matera, A.; Staniszewska, A.; Hallit, S. Identifying the Profile of Orthorexic Behavior and “Normal” Eating Behavior with Cluster Analysis: A Cross-Sectional Study among Polish Adults. Nutrients 2020, 12, 3490. https://doi.org/10.3390/nu12113490
Brytek-Matera A, Staniszewska A, Hallit S. Identifying the Profile of Orthorexic Behavior and “Normal” Eating Behavior with Cluster Analysis: A Cross-Sectional Study among Polish Adults. Nutrients. 2020; 12(11):3490. https://doi.org/10.3390/nu12113490
Chicago/Turabian StyleBrytek-Matera, Anna, Anna Staniszewska, and Souheil Hallit. 2020. "Identifying the Profile of Orthorexic Behavior and “Normal” Eating Behavior with Cluster Analysis: A Cross-Sectional Study among Polish Adults" Nutrients 12, no. 11: 3490. https://doi.org/10.3390/nu12113490
APA StyleBrytek-Matera, A., Staniszewska, A., & Hallit, S. (2020). Identifying the Profile of Orthorexic Behavior and “Normal” Eating Behavior with Cluster Analysis: A Cross-Sectional Study among Polish Adults. Nutrients, 12(11), 3490. https://doi.org/10.3390/nu12113490