Copper and Copper/Zinc Ratio in a Series of Cystic Fibrosis Patients

 ,
, 

Abstract
1. Introduction
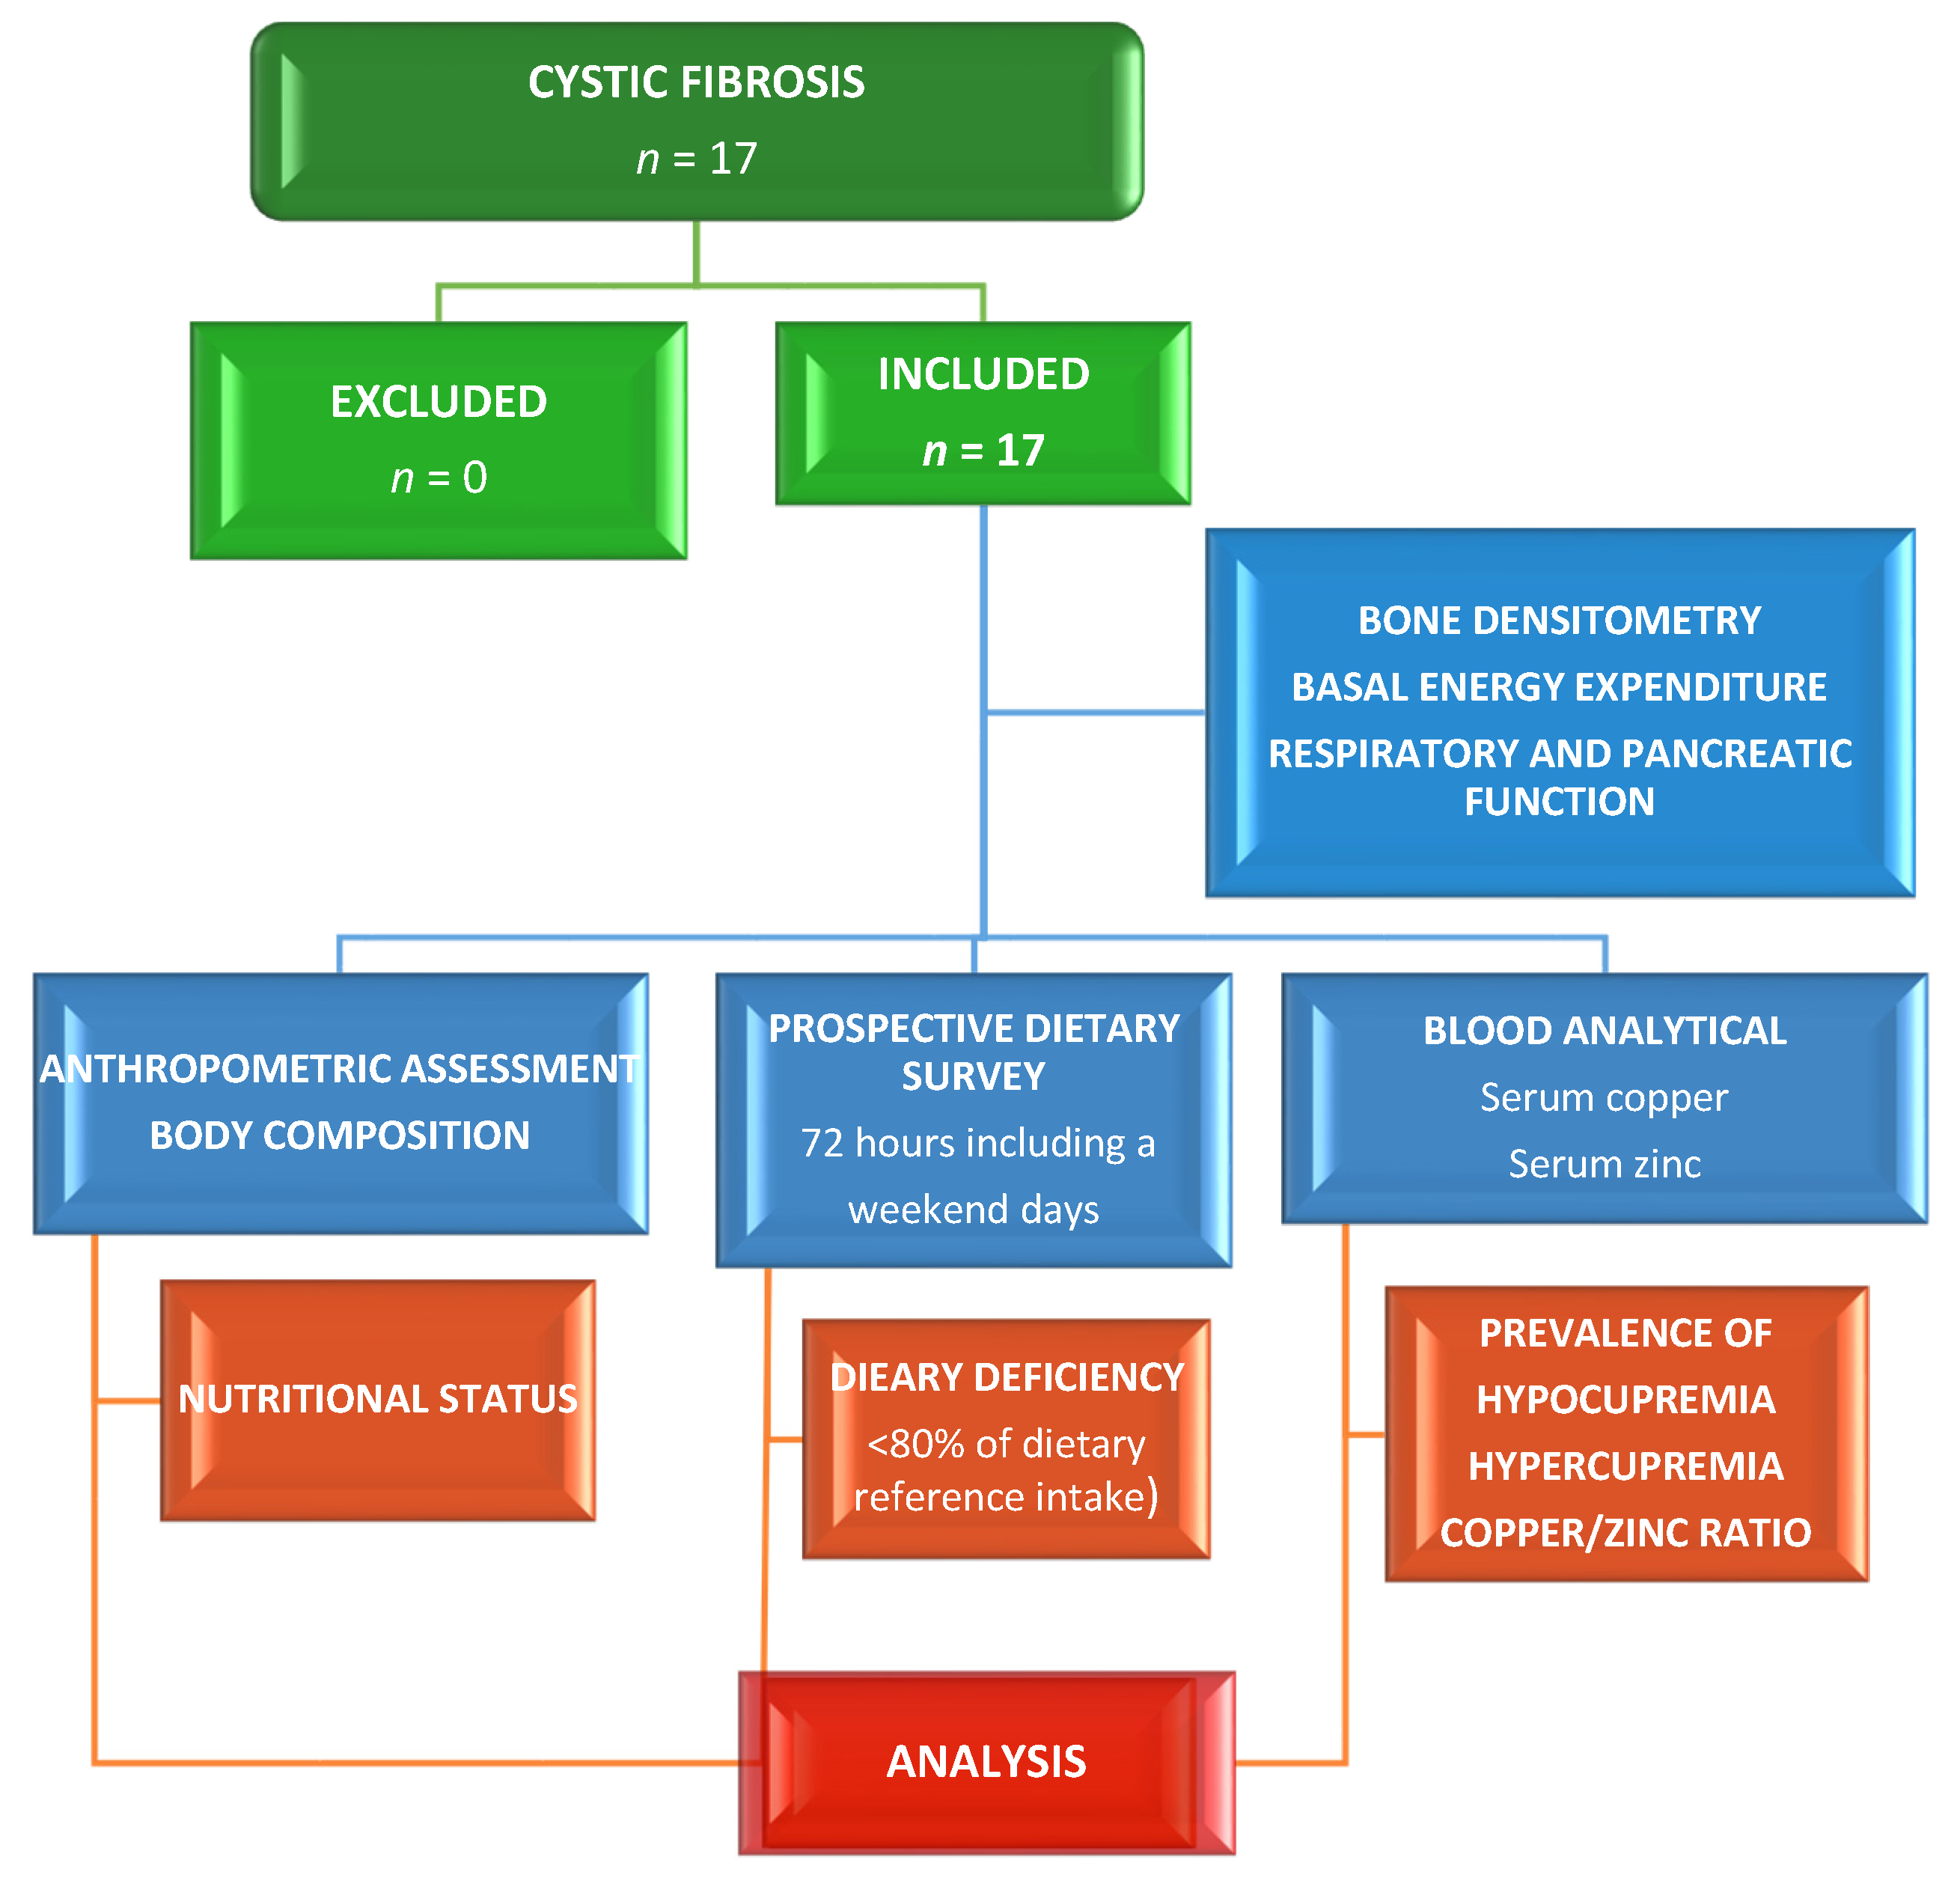
2. Materials and Methods
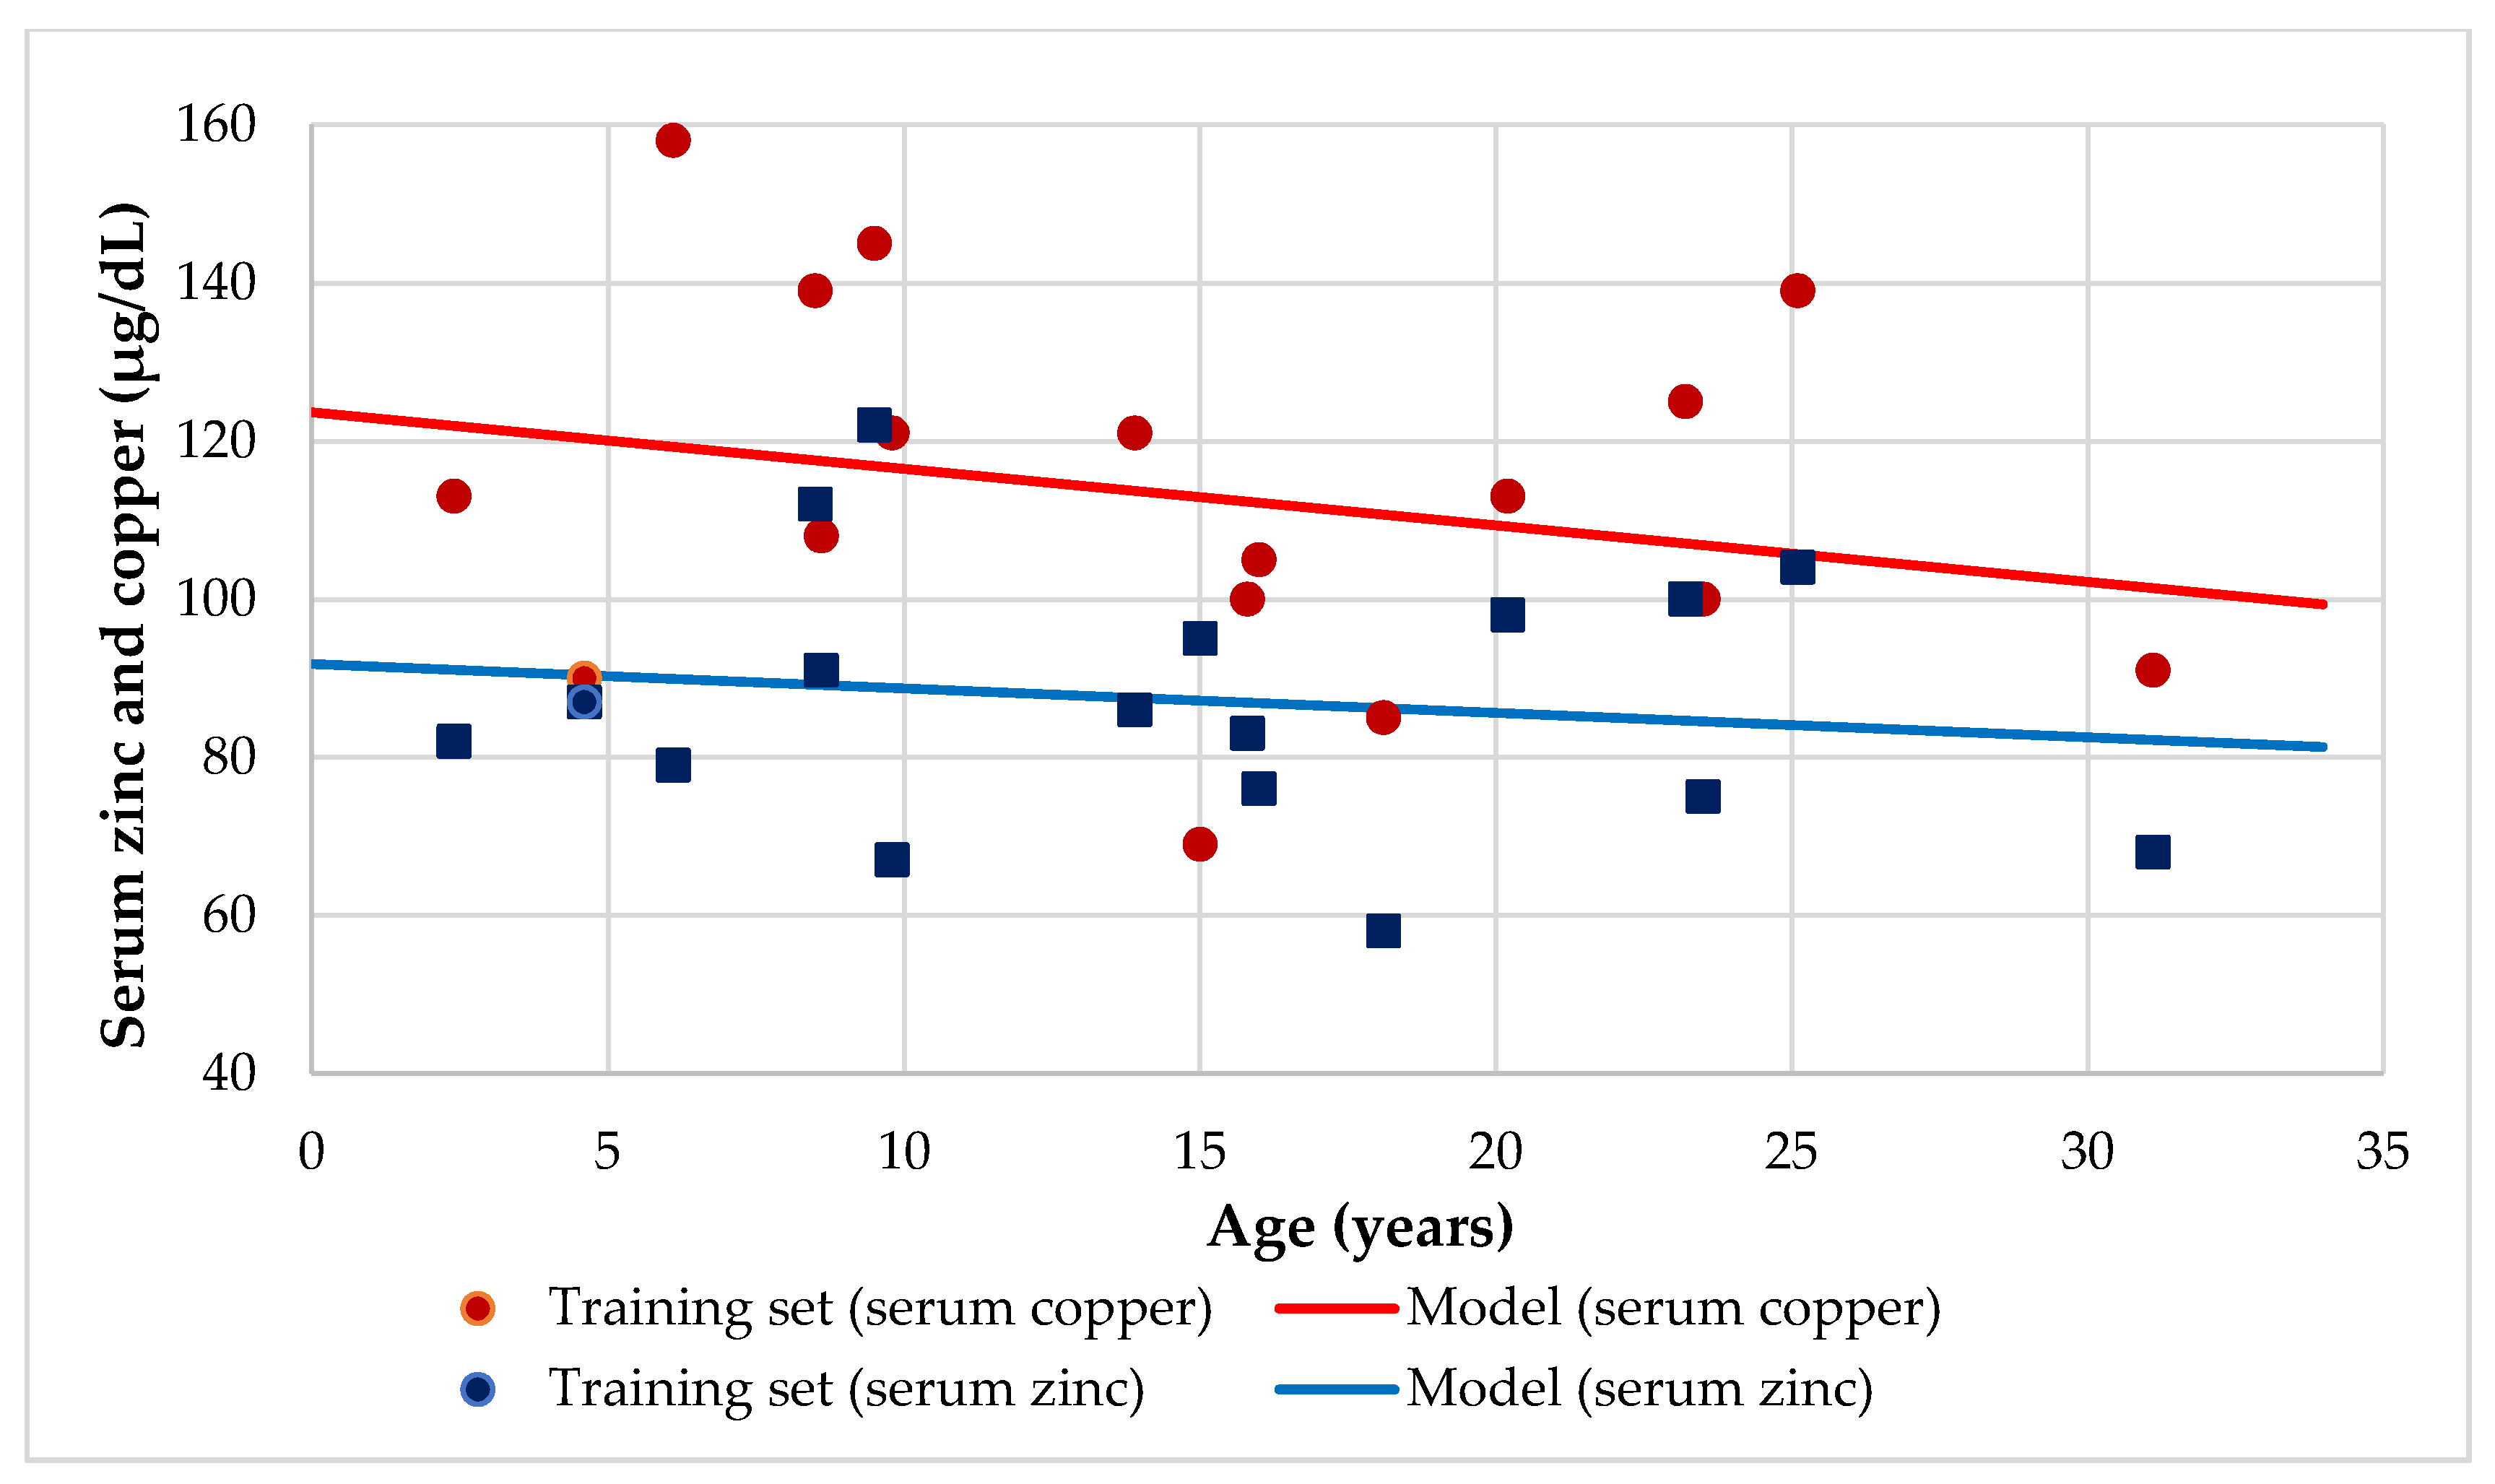
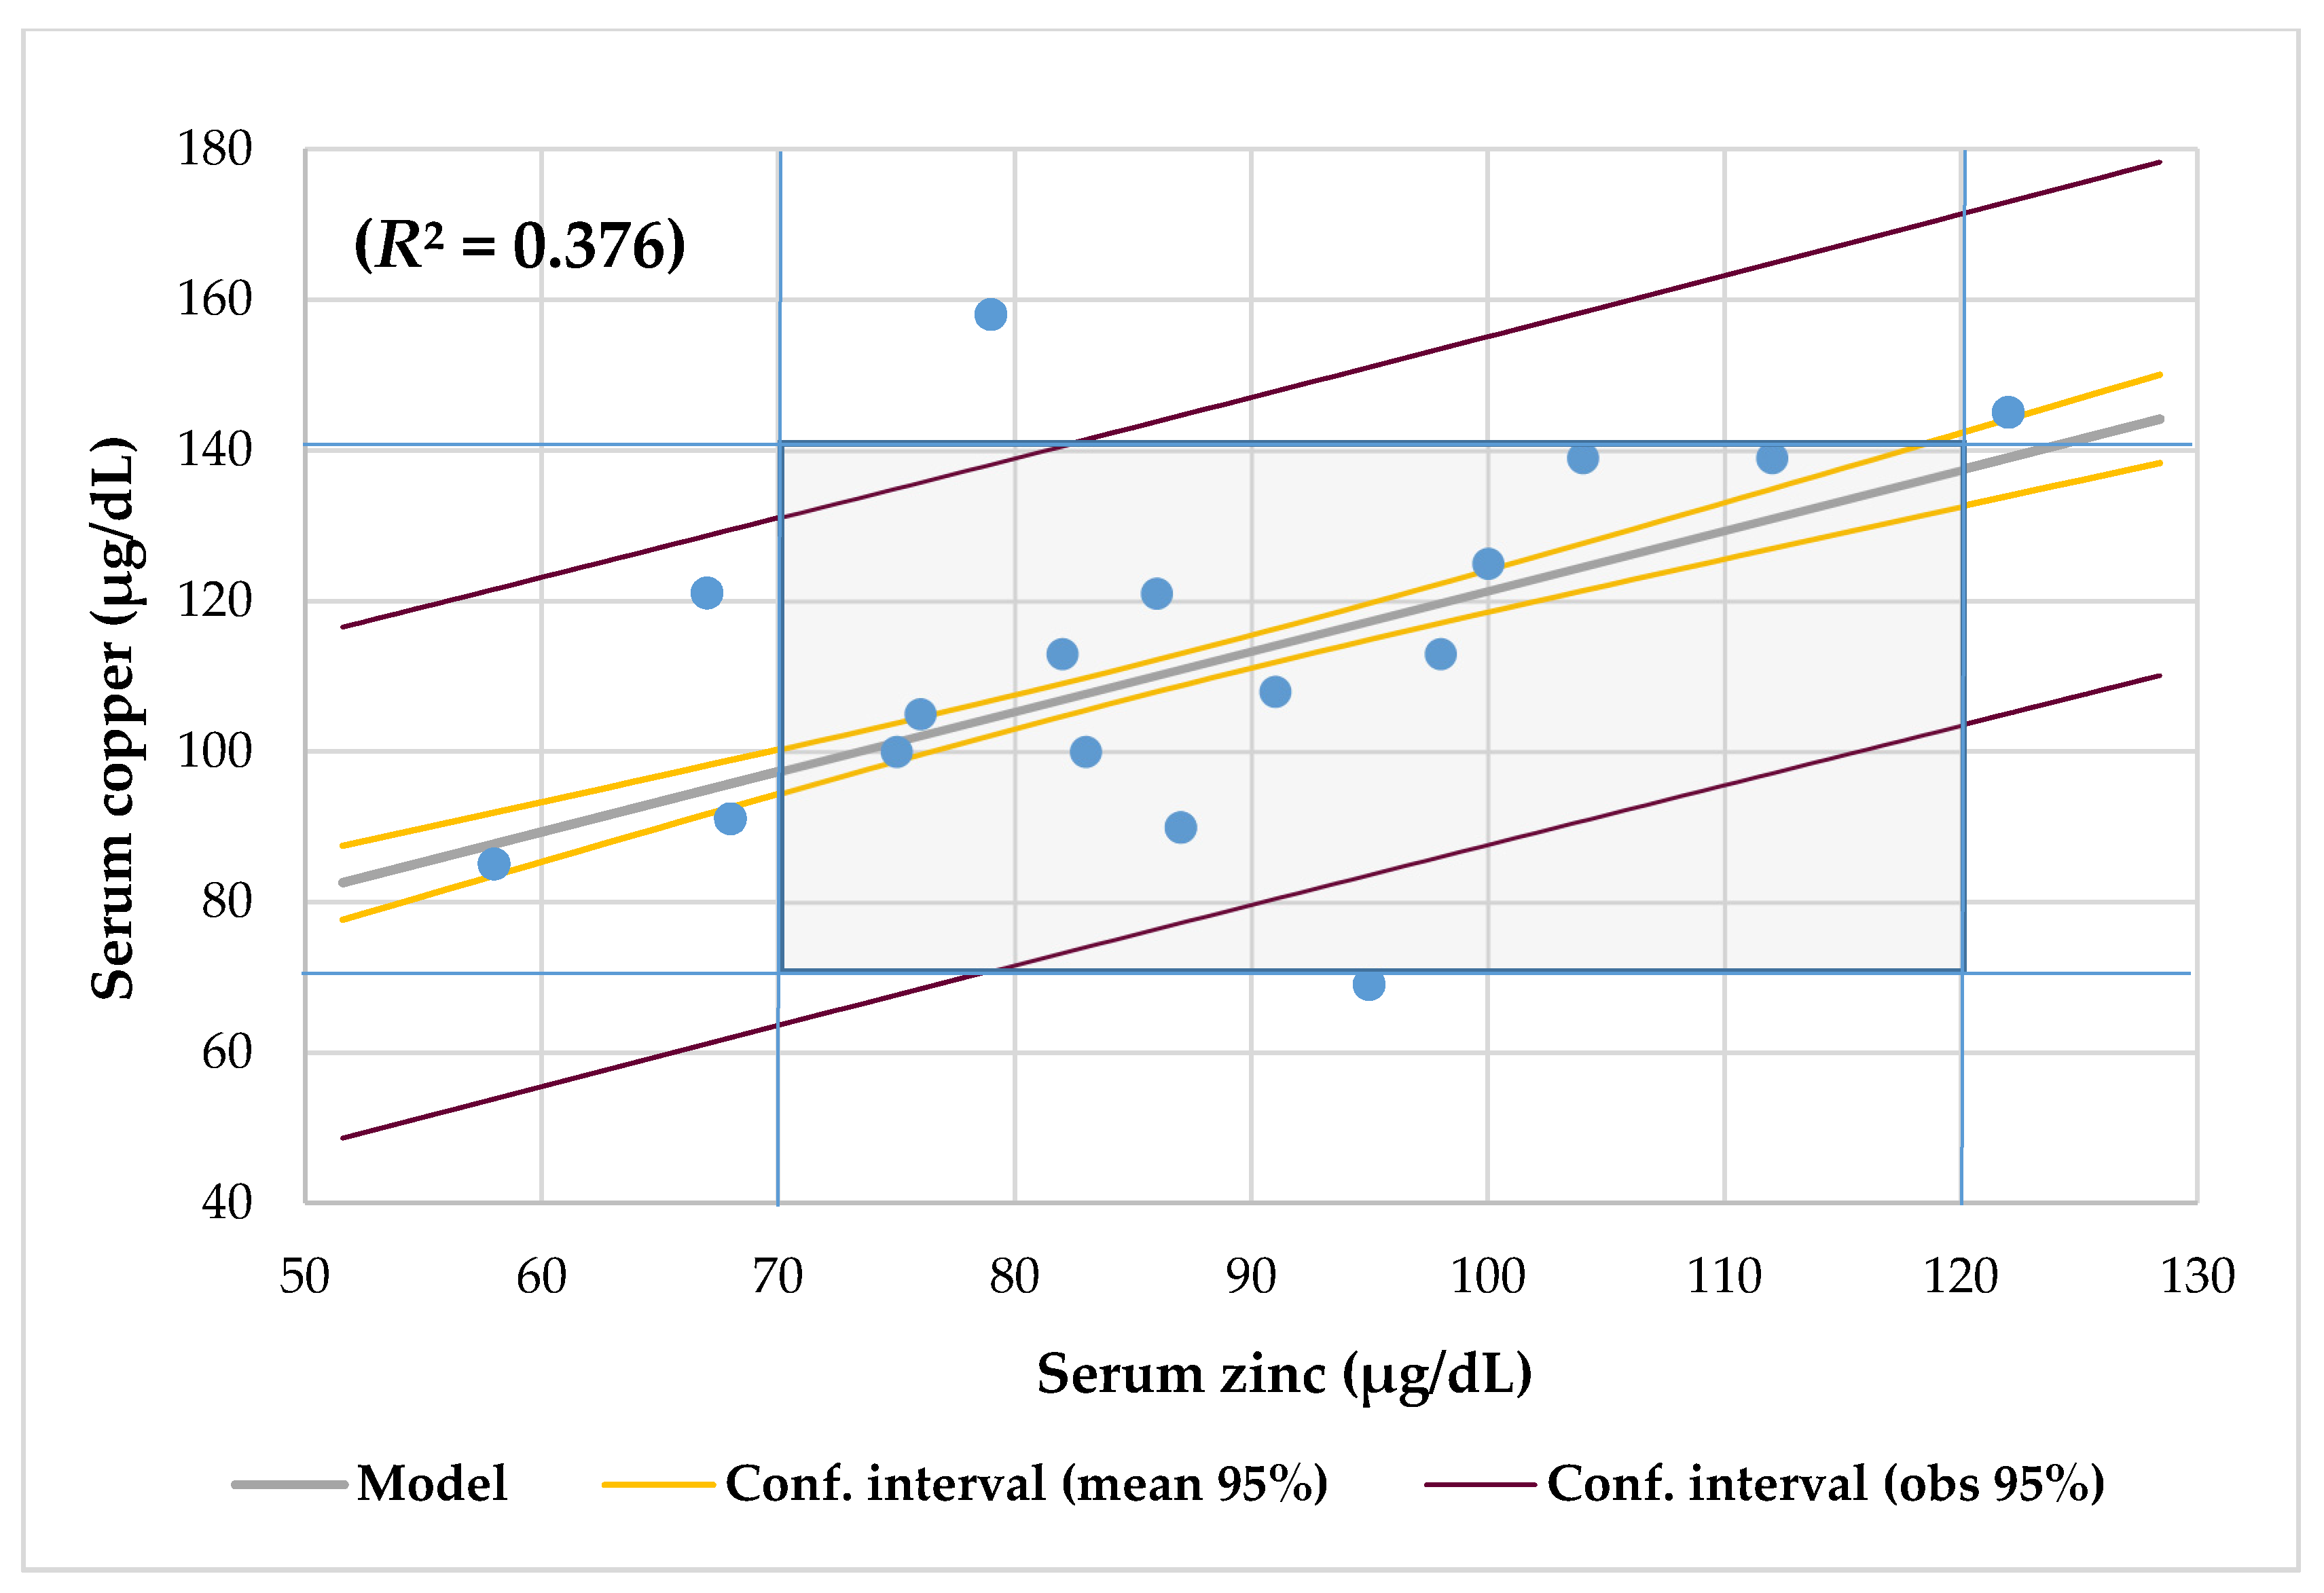
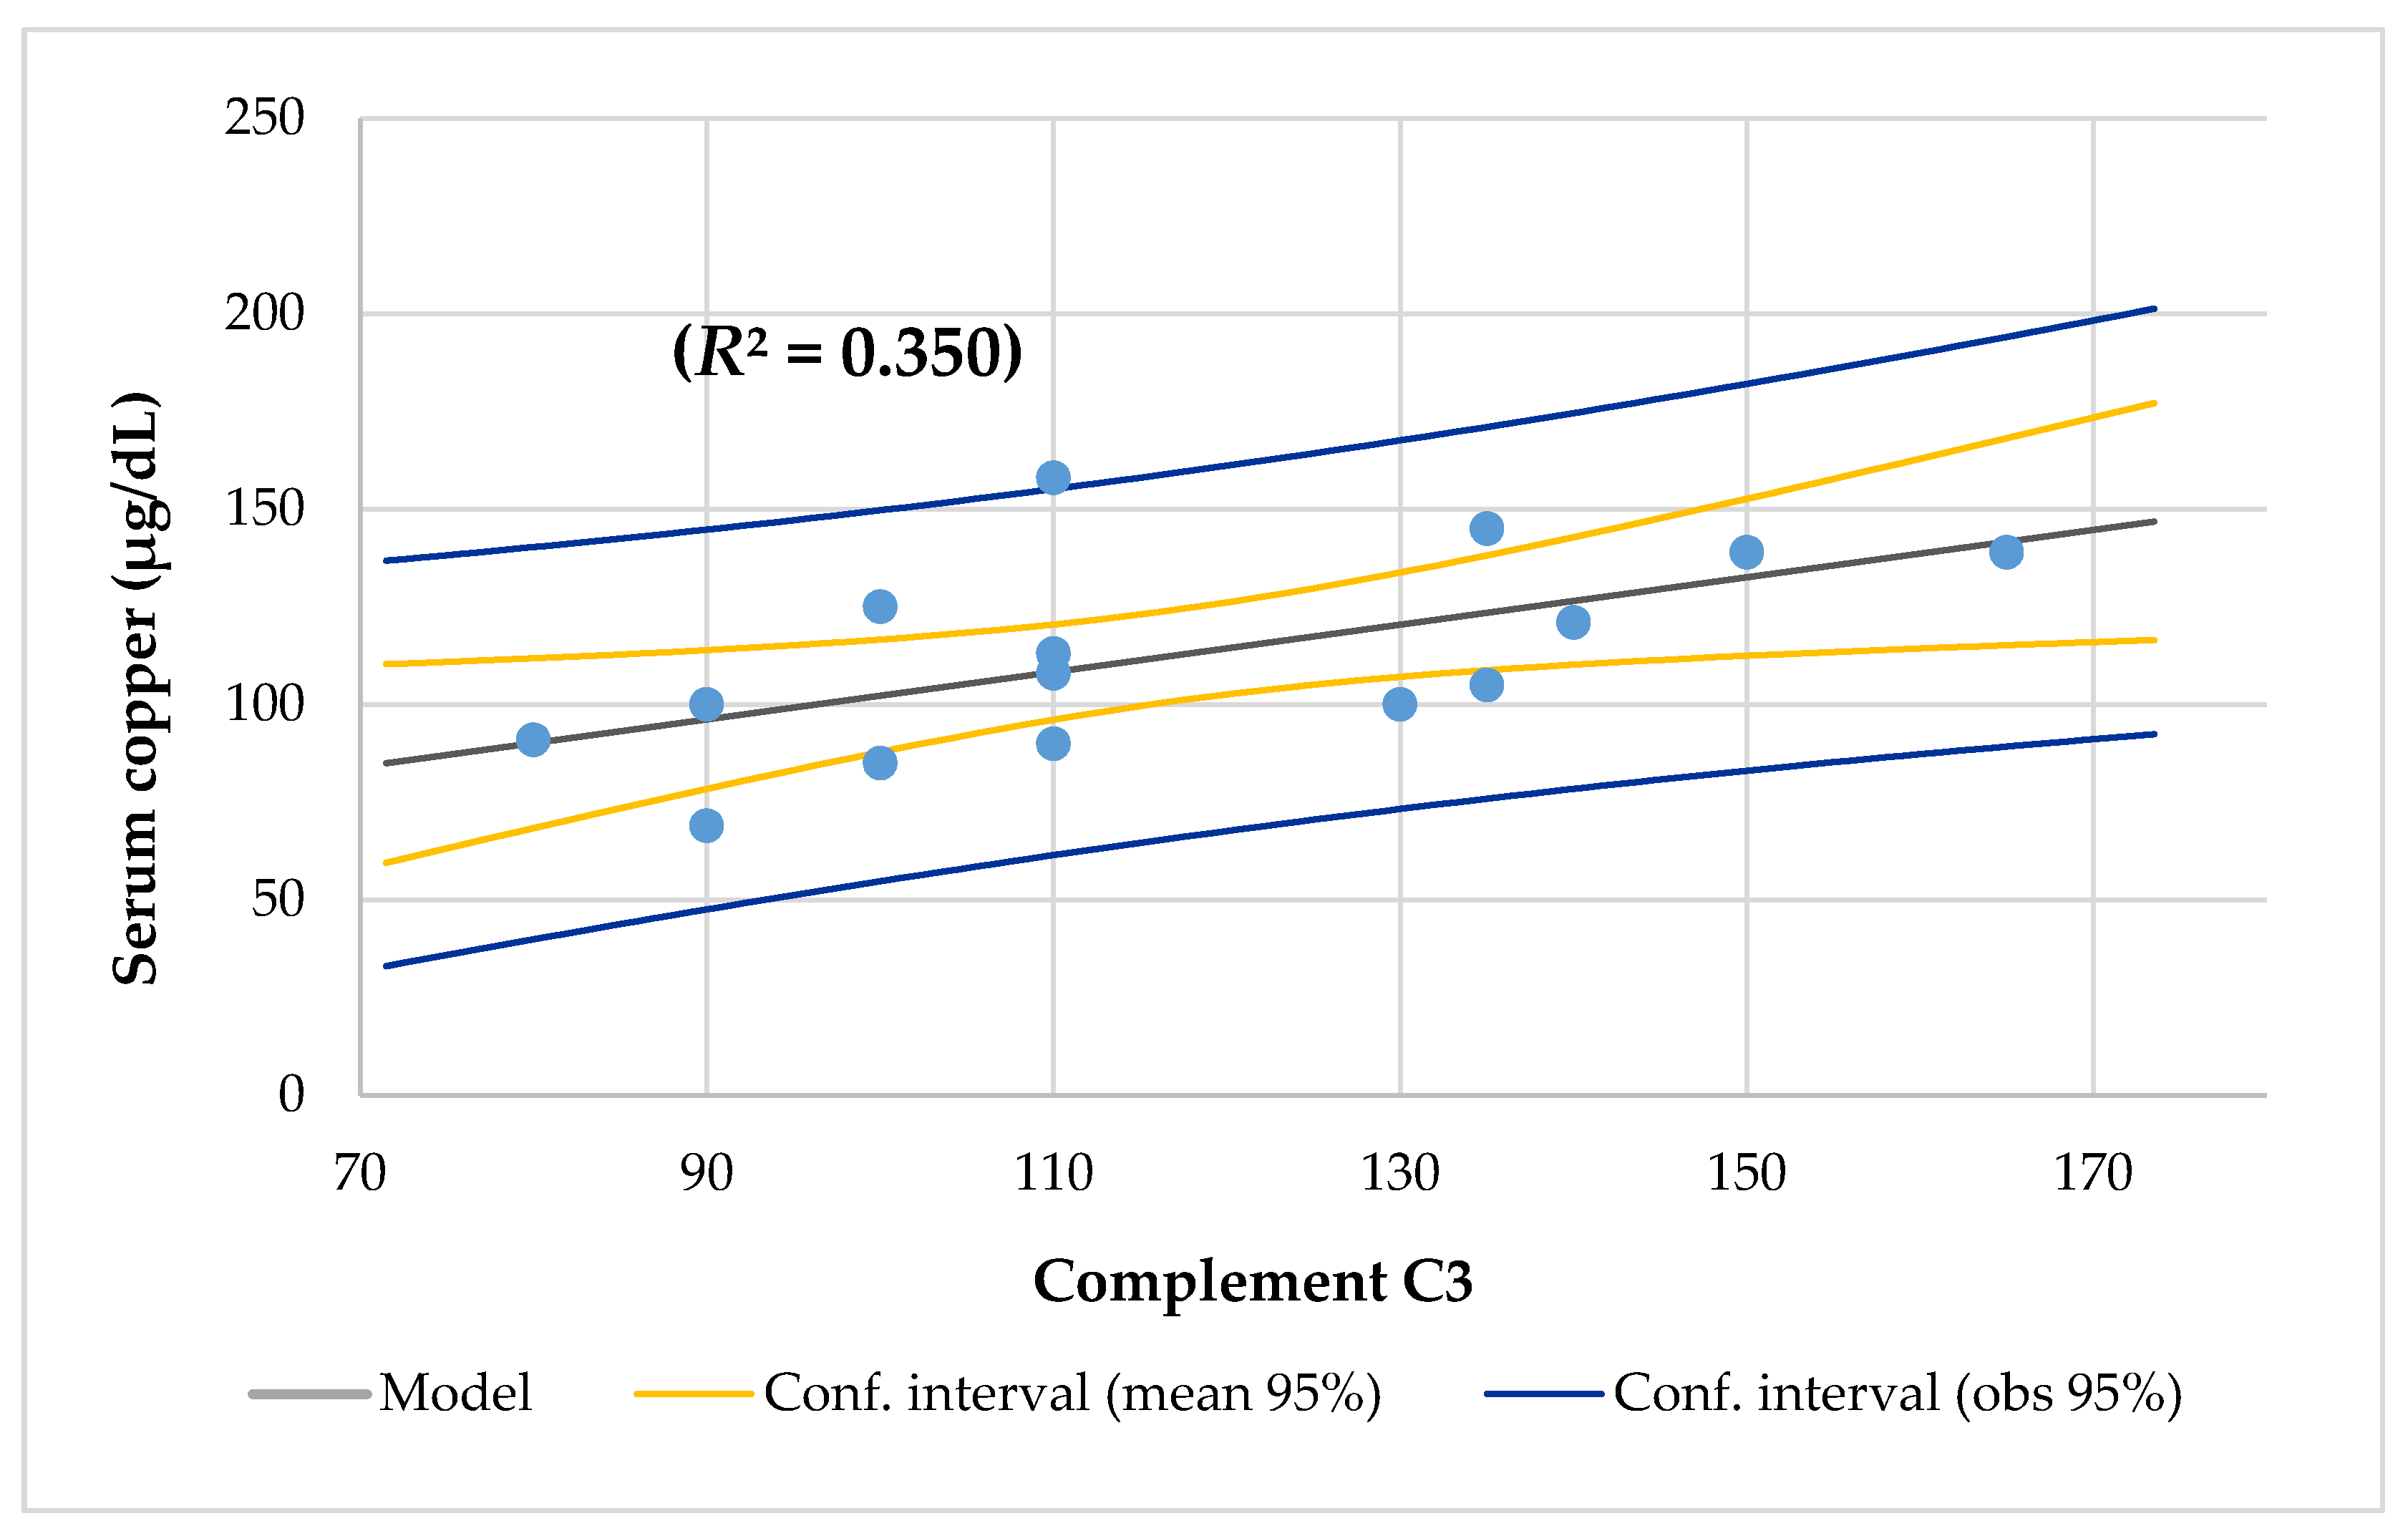
3. Results
4. Discussion
Copper/Zinc Ratio
5. Conclusions
Author Contributions
Funding
Acknowledgments
Conflicts of Interest
References
- De Boeck, K. Cystic fibrosis in the year 2020: A disease with a new face. Acta Paediatr. 2020, 109, 893–899. [Google Scholar] [CrossRef]
- Boëlle, P.Y.; Debray, D.; Guillot, L.; Clement, A.; Corvol, H.; French, C.F. Modifier Gene Study Investigators. Cystic Fibrosis Liver Disease: Outcomes and Risk Factors in a Large Cohort of French Patients. Hepatology 2019, 69, 1648–1656. [Google Scholar] [CrossRef]
- Athanazio, R.A.; Filho, L.V.R.F.S.; Vergara, A.A.; Ribeiro, A.F.; Riedi, C.A.; Procianoy, E.D.F.A.; Adde, F.V.; Reis, F.J.C.; Ribeiro, J.D.; Torres, L.A.; et al. Grupo de Trabalho das Diretrizes Brasileiras de Diagnóstico e Tratamento da Fibrose Cística. Brazilian guidelines for the diagnosis and treatment of cystic fibrosis. J. Bras. Pneumol. 2017, 43, 219–245. [Google Scholar] [CrossRef]
- Chakrabarty, B.; Kabra, S.K.; Gulati, S.; Toteja, G.S.; Lodha, R.; Kabra, M.; Pandey, R.M.; Srivastava, A. Peripheral neuropathy in cystic fibrosis: A prevalence study. J. Cyst. Fibros. 2013, 12, 754–760. [Google Scholar] [CrossRef]
- Turck, D.; Braegger, C.P.; Colombo, C.; Declercq, D.; Morton, A.; Pancheva, R.; Robberecht, E.; Stern, M.; Strandvik, B.; Wolfe, S.; et al. ESPEN-ESPGHAN-ECFS guidelines on nutrition care for infants, children, and adults with cystic fibrosis. Clin. Nutr. 2016, 35, 557–577. [Google Scholar] [CrossRef] [PubMed]
- Gray, R.D.; Duncan, A.; Noble, D.; Imrie, M.; O’Reilly, D.S.; Innes, A.; Porteous, D.; Greening, A.P.; Boyd, A.C. Sputum trace metals are biomarkers of inflammatory and suppurative lung disease. Chest 2010, 137, 635–641. [Google Scholar] [CrossRef]
- Stoltz, D.A.; Meyerholz, D.K.; Welsh, M.J. Origins of cystic fibrosis lung disease. N. Engl. J. Med. 2015, 372, 351–362. [Google Scholar] [CrossRef] [PubMed]
- Wilschanski, M.; Novak, I. The cystic fibrosis of exocrine pancreas. Cold Spring Harb. Perspect Med. 2013, 3, a009746. [Google Scholar] [CrossRef] [PubMed]
- Declercq, D.; Van Meerhaeghe, S.; Marchand, S.; Van Braeckel, E.; Van Daele, S.; De Baets, F.; Van Biervliet, S. The nutritional status in CF: Being certain about the uncertainties. Clin. Nutr. 2019, 29, 15–21. [Google Scholar] [CrossRef]
- Moheet, A.; Moran, A. CF-related diabetes: Containing the metabolic miscreant of cystic fibrosis. Pediatr. Pulmonol. 2017, 52, S37–S43. [Google Scholar] [CrossRef]
- Berg, K.H.; Ryom, L.; Faurholt-Jepsen, D.; Pressler, T.; Katzenstein, T.L. Prevalence and characteristics of chronic kidney disease among Danish adults with cystic fibrosis. J. Cyst. Fibros. 2017, 17, 478–483. [Google Scholar] [CrossRef] [PubMed]
- Li, L.; Somerset, S. Digestive system dysfunction in cystic fibrosis: Challenges for nutrition therapy. Dig. Liver. Dis. 2014, 46, 865–874. [Google Scholar] [CrossRef] [PubMed]
- Siwamogsatham, O.; Dong, W.; Binongo, J.N.; Chowdhury, R.; Alvarez, J.A.; Feinman, S.J.; Enders, J.; Tangpricha, V. Relationship between fat-soluble vitamin supplementation and blood concentrations in adolescent and adult patients with cystic fibrosis. Nutr. Clin. Pract. 2014, 29, 491–497. [Google Scholar] [CrossRef] [PubMed]
- Oliver, A.; Alarcon, T.; Caballero, E.; Cantón, R. Microbiological diagnosis of bronchopulmonary colonization-infection in cystic fibrosis. Enferm. Infect. Microbiol. Clin. 2009, 27, 89–104. [Google Scholar] [CrossRef]
- Damphousse, V.; Mailhot, M.; Berthiaume, Y.; Rabasa-Lhoret, R.; Mailhot, G. Plasma zinc in adults with cystic fibrosis: Correlations with clinical outcomes. J. Trace Elem. Med. Biol. 2014, 28, 60–64. [Google Scholar] [CrossRef]
- Grubman, A.; White, A.R. Copper and Molecular Aspects of Cell Signaling. In Molecular, Genetic, and Nutritional Aspects of Major and Trace Minerals; Collins, J.F., Ed.; Molecular Nutrition; Elsevier: London, UK, 2016; pp. 85–99. [Google Scholar] [CrossRef]
- Myint, Z.W.; Oo, T.H.; Thein, K.Z.; Tun, A.M.; Saeed, H. Copper deficiency anemia: Review article. Ann. Hematol. 2018, 97, 1527–1534. [Google Scholar] [CrossRef]
- Livingstone, C. Review of Copper Provision in the Parenteral Nutrition of Adults [Formula: See text]. Nutr. Clin. Pract. 2017, 32, 153–165. [Google Scholar] [CrossRef]
- Domellöf, M.; Szitanyi, P.; Simchowitz, V.; Franz, A.; Mimouni, F.; ESPGHAN/ESPEN/ESPR/CSPEN working group on pediatric parenteral nutrition. ESPGHAN/ESPEN/ESPR/CSPEN guidelines on pediatric parenteral nutrition: Iron and trace minerals. Clin Nutr. 2018, 37 Pt B, 2354–2359. [Google Scholar] [CrossRef]
- Danks, D.M. Copper deficiency in humans. Annu. Rev. Nutr. 1988, 8, 235–257. [Google Scholar] [CrossRef]
- Uauy, R.; Olivares, M.; Gonzalez, M. Essentiality of copper in humans. Am. J. Clin. Nutr. 1998, 67, 952S–959S. [Google Scholar] [CrossRef]
- Halfdanarson, T.R.; Kumar, N.; Hogan, W.J.; Murray, J.A. Copper deficiency in celiac disease. J. Clin. Gastroenterol. 2009, 43, 162–164. [Google Scholar] [CrossRef] [PubMed]
- Kumar, N. Nutrients and Neurology. Continuum (Minneap Minn). Neurol. Syst. Dis. 2017, 23, 822–861. [Google Scholar] [CrossRef]
- Wazir, S.M.; Ghobrial, I. Copper deficiency, a new triad: Anemia, leucopenia, and myeloneuropathy. J. Community Hosp. Intern. Med. Perspect. 2017, 7, 265–268. [Google Scholar] [CrossRef] [PubMed]
- Prohaska, J.R. Copper. In Present Knowledge in Nutrition, 9th ed.; Bowman, B.A., Russell, R.M., Eds.; ILSI Press: Washington, DC, USA, 2006; pp. 458–470. [Google Scholar]
- Emsley, J. Nature’s Building Blocks: An A-Z Guide to the Elements; Oxford University Press: Oxford, UK, 2003. [Google Scholar]
- Lonnerdal, B. Copper nutrition during infancy and childhood. Am. J. Clin. Nutr. 1998, 67, 1046S–1053S. [Google Scholar] [CrossRef] [PubMed]
- Institute of Medicine (US) Panel on Micronutrients. Dietary Reference Intakes for Vitamin A, Vitamin K, Arsenic, Boron, Chromium, Copper, Iodine, Iron, Manganese, Molybdenum, Nickel, Silicon, Vanadium, and Zinc; National Academies Press (US): Washington, DC, USA, 2001; Volume 7. Available online: https://www.ncbi.nlm.nih.gov/books/NBK222312/ (accessed on 25 July 2020).
- Kerem, E.; Viviani, L.; Zolin, A.; MacNeill, S.; Hatziagorou, E.; Ellemunter, H.; Drevinek, P.; Gulmans, V.; Krivec, U.; Olesen, H. ECFS Patient Registry Steering Group. Factors associated with FEV1 decline in cystic fibrosis: Analysis of the ECFS patient registry. Eur. Respir. J. 2014, 43, 125–133. [Google Scholar] [CrossRef] [PubMed]
- Monge, M.F.E.; Barrado, E.; Vicente, C.A.; del Río, M.P.R.; de Miguelsanz, J.M.M. Zinc Nutritional Status in Patients with Cystic Fibrosis. Nutrients 2019, 11, 150. [Google Scholar] [CrossRef] [PubMed]
- Frisancho, A.R. New norms of upper limb fat and muscle areas for assessment of nutritional status. Am. J. Clin. Nutr. 1981, 34, 2540–2545. [Google Scholar] [CrossRef]
- Hernández, M.; Sobradillo, B.; Aguirre, A.; Aresti, U.; Bilbao, A.; Fernández-Ramos, C.; Lizárraga, A.; Lorenzo, H.; Madariaga, L.; Rica, I. Curvas y Tablas de Crecimiento (Estudios Longitudinal y Transversal); Fundación Faustino Orbegozo: Bilbao, Spain, 1985. [Google Scholar]
- Martínez, M.J.; Redondo, D.; Conde, F.; Redondo, P.; Franch, M.A. Gráficas Longitudinales de Velocidad de Conducción Media de Ultrasonidos en Falanges. Estudio Nutricional de Castilla y León; de CyL, J., Ed.; Junta Castilla y León: Valladolid, Spain, 2009. [Google Scholar]
- Escobedo, M.F.; Barrado, E.; Alonso, C.; de Miguelsanz, J.M.M. Comparison study between colorimetric method and flame atomic absorption spectrophotometry in serum zinc status. Nutr. Clin. Diet Hosp. 2018, 38, 128–133. [Google Scholar] [CrossRef]
- Shenkin, A. Vitamins and trace elements. In Textbook of Clinical Chemistry and Molecular Diagnosis, 4th ed.; Bertis, S.A., Ashvud, E.R., Bruns, D., Eds.; Saunders Elsevier: Philadelphia, PA, USA, 2006. [Google Scholar]
- Dizdar, O.S.; Baspınar, O.; Kocer, D.; Dursun, Z.B.; Avcı, D.; Karakükcü, C.; Çelik, İ.; Gundogan, K. Nutritional Risk, Micronutrient Status and Clinical Outcomes: A Prospective Observational Study in an Infectious Disease Clinic. Nutrients 2016, 8, 124. [Google Scholar] [CrossRef]
- Kaslow, J.E. Copper/Zinc Imbalance. Medical Board of California. Available online: http://www.mbc.ca.gov (accessed on 15 August 2020).
- Verdú, J.M.; Diaz, J.G. Nutriber. V. 1.0; Fundación Universitaria Iberoamericana: Barcelona, Spain, 2005. [Google Scholar]
- Boat, T.F.; Acton, J.D. Cystic fibrosis. In Nelson Textbook of Pediatrics, 18th ed.; Kliegman, R.M., Jenson, H.B., Behrman, R.E., Stanton, B.F., Eds.; Saunders Elsevier: Philadelphia, PA, USA, 2008; Volume 2. [Google Scholar]
- Tangpricha, V.; Kelly, A.; Stephenson, A.; Maguiness, K.; Enders, J.; Robinson, K.A.; Marshall, B.C.; Borowitz, D. Cystic Fibrosis Foundation Vitamin D Evidence-Based Review Committee. An update on the screening, diagnosis, management, and treatment of vitamin D deficiency in individuals with cystic fibrosis: Evidence-based recommendations from the Cystic Fibrosis Foundation. J. Clin. Endocrinol. Metab. 2012, 97, 1082–1093. [Google Scholar] [CrossRef] [PubMed]
- Dieppois, G.; Ducret, V.; Caille, O.; Perron, K. The transcriptional regulator CzcR modulates antibiotic resistance and quorum sensing in Pseudomonas aeruginosa. PLoS ONE 2012, 7, e38148. [Google Scholar] [CrossRef] [PubMed]
- Groff, J.L.; Gropper, S.S.; Hunt, S.M. Advanced Nutrition and Human Metabolism; West Publishing Company: New York, NY, USA, 1995. [Google Scholar]
- Copper in Diet. Available online: http://www.nlm.nih.gov/medlineplus/ency/article/002419.htm (accessed on 27 July 2020).
- Harless, W.; Crowell, E.; Abraham, J. Anemia and neutropenia associated with copper deficiency of unclear etiology. Am. J. Hematol. 2006, 81, 546–549. [Google Scholar] [CrossRef] [PubMed]
- Yadav, K.; Singh, M.; Angurana, S.K.; Attri, S.V.; Sharma, G.; Tageja, M.; Bhalla, A.K. Evaluation of micronutrient profile of North Indian children with cystic fibrosis: A case–control study. Pediatr. Res. 2014, 75, 762–766. [Google Scholar] [CrossRef] [PubMed]
- Rükgauer, M.; Klein, J.; Kruse-Jarres, J.D. Reference values for the trace elements copper, manganese, selenium, and zinc in the serum/plasma of children, adolescents, and adults. J. Trace Elem. Med. Biol. 1997, 11, 92–98. [Google Scholar] [CrossRef]
- Bonham, M.; Jacqueline, M.; Bernadette, M.H.; Strain, J.J. The immune system as a physiological indicator of marginal copper status? Br. J. Nutr. 2002, 87, 393–403. [Google Scholar] [CrossRef]
- Percival, S.S.; Bower, E.; Wagner, M. Reduced copper enzyme activities in blood cells of children with cystic fibrosis. Am. J. Clin. Nutr. 1995, 62, 633–638. [Google Scholar] [CrossRef]
- Lin, C.-N.; Wilson, A.; Church, B.B.; Ehman, S.; Roberts, W.L.; McMillin, G.A. Pediatric reference intervals for serum copper and zinc. Clin. Chim. Acta 2012, 413, 612–615. [Google Scholar] [CrossRef]
- Best, K.; McCoy, K.; Gemma, S.; Di Silvestro, R.A. Copper enzyme activities in cystic fibrosis before and after copper supplementation plus or minus zinc. Metabolism 2004, 53, 37–41. [Google Scholar] [CrossRef]
- Milne, D.B.; Johnson, P.E. Assessment of copper status: Effect of age and gender on reference ranges in healthy adults. Clin. Chern. 1993, 39, 883–887. [Google Scholar] [CrossRef]
- Romero, C.D.; Sánchez, P.H.; Blanco, F.L.; Rodríguez, E.R.; Majem, L.S. Serum copper and zinc concentrations in a representative sample of the Canarian population. J. Trace Elem. Med. Biol. 2002, 16, 75–81. [Google Scholar] [CrossRef]
- Cordano, A. Clinical manifestations of nutritional copper deficiency in infants and children. Am. J. Clin. Nutr. 1998, 67, 1012S–1016S. [Google Scholar] [CrossRef]
- Gu, K.; Li, X.; Xiang, W.; Jiang, X. The Relationship between Serum Copper and Overweight/Obesity: A Meta-analysis. Biol. Trace Elem. Res. 2020, 194, 336–347. [Google Scholar] [CrossRef]
- Ghayour-Mobarhan, M.; Shapouri-Moghaddam, A.; Azimi-Nezhad, M.; Esmaeili, H.; Parizadeh, S.M.; Safarian, M.; Kazemi-Bajestani, S.M.; Khodaei, G.H.; Hosseini, S.J.; Parizadeh, S.M.; et al. The relationship between established coronary risk factors and serum copper and zinc concentrations in a large Persian cohort. J. Trace Elem. Med. Biol. 2009, 23, 167–175. [Google Scholar] [CrossRef]
- Gibson, R.S. Principles of Nutritional Assessment, 2nd ed.; Oxford University: New York, NY, USA, 2005; pp. 697–711. [Google Scholar]
- Angelova, M.; Asenova, S.; Nedkova, V.; Koleva-Kolarova, R. Copper in the Human organism. Trakia J. Sci. 2011, 9, 88–98. [Google Scholar]
- Chase, H.P.; Long, M.A.; Lavin, M.H. Cystic fibrosis and malnutrition. J. Pediatr. 1979, 95, 337–347. [Google Scholar] [CrossRef]
- Aris, R.M.; Merkel, P.A.; Bachrach, L.K.; Borowitz, D.S.; Boyle, M.P.; Elkin, S.L.; Guise, T.A.; Hardin, D.S.; Haworth, C.S.; Holick, M.F.; et al. Guide to bone health and disease in cystic fibrosis. J. Clin. Endocrinol. Metab. 2005, 90, 1888–1896. [Google Scholar] [CrossRef] [PubMed]
- Powers, H.J.; Loban, A.; Silvers, K.; Gibson, A.T. Vitamin C at concentrations observed in premature babies inhibits the ferroxidase activity of caeruloplasmin. Free Radic. Res. 1995, 22, 57–65. [Google Scholar] [CrossRef] [PubMed]
- Turnlund, J.R.; Keyes, W.R.; Kim, S.K.; Domek, J.M. Long-term high copper intake: Effects on copper absorption, retention, and homeostasis in men. Am. J. Clin. Nutr. 2005, 81, 822–828. [Google Scholar] [CrossRef]
- Eck, P.; Wilson, L. Toxic Metals in Human Health and Disease; Eck Institute of Applied Nutrition and Bioenergetics, Ltd.: Phoenix, AZ, USA, 1989. [Google Scholar]
- Osredkar, J.; Susta, N. Copper and Zinc, Biological Role and Significance of Copper/Zinc Imbalance. J. Clin. Toxicol. 2011, 2161, 0495. [Google Scholar] [CrossRef]
- Collins, J.F.; Prohaska, J.R.; Knutson, M.D. Metabolic crossroads of iron and copper. Nutr. Rev. 2010, 68, 133–147. [Google Scholar] [CrossRef]
- Witte, K.K.; Nikitin, N.P.; Parker, A.C.; von Haehling, S.; Volk, H.D.; Anker, S.D.; Clark, A.L.; Cleland, J.G. The effect of micronutrient supplementation on quality-of-life and left ventricular function in elderly patients with chronic heart failure. Eur. Heart J. 2005, 26, 2238–2244. [Google Scholar] [CrossRef] [PubMed]
- Songchitsomboon, S.; Komindr, S.; Komindr, A.; Kulapongse, S.; Puchaiwatananon, O.; Udomsubpayakul, U. Serum copper and zinc levels in Thai patients with various diseases. J. Med. Assoc. Thai. 1999, 82, 701–706. [Google Scholar]
- Lee, M.J.; Alvarez, J.A.; Smith, E.M.; Killilea, D.W.; Chmiel, J.F.; Joseph, P.M.; Grossmann, R.E.; Gaggar, A.; Ziegler, T.R.; Tangpricha, V. Vitamin D for Enhancing the Immune System in Cystic Fibrosis Investigators. Changes in Mineral Micronutrient Status during and after Pulmonary Exacerbation in Adults with Cystic Fibrosis. Nutr. Clin. Pract. 2015, 30, 838–843. [Google Scholar] [CrossRef] [PubMed]
- Bonaventura, P.; Benedetti, G.; Albarède, F.; Miossec, P. Zinc and its role in immunity and inflammation. Autoimmun. Rev. 2015, 14, 277–285. [Google Scholar] [CrossRef] [PubMed]
- Chasapis, C.T.; Loutsidou, A.C.; Spiliopoulou, C.A.; Stefanidou, M.E. Zinc and human health: An update. Arch. Toxicol. 2012, 86, 521–534. [Google Scholar] [CrossRef]
- de Romaña, D.L.; Olivares, M.; Uauy, R.; Araya, M. Risks and benefits of copper in light of new insights of copper homeostasis. J. Trace Elem. Med. Biol. 2011, 25, 3–13. [Google Scholar] [CrossRef] [PubMed]
- Bjørklund, G. The role of zinc and copper in autism spectrum disorders. Acta Neurobiol. Exp. 2013, 73, 225–236. [Google Scholar]
- Faber, S.; Zinn, G.M.; Kern, J.C., 2nd; Kingston, H.M. The plasma zinc/serum copper ratio as a biomarker in children with autism spectrum disorders. Biomarkers 2009, 14, 171–180. [Google Scholar] [CrossRef]
- Bahi, G.A.; Boyvin, L.; Méité, S.; M’Boh, G.M.; Yeo, K.; N’Guessan, K.R.; Bidié, A.D.; Djaman, A.J. Assessments of serum copper and zinc concentration, and the Cu/Zn ratio determination in patients with multidrug resistant pulmonary tuberculosis (MDR-TB) in Côte d’Ivoire. BMC Infect. Dis. 2017, 17, 257. [Google Scholar] [CrossRef]
- Gupta, V.; Kumar, A.; Asthana, R.K. Serum zinc and copper levels in aplastic anemia. Indian Pediatr. 2012, 49, 493–494. [Google Scholar] [CrossRef]
- Malavolta, M.; Giacconi, R.; Piacenza, F.; Santarelli, L.; Cipriano, C.; Costarelli, L.; Tesei, S.; Pierpaoli, S.; Basso, A.; Galeazzi, R.; et al. Plasma copper/zinc ratio: An inflammatory/nutritional biomarker as predictor of all-cause mortality in elderly population. Biogerontology 2010, 11, 309–319. [Google Scholar] [CrossRef]
- Walsh, W.J.; Isaacson, H.R.; Rehman, F.; Hall, A. Elevated blood copper/zinc ratios in assaultive young males. Physiol. Behav. 1997, 62, 327–329. [Google Scholar] [CrossRef]
- Guo, C.H.; Chen, P.C.; Yeh, M.S.; Hsiung, D.Y.; Wang, C.L. Cu/Zn ratios are associated with nutritional status, oxidative stress, inflammation, and immune abnormalities in patients on peritoneal dialysis. Clin. Biochem. 2011, 44, 275–280. [Google Scholar] [CrossRef] [PubMed]


| Characteristics | Mean ± SD or No. (%) | Median | Range |
|---|---|---|---|
| Age (years) | 14.8 ± 8 | 15 | 2–31 |
| Anthropometric Assessment | |||
| Body mass index Z-score | −0.95 ± 1.1 | −0.6 | −3.8 to 0.6 |
| Average conduction velocity Z-score | 0.3 ± 0.9 | −0.0 | −1.6 to 1.4 |
| Indirect Calorimetry (calories) | |||
| Basal energy expenditure | 1078 ± 303 | 1149 | 440–1490 |
| Theoretical basal energy expenditure | 2193 ± 576 | 2200 | 1066–3251 |
| WHO recommended basal energy expenditure | 1185 ± 233 | 1230 | 598–1559 |
| Blood Analytics | |||
| Serum copper level (µg/dL) | 113 ± 23.5 | 113 | 69–158 |
| Serum zinc level (µg/dL) | 87.2 ± 16.7 | 86 | 58–122 |
| Copper/zinc ratio | 1.32 ± 0.28 | 1.33 | 0.73–2.00 |
| Zinc/copper ratio | 0.79 ± 0.18 | 0.75 | 0.5–1.38 |
| Complement C3 (mg/dL) | 117 ± 24 | 110 | 80–165 |
| Complement C4 (mg/dL) | 21 ± 6 | 20 | 15–35 |
| Lymphocytes NK CD16+56 (%) | 10.8 ± 5.8 | 9 | 2–22 |
| Gamma glutamyl transpeptidasa (U/L) | 20.9 ± 19.3 | 13 | 7–70 |
| Prospective Dietary Survey | |||
| Energy intake (calories) | 2595 ± 464 | 2672 | 1846–3410 |
| Vitamin C intake (percentage of dietary reference intake) | 170 ± 141 | 131 | 13–461 |
| Zinc intake (percentage of dietary reference intake) | 97 ± 26.9 | 98 | 54.9–153.9 |
| Comorbidities (%) | |||
| Undernutrition | 5 (29.4%) | ||
| Anemia by iron deficiency | 5 (29.4%) | ||
| Hypocupremia | 1 (5.9%) | ||
| Hypercupremia | 5 (29.4%) | ||
| Hypozincemia | 3 (17.6%) | ||
| Dietary zinc deficiency | 4 (23.5%) | ||
| Abnormal abdominal ultrasound | 5 (29.4%) |
| Characteristics | Male | Female | p-Value |
|---|---|---|---|
| Age (years) | 10.4 ± 7.2 | 17.2 ± 7.9 | 0.091 |
| Serum copper level (µg/dL) | 109.3 ± 23.4 | 115.7 ± 24.5 | 0.596 |
| Colonization | Yes | No | |
| Serum copper level (µg/dL) | 119 ± 24 | 102.2 ± 19.8 | 0.098 |
| Forced vital capacity | 76.9 ± 24.2 | 94.5 ± 53.7 | 0.478 |
| Forced expired volume in 1 second | 74.9 ± 27.3 | 84.9 ± 27.5 | 0.511 |
| Nutritional Status | Undernutrition | Eutrophic | |
| Serum copper level (µg/dL) | 90 ± 14.1 | 122.7 ± 19.7 | 0.004 |
| Acute Phase Reactants | ERS high | Normal | |
| Serum copper level (µg/dL) | 116.4 ± 20.2 | 112 ± 38.2 | 0.700 |
| Acute Phase Reactants | CRP high | Normal | |
| Serum copper level (µg/dL) | 112.7 ± 23 | 158 | 0.154 |
| Respiratory Function | Sufficient | Insufficient | |
| Serum copper level (µg/dL) | 105.1 ± 23.3 | 120.1 ± 22.5 | 0.277 |
| Dietary zinc intake (%DRI)) | 81.5 ± 20.8 | 112.5 ± 23.6 | 0.015 |
| Pancreatic Function | Sufficient | Insufficient | |
| Serum copper level (µg/dL) | 115.5 ± 29.7 | 112.3 ± 22.6 | 1.000 |
| Nutritional Parameters | Serum Copper Level | |||
|---|---|---|---|---|
| Spearman’s Rho Test | Linear Regression Analysis | |||
| r | p-Value | R2 | p-Value | |
| Body mass index | 0.489 * | 0.046 | 0.236 | 0.048 |
| Average conduction velocity | 0.517 * | 0.040 | 0.275 | 0.037 |
| Vitamin C intake | −0.651 ** | 0.040 | 0.270 | 0.039 |
| Serum zinc | 0.467 | 0.059 | 0.376 | <0.0001 |
| Cardiovascular risk index | 0.51 | 0.045 | 0.26 | 0.045 |
| Complement C3 | 0.616 * | 0.014 | 0.350 | 0.020 |
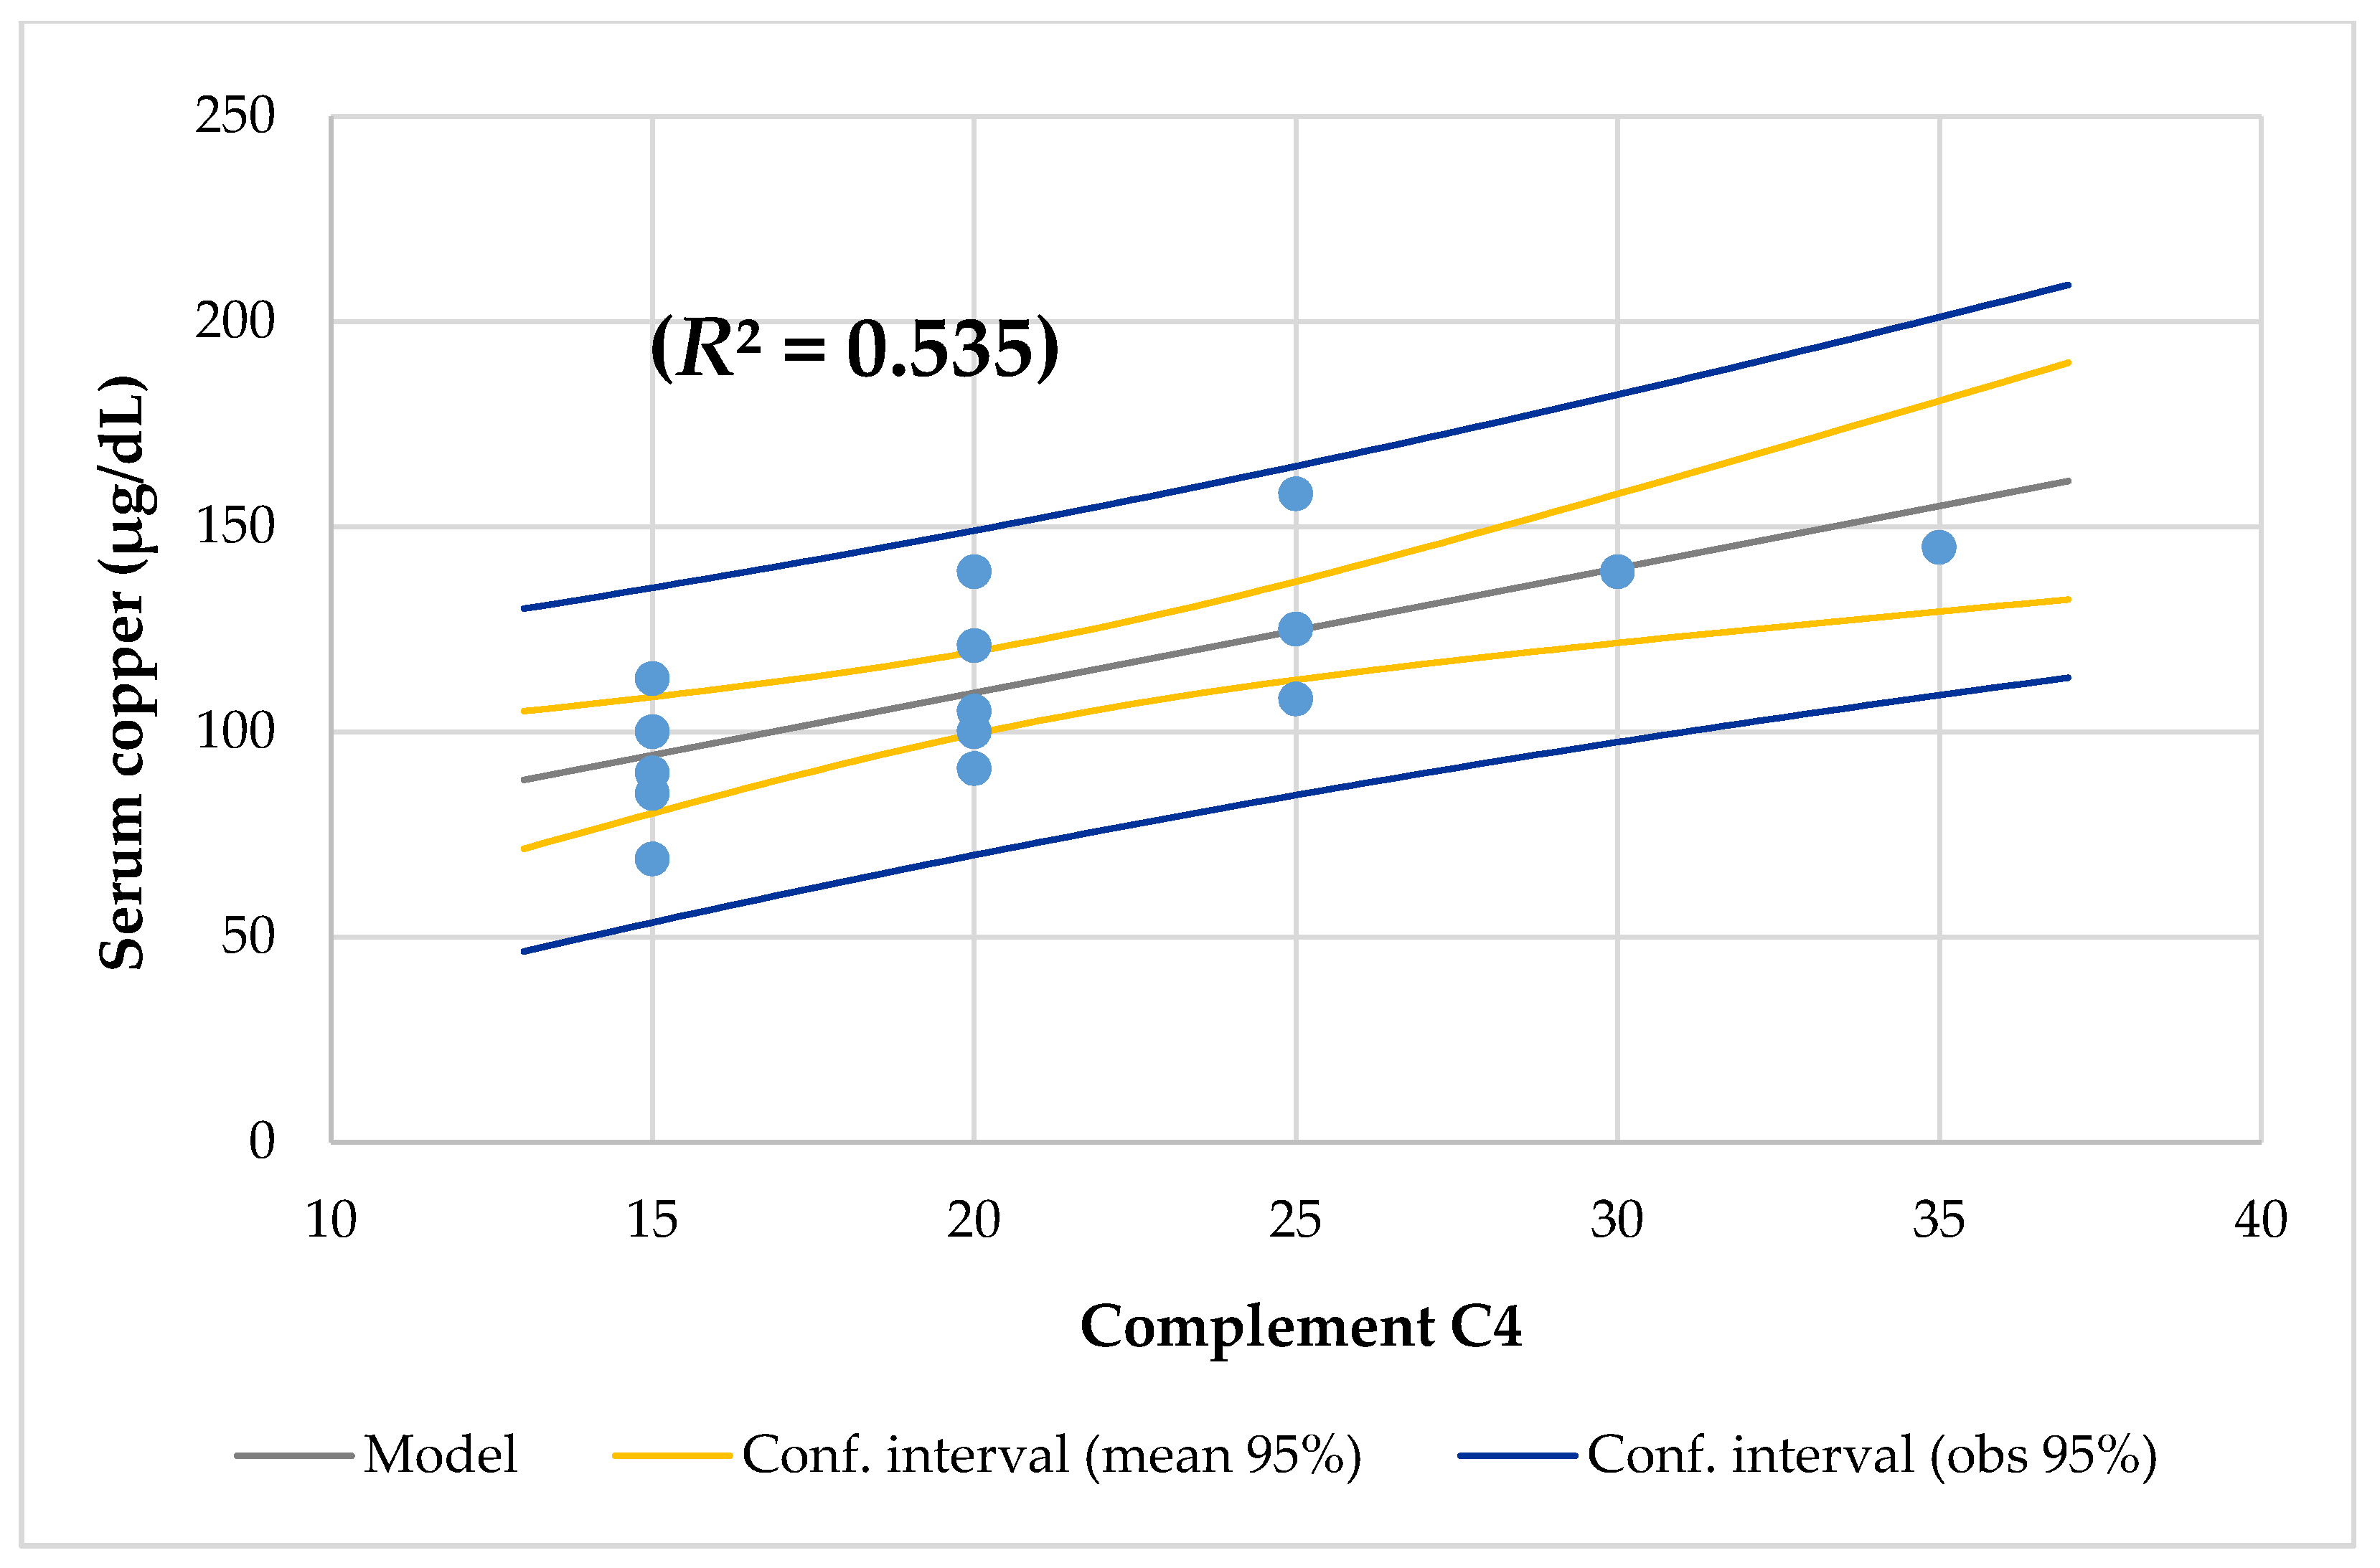
| Complement C4 | 0.477 ** | 0.001 | 0.535 | 0.002 |
| Lymphocytes NK CD16+56 | 0.559 * | 0.024 | 0.263 | 0.042 |
| Spearman’s Rho Test | Copper/Zinc Ratio | Zinc/Copper Ratio | ||
| r | p-Value | r | p-Value | |
| Zinc/copper ratio | 0.998 ** | 0.000 | ||
| Protein intake (mg/d) | 0.652 ** | 0.006 | 0.665 ** | 0.005 |
| Monosaturated lipids intake (% DRI) | 0.703 ** | 0.002 | −0.691 | 0.003 |
| Polyunsaturated lipids intake (% DRI) | −0.584 * | 0.018 | 0.584 | 0.018 |
| Niacin intake (% DRI) | 0.641 ** | 0.007 | −0.670 ** | 0.005 |
| Calcium intake (% DRI) | 0.507 * | 0.045 | ||
| Triglycerides | 0.558 * | 0.020 | −0.542 * | 0.025 |
| Serum iron | 0.493 * | 0.045 | ||
| Gamma glutamyl transpeptidase | 0.574 * | 0.016 | −0.573 * | 0.016 |
| Monocytes | −0.532 * | 0.034 | 0.541 * | 0.031 |
| Age Years | Serum Copper µg/dL | Serum Iron µg/dL | Hemoglobin g/L | Mean Corpuscular Volume μg/m3 | Lymphocytes Cell/mm3 |
|---|---|---|---|---|---|
| 2 | 113 | 49 | 13.2 | 82 | 6580 |
| 4 | 90 | 79 | 13.8 | 82.6 | 3400 |
| 6 | 158 | 46 | 13.5 | 79.7 | 3830 |
| 8 | 139 | 25 | 15 | 80.8 | 3710 |
| 8 | 108 | 84 | 14.2 | 88.9 | 3440 |
| 9 | 145 | 108 | 14.4 | 85.7 | 2490 |
| 9 | 121 | 79 | 14.35 | 87.8 | 3146 |
| 13 | 121 | 47 | 14.8 | 80.5 | 1900 |
| 15 | 69 | 135 | 14.3 | 89.4 | 1610 |
| 15 | 100 | 69 | 15.1 | 88.5 | 3970 |
| 16 | 105 | 89 | 15.6 | 86.3 | 4120 |
| 18 | 85 | 69 | 11.7 | 92 | 2110 |
| 20 | 113 | 129 | 15.4 | 84.4 | 3200 |
| 23 | 125 | 141 | 17.8 | 96.2 | 2490 |
| 23 | 100 | 45 | 13.4 | 97.8 | 2270 |
| 25 | 139 | 92 | 14.4 | 101.2 | 2920 |
| 31 | 91 | 59 | 13.1 | 89.3 | 2300 |
Publisher’s Note: MDPI stays neutral with regard to jurisdictional claims in published maps and institutional affiliations. |
© 2020 by the authors. Licensee MDPI, Basel, Switzerland. This article is an open access article distributed under the terms and conditions of the Creative Commons Attribution (CC BY) license (http://creativecommons.org/licenses/by/4.0/).
Share and Cite
Escobedo-Monge, M.F.; Barrado, E.; Alonso Vicente, C.; Escobedo-Monge, M.A.; Torres-Hinojal, M.C.; Marugán-Miguelsanz, J.M.; Redondo del Río, M.P. Copper and Copper/Zinc Ratio in a Series of Cystic Fibrosis Patients. Nutrients 2020, 12, 3344. https://doi.org/10.3390/nu12113344
Escobedo-Monge MF, Barrado E, Alonso Vicente C, Escobedo-Monge MA, Torres-Hinojal MC, Marugán-Miguelsanz JM, Redondo del Río MP. Copper and Copper/Zinc Ratio in a Series of Cystic Fibrosis Patients. Nutrients. 2020; 12(11):3344. https://doi.org/10.3390/nu12113344
Chicago/Turabian StyleEscobedo-Monge, Marlene Fabiola, Enrique Barrado, Carmen Alonso Vicente, María Antonieta Escobedo-Monge, María Carmen Torres-Hinojal, José Manuel Marugán-Miguelsanz, and María Paz Redondo del Río. 2020. "Copper and Copper/Zinc Ratio in a Series of Cystic Fibrosis Patients" Nutrients 12, no. 11: 3344. https://doi.org/10.3390/nu12113344
APA StyleEscobedo-Monge, M. F., Barrado, E., Alonso Vicente, C., Escobedo-Monge, M. A., Torres-Hinojal, M. C., Marugán-Miguelsanz, J. M., & Redondo del Río, M. P. (2020). Copper and Copper/Zinc Ratio in a Series of Cystic Fibrosis Patients. Nutrients, 12(11), 3344. https://doi.org/10.3390/nu12113344