Impact of Hyperhomocysteinemia and Different Dietary Interventions on Cognitive Performance in a Knock-in Mouse Model for Alzheimer’s Disease

 , , , , ,
  ,
,
Abstract
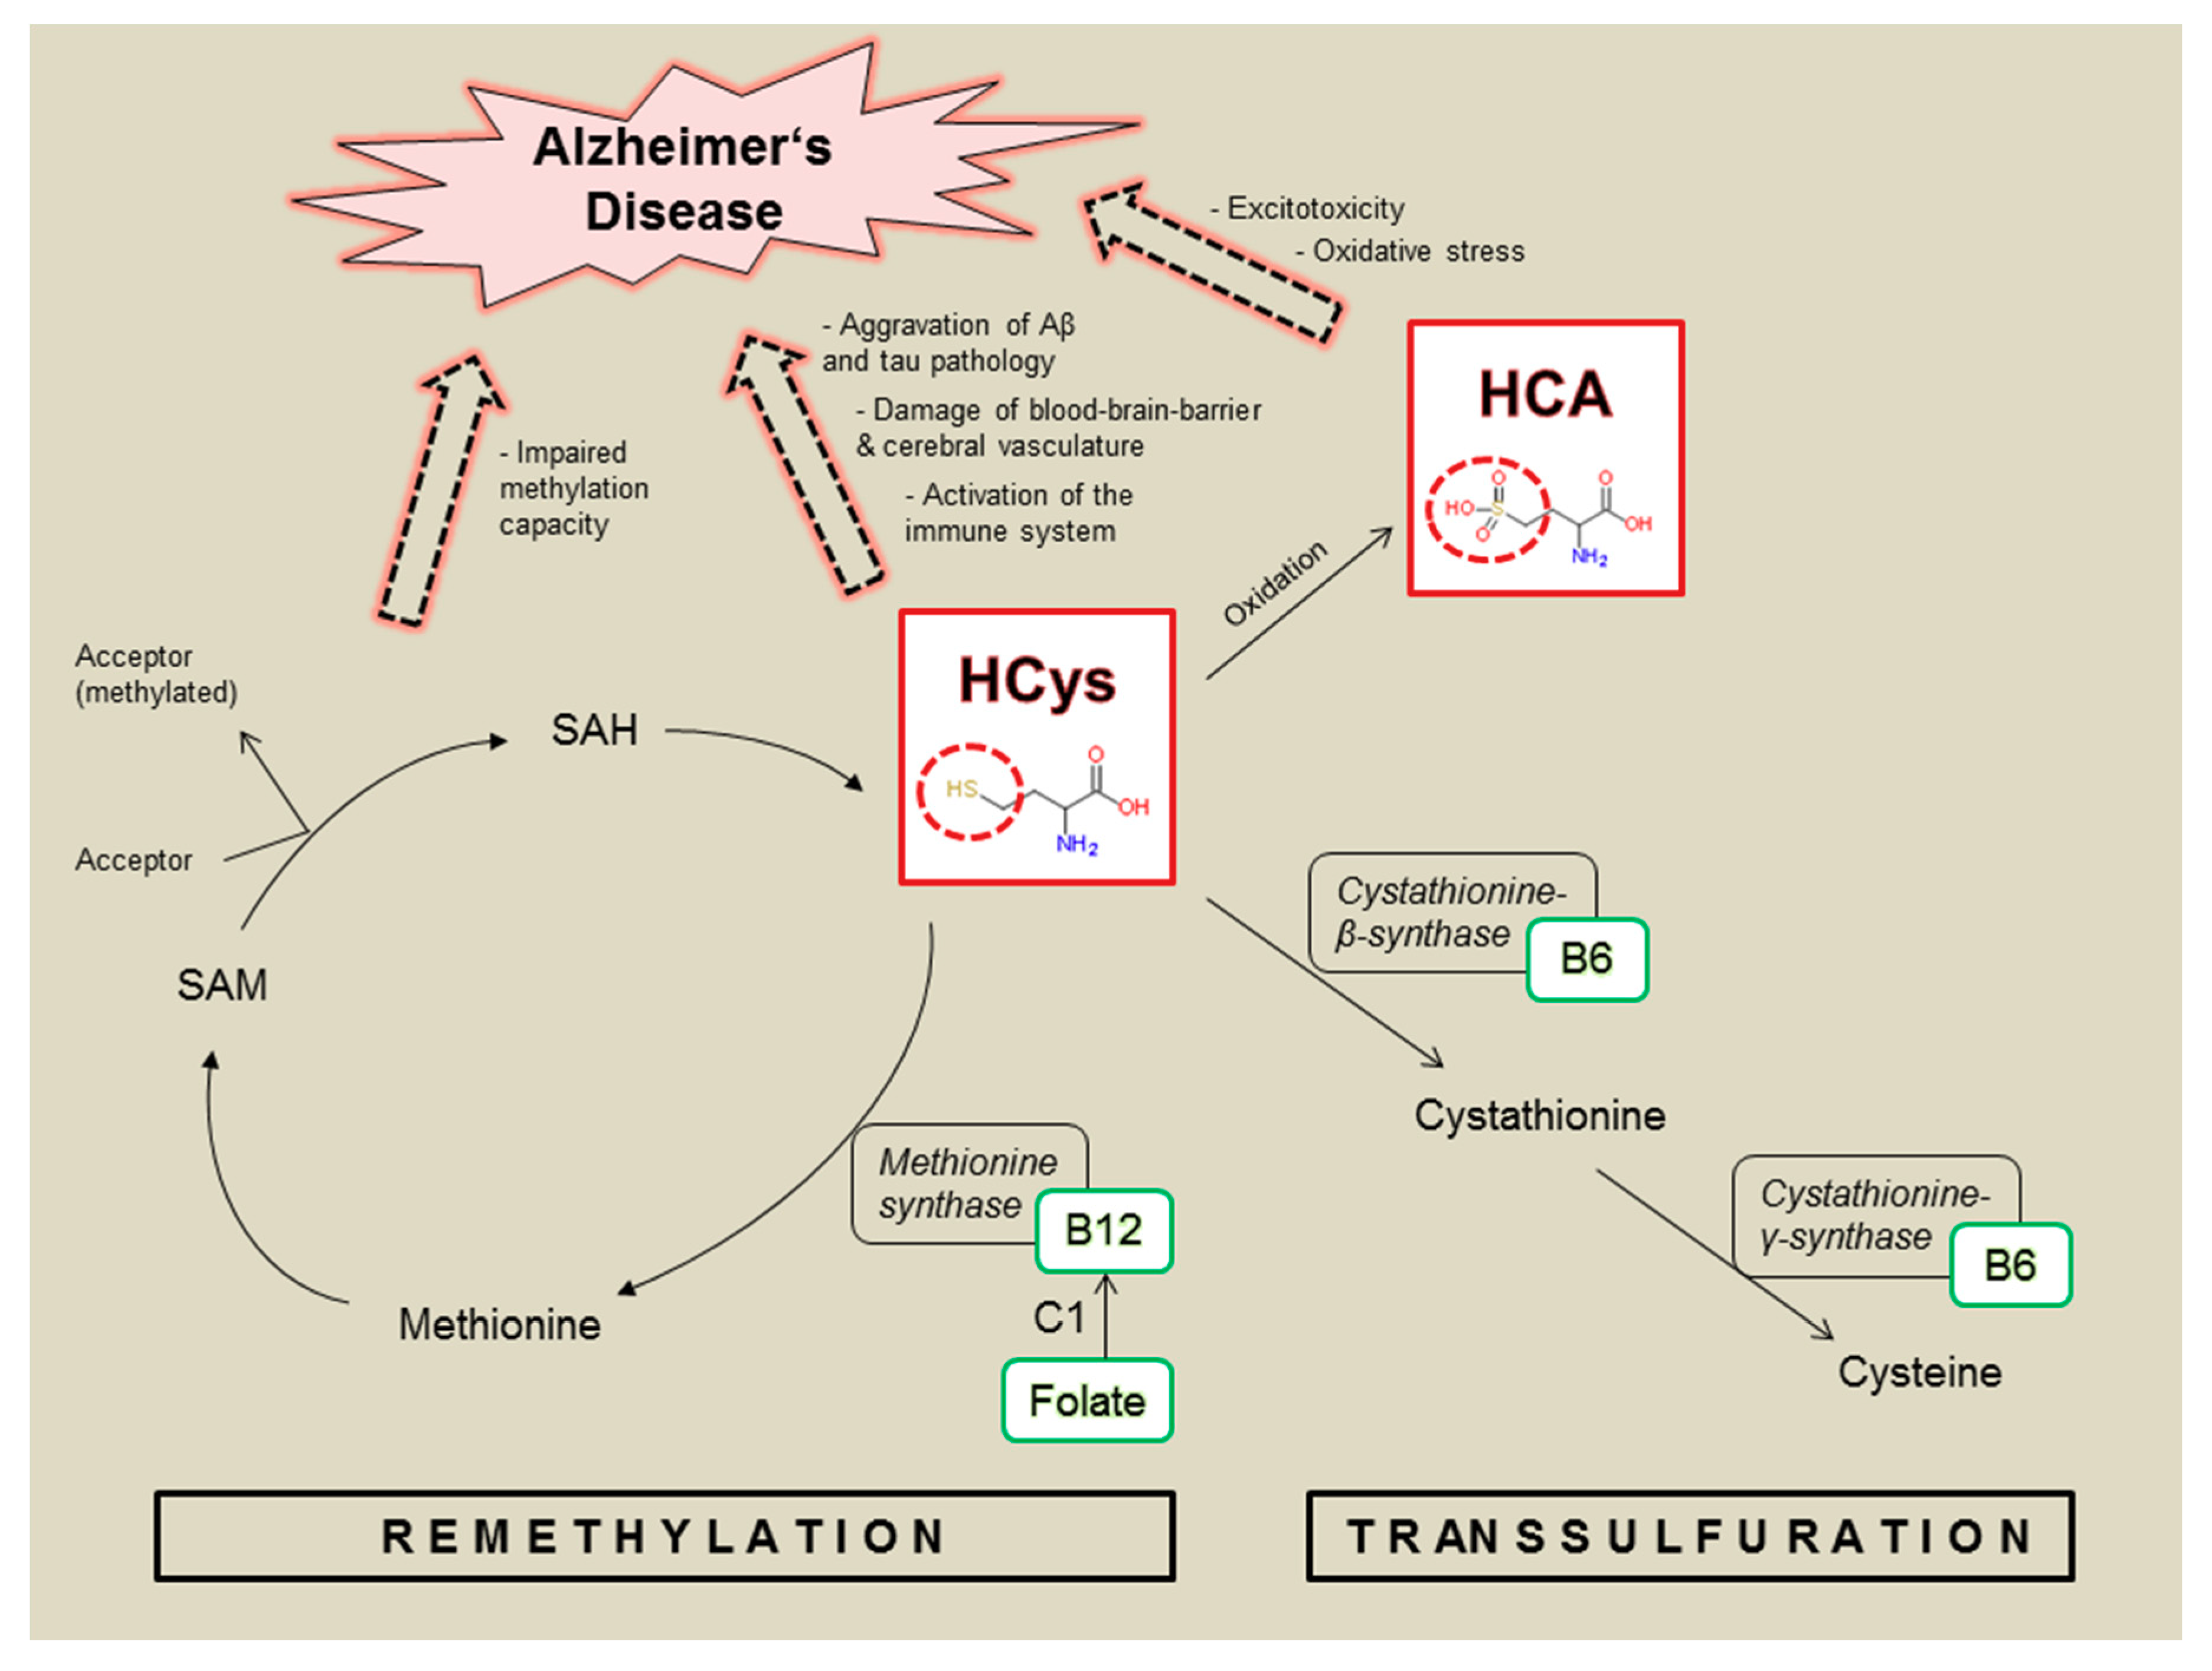
1. Introduction
2. Materials and Methods
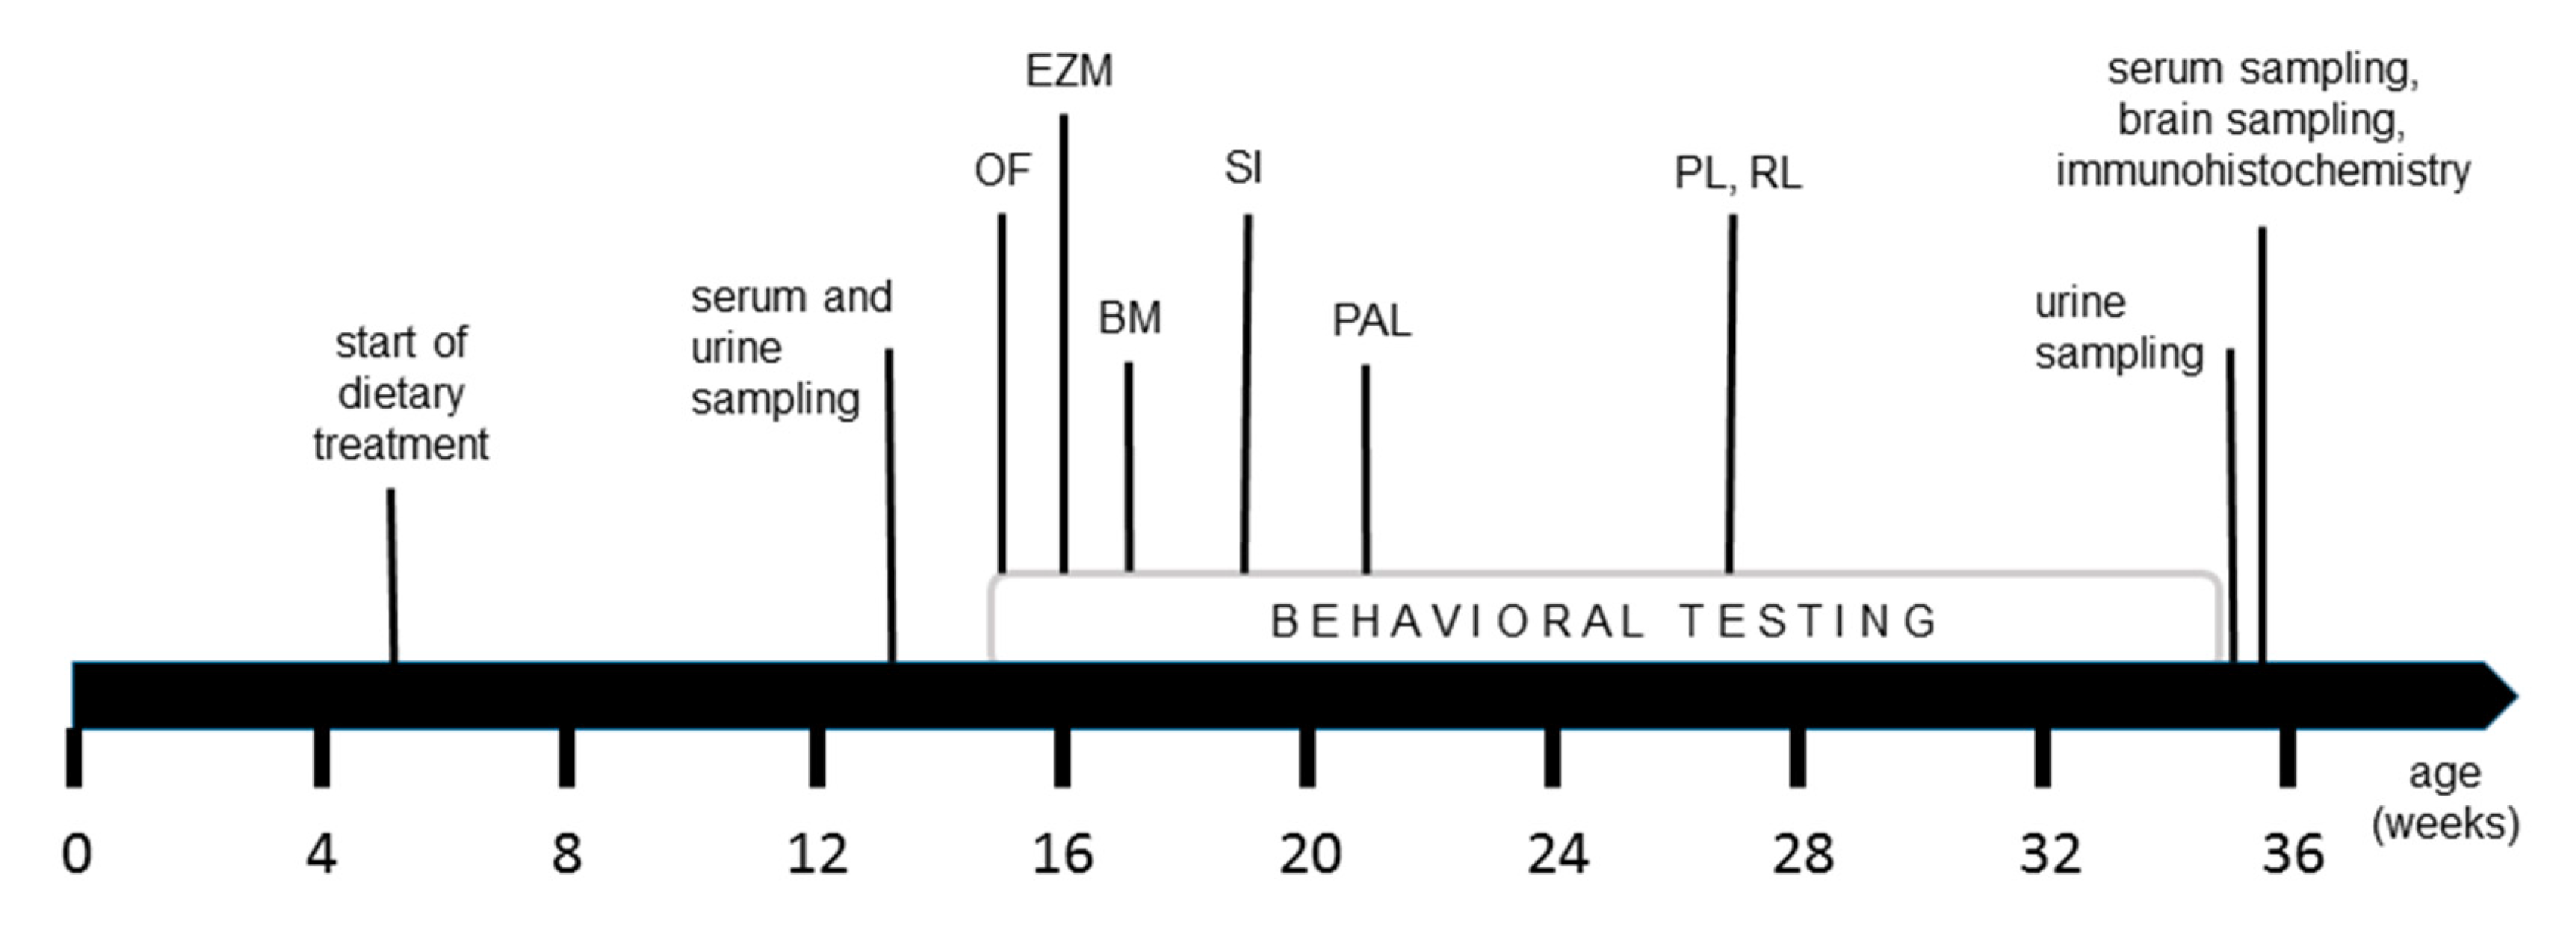
2.1. Animals and Experimental Diets
2.2. Behavioral Testing
2.3. Sample Collection
2.4. Biochemical and Immunohistochemical Analyses
2.5. Statistical Analyses
3. Results
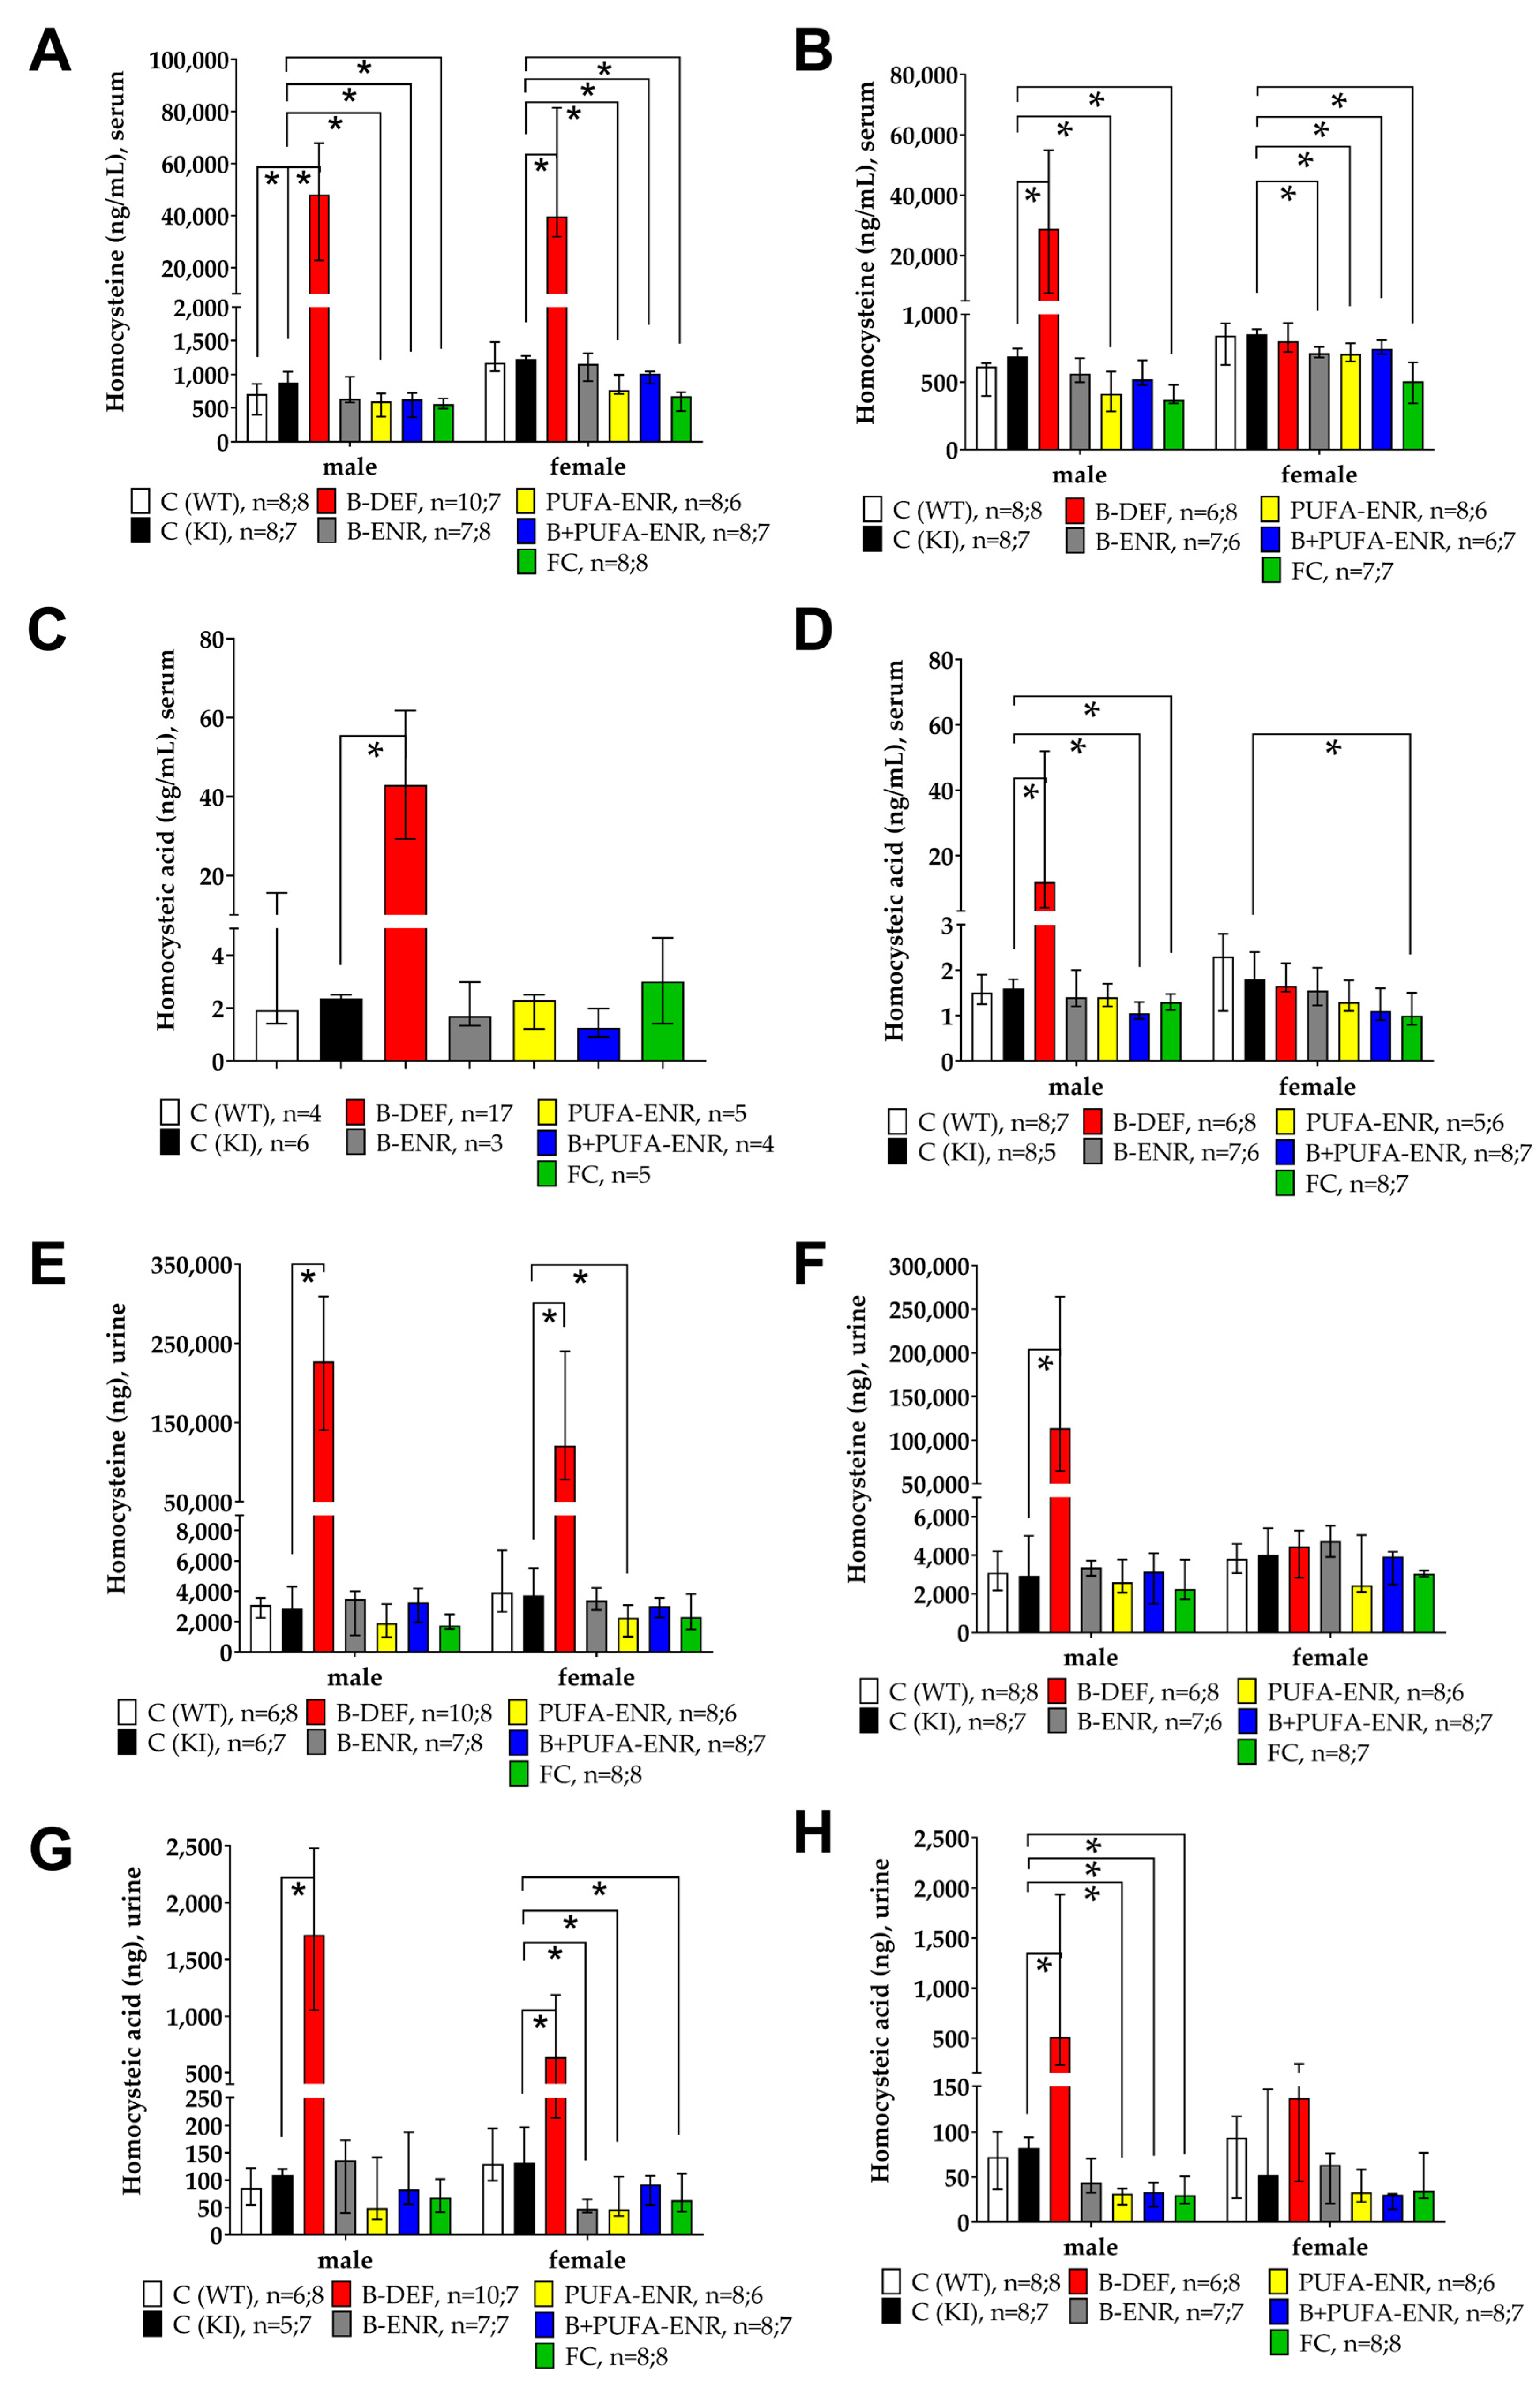
3.1. Homocysteine and Homocysteic Acid
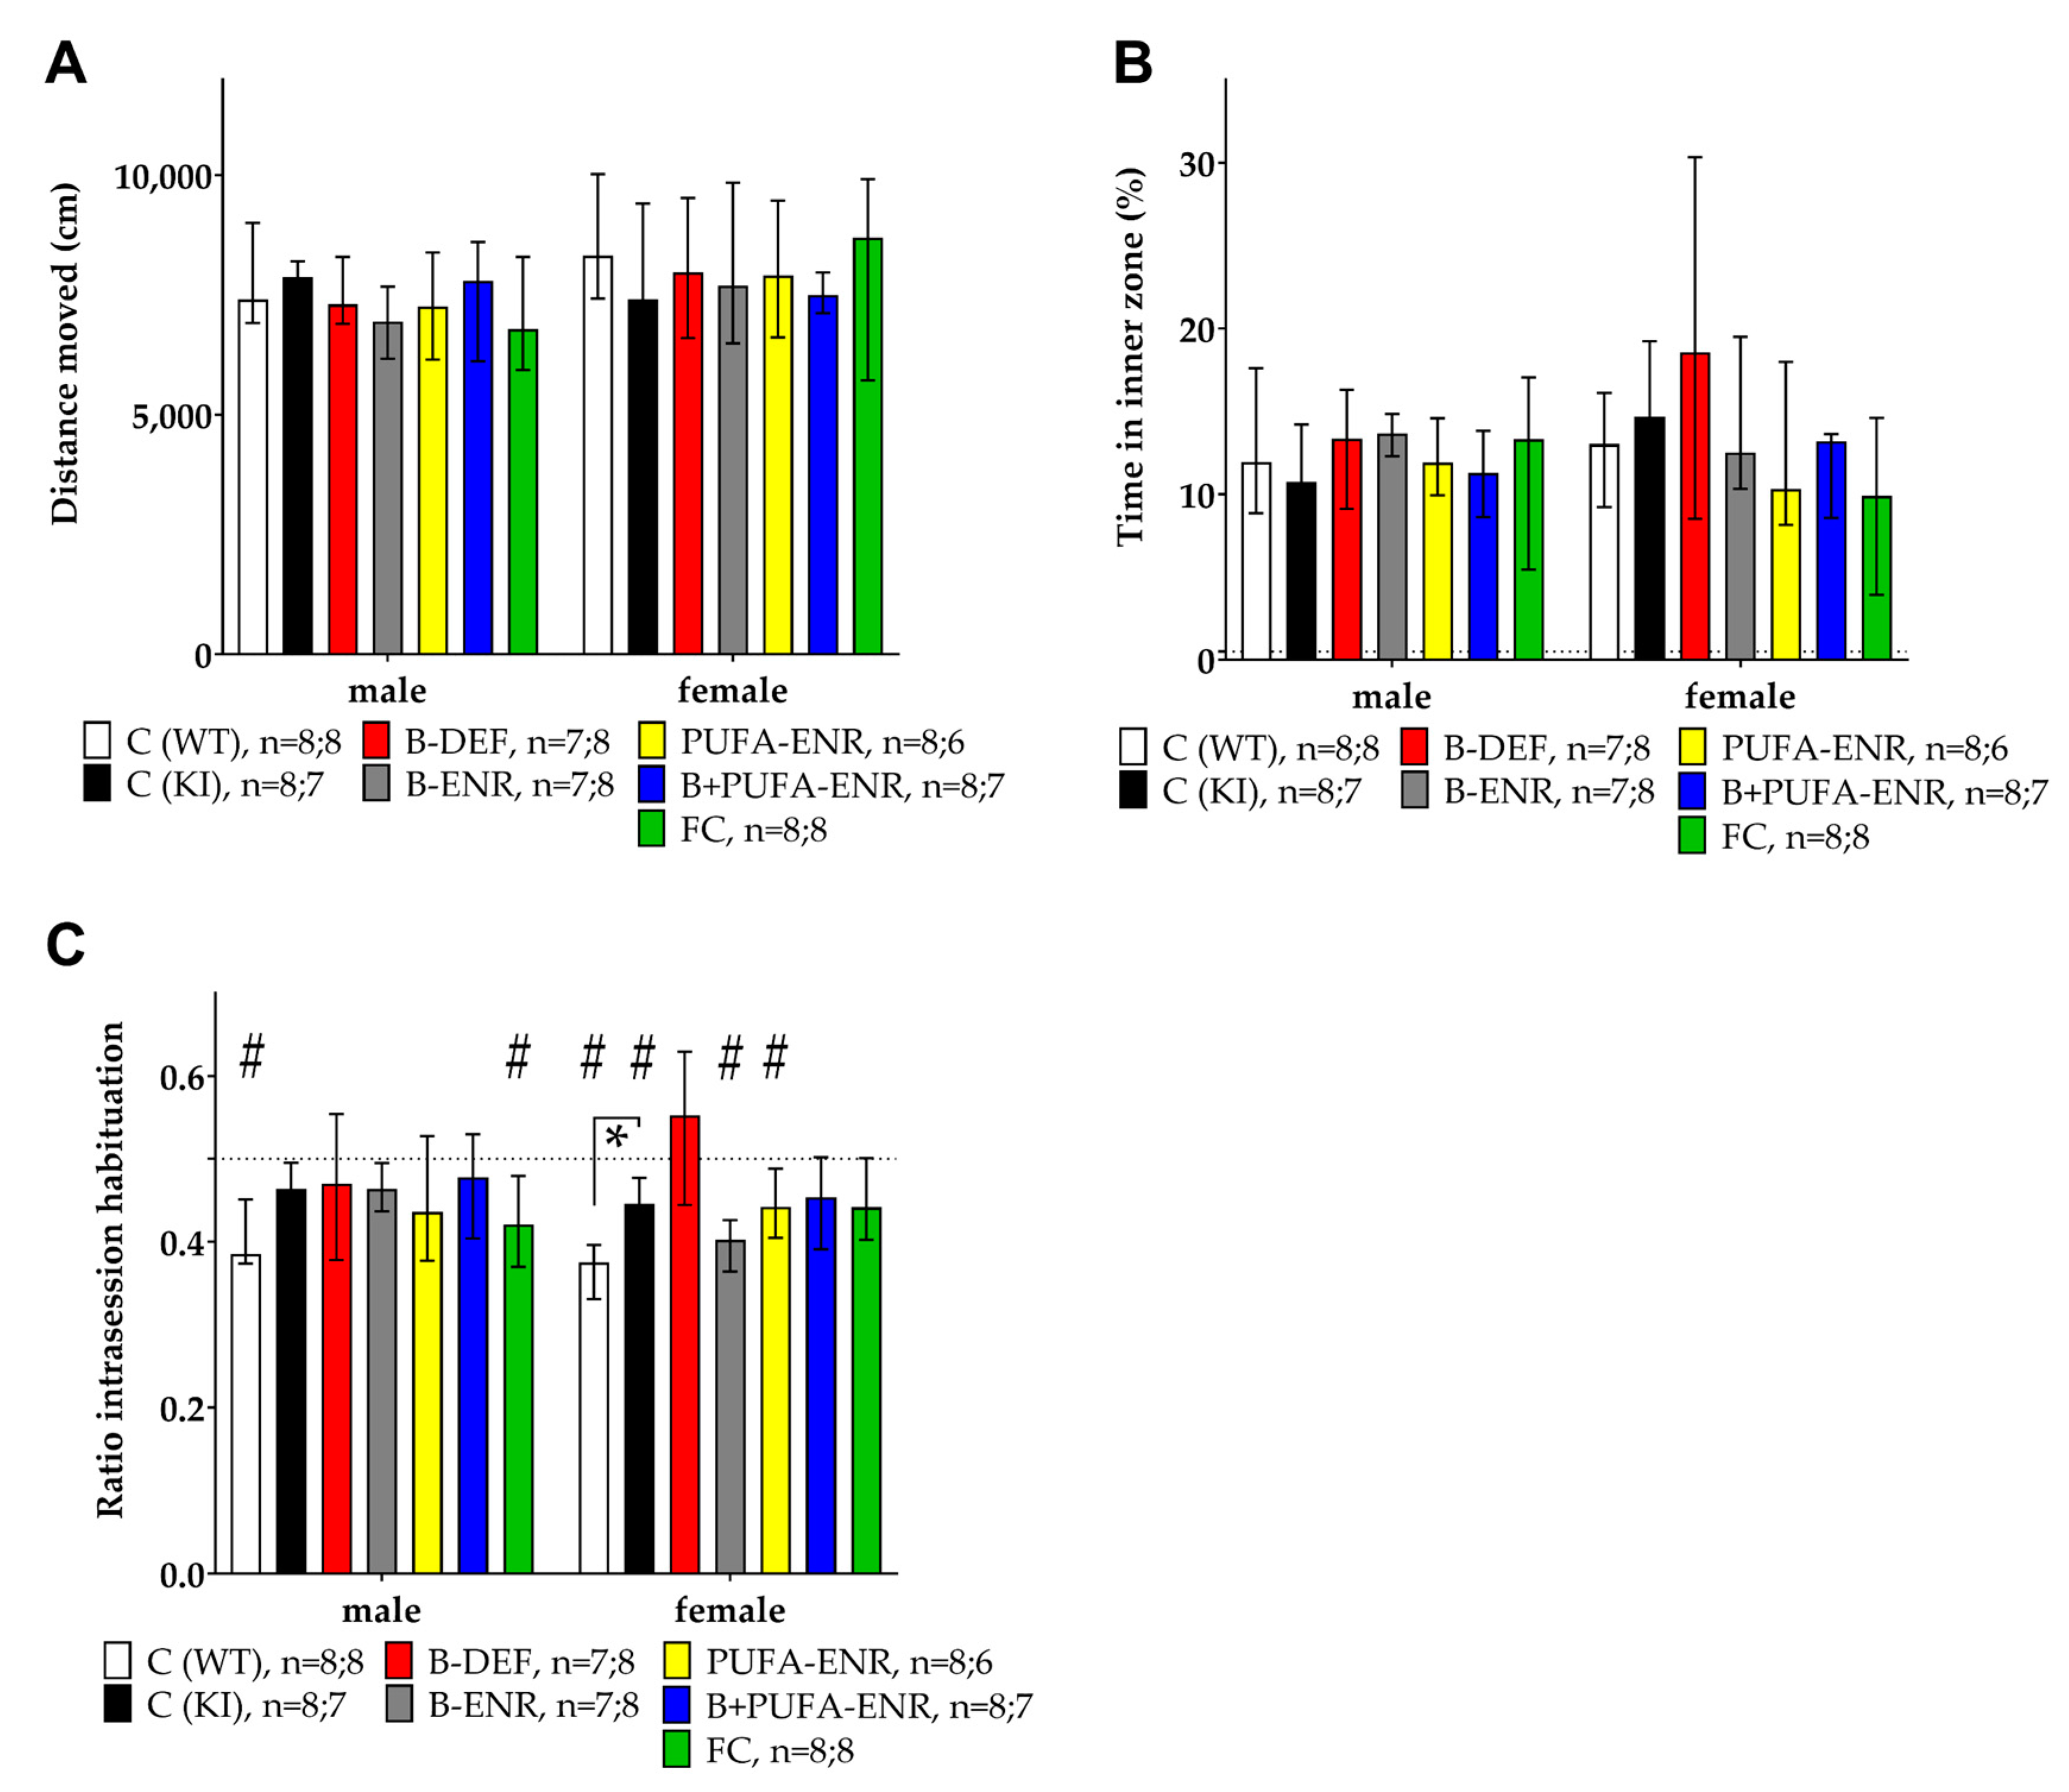
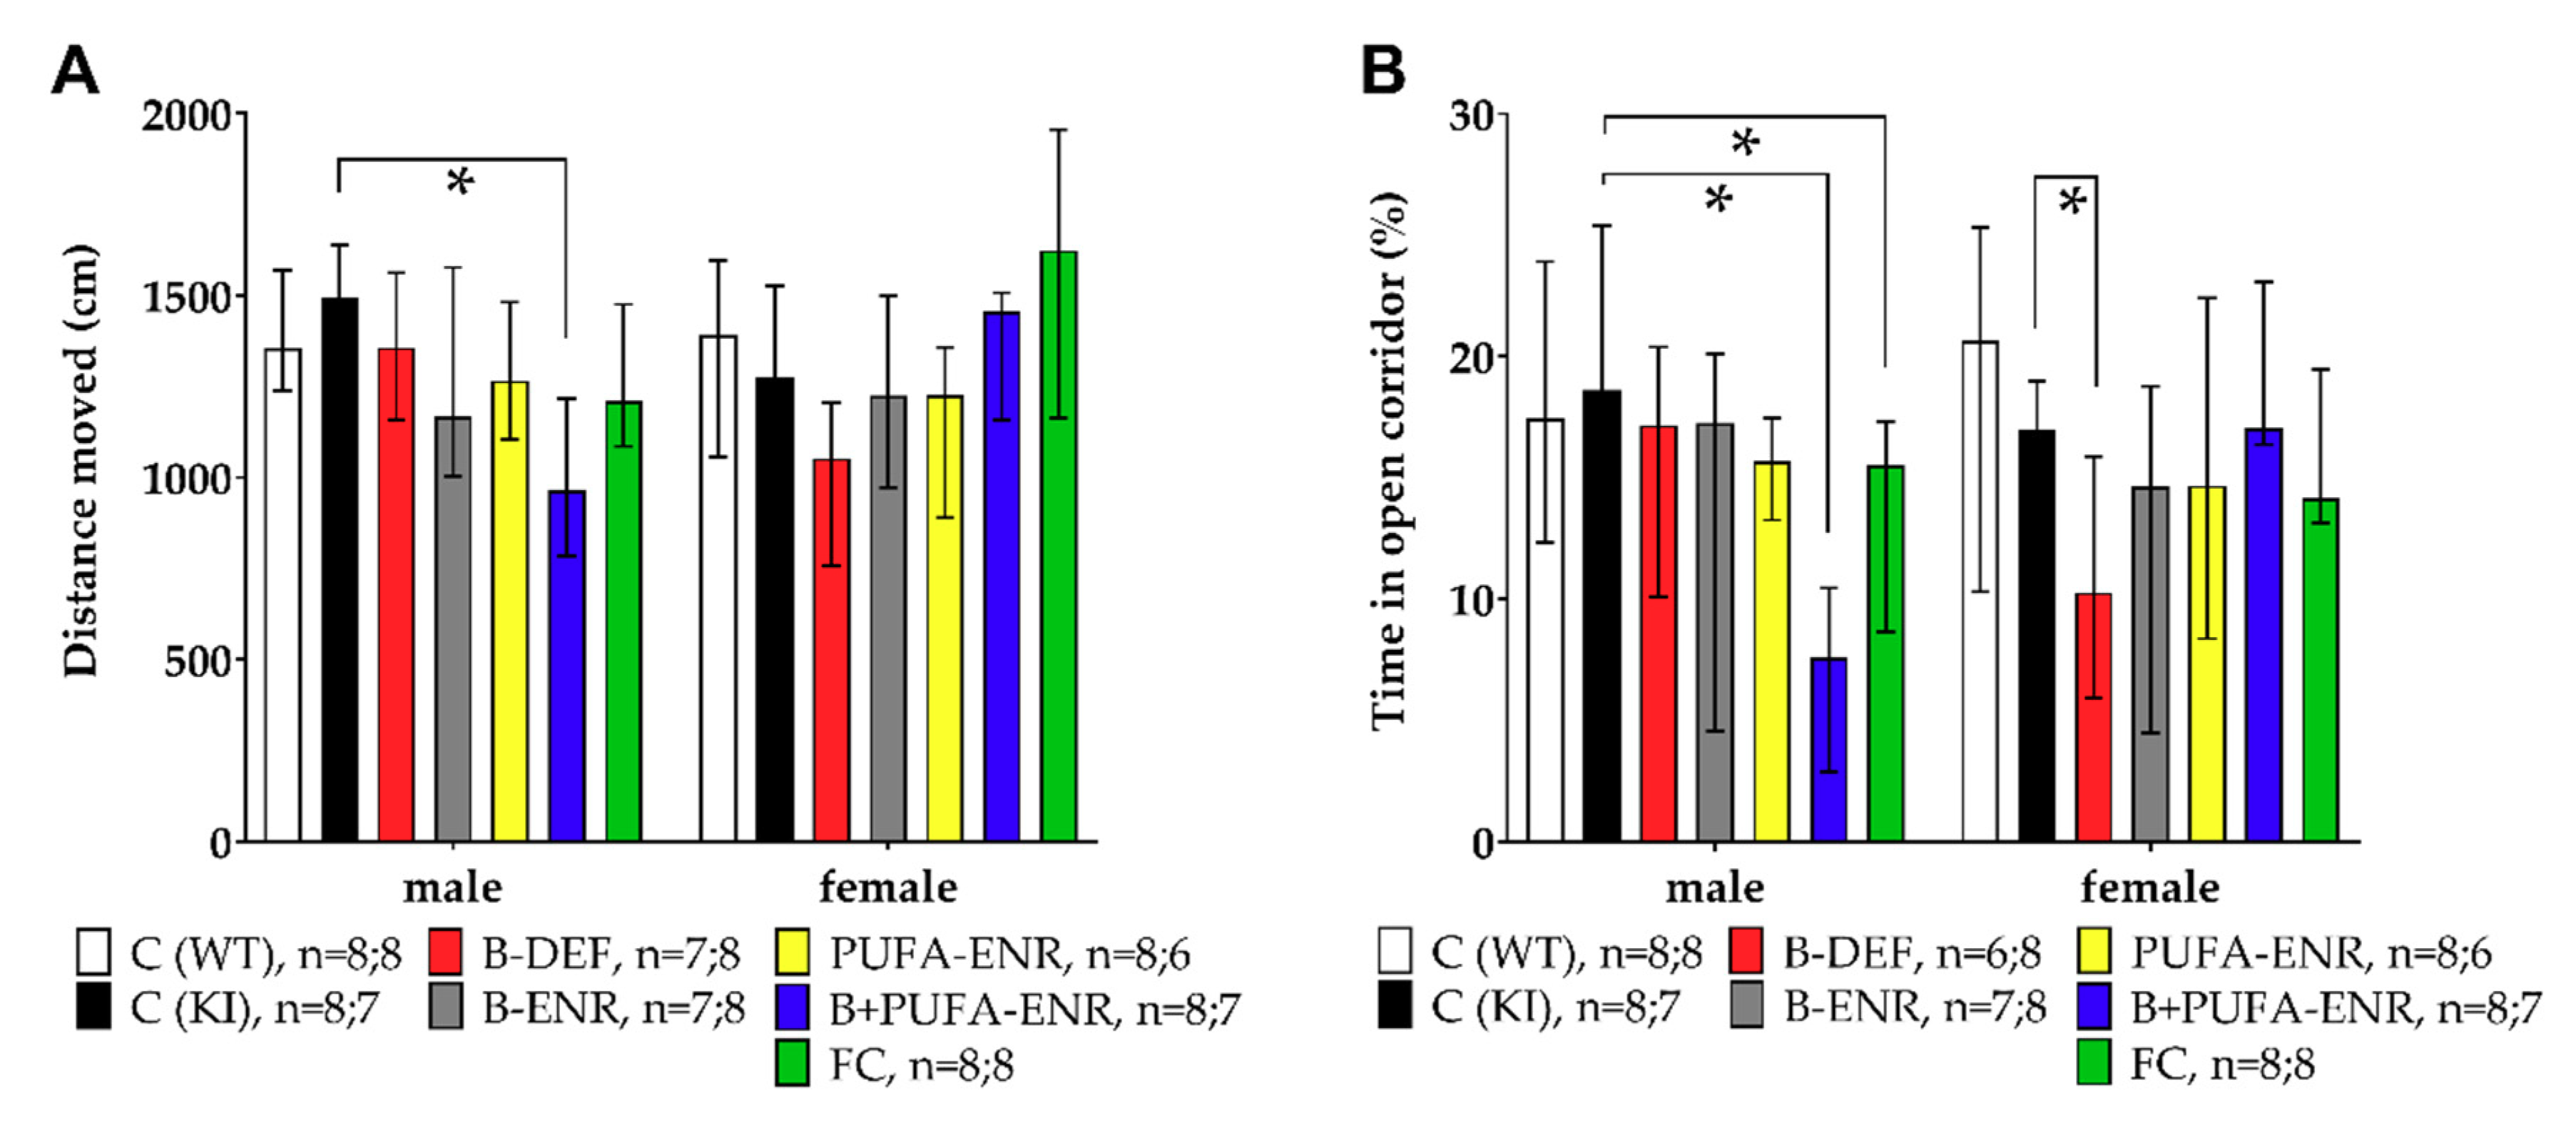
3.2. Open Field
3.3. Elevated Zero Maze
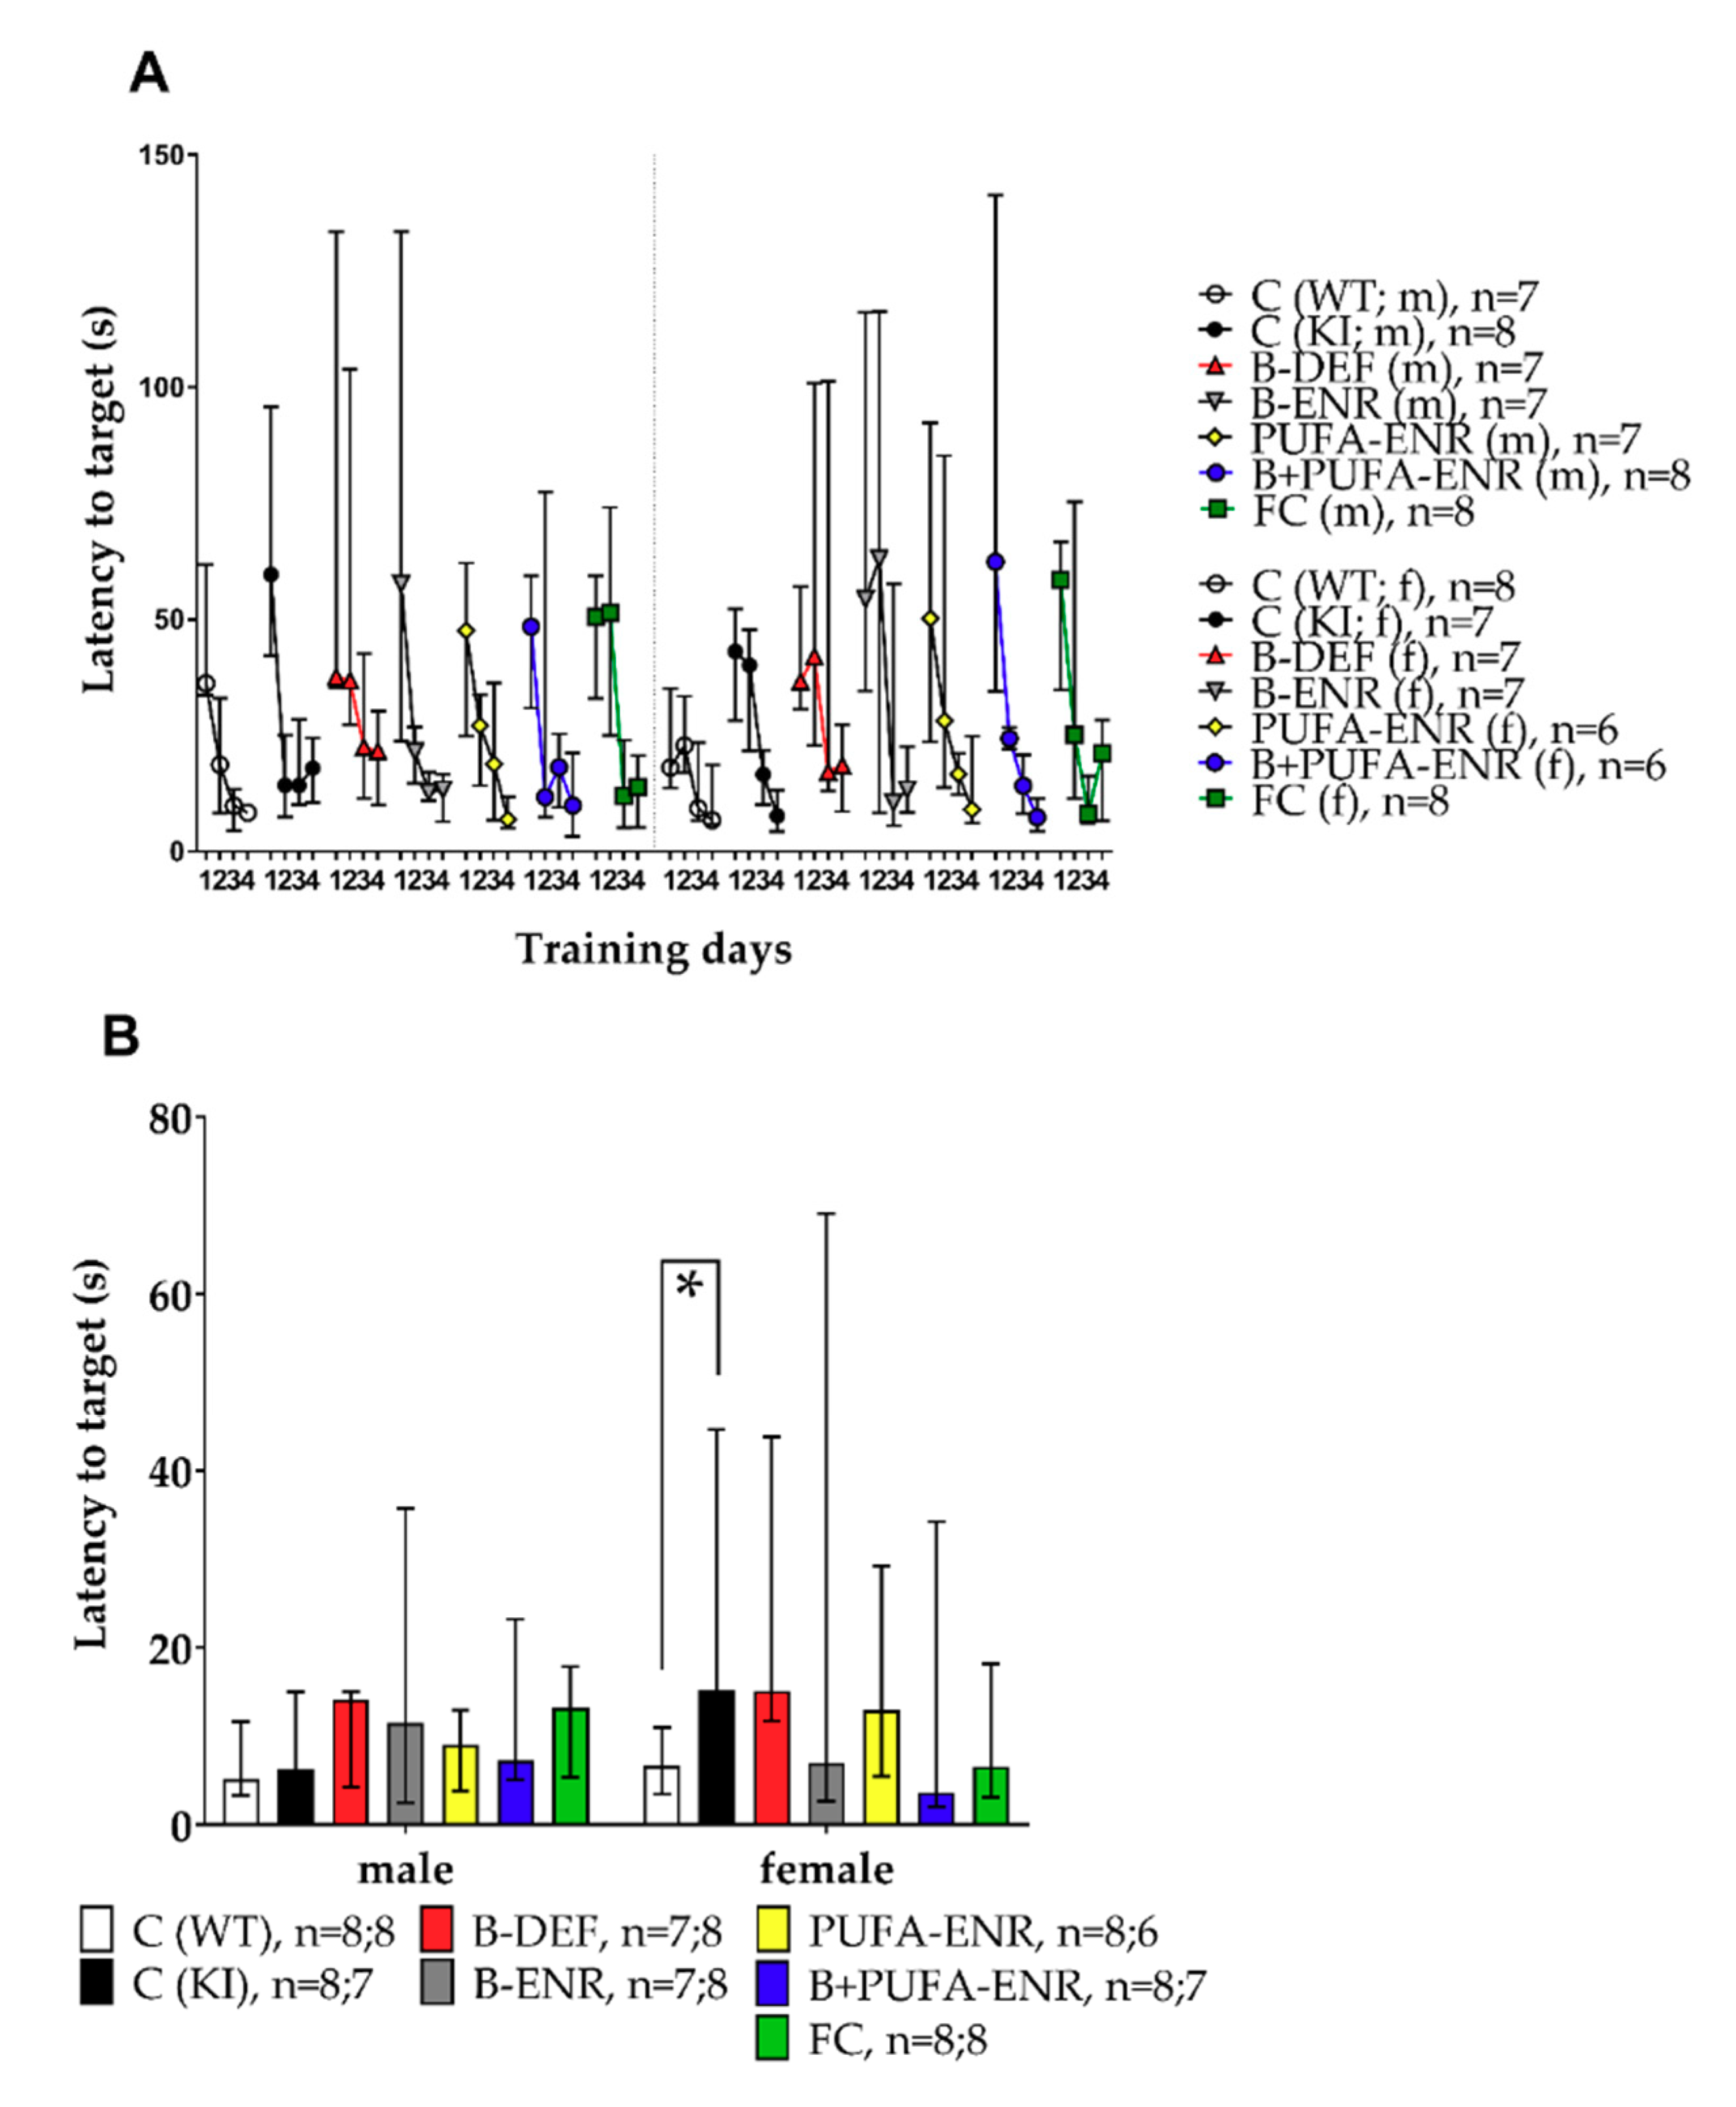
3.4. Barnes Maze
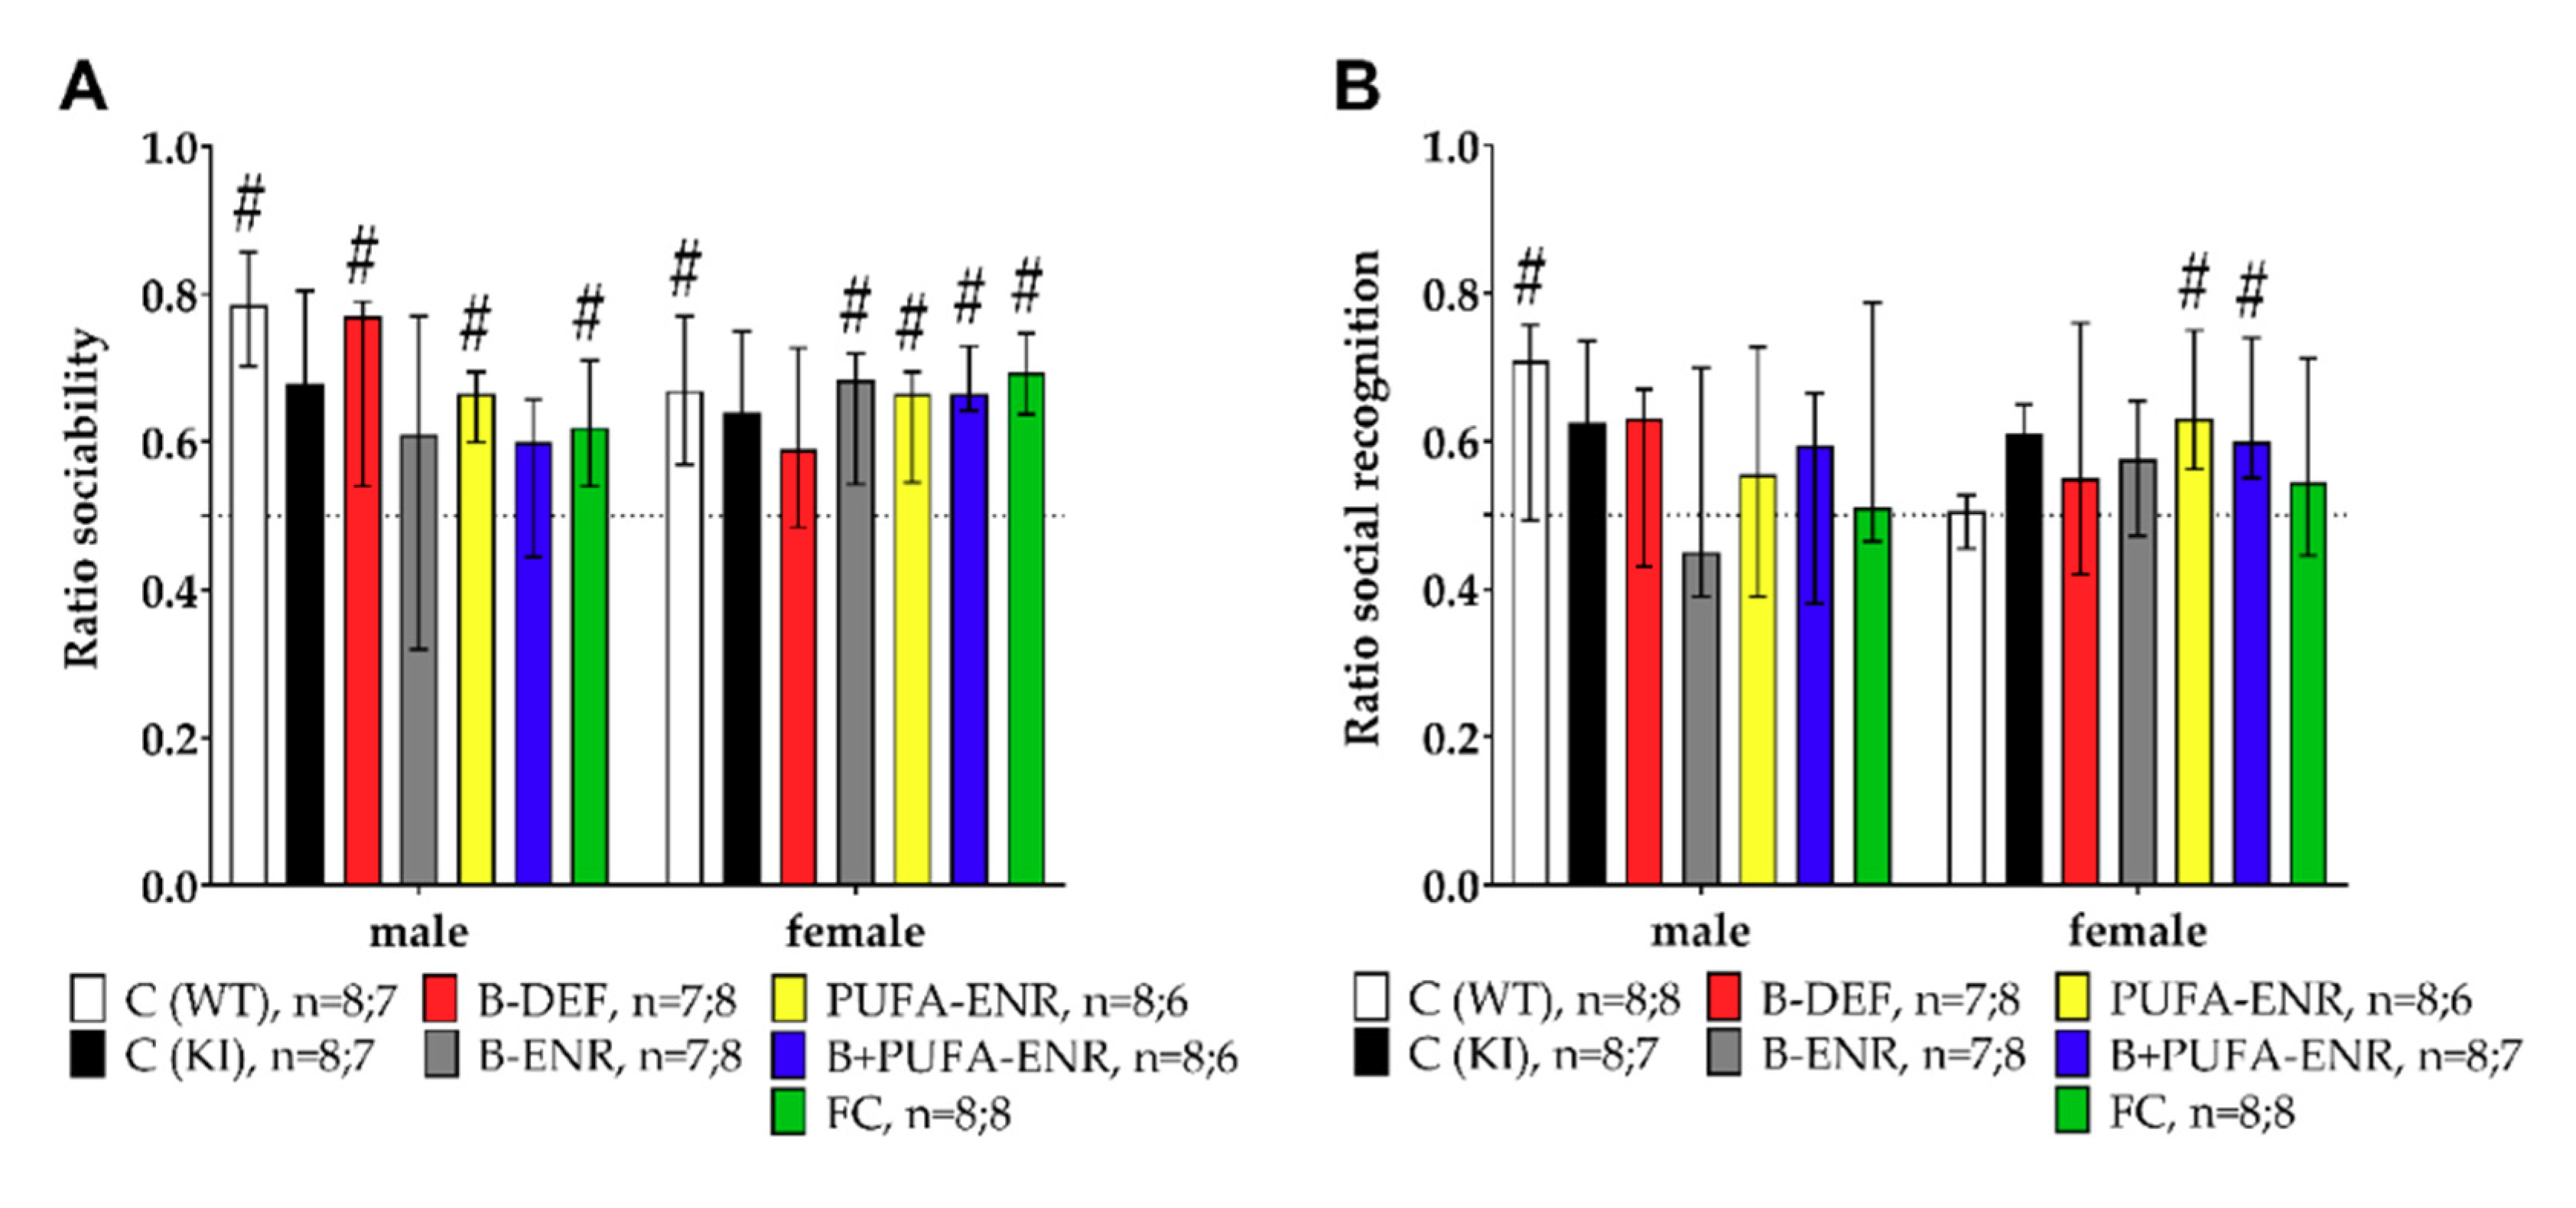
3.5. Social Interaction Test
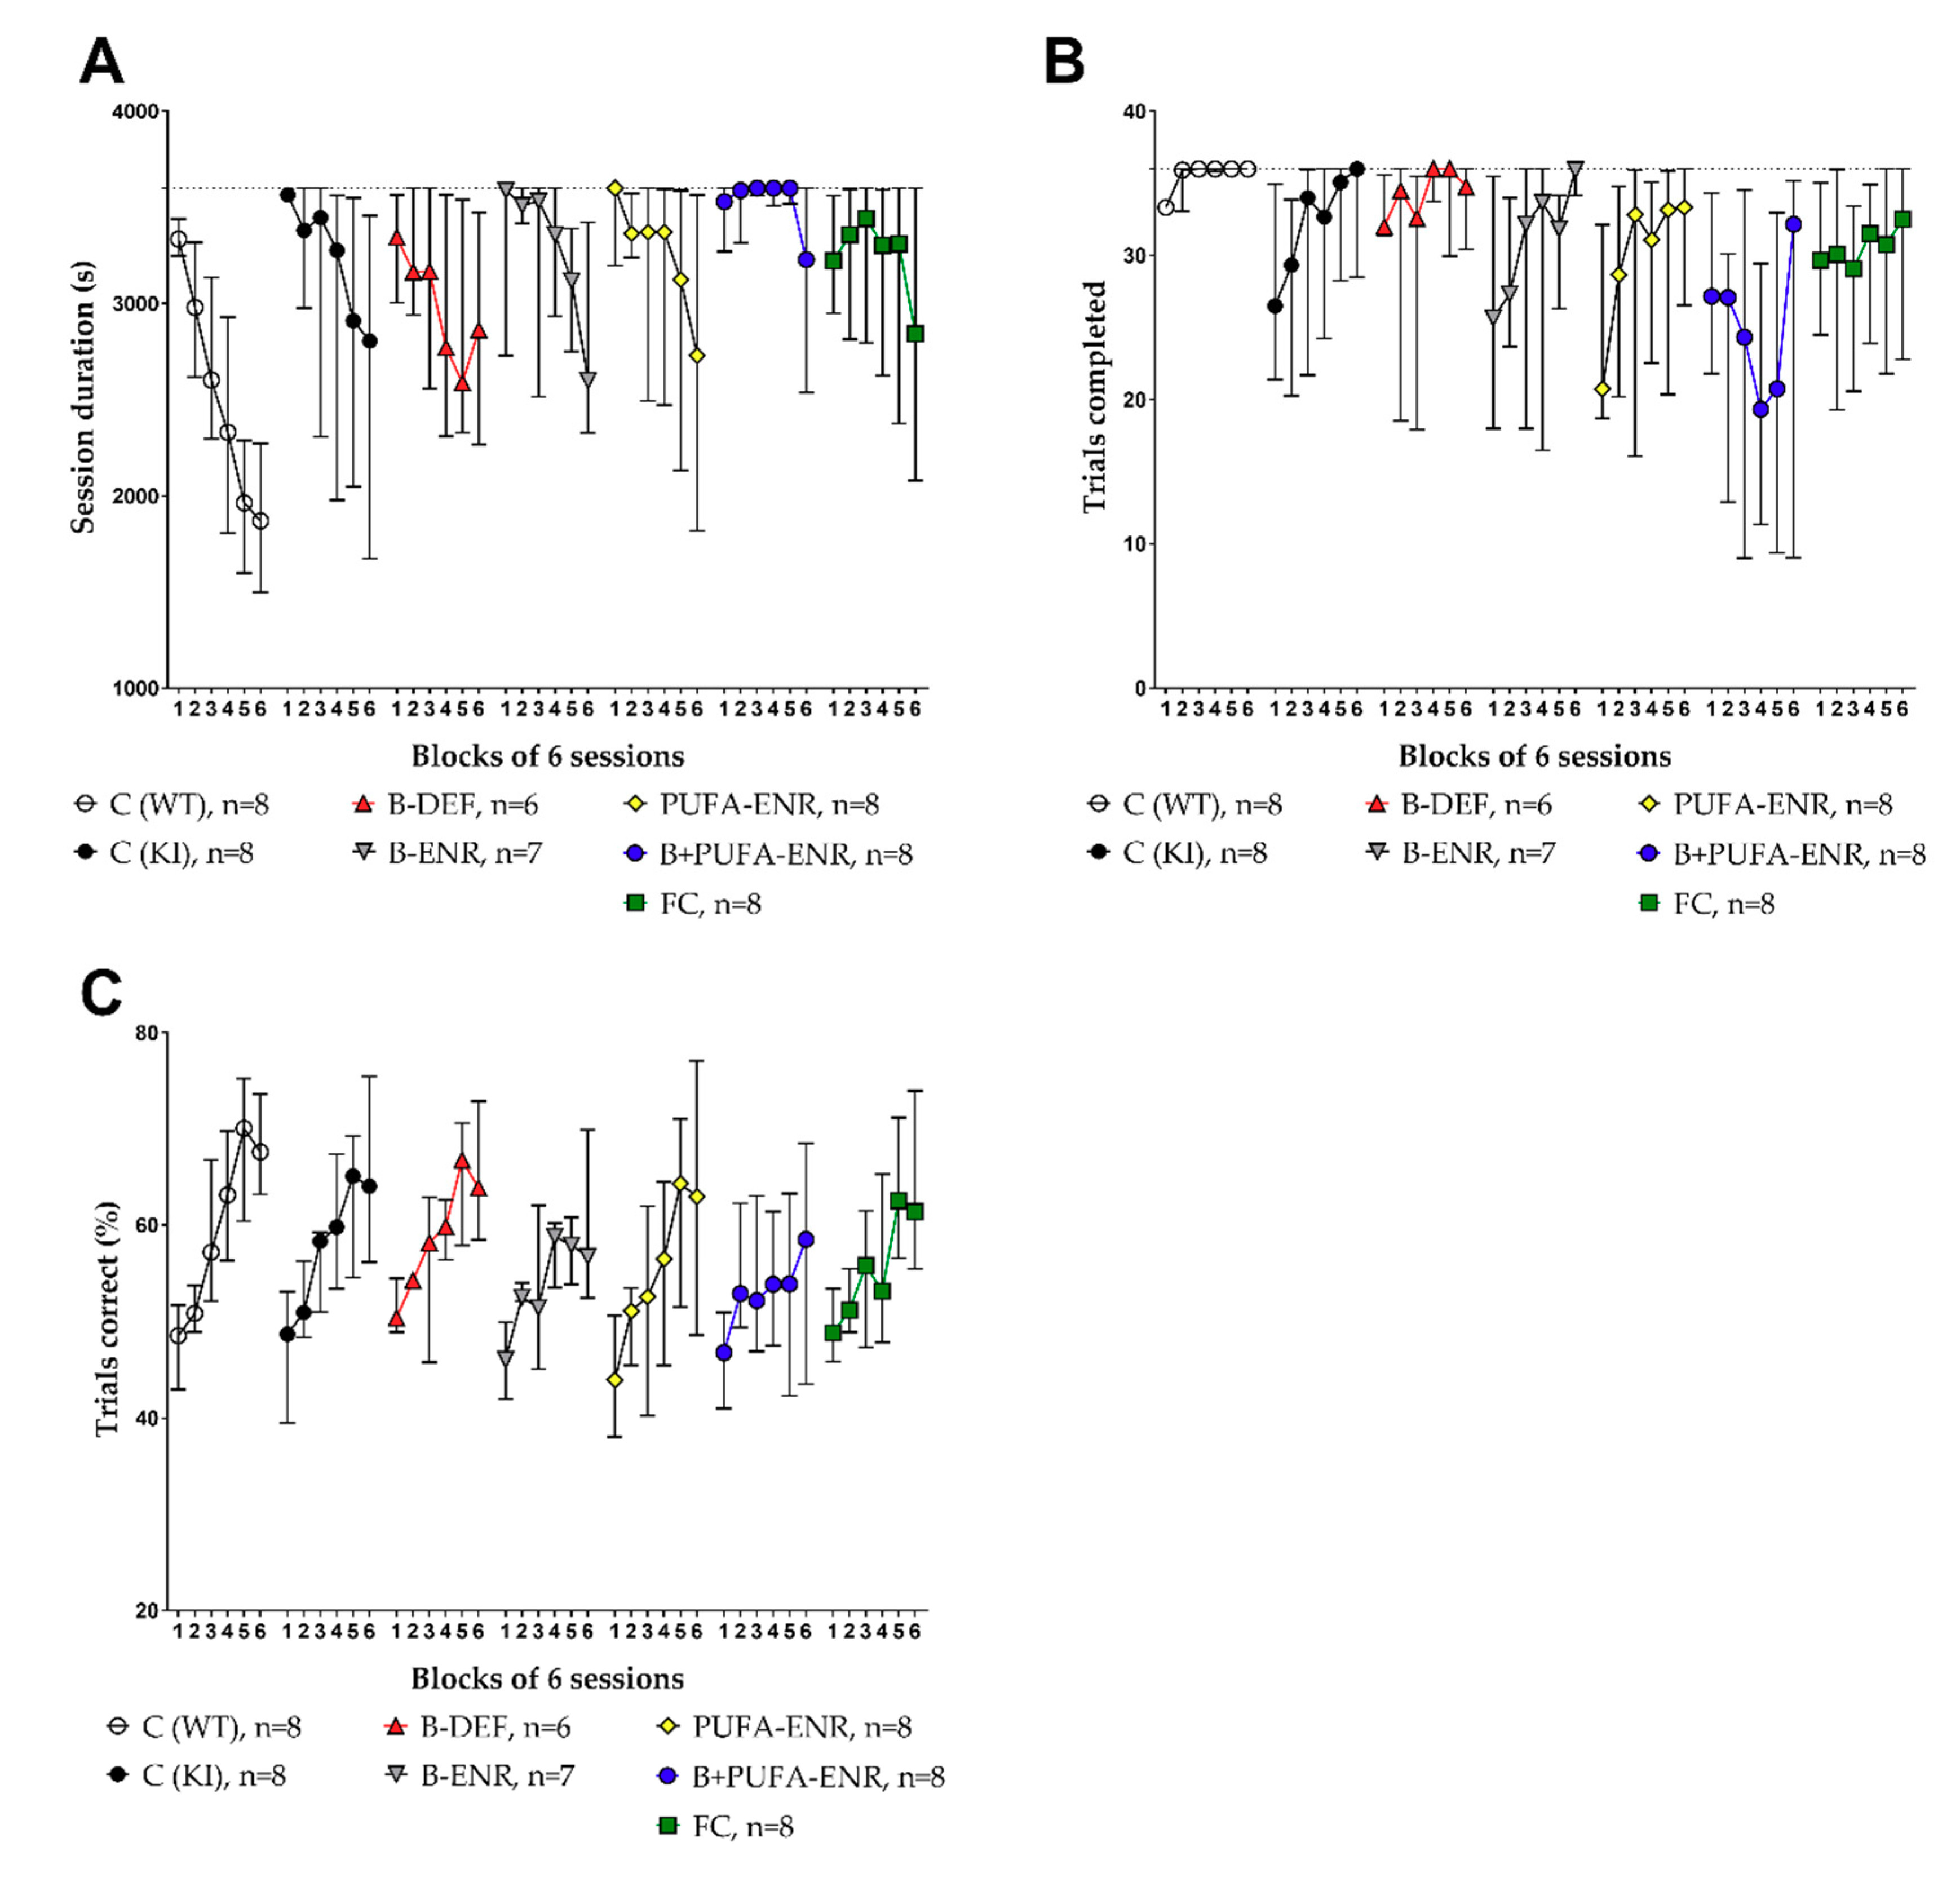
3.6. Paired Associates Learning (PAL) Task
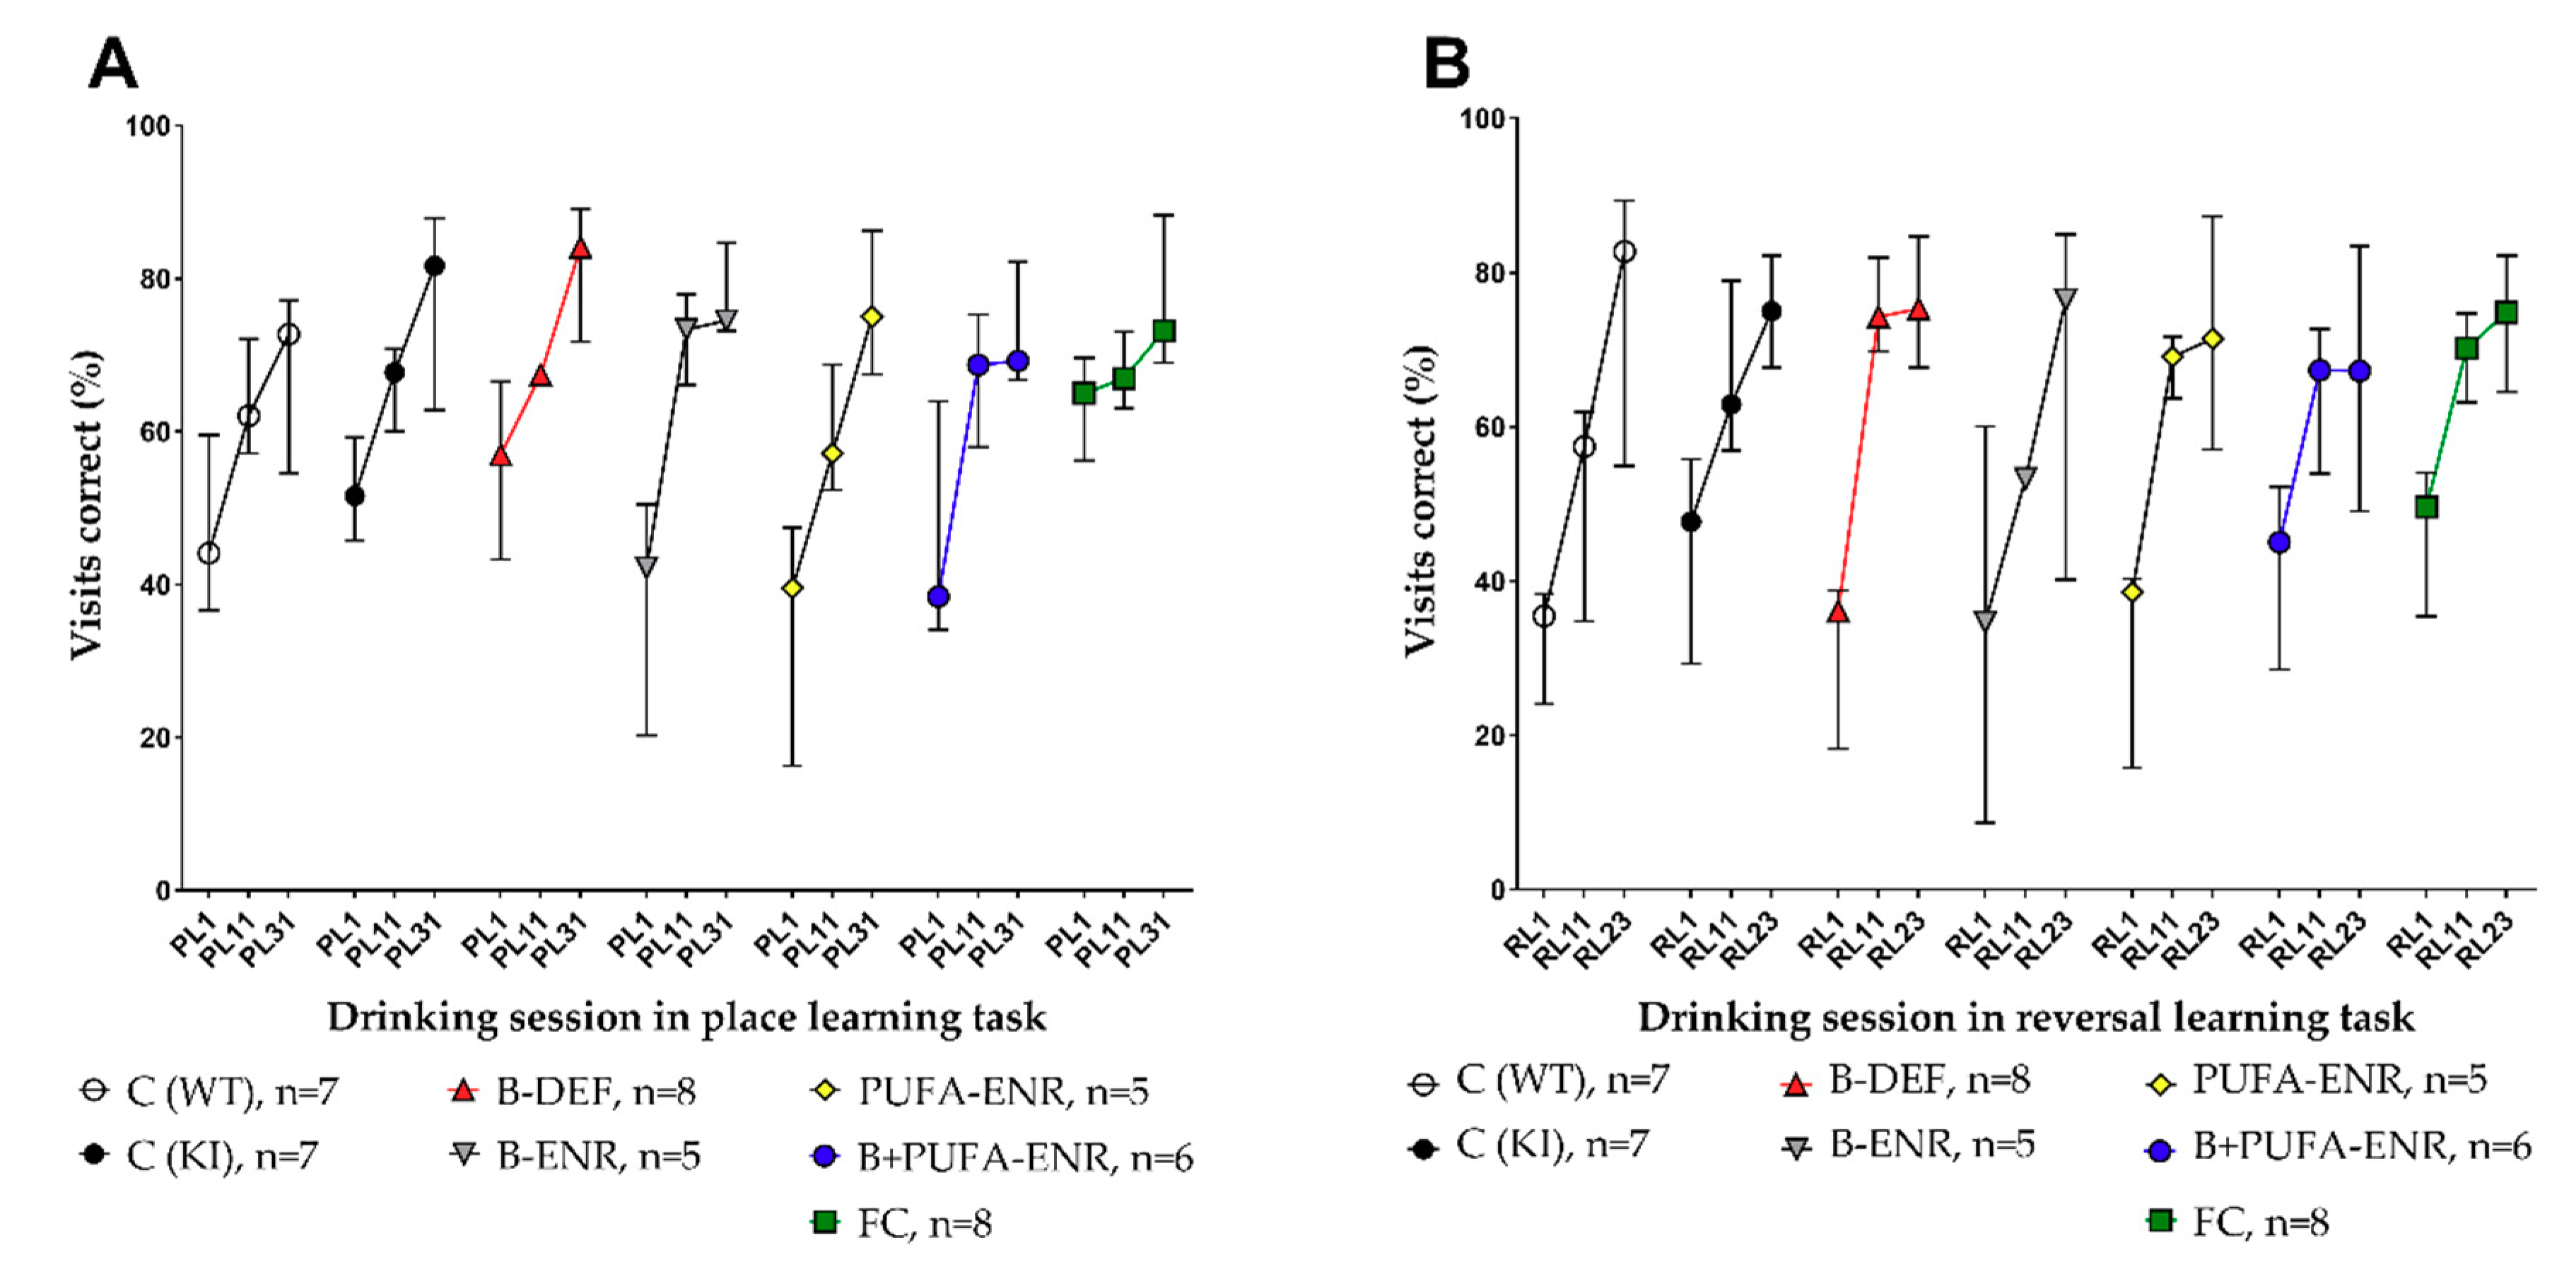
3.7. Place Learning (PL) and Reversal Learning (RL) Task
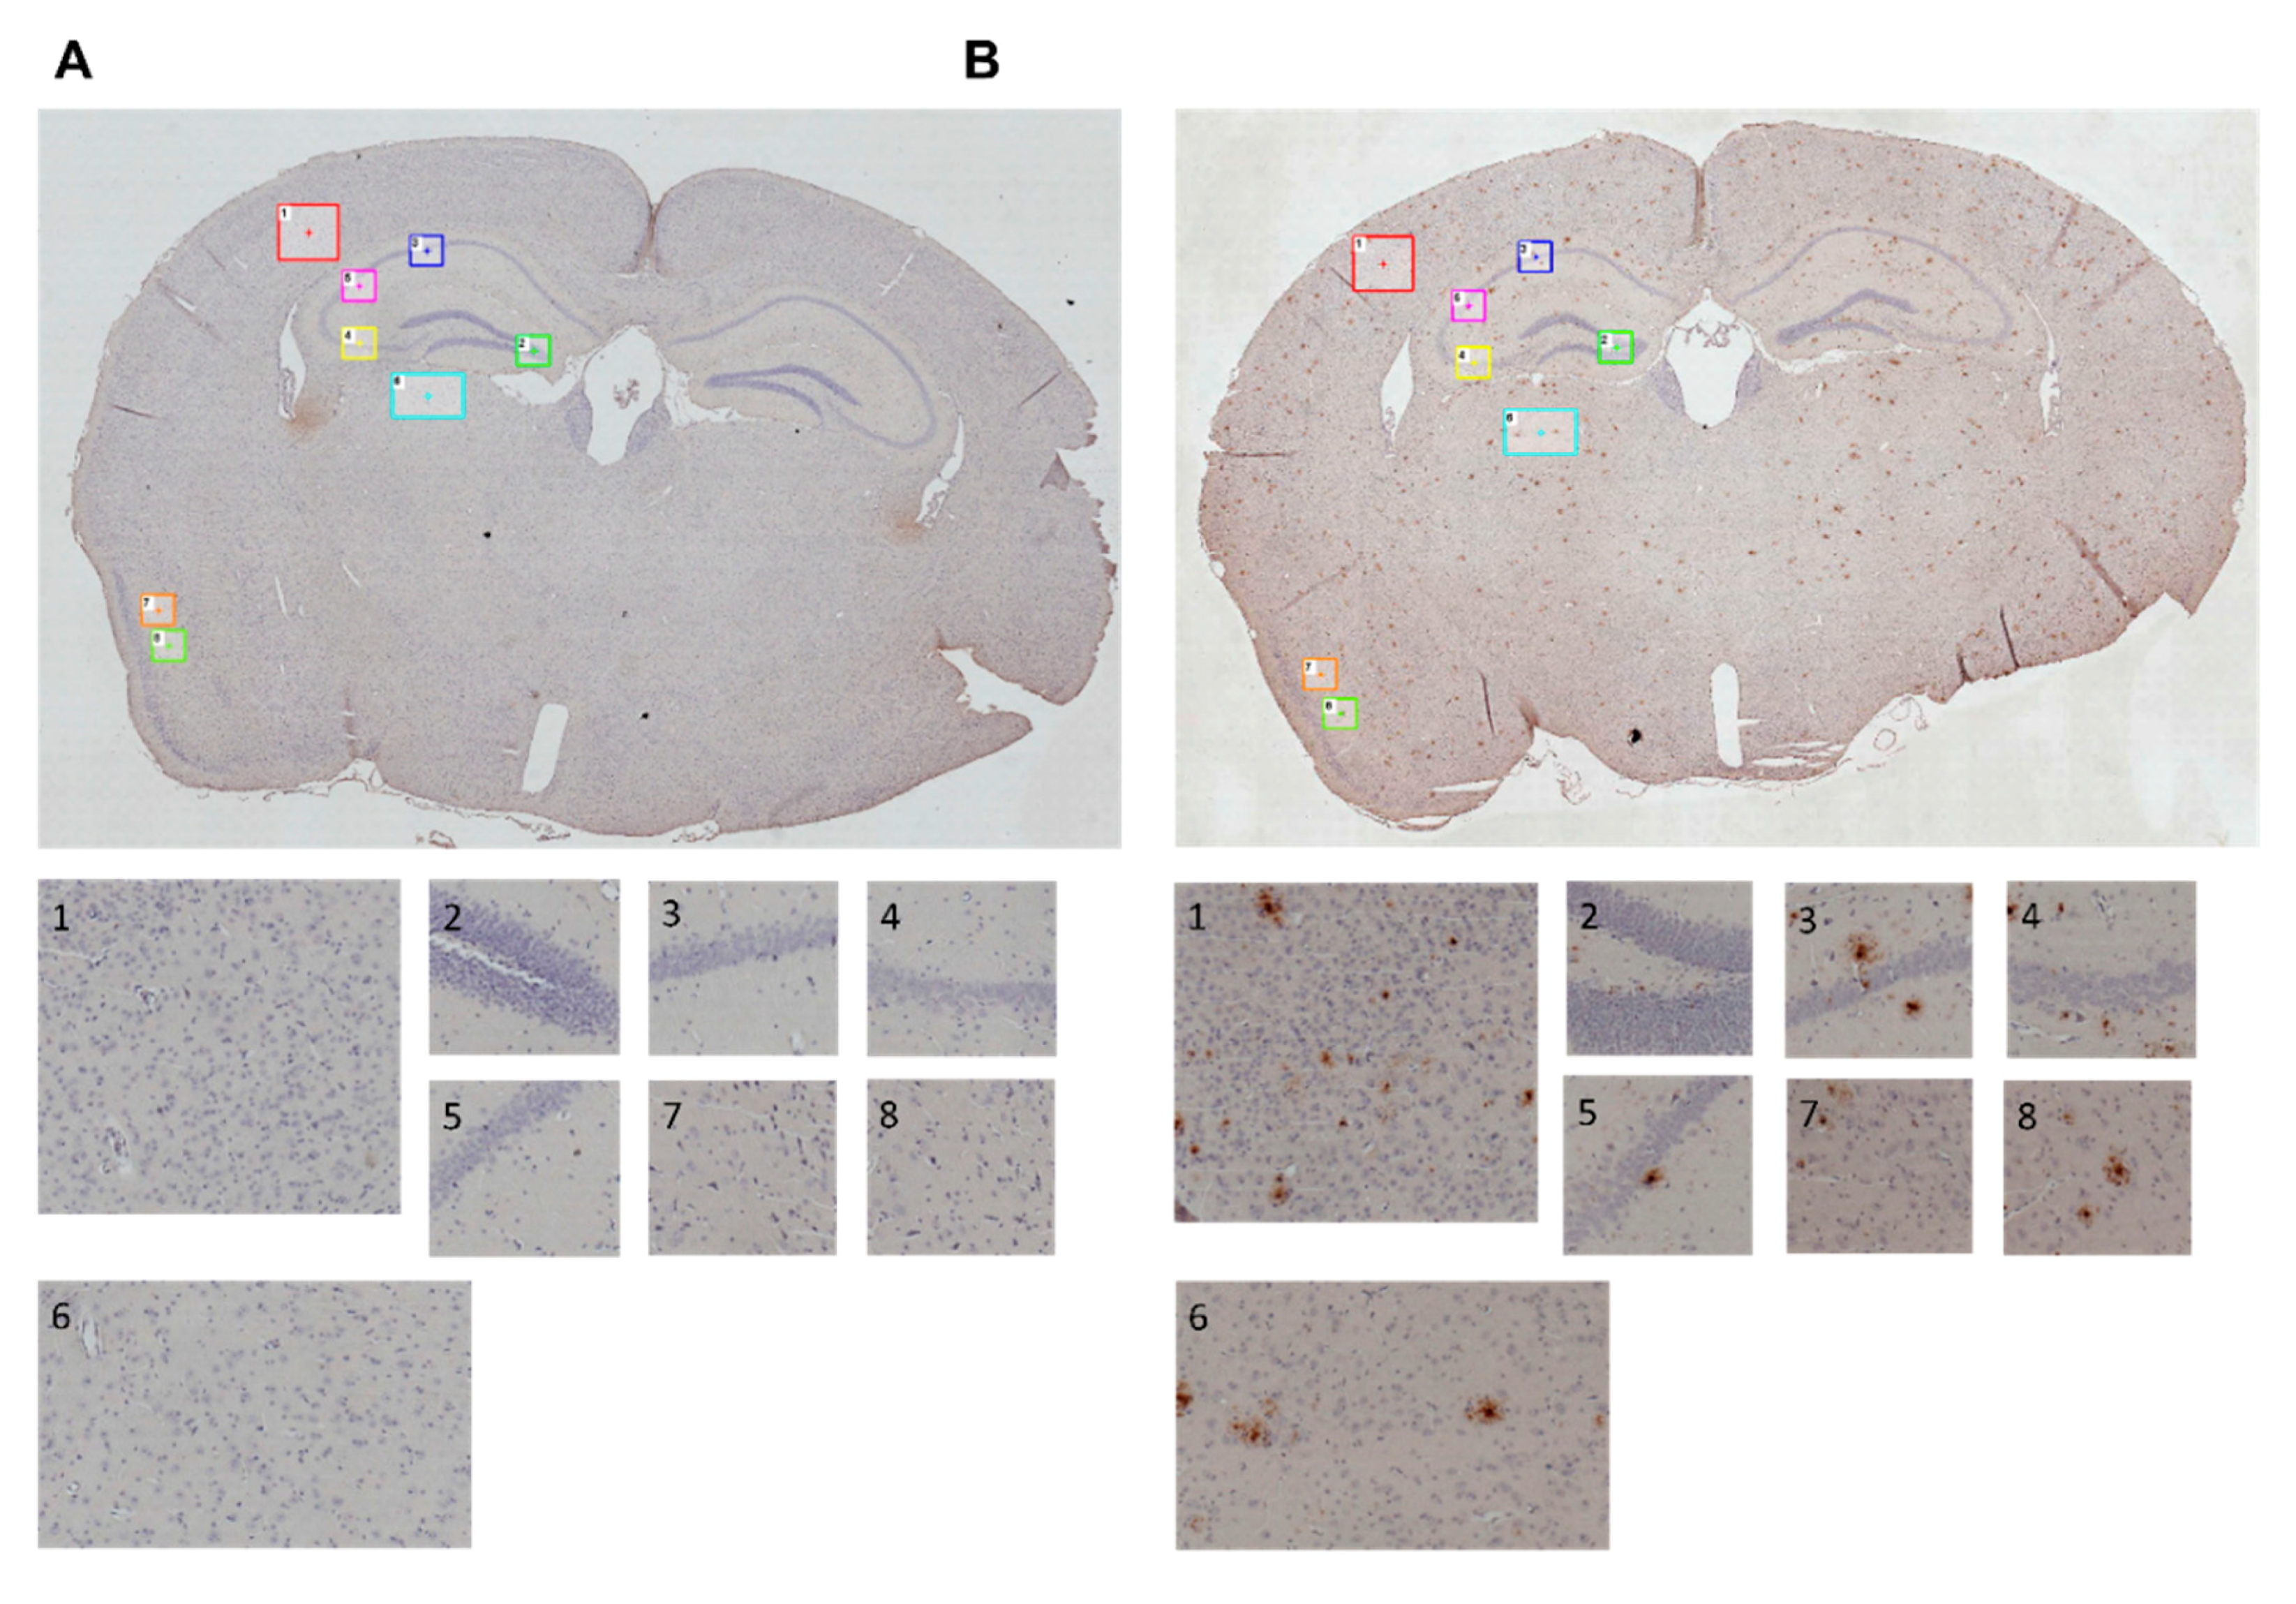
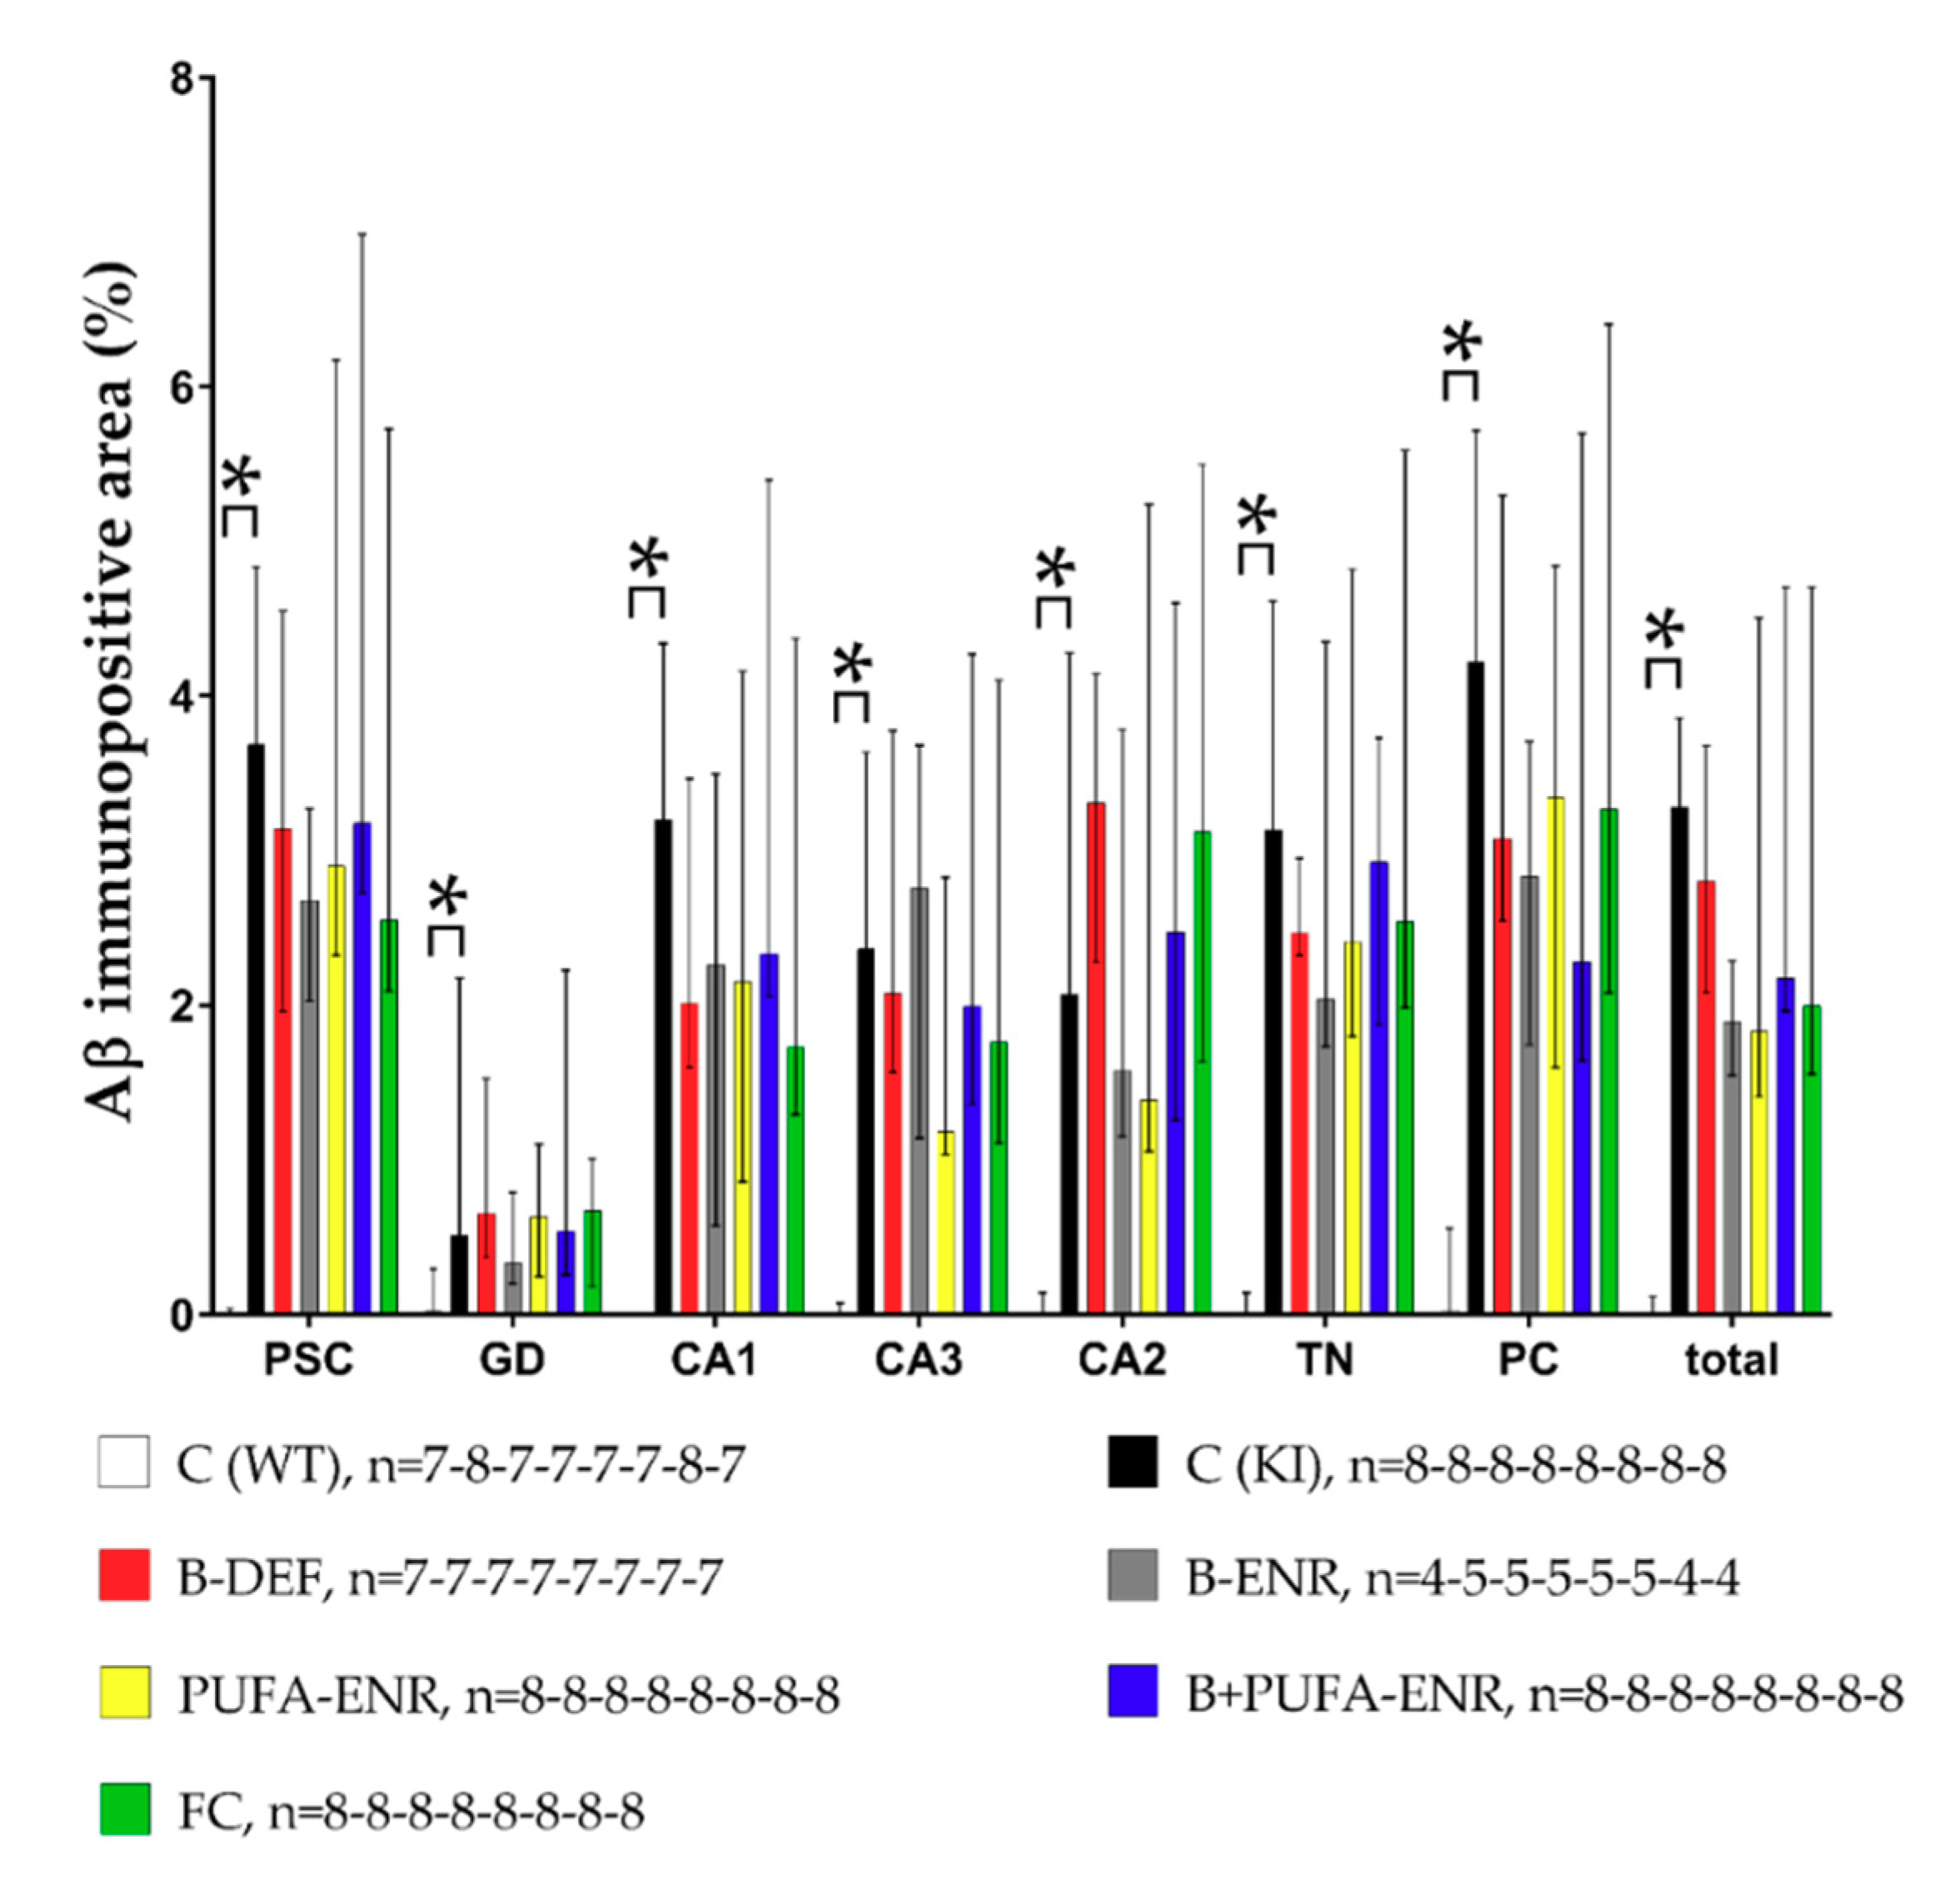
3.8. Immunohistochemical Analysis
4. Discussion
5. Conclusions
Author Contributions
Funding
Acknowledgments
Conflicts of Interest
Appendix A
Animals
Experimental Diets

| Control | B-DEF | B-ENR | PUFA-ENR | B+PUFA-ENR | FC | |
|---|---|---|---|---|---|---|
| Casein | 140.0 | 140.0 | 140.0 | 140.0 | 140.0 | 140.0 |
| Corn starch | 355.6575 | 345.6920 | 355.4795 | 355.6575 | 355.4795 | 328.3386 |
| Maltodextrin | 155.0 | 155.0 | 155.0 | 155.0 | 155.0 | 155.0 |
| Sucrose | 100.0 | 100.0 | 100.0 | 100.0 | 100.0 | 100.0 |
| Dextrose | 100.0 | 100.0 | 100.0 | 100.0 | 100.0 | 100.0 |
| Cellulose | 50.0 | 50.0 | 50.0 | 50.0 | 50.0 | 50.0 |
| Mineral premix | 35.0 | 35.0 | 35.0 | 35.0 | 35.0 | 35.0 |
| Vitamin pre-mix (w/o B-vitamins) | 10.0 | 10.0 | 10.0 | 10.0 | 10.0 | 10.0 |
| Soybean oil | 19.0 | 19.0 | 19.0 | —— | —— | —— |
| Coconut oil | 9.0 | 9.0 | 9.0 | 11.3 | 11.3 | 11.3 |
| Corn oil | 22.0 | 22.0 | 22.0 | 18.7 | 18.7 | 18.7 |
| Fish oil (eicosapentaenoic acid/docosahexaenoic acid = 1:4) | —— | —— | —— | 20.0 | 20.0 | 20.0 |
| L-Cystine | 1.8000 | 1.8000 | 1.8000 | 1.8000 | 1.8000 | 1.8000 |
| Tert-butylhydroquinone | 0.0080 | 0.0080 | 0.0080 | 0.0080 | 0.0080 | 0.0080 |
| Choline bitartrate, 41% | 2.5000 | 2.5000 | 2.5000 | 2.5000 | 2.5000 | 2.5000 |
| Pyridoxine-HCl (Vit. B6) | 0.0070 | —— | 0.1000 | 0.0070 | 0.1000 | 0.0398 |
| Cyanocobalamin, 0.1% (Vit. B12) | 0.0250 | —— | 0.1000 | 0.0250 | 0.1000 | 0.0600 |
| Folic acid, 80% | 0.0025 | —— | 0.0125 | 0.0025 | 0.0125 | 0.0100 |
| Sodium selenite • 5 H2O, 30% | —— | —— | —— | —— | —— | 0.0036 |
| Choline chloride, 43% Choline | —— | —— | —— | —— | 6.9700 | |
| Ascorbic acid, 100% (Vit. C) | —— | —— | —— | —— | —— | 1.6000 |
| DL-a-tocopheryl acetate, 50% (Vit. E) | —— | —— | —— | —— | —— | 4.6500 |
| Uridine monophosphate disodium (24% H2O) | —— | —— | —— | —— | —— | 10.0000 |
| Soy lecithin | —— | —— | —— | —— | —— | 4.0200 |
| Sulfathiazole sodium | —— | 10.0000 | —— | —— | —— | —— |
| Sum | 1000 | 1000 | 1000 | 1000 | 1000 | 1000 |
Open Field
Elevated Zero Maze
Barnes Maze
Social Interaction Test
Paired Associates Learning (PAL) Task
Place Learning (PL) and Reversal Learning (RL) Task
Sample Collection
Biochemical Analysis
Immunohistochemical Analysis
| ROI | Brain Area | Height (µm) |
|---|---|---|
| 1 | Primary somatosensory cortex (PSC) | 500 × 500 |
| 2 | Gyrus dentatus (GD) | 275 × 275 |
| 3 | CA1 | 275 × 275 |
| 4 | CA3 | 275 × 275 |
| 5 | CA2 | 275 × 275 |
| 6 | Thalamic nuclei (TN) | 600 × 400 |
| 7 | Piriform cortex (PC) | 275 × 275 |
| 8 | Piriform cortex (PC) | 275 × 275 |
Preclinical Quality Parameters
References
- World Alzheimer Report 2019: Attitudes to Dementia; Alzheimer’s Disease International: London, UK, 2019.
- Calsolaro, V.; Antognoli, R.; Okoye, C.; Monzani, F. The Use of Antipsychotic Drugs for Treating Behavioral Symptoms in Alzheimer’s Disease. Front. Pharmacol. 2019, 10, 1465. [Google Scholar] [CrossRef] [PubMed]
- Sasaguri, H.; Nilsson, P.; Hashimoto, S.; Nagata, K.; Saito, T.; De Strooper, B.; Hardy, J.; Vassar, R.; Winblad, B.; Saido, T.C. APP mouse models for Alzheimer’s disease preclinical studies. EMBO J. 2017, 36, e201797397. [Google Scholar] [CrossRef] [PubMed]
- Hara, Y.; McKeehan, N.; Fillit, H.M. Translating the biology of aging into novel therapeutics for Alzheimer disease. Neurology 2019, 92, 84–93. [Google Scholar] [CrossRef] [PubMed]
- Sharma, P.; Srivastava, P.; Seth, A.; Tripathi, P.N.; Banerjee, A.G.; Shrivastava, S.K. Comprehensive review of mechanisms of pathogenesis involved in Alzheimer’s disease and potential therapeutic strategies. Prog. Neurobiol. 2019, 174, 53–89. [Google Scholar] [CrossRef] [PubMed]
- Masters, C.L.; Simms, G.; Weinman, N.A.; Multhaup, G.; McDonald, B.L.; Beyreuther, K. Amyloid plaque core protein in Alzheimer disease and Down syndrome. Proc. Natl. Acad. Sci. USA 1985, 82, 4245–4249. [Google Scholar] [CrossRef] [PubMed]
- Selkoe, D.J.; Hardy, J. The amyloid hypothesis of Alzheimer’s disease at 25 years. EMBO Mol. Med. 2016. [Google Scholar] [CrossRef]
- Bateman, R.J.; Xiong, C.; Benzinger, T.L.S.; Fagan, A.M.; Goate, A.; Fox, N.C.; Marcus, D.S.; Cairns, N.J.; Xie, X.; Blazey, T.M.; et al. Clinical and Biomarker Changes in Dominantly Inherited Alzheimer’s Disease. N. Engl. J. Med. 2012, 367, 795–804. [Google Scholar] [CrossRef]
- Saito, T.; Matsuba, Y.; Mihira, N.; Takano, J.; Nilsson, P.; Itohara, S.; Iwata, N.; Saido, T.C. Single App knock-in mouse models of Alzheimer’s disease. Nat. Neurosci. 2014, 17, 661–663. [Google Scholar] [CrossRef]
- Zhao, G.; He, F.; Wu, C.; Li, P.; Li, N.; Deng, J.; Zhu, G.; Ren, W.; Peng, Y. Betaine in Inflammation: Mechanistic Aspects and Applications. Front. Immunol. 2018, 9, 1–13. [Google Scholar] [CrossRef]
- Clarke, R.; Smith, A.D.; Jobst, K.A.; Refsum, H.; Sutton, L.; Ueland, P.M. Folate, Vitamin B12, and Serum Total Homocysteine Levels in Confirmed Alzheimer Disease. Arch. Neurol. 1998, 55, 1449. [Google Scholar] [CrossRef]
- Isobe, C.; Murata, T.; Sato, C.; Terayama, Y. Increase of total homocysteine concentration in cerebrospinal fluid in patients with Alzheimer’s disease and Parkinson’s disease. Life Sci. 2005, 77, 1836–1843. [Google Scholar] [CrossRef] [PubMed]
- Seshadri, S.; Beiser, A.; Selhub, J.; Jaques, P.; Roseberg, I.H.; D’Agostino, R.B.; Wilson, P.W.F.; Wolf, P.A. Plasma Homocysteine As a Risk Factor for Dementia and Alzheimer’s Disease. N. Engl. J. Med. 2002, 346, 476–483. [Google Scholar] [CrossRef] [PubMed]
- Nurk, E.; Refsum, H.; Tell, G.S.; Engedal, K.; Vollset, S.E.; Ueland, P.M.; Nygaard, H.A.; Smith, A.D. Plasma total homocysteine and memory in the elderly: The Hordaland homocysteine study. Ann. Neurol. 2005, 58, 847–857. [Google Scholar] [CrossRef] [PubMed]
- Morris, M.S. Homocysteine and Alzheimer’s disease. Lancet Neurol. 2003, 2, 425–428. [Google Scholar] [CrossRef]
- Smith, A.D.; Smith, S.M.; de Jager, C.A.; Whitbread, P.; Johnston, C.; Agacinski, G.; Oulhaj, A.; Bradley, K.M.; Jacoby, R.; Refsum, H. Homocysteine-Lowering by B Vitamins Slows the Rate of Accelerated Brain Atrophy in Mild Cognitive Impairment: A Randomized Controlled Trial. PLoS ONE 2010, 5, e12244. [Google Scholar] [CrossRef]
- Douaud, G.; Refsum, H.; de Jager, C.A.; Jacoby, R.; Nichols, T.E.; Smith, S.M.; Smith, A.D. Preventing Alzheimer’s disease-related gray matter atrophy by B-vitamin treatment. Proc. Natl. Acad. Sci. USA 2013, 110, 9523–9528. [Google Scholar] [CrossRef]
- Kennedy, D. B Vitamins and the Brain: Mechanisms, Dose and Efficacy—A Review. Nutrients 2016, 8, 68. [Google Scholar] [CrossRef]
- McMahon, J.A.; Green, T.J.; Skeaff, C.M.; Knight, R.G.; Mann, J.I.; Williams, S.M. A Controlled Trial of Homocysteine Lowering and Cognitive Performance. N. Engl. J. Med. 2006, 354, 2764–2772. [Google Scholar] [CrossRef]
- Tabet, N.; Rafi, H.; Weaving, G.; Lyons, B.; Iversen, S.A. Behavioural and psychological symptoms of Alzheimer type dementia are not correlated with plasma homocysteine concentration. Dement. Geriatr. Cogn. Disord. 2006, 22, 432–438. [Google Scholar] [CrossRef]
- Wald, D.S.; Kasturiratne, A.; Simmonds, M. Effect of Folic Acid, with or without Other B Vitamins, on Cognitive Decline: Meta-Analysis of Randomized Trials. Am. J. Med. 2010, 123, 522–527.e2. [Google Scholar] [CrossRef]
- Clarke, R.; Bennett, D.; Parish, S.; Lewington, S.; Skeaff, M.; Eussen, S.J.P.M.; Lewerin, C.; Stott, D.J.; Armitage, J.; Hankey, G.J.; et al. Effects of homocysteine lowering with B vitamins on cognitive aging: Meta-analysis of 11 trials with cognitive data on 22,000 individuals. Am. J. Clin. Nutr. 2014, 100, 657–666. [Google Scholar] [CrossRef]
- Smith, A.D.; Refsum, H.; Bottiglieri, T.; Fenech, M.; Hooshmand, B.; McCaddon, A.; Miller, J.W.; Rosenberg, I.H.; Obeid, R. Homocysteine and Dementia: An International Consensus Statement. J. Alzheimers Dis. 2018, 62, 561–570. [Google Scholar] [CrossRef] [PubMed]
- Smith, A.D.; Refsum, H. Homocysteine, B Vitamins, and Cognitive Impairment. Annu. Rev. Nutr. 2016, 36, 211–239. [Google Scholar] [CrossRef] [PubMed]
- Grimm, M.O.W.; Michaelson, D.M.; Hartmann, T. Omega-3 fatty acids, lipids, and apoE lipidation in Alzheimer’s disease: A rationale for multi-nutrient dementia prevention. J. Lipid Res. 2017, 58, 2083–2101. [Google Scholar] [CrossRef]
- Oulhaj, A.; Jernerén, F.; Refsum, H.; Smith, A.D.; de Jager, C.A. Omega-3 Fatty Acid Status Enhances the Prevention of Cognitive Decline by B Vitamins in Mild Cognitive Impairment. J. Alzheimers Dis. 2016, 50, 547–557. [Google Scholar] [CrossRef]
- McCleery, J.; Abraham, R.P.; Denton, D.A.; Rutjes, A.W.S.; Chong, L.-Y.; Al-Assaf, A.S.; Griffith, D.J.; Rafeeq, S.; Yaman, H.; Malik, M.A.; et al. Vitamin and mineral supplementation for preventing dementia or delaying cognitive decline in people with mild cognitive impairment. Cochrane Database Syst. Rev. 2018, 2018. [Google Scholar] [CrossRef] [PubMed]
- Diaz-Arrastia, R. Homocysteine and Neurologic Disease. Arch. Neurol. 2000, 57, 1422–1428. [Google Scholar] [CrossRef]
- Obeid, R.; Herrmann, W. Mechanisms of homocysteine neurotoxicity in neurodegenerative diseases with special reference to dementia. FEBS Lett. 2006, 580, 2994–3005. [Google Scholar] [CrossRef]
- Lipton, S.A.; Kim, W.-K.; Choi, Y.-B.; Kumar, S.; D’Emilia, D.M.; Rayudu, P.V.; Arnelle, D.R.; Stamler, J.S. Neurotoxicity associated with dual actions of homocysteine at the N-methyl-D-aspartate receptor. Proc. Natl. Acad. Sci. USA 1997, 94, 5923–5928. [Google Scholar] [CrossRef]
- Kim, J.P.; Koh, J.; Choi, D.W. l-Homocysteate is a potent neurotoxin on cultured cortical neurons. Brain Res. 1987, 437, 103–110. [Google Scholar] [CrossRef]
- Sommer, S.; Hunzinger, C.; Schillo, S.; Klemm, M.; Biefang-Arndt, K.; Schwall, G.; Pütter, S.; Hoelzer, K.; Schroer, K.; Stegmann, W.; et al. Molecular Analysis of Homocysteic Acid-Induced Neuronal Stress. J. Proteome Res. 2004, 3, 572–581. [Google Scholar] [CrossRef] [PubMed]
- Görtz, P.; Hoinkes, A.; Fleischer, W.; Otto, F.; Schwahn, B.; Wendel, U.; Siebler, M. Implications for hyperhomocysteinemia: Not homocysteine but its oxidized forms strongly inhibit neuronal network activity. J. Neurol. Sci. 2004, 218, 109–114. [Google Scholar] [CrossRef] [PubMed]
- Vladychenskaya, E.A.; Tyulina, O.V.; Boldyrev, A.A. Effect of Homocysteine and Homocysteic Acid on Glutamate Receptors on Rat Lymphocytes. Bull. Exp. Biol. Med. Vol. 2006, 142, 47–50. [Google Scholar] [CrossRef]
- Jansen, D.; Zerbi, V.; Arnoldussen, I.A.C.; Wiesmann, M.; Rijpma, A.; Fang, X.T.; Dederen, P.J.; Mutsaers, M.P.C.; Broersen, L.M.; Lütjohann, D.; et al. Effects of Specific Multi-Nutrient Enriched Diets on Cerebral Metabolism, Cognition and Neuropathology in AβPPswe-PS1dE9 Mice. PLoS ONE 2013, 8, e75393. [Google Scholar] [CrossRef] [PubMed]
- Gurke, R.; Schmidt, D.; Thomas, D.; Fleck, S.C.; Geisslinger, G.; Ferreirós, N. A validated LC–MS/MS method for the determination of homocysteic acid in biological samples. J. Pharm. Biomed. Anal. 2019, 174, 578–587. [Google Scholar] [CrossRef]
- Bolivar, V.J. Intrasession and intersession habituation in mice: From inbred strain variability to linkage analysis. Neurobiol. Learn. Mem. 2009, 92, 206–214. [Google Scholar] [CrossRef]
- Gawel, K.; Gibula, E.; Marszalek-Grabska, M.; Filarowska, J.; Kotlinska, J.H. Assessment of spatial learning and memory in the Barnes maze task in rodents—Methodological consideration. Naunyn. Schmiedebergs. Arch. Pharmacol. 2019, 392, 1–18. [Google Scholar] [CrossRef]
- Kaidanovich-Beilin, O.; Lipina, T.; Vukobradovic, I.; Roder, J.; Woodgett, J.R. Assessment of Social Interaction Behaviors. J. Vis. Exp. 2011, 2473. [Google Scholar] [CrossRef]
- Moy, S.S.; Nadler, J.J.; Perez, A.; Barbaro, R.P.; Johns, J.M.; Magnuson, T.R.; Piven, J.; Crawley, J.N. Sociability and preference for social novelty in five inbred strains: An approach to assess autistic-like behavior in mice. Genes Brain Behav. 2004, 3, 287–302. [Google Scholar] [CrossRef]
- Nithianantharajah, J.; McKechanie, A.G.; Stewart, T.J.; Johnstone, M.; Blackwood, D.H.; St Clair, D.; Grant, S.G.N.; Bussey, T.J.; Saksida, L.M. Bridging the translational divide: Identical cognitive touchscreen testing in mice and humans carrying mutations in a disease-relevant homologous gene. Sci. Rep. 2015, 5, 14613. [Google Scholar] [CrossRef]
- Jacob, S.; Davies, G.; De Bock, M.; Hermans, B.; Wintmolders, C.; Bottelbergs, A.; Borgers, M.; Theunis, C.; Van Broeck, B.; Manyakov, N.V.; et al. Neural oscillations during cognitive processes in an App knock-in mouse model of Alzheimer’s disease pathology. Sci. Rep. 2019, 9, 16363. [Google Scholar] [CrossRef]
- Voikar, V.; Krackow, S.; Lipp, H.-P.; Rau, A.; Colacicco, G.; Wolfer, D.P. Automated dissection of permanent effects of hippocampal or prefrontal lesions on performance at spatial, working memory and circadian timing tasks of C57BL/6 mice in IntelliCage. Behav. Brain Res. 2018, 352, 8–22. [Google Scholar] [CrossRef]
- Krackow, S.; Vannoni, E.; Codita, A.; Mohammed, A.H.; Cirulli, F.; Branchi, I.; Alleva, E.; Reichelt, A.; Willuweit, A.; Voikar, V.; et al. Consistent behavioral phenotype differences between inbred mouse strains in the IntelliCage. Genes Brain Behav. 2010, 9, 722–731. [Google Scholar] [CrossRef] [PubMed]
- Agrawal, A.; Ilango, K.; Singh, P.K.; Karmakar, D.; Singh, G.P.I.; Kumari, R.; Dubey, G.P. Age dependent levels of plasma homocysteine and cognitive performance. Behav. Brain Res. 2015, 283, 139–144. [Google Scholar] [CrossRef]
- Zahs, K.R.; Ashe, K.H. ‘Too much good news’—Are Alzheimer mouse models trying to tell us how to prevent, not cure, Alzheimer’s disease? Trends Neurosci. 2010, 33, 381–389. [Google Scholar] [CrossRef] [PubMed]
- Perneczky, R.; Drzezga, A.; Diehl-Schmid, J.; Li, Y.; Kurz, A. Gender differences in brain reserve. J. Neurol. 2007, 254, 1395–1400. [Google Scholar] [CrossRef] [PubMed]
- Mielke, M.; Vemuri, P.; Rocca, W. Clinical epidemiology of Alzheimer’ disease: Assessing sex and gender differences. Clin. Epidemiol. 2014, 6, 37–48. [Google Scholar] [CrossRef] [PubMed]
- Sakakibara, Y.; Sekiya, M.; Saito, T.; Saido, T.C.; Iijima, K.M. Amyloid-β plaque formation and reactive gliosis are required for induction of cognitive deficits in App knock-in mouse models of Alzheimer’s disease. BMC Neurosci. 2019, 20, 13. [Google Scholar] [CrossRef]
- Mehla, J.; Lacoursiere, S.G.; Lapointe, V.; McNaughton, B.L.; Sutherland, R.J.; McDonald, R.J.; Mohajerani, M.H. Age-dependent behavioral and biochemical characterization of single APP knock-in mouse (APPNL-G-F/NL-G-F) model of Alzheimer’s disease. Neurobiol. Aging 2019, 75, 25–37. [Google Scholar] [CrossRef]
- Latif-Hernandez, A.; Shah, D.; Craessaerts, K.; Saido, T.; Saito, T.; De Strooper, B.; Van der Linden, A.; D’Hooge, R. Subtle behavioral changes and increased prefrontal-hippocampal network synchronicity in APPNL−G−F mice before prominent plaque deposition. Behav. Brain Res. 2019, 364, 431–441. [Google Scholar] [CrossRef]
- Whyte, L.S.; Hemsley, K.M.; Lau, A.A.; Hassiotis, S.; Saito, T.; Saido, T.C.; Hopwood, J.J.; Sargeant, T.J. Reduction in open field activity in the absence of memory deficits in the App NL−G−F knock-in mouse model of Alzheimer’s disease. Behav. Brain Res. 2018, 336, 177–181. [Google Scholar] [CrossRef] [PubMed]
- Sakakibara, Y.; Sekiya, M.; Saito, T.; Saido, T.C.; Iijima, K.M. Cognitive and emotional alterations in App knock-in mouse models of Aβ amyloidosis. BMC Neurosci. 2018, 19, 46. [Google Scholar] [CrossRef]
- Masuda, A.; Kobayashi, Y.; Kogo, N.; Saito, T.; Saido, T.C.; Itohara, S. Cognitive deficits in single App knock-in mouse models. Neurobiol. Learn. Mem. 2016, 135, 73–82. [Google Scholar] [CrossRef] [PubMed]
- Jankowsky, J.L.; Zheng, H. Practical considerations for choosing a mouse model of Alzheimer’s disease. Mol. Neurodegener. 2017, 12, 89. [Google Scholar] [CrossRef]
- Sudduth, T.L.; Powell, D.K.; Smith, C.D.; Greenstein, A.; Wilcock, D.M. Induction of Hyperhomocysteinemia Models Vascular Dementia by Induction of Cerebral Microhemorrhages and Neuroinflammation. J. Cereb. Blood Flow Metab. 2013, 33, 708–715. [Google Scholar] [CrossRef] [PubMed]
- Teri, L.; Ferretti, L.E.; Gibbons, L.E.; Logsdon, R.G.; McCurry, S.M.; Kukull, W.A.; McCormick, W.C.; Bowen, J.D.; Larson, E.B. Anxiety in Alzheimer’s Disease: Prevalence and Comorbidity. J. Gerontol. Ser. A Biol. Sci. Med. Sci. 1999, 54, M348–M352. [Google Scholar] [CrossRef]
- Fuso, A.; Nicolia, V.; Cavallaro, R.A.; Ricceri, L.; D’Anselmi, F.; Coluccia, P.; Calamandrei, G.; Scarpa, S. B-vitamin deprivation induces hyperhomocysteinemia and brain S-adenosylhomocysteine, depletes brain S-adenosylmethionine, and enhances PS1 and BACE expression and amyloid-β deposition in mice. Mol. Cell. Neurosci. 2008, 37, 731–746. [Google Scholar] [CrossRef] [PubMed]
- Zhang, C.-E.; Wei, W.; Liu, Y.-H.; Peng, J.-H.; Tian, Q.; Liu, G.-P.; Zhang, Y.; Wang, J.-Z. Hyperhomocysteinemia Increases β-Amyloid by Enhancing Expression of γ-Secretase and Phosphorylation of Amyloid Precursor Protein in Rat Brain. Am. J. Pathol. 2009, 174, 1481–1491. [Google Scholar] [CrossRef]
- Kruman, I.I.; Kumaravel, T.S.; Lohani, A.; Pedersen, W.A.; Cutler, R.G.; Kruman, Y.; Haughey, N.; Lee, J.; Evans, M.; Mattson, M.P. Folic acid deficiency and homocysteine impair DNA repair in hippocampal neurons and sensitize them to amyloid toxicity in experimental models of Alzheimer’s disease. J. Neurosci. 2002, 22, 1752–1762. [Google Scholar] [CrossRef]
- Bernardo, A.; McCord, M.; Troen, A.M.; Allison, J.D.; McDonald, M.P. Impaired spatial memory in APP-overexpressing mice on a homocysteinemia-inducing diet. Neurobiol. Aging 2007, 28, 1195–1205. [Google Scholar] [CrossRef]
- Troen, A.M.; Shea-Budgell, M.; Shukitt-Hale, B.; Smith, D.E.; Selhub, J.; Rosenberg, I.H. B-vitamin deficiency causes hyperhomocysteinemia and vascular cognitive impairment in mice. Proc. Natl. Acad. Sci. USA 2008, 105, 12474–12479. [Google Scholar] [CrossRef]
- Bespalov, A.; Steckler, T.; Skolnick, P. Be positive about negatives–recommendations for the publication of negative (or null) results. Eur. Neuropsychopharmacol. 2019, 29, 1312–1320. [Google Scholar] [CrossRef] [PubMed]
- Refsum, H.; Smith, A.D.; Ueland, P.M.; Nexo, E.; Clarke, R.; McPartlin, J.; Johnston, C.; Engbaek, F.; Schneede, J.; McPartlin, C.; et al. Facts and Recommendations about Total Homocysteine Determinations: An Expert Opinion. Clin. Chem. 2004, 50, 3–32. [Google Scholar] [CrossRef] [PubMed]
- Sinha, M.; Saha, A.; Basu, S.; Pal, K.; Chakrabarti, S. Aging and antioxidants modulate rat brain levels of homocysteine and dehydroepiandrosterone sulphate (DHEA-S): Implications in the pathogenesis of Alzheimer’s disease. Neurosci. Lett. 2010, 483, 123–126. [Google Scholar] [CrossRef]
- Ueland, P.M.; Nygård, O.; Vollset, S.E.; Refsum, H. The Hordaland Homocysteine Studies. Lipids 2001, 36, S33–S39. [Google Scholar] [CrossRef] [PubMed]
- Ernest, S.; Hosack, A.; O’Brien, W.E.; Rosenblatt, D.S.; Nadeau, J.H. Homocysteine levels in A/J and C57BL/6J mice: Genetic, diet, gender, and parental effects. Physiol. Genom. 2005, 21, 404–410. [Google Scholar] [CrossRef][Green Version]
- Zhuo, J.-M.; Praticò, D. Severe In Vivo Hyper-Homocysteinemia is not Associated with Elevation of Amyloid-β Peptides in the Tg2576 Mice. J. Alzheimers Dis. 2010, 21, 133–140. [Google Scholar] [CrossRef]
- Hasegawa, T.; Mikoda, N.; Kitazawa, M.; LaFerla, F.M. Treatment of Alzheimer’s Disease with Anti-Homocysteic Acid Antibody in 3xTg-AD Male Mice. PLoS ONE 2010, 5, e8593. [Google Scholar] [CrossRef]
- Janssen, C.I.F.; Zerbi, V.; Mutsaers, M.P.C.; de Jong, B.S.W.; Wiesmann, M.; Arnoldussen, I.A.C.; Geenen, B.; Heerschap, A.; Muskiet, F.A.J.; Jouni, Z.E.; et al. Impact of dietary n-3 polyunsaturated fatty acids on cognition, motor skills and hippocampal neurogenesis in developing C57BL/6J mice. J. Nutr. Biochem. 2015, 26, 24–35. [Google Scholar] [CrossRef]
- Wiesmann, M.; Zerbi, V.; Jansen, D.; Haast, R.; Lütjohann, D.; Broersen, L.M.; Heerschap, A.; Kiliaan, A.J. A Dietary Treatment Improves Cerebral Blood Flow and Brain Connectivity in Aging apoE4 Mice. Neural Plast. 2016, 2016, 1–15. [Google Scholar] [CrossRef]
- Arendash, G.W.; Jensen, M.T.; Salem, N.; Hussein, N.; Cracchiolo, J.; Dickson, A.; Leighty, R.; Potter, H. A diet high in omega-3 fatty acids does not improve or protect cognitive performance in Alzheimer’s transgenic mice. Neuroscience 2007, 149, 286–302. [Google Scholar] [CrossRef]
- Shah, R.C.; Kamphuis, P.J.; Leurgans, S.; Swinkels, S.H.; Sadowsky, C.H.; Bongers, A.; Rappaport, S.A.; Quinn, J.F.; Wieggers, R.L.; Scheltens, P.; et al. The S-Connect study: Results from a randomized, controlled trial of Souvenaid in mild-to-moderate Alzheimer’s disease. Alzheimers Res. Ther. 2013, 5, 59. [Google Scholar] [CrossRef] [PubMed]
- Scheltens, N.M.E.; Briels, C.T.; Yaqub, M.; Barkhof, F.; Boellaard, R.; van der Flier, W.M.; Schwarte, L.A.; Teunissen, C.E.; Attali, A.; Broersen, L.M.; et al. Exploring effects of Souvenaid on cerebral glucose metabolism in Alzheimer’s disease. Alzheimers Dement. Transl. Res. Clin. Interv. 2019, 5, 492–500. [Google Scholar] [CrossRef] [PubMed]
- Panza, F.; Lozupone, M.; Logroscino, G.; Imbimbo, B.P. A critical appraisal of amyloid-β-targeting therapies for Alzheimer disease. Nat. Rev. Neurol. 2019, 15, 73–88. [Google Scholar] [CrossRef] [PubMed]
- Aizenstein, H.J.; Nebes, R.D.; Saxton, J.A.; Price, J.C.; Mathis, C.A.; Tsopelas, N.D.; Ziolko, S.K.; James, J.A.; Snitz, B.E.; Houck, P.R.; et al. Frequent Amyloid Deposition Without Significant Cognitive Impairment Among the Elderly. Arch. Neurol. 2008, 65, 1509. [Google Scholar] [CrossRef] [PubMed]
- Kaplon, H.; Muralidharan, M.; Schneider, Z.; Reichert, J.M. Antibodies to watch in 2020. MAbs 2020, 12, 1703531. [Google Scholar] [CrossRef] [PubMed]
- Tucker, L.B.; McCabe, J.T. Behavior of Male and Female C57BL/6J Mice Is More Consistent with Repeated Trials in the Elevated Zero Maze than in the Elevated Plus Maze. Front. Behav. Neurosci. 2017, 11, 1–8. [Google Scholar] [CrossRef]
- Harrison, F.E.; Reiserer, R.S.; Tomarken, A.J.; McDonald, M.P. Spatial and nonspatial escape strategies in the Barnes maze. Learn. Mem. 2006, 13, 809–819. [Google Scholar] [CrossRef] [PubMed]
- Talpos, J.C.; Winters, B.D.; Dias, R.; Saksida, L.M.; Bussey, T.J. A novel touchscreen-automated paired-associate learning (PAL) task sensitive to pharmacological manipulation of the hippocampus: A translational rodent model of cognitive impairments in neurodegenerative disease. Psychopharmacology 2009, 205, 157–168. [Google Scholar] [CrossRef]
- Paxinos, G.; Franklin, K.B.J. The Mouse Brain in Stereotaxic Coordinates, 4th ed.; Academic Press: Cambridge, MA, USA, 2013; p. 360. [Google Scholar]
- Beery, A.K. Inclusion of females does not increase variability in rodent research studies. Curr. Opin. Behav. Sci. 2018, 23, 143–149. [Google Scholar] [CrossRef]


| Group Number | Genotype | Diet | Abbreviation |
|---|---|---|---|
| 1 | C57BL/6J wild type | Control | C (WT) |
| 2 | AppNL-G-F knock-in | Control | C (KI) |
| 3 | AppNL-G-F knock-in | Vitamin B deficient | B-DEF |
| 4 | AppNL-G-F knock-in | Vitamin B enriched | B-ENR |
| 5 | AppNL-G-F knock-in | PUFA supplemented | PUFA-ENR |
| 6 | AppNL-G-F knock-in | Vitamin B enriched and PUFA supplemented | B+PUFA-ENR |
| 7 | AppNL-G-F knock-in | Fortasyn® Connect-like | FC |
Publisher’s Note: MDPI stays neutral with regard to jurisdictional claims in published maps and institutional affiliations. |
© 2020 by the authors. Licensee MDPI, Basel, Switzerland. This article is an open access article distributed under the terms and conditions of the Creative Commons Attribution (CC BY) license (http://creativecommons.org/licenses/by/4.0/).
Share and Cite
Nieraad, H.; de Bruin, N.; Arne, O.; Hofmann, M.C.J.; Schmidt, M.; Saito, T.; Saido, T.C.; Gurke, R.; Schmidt, D.; Till, U.; et al. Impact of Hyperhomocysteinemia and Different Dietary Interventions on Cognitive Performance in a Knock-in Mouse Model for Alzheimer’s Disease. Nutrients 2020, 12, 3248. https://doi.org/10.3390/nu12113248
Nieraad H, de Bruin N, Arne O, Hofmann MCJ, Schmidt M, Saito T, Saido TC, Gurke R, Schmidt D, Till U, et al. Impact of Hyperhomocysteinemia and Different Dietary Interventions on Cognitive Performance in a Knock-in Mouse Model for Alzheimer’s Disease. Nutrients. 2020; 12(11):3248. https://doi.org/10.3390/nu12113248
Chicago/Turabian StyleNieraad, Hendrik, Natasja de Bruin, Olga Arne, Martine C. J. Hofmann, Mike Schmidt, Takashi Saito, Takaomi C. Saido, Robert Gurke, Dominik Schmidt, Uwe Till, and et al. 2020. "Impact of Hyperhomocysteinemia and Different Dietary Interventions on Cognitive Performance in a Knock-in Mouse Model for Alzheimer’s Disease" Nutrients 12, no. 11: 3248. https://doi.org/10.3390/nu12113248
APA StyleNieraad, H., de Bruin, N., Arne, O., Hofmann, M. C. J., Schmidt, M., Saito, T., Saido, T. C., Gurke, R., Schmidt, D., Till, U., Parnham, M. J., & Geisslinger, G. (2020). Impact of Hyperhomocysteinemia and Different Dietary Interventions on Cognitive Performance in a Knock-in Mouse Model for Alzheimer’s Disease. Nutrients, 12(11), 3248. https://doi.org/10.3390/nu12113248