Exploring the Validity of the 14-Item Mediterranean Diet Adherence Screener (MEDAS): A Cross-National Study in Seven European Countries around the Mediterranean Region

 ,
, 

 ,
,  ,
,  ,
,  , , ,
, , , 
 ,
,  ,
,  and
and
Abstract
1. Introduction
2. Materials and Methods
2.1. Study Design and Recruitment
2.2. Validation Protocol
2.3. Statistical Methods
3. Results
3.1. Characteristics of the Participants
3.2. Validation of the FFQ-MEDAS against 3d-FD in the Selected Countries: Reliability, Correlation, and Agreement
3.3. Kappa Statistics: Analysis Per Food-Item and Country
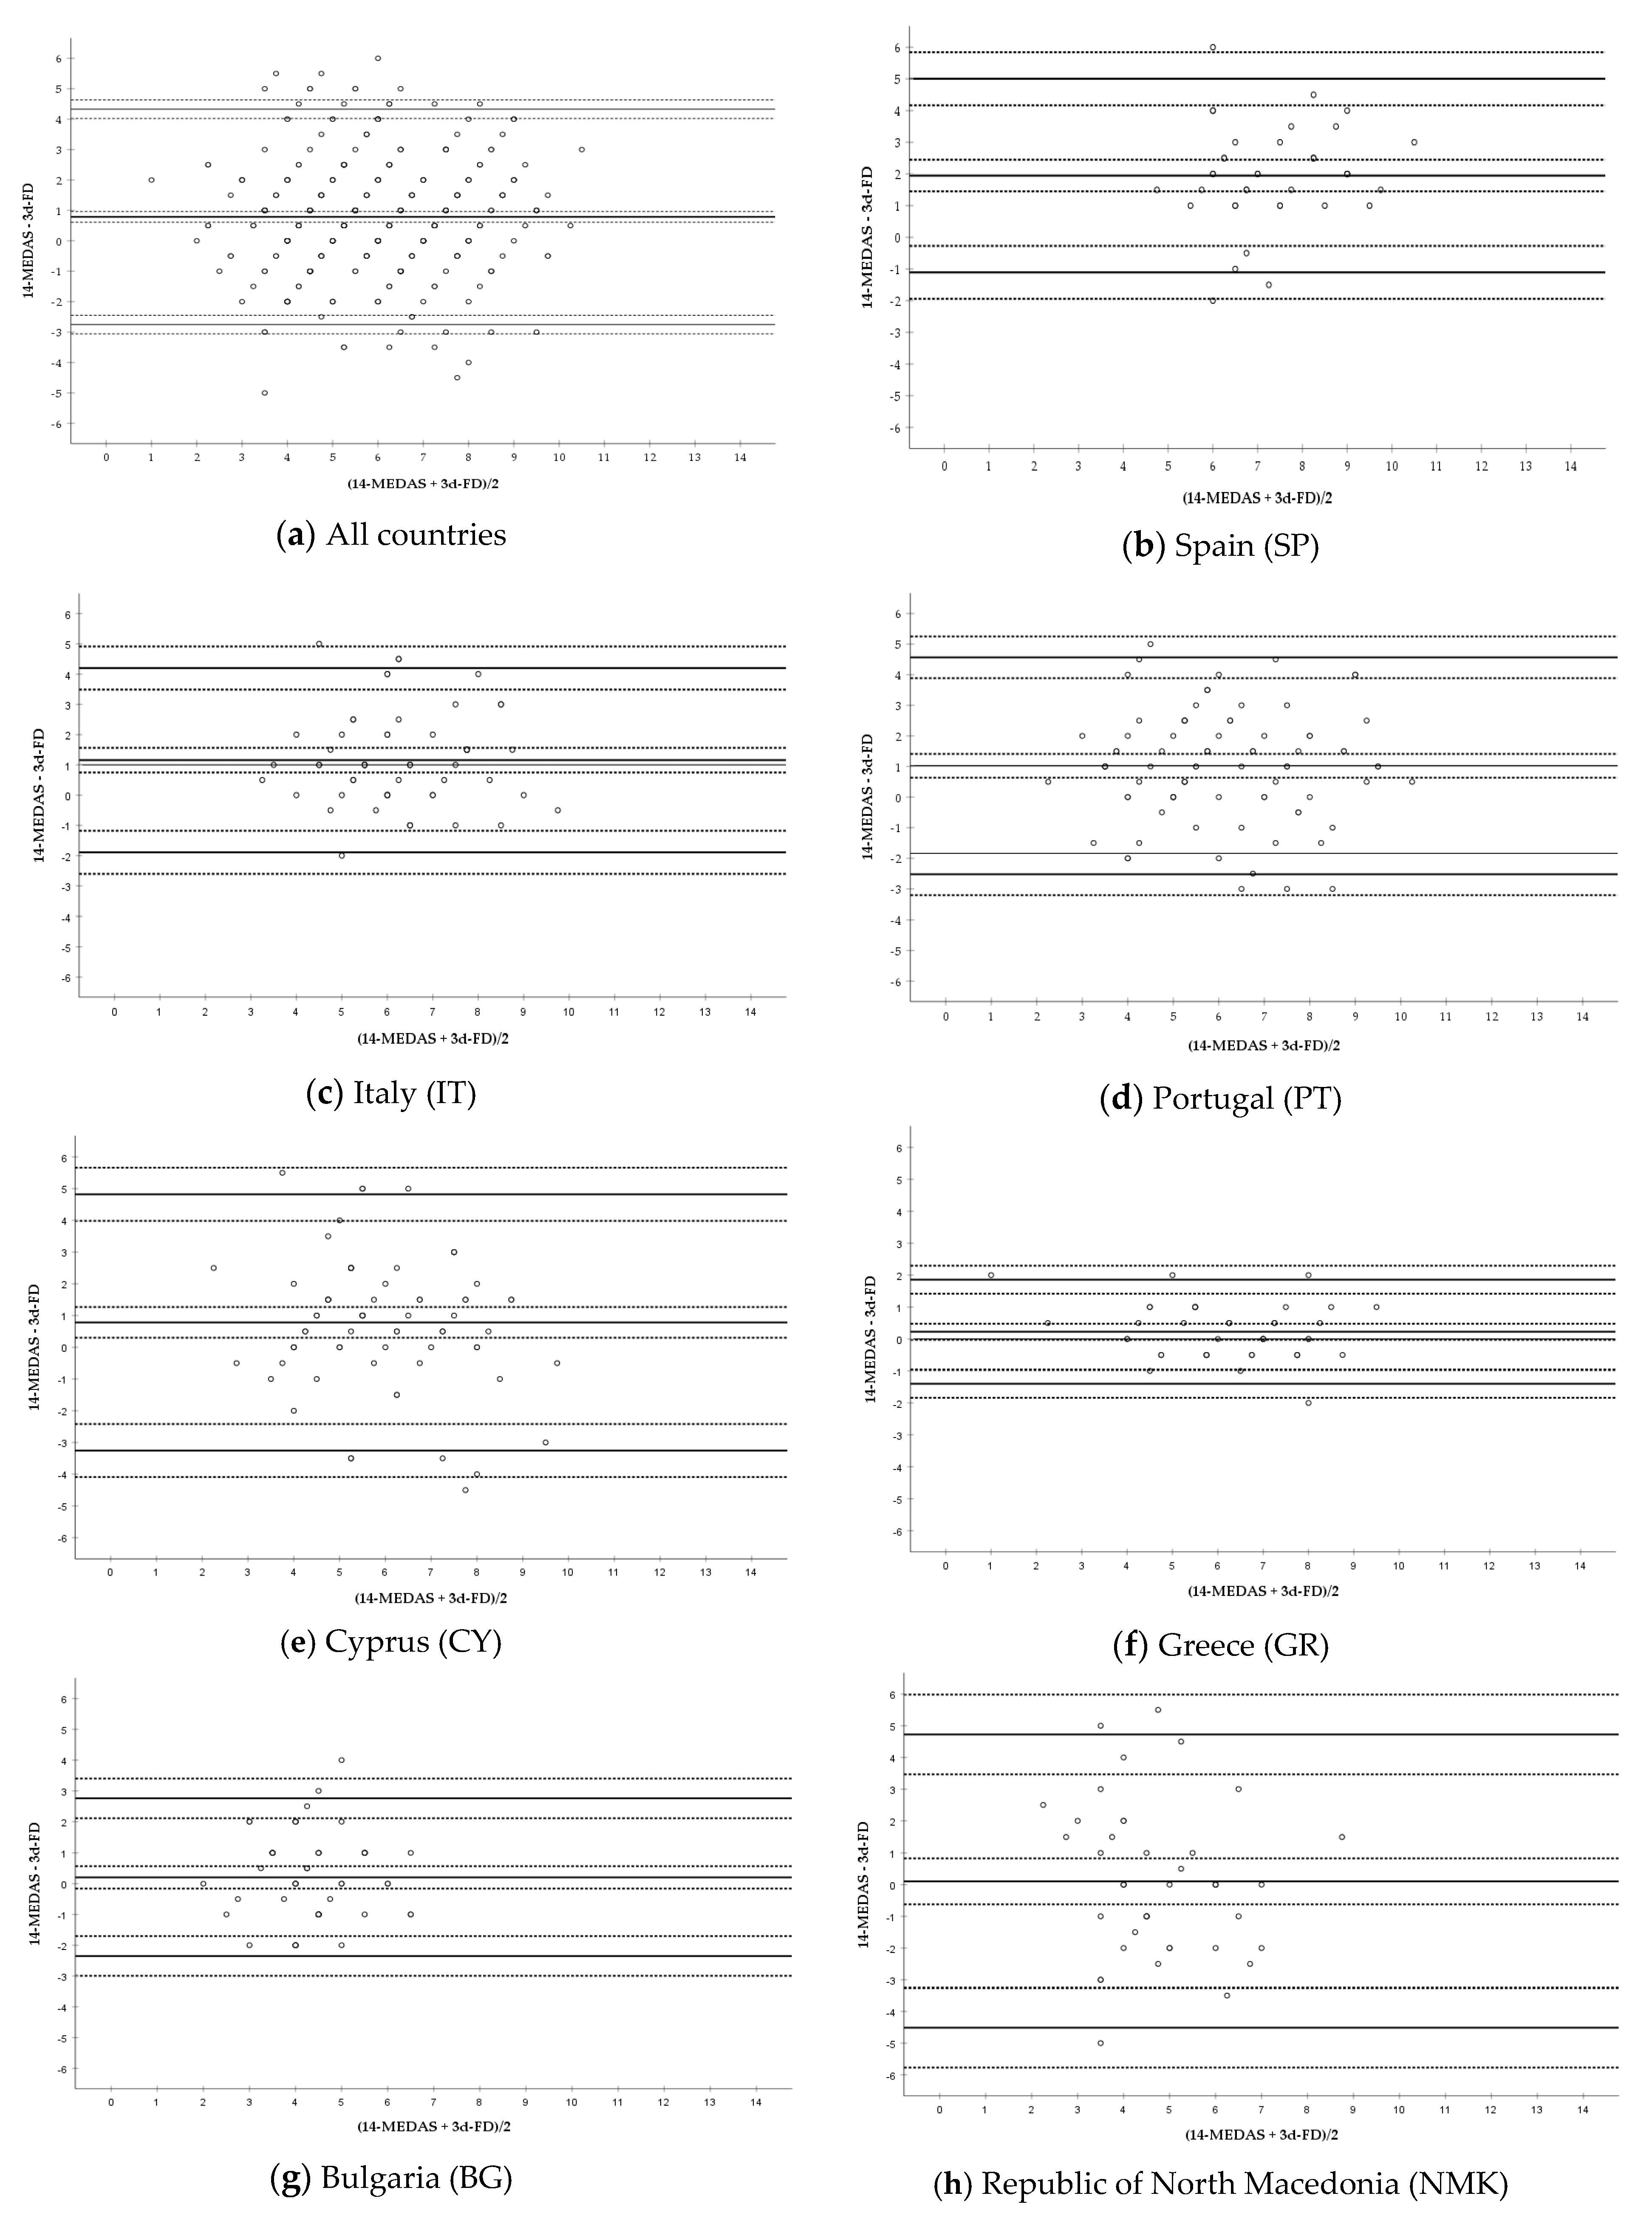
3.4. Bland–Altman Analysis
4. Discussion
Supplementary Materials
Author Contributions
Funding
Acknowledgments
Conflicts of Interest
References
- Godos, J.; Galvano, F. Insights on Mediterranean Diet from the SUN Cohort: Cardiovascular and Cognitive Health. Nutrients 2020, 12, 1332. [Google Scholar] [CrossRef] [PubMed]
- Sofi, F.; Abbate, R.; Gensini, G.F.; Casini, A. Accruing evidence on benefits of adherence to the Mediterranean diet on health: An updated systematic review and meta-analysis. Am. J. Clin. Nutr. 2010, 92, 1189–1196. [Google Scholar] [CrossRef] [PubMed]
- Trichopoulou, A.; Martinez-Gonzalez, M.A.; Tong, T.Y.; Forouhi, N.G.; Khandelwal, S.; Prabhakaran, D.; Mozaffarian, D.; de Lorgeril, M. Definitions and potential health benefits of the Mediterranean diet: Views from experts around the world. BMC Med. 2014, 12, 112. [Google Scholar] [CrossRef] [PubMed]
- Dinu, M.; Pagliai, G.; Casini, A.; Sofi, F. Mediterranean diet and multiple health outcomes: An umbrella review of meta-analyses of observational studies and randomised trials. Eur. J. Clin. Nutr. 2018, 72, 30–43. [Google Scholar] [CrossRef]
- Hidalgo-Mora, J.J.; Garcia-Vigara, A.; Sanchez-Sanchez, M.L.; Garcia-Perez, M.A.; Tarin, J.; Cano, A. The Mediterranean diet: A historical perspective on food for health. Maturitas 2020, 132, 65–69. [Google Scholar] [CrossRef]
- Schröder, H.; Fitó, M.; Estruch, R.; Martínez-González, M.A.; Corella, D.; Salas-Salvadó, J.; Lamuela-Raventós, R.; Ros, E.; Salaverría, I.; Fiol, M.; et al. A Short Screener Is Valid for Assessing Mediterranean Diet Adherence among Older Spanish Men and Women. J. Nutr. 2011, 141, 1140–1145. [Google Scholar] [CrossRef]
- Hebestreit, K.; Yahiaoui-Doktor, M.; Engel, C.; Vetter, W.; Siniatchkin, M.; Erickson, N.; Halle, M.; Kiechle, M.; Bischoff, S.C. Validation of the German version of the Mediterranean Diet Adherence Screener (MEDAS) questionnaire. BMC Cancer 2017, 17, 341. [Google Scholar] [CrossRef]
- Bottcher, M.R.; Marincic, P.Z.; Nahay, K.L.; Baerlocher, B.E.; Willis, A.W.; Park, J.; Gaillard, P.; Greene, M.W. Nutrition knowledge and Mediterranean diet adherence in the southeast United States: Validation of a field-based survey instrument. Appetite 2017, 111, 166–176. [Google Scholar] [CrossRef]
- Papadaki, A.; Johnson, L.; Toumpakari, Z.; England, C.; Rai, M.; Toms, S.; Penfold, C.; Zazpe, I.; Martinez-Gonzalez, M.A.; Feder, G. Validation of the English Version of the 14-Item Mediterranean Diet Adherence Screener of the PREDIMED Study, in People at High Cardiovascular Risk in the UK. Nutrients 2018, 10, 138. [Google Scholar] [CrossRef]
- Kwon, Y.J.; Lee, H.; Yoon, Y.; Kim, H.M.; Chu, S.H.; Lee, J.W. Development and Validation of a Questionnaire to Measure Adherence to the Mediterranean Diet in Korean Adults. Nutrients 2020, 12, 1102. [Google Scholar] [CrossRef]
- Mahdavi-roshan, M.; Salari, A.; Ggholipour, M.; Naghshbandi, M. Dietary Adherence in People with Cardiovascular Risk Factors Living in Northern Iran. J. Babol Univ. Med. Sci. 2017, 19, 62–68. [Google Scholar] [CrossRef]
- Gnagnarella, P.; Draga, D.; Misotti, A.M.; Sieri, S.; Spaggiari, L.; Cassano, E.; Baldini, F.; Soldati, L.; Maisonneuve, P. Validation of a short questionnaire to record adherence to the Mediterranean diet: An Italian experience. Nutr. Metab. Cardiovasc. Dis. 2018, 28, 1140–1147. [Google Scholar] [CrossRef] [PubMed]
- Abu-Saad, K.; Endevelt, R.; Goldsmith, R.; Shimony, T.; Nitsan, L.; Shahar, D.R.; Keinan-Boker, L.; Ziv, A.; Kalter-Leibovici, O. Adaptation and predictive utility of a Mediterranean diet screener score. Clin. Nutr. 2019, 38, 2928–2935. [Google Scholar] [CrossRef] [PubMed]
- Gregorio, M.J.; Rodrigues, A.M.; Salvador, C.; Dias, S.S.; de Sousa, R.D.; Mendes, J.M.; Coelho, P.S.; Branco, J.C.; Lopes, C.; Martinez-Gonzalez, M.A.; et al. Validation of the Telephone-Administered Version of the Mediterranean Diet Adherence Screener (MEDAS) Questionnaire. Nutrients 2020, 12, 1511. [Google Scholar] [CrossRef] [PubMed]
- Bibiloni, M.D.M.; González, M.; Julibert, A.; Llompart, I.; Pons, A.; Tur, J.A. Ten-Year Trends (1999–2010) of Adherence to the Mediterranean Diet among the Balearic Islands’ Adult Population. Nutrients 2017, 9, 749. [Google Scholar] [CrossRef]
- Marventano, S.; Godos, J.; Platania, A.; Galvano, F.; Mistretta, A.; Grosso, G. Mediterranean diet adherence in the Mediterranean healthy eating, aging and lifestyle (MEAL) study cohort. Int. J. Food Sci. Nutr. 2018, 69, 100–107. [Google Scholar] [CrossRef]
- Januszewska, R.; Pieniak, Z.; Verbeke, W. Food choice questionnaire revisited in four countries. Does it still measure the same? Appetite 2011, 57, 94–98. [Google Scholar] [CrossRef]
- Briers, B.; Huh, Y.E.; Chan, E.; Mukhopadhyay, A. The unhealthy = tasty belief is associated with BMI through reduced consumption of vegetables: A cross-national and mediational analysis. Appetite 2020, 150, 104639. [Google Scholar] [CrossRef]
- Watson, P.F.; Petrie, A. Method agreement analysis: A review of correct methodology. Theriogenology 2010, 73, 1167–1179. [Google Scholar] [CrossRef]
- Cade, J.; Thompson, R.; Burley, V.; Warm, D. Development, validation and utilisation of food-frequency questionnaires—A review. Public Health Nutr. 2002, 5, 567–587. [Google Scholar] [CrossRef]
- Torres, D.; Faria, N.; Sousa, N.; Teixeira, S.; Soares, R.; Amorim, H.; Guiomar, S.; Lobato, L.; Oliveira, C.; Correia, D.; et al. Manual Fotográfico de Quantificação de Alimentos IAN-AF 2015–2016; Universidade do Porto: Porto, Portugal, 2017; ISBN 978-989-746-182-8. [Google Scholar]
- Martínez-González, M.A.; García-Arellano, A.; Toledo, E.; Salas-Salvadó, J.; Buil-Cosiales, P.; Corella, D.; Covas, M.I.; Schröder, H.; Arós, F.; Gómez-Gracia, E.; et al. A 14-item Mediterranean diet assessment tool and obesity indexes among high-risk subjects: The PREDIMED trial. PLoS ONE 2012, 7, e43134. [Google Scholar] [CrossRef] [PubMed]
- Ghasemi, A.; Zahediasl, S. Normality tests for statistical analysis: A guide for non-statisticians. Int. J. Endocrinol. Metab. 2012, 10, 486–489. [Google Scholar] [CrossRef] [PubMed]
- Schober, P.; Boer, C.; Schwarte, L.A. Correlation Coefficients: Appropriate Use and Interpretation. Anesth. Analg. 2018, 126, 1763–1768. [Google Scholar] [CrossRef] [PubMed]
- Koo, T.K.; Li, M.Y. A Guideline of Selecting and Reporting Intraclass Correlation Coefficients for Reliability Research. J. Chiropr. Med. 2016, 15, 155–163. [Google Scholar] [CrossRef]
- McHugh, M.L. Interrater reliability: The kappa statistic. Biochem. Med. Zagreb 2012, 22, 276–282. [Google Scholar] [CrossRef]
- Giavarina, D. Understanding Bland Altman analysis. Biochem. Med. Zagreb 2015, 25, 141–151. [Google Scholar] [CrossRef]
- Flegal, K.M.; Graubard, B.; Ioannidis, J.P.A. Use and reporting of Bland–Altman analyses in studies of self-reported versus measured weight and height. Int. J. Obes. 2020, 44, 1311–1318. [Google Scholar] [CrossRef]
- World Health Organization. Preventing and Managing the Global Epidemic: Report of a WHO Consultation; World Health Organization: Geneva, Switzerland, 2000. [Google Scholar]
- Zaragoza-Marti, A.; Cabanero-Martinez, M.J.; Hurtado-Sanchez, J.A.; Laguna-Perez, A.; Ferrer-Cascales, R. Evaluation of Mediterranean diet adherence scores: A systematic review. BMJ Open 2018, 8, e019033. [Google Scholar] [CrossRef]
- Yang, Y.J.; Kim, M.K.; Hwang, S.H.; Ahn, Y.; Shim, J.E.; Kim, D.H. Relative validities of 3-day food records and the food frequency questionnaire. Nutr. Res. Pract. 2010, 4, 142–148. [Google Scholar] [CrossRef]
- Tsang, S.; Royse, C.F.; Terkawi, A.S. Guidelines for developing, translating, and validating a questionnaire in perioperative and pain medicine. Saudi J. Anaesth 2017, 11, S80–S89. [Google Scholar] [CrossRef]
- Dogan, N.O. Bland-Altman analysis: A paradigm to understand correlation and agreement. Turk. J. Emerg. Med. 2018, 18, 139–141. [Google Scholar] [CrossRef] [PubMed]
- Vilarnau, C.; Stracker, D.M.; Funtikov, A.; da Silva, R.; Estruch, R.; Bach-Faig, A. Worldwide adherence to Mediterranean Diet between 1960 and 2011. Eur. J. Clin. Nutr. 2019, 72, 83–91. [Google Scholar] [CrossRef] [PubMed]
- Caparello, G.; Galluccio, A.; Giordano, C.; Lofaro, D.; Barone, I.; Morelli, C.; Sisci, D.; Catalano, S.; Andò, S.; Bonofiglio, D. Adherence to the Mediterranean diet pattern among university staff: A cross-sectional web-based epidemiological study in Southern Italy. Int. J. Food Sci. Nutr. 2020, 71, 581–592. [Google Scholar] [CrossRef] [PubMed]
- Theodoridis, X.; Grammatikopoulou, M.G.; Gkiouras, K.; Papadopoulou, S.E.; Agorastou, T.; Gkika, I.; Maraki, M.I.; Dardavessis, T.; Chourdakis, M. Food insecurity and Mediterranean diet adherence among Greek university students. Nutr. Metab. Cardiovasc. Dis. 2018, 28, 477–485. [Google Scholar] [CrossRef]
- Nelson, M. The validation of dietary assessment. In Design Concepts in Nutritional Epidemiology; Margetts, B., Nelson, M., Eds.; Oxford Scholarship: London, UK, 1997; pp. 241–721. [Google Scholar] [CrossRef]
- Subar, A.F.; Kipnis, V.; Troiano, R.P.; Midthune, D.; Schoeller, D.A.; Bingham, S.; Sharbaugh, C.O.; Trabulsi, J.; Runswick, S.; Ballard-Barbash, R.; et al. Using intake biomarkers to evaluate the extent of dietary misreporting in a large sample of adults: The OPEN study. Am. J. Epidemiol. 2003, 158, 1–13. [Google Scholar] [CrossRef]
- Poslusna, K.; Ruprich, J.; de Vries, J.H.; Jakubikova, M.; van’t Veer, P. Misreporting of energy and micronutrient intake estimated by food records and 24 h recalls, control and adjustment methods in practice. Br. J. Nutr. 2009, 101 (Suppl. 2), S73–S85. [Google Scholar] [CrossRef]
- Ravelli, M.N.; Schoeller, D.A. Traditional Self-Reported Dietary Instruments Are Prone to Inaccuracies and New Approaches Are Needed. Front. Nutr. 2020, 7, 90. [Google Scholar] [CrossRef]
- Sofi, F.; Dinu, M.; Pagliai, G.; Cesari, F.; Gori, A.M.; Sereni, A.; Becatti, M.; Fiorillo, C.; Marcucci, R.; Casini, A. Low-Calorie Vegetarian Versus Mediterranean Diets for Reducing Body Weight and Improving Cardiovascular Risk Profile: CARDIVEG Study (Cardiovascular Prevention with Vegetarian Diet). Circulation 2018, 137, 1103–1113. [Google Scholar] [CrossRef]
- Scholz, A.; Navarrete-Muñoz, E.M.; de la Hera, M.G.; Gimenez-Monzo, D.; Gonzalez-Palacios, S.; Valera-Gran, D.; Torres-Collado, L.; Vioque, J. Alcohol consumption and Mediterranean Diet adherence among health science students in Spain: The DiSA-UMH Study. Gac. Sanit. 2016, 30, 126–132. [Google Scholar] [CrossRef][Green Version]


| All Countries | SP | IT | PT | CY | GR | NMK | BG | |
|---|---|---|---|---|---|---|---|---|
| N (%) | 402 | 40 (10.0) | 58 (14.4) | 86 (21.4) | 72 (17.9) | 44 (10.9) | 43 (10.7) | 59 (14.7) |
| Sex distribution: | ||||||||
| Women; N (%) | 238 (59.2) | 23 (57.5) | 34 (58.6) | 57 (66.3) | 38 (52.8) | 25 (56.8) | 25 (58.1) | 36 (61.0) |
| Men; N (%) | 164 (40.8) | 17 (42.5) | 24 (41.4) | 29 (33.7) | 34 (47.2) | 19 (43.2) | 18 (41.9) | 23 (39.0) |
| Age range (years) | 18–81 | 24–71 | 19–65 | 19–73 | 20–74 | 18–80 | 20–81 | 20–80 |
| Age mean ± SD (years) | 39.4 ±15.2 | 45.9 ± 11 | 36.1 ±13.5 | 34.2 ±14.1 | 35.0 ± 15 | 34.3 ±12.0 | 46.3 ±16.2 | 49.9 ±14.6 |
| Age distribution N (%) | ||||||||
| 18–24 (years) | 85 (21.1) | 1 (2.5) | 18 (31.0) | 29 (33.7) | 28 (38.9) | 6 (13.6) | 2 (4.7) | 1 (1.7) |
| 25–34 (years) | 104 (25.9) | 6 (15.0) | 12 (20.7) | 26 (30.2) | 14 (19.4) | 26 (59.1) | 11 (25.6) | 9 (15.3) |
| 35–44 (years) | 75 (18.7) | 14 (35.0) | 8 (13.8) | 8 (9.3) | 14 (19.4) | 6 (13.6) | 10 (23.3) | 15 (25.4) |
| 45–54 (years) | 58 (14.4) | 9 (22.5) | 14 (24.1) | 12 (20.7) | 7 (9.7) | 3 (5.2) | 4 (9.3) | 9 (15.3) |
| 55–64 (years) | 47 (11.7) | 8 (20.0) | 5 (8.6) | 7 (8.1) | 2 (2.8) | 1 (2.3) | 10 (23.3) | 14 (23.7) |
| ≥65 (years) | 33 (8.2) | 2 (5.0) | 1 (1.7) | 4 (4.7) | 7 (9.7) | 2 (4.5) | 6 (14.0) | 11 (18.8) |
| BMI (kg/m2) | ||||||||
| mean ± SD | 25.2 ± 5.0 | 23.4 ± 2.6 | 23.3 ± 3.1 | 24.0 ± 3.6 | 24.9 ± 4.7 | 25.9 ± 5.6 | 26.9 ± 4.9 | 28.5 ± 7.3 |
| BMI distribution 1 N (%) | ||||||||
| Underweight | 9 (2.2) | 1 (2.5) | 1 (1.7) | 1 (1.2) | 1 (1.4) | 0 (0.0) | 1 (2.3) | 2 (3.4) |
| Normal weight | 223 (55.5) | 27 (67.5) | 44 (75.9) | 54 (63.5) | 42 (58.3) | 23 (52.3) | 15 (34.9) | 20 (33.9) |
| Overweight | 113 (28.1) | 11 (27.5) | 12 (20.7) | 24 (28.2) | 20 (27.8) | 13 (29.6) | 17 (39.5) | 15 (25.4) |
| Obesity | 57 (14.2) | 1 (2.5) | 1 (1.7) | 6 (7.1) | 9 (12.5) | 8 (18.2) | 10 (23.3) | 22 (37.3) |
| Weight excess (overweight + obesity) | 170 (42.3) | 12 (30.0) | 13 (22.4) | 30 (35.3) | 29 (40.3) | 21 (47.8) | 27 (62.8) | 37 (62.7) |
| N (Valid Population) 1 | FFQ-MEDAS 2 (1) FFQ-MEDAS (2) | Test–Retest Reliability 3 (r, Sig. Bilateral) | FFQ-MEDAS (Mean Score) | 3d-FD Score | Correlation 4 (r, Sig. Bilateral) | ICC 5 (95%CI, Sig. Bilateral) |
|---|---|---|---|---|---|---|
| All countries (402) | (1) 6.22 ± 2.03 (2) 6.21 ± 2.14 | 0.852, <0.001 Strong positive correlation | 6.22 ± 2.01 | 5.43 ± 1.89 | 0.573, <0.001 Moderate positive correlation | 0.692 (0.552, 0.780; <0.001) Moderate |
| SP (40) | (1) 8.15 ± 1.73 (2) 8.55 ± 1.71 | 0.837, <0.001 Strong positive correlation | 8.35 ± 1.65 | 6.40 ± 1.46 | 0.503, 0.001 Moderate positive correlation | 0.440 (−0.210, 0.745; <0.001) Poor |
| IT (58) | (1) 6.90 ± 1.68 (2) 6.83 ± 1.74 | 0.809, <0.001 Strong positive correlation | 6.86 ± 1.63 | 5.71 ± 1.63 | 0.546, <0.001 Moderate positive correlation | 0.610 (0.150, 0.802; <0.001) Moderate |
| PT (86) | (1) 6.54 ± 2.04 (2) 6.55 ± 2.10 | 0.827, <0.001 Strong positive correlation | 6.55 ± 1.98 | 5.52 ± 2.02 | 0.597, <0.001 Moderate positive correlation | 0.693 (0.420, 0.824; <0.001) Moderate |
| CY (72) | (1) 6.33 ± 1.90 (2) 6.32 ± 2.03 | 0.623, <0.001 Moderate positive correlation | 6.33 ± 1.77 | 5.54 ± 2.06 | 0.427, <0.001 Moderate positive correlation | 0.564 (0.299, 0.728; <0.001) Moderate |
| GR (44) | (1) 6.41 ± 1.67 (2) 6.23 ± 1.83 | 0.842, <0.001 Strong positive correlation | 6.32 ± 1.68 | 6.09 ± 1.87 | 0.895, <0.001 Strong positive correlation | 0.939 (0.887, 0.967: <0.001) Excellent |
| NMK (43) | (1) 4.93 ± 1.62 (2) 4.67 ± 1.76 | 0.919, <0.001 Strong positive correlation | 4.80 ± 1.66 | 4.70 ± 1.91 | 0.131, 0.401 No correlation | 0.234 (−0.434, 0.588; 0.200) No agreement |
| BG (59) | (1) 4.46 ± 1.21 (2) 4.49 ± 1.21 | 0.930, <0.001 Strong positive correlation | 4.47 ± 1.19 | 4.27 ± 1.19 | 0.311, 0.016 Weak correlation | 0.473 (0.118, 0.686; 0.008) Poor |
| Question (Score) | All Countries | SP | IT | PT | CY | GR | NMK | BG |
|---|---|---|---|---|---|---|---|---|
| 1. Olive oil (yes) | 0.590 Moderate | NA 1 | NA | 0.133 Slight | −0.003 No agreement | NA | 0.225 Fair | 0.871 Almost perfect |
| 2. Olive oil (≥4) | 0.361 Fair | 0.228 Fair | −0.063 No agreement | 0.390 Fair | −0.084 No agreement | 0.488 Moderate | NA | −0.017 No agreement |
| 3. Vegetables (≥2) | 0.184 Slight | 0.000 No agreement | 0.419 Moderate | 0.252 Fair | 0.222 Fair | 0.485 Moderate | 0.166 Slight | NA |
| 4. Fruits (≥3) | 0.502 Moderate | 0.459 Moderate | 0.181 Slight | 0.549 Moderate | 0.391 Fair | 0.560 Moderate | −0.042 No agreement | NA |
| 5. Red meat (<1) | 0.114 Slight | −0.080 No agreement | 0.110 Slight | −0.228 Disagreement | NA | 0.440 Moderate | 0.557 Moderate | NA |
| 6. Butter (<1) | 0.257 Fair | 0.655 Substantial | 0.270 Fair | 0.124 Slight | 0.030 Slight | 0.455 Moderate | −0.307 Disagreement | 0.168 Slight |
| 7. Sweet drinks (<1) | 0.281 Fair | 0.362 Fair | 0.097 Slight | 0.449 Moderate | 0.003 No agreement | 0.307 Fair | 0.125 Slight | 0.140 Slight |
| 8. Wine (7 to 14) | 0.391 Fair | 0.538 Moderate | 0.545 Moderate | 0.223 Fair | NA | 0.116 Slight | 0.482 Moderate | 0.676 Substantial |
| 9. Legumes (≥3) | 0.264 Fair | 0.275 Fair | 0.467 Moderate | 0.124 Slight | 0.126 Slight | 0.540 Moderate | −0.116 Disagreement | NA |
| 10. Fish (≥3) | 0.239 Fair | 0.366 Fair | 0.098 Slight | 0.126 Slight | 0.099 Slight | 0.340 Fair | −0.040 No agreement | NA |
| 11. Desserts (<3) | 0.333 Fair | 0.498 Moderate | 0.446 Moderate | 0.268 Fair | 0.035 Slight | 0.035 Slight | 0.094 Slight | NA |
| 12. Nuts (≥3) | 0.403 Fair to moderate | 0.659 Substantial | 0.268 Fair | 0.361 Fair | 0.300 Fair | 0.836 Almost perfect | 0.055 Slight | NA |
| 13. White meat (≤1 or yes) | 0.234 Fair | 0.050 Slight | 0.242 Fair | 0.298 Fair | 0.222 Fair | 0.690 Substantial | 0.073 Slight | 0.050 Slight |
| 14. ‘Sofrito’ (≥2) | 0.204 Slight to fair | 0.050 Slight | 0.190 Slight | −0.024 No agreement | 0.062 Slight | 0.919 Almost perfect | 0.206 Fair | NA |
| Country (N) 1 | Bland–Altman Analysis | |||
|---|---|---|---|---|
| Mean Difference 2 (Bias) ± SD (95% CI) | Upper LOA (95% CI) | Lower LOA (95% CI) | Fitted Linear Regression (Sig. Bilateral) | |
| All countries (402) | 0.79 ± 1.81 (0.61, 0.96) | 4.33 (4.02, 4.63) | −2.75 (−3.06, −2.45) | y = 0.35 + 0.08x (0.150) |
| SP (40) | 1.95 ± 1.56 (1.45, 2.45) | 5.01 (4.17, 5.84) | −1.11 (−1.94, −0.27) | y = 0.78 + 0.16x (0·399) |
| IT (58) | 1.16 ± 1.55 (0.75, 1.56) | 4.20 (3.49, 4.91) | −1.89 (−2.60, −1.18) | y = 1.19 − 0.01x (0·974) |
| PT (86) | 1.02 ± 1.81 (0.64, 1.41) | 4.57 (3.89, 5.25) | −2.52 (−3.20, −1.84) | y = 1.79 − 0.03x (0.815) |
| CY (72) | 0.78 ± 2.06 (0.30, 1.27) | 4.82 (3.99, 5.66) | −3.25 (−4.09, −2.41) | y = 2.03 − 0.21x (0·167) |
| GR (44) | 0.23 ± 0.83 (−0.03, 0.48) | 1.86 (1.42, 2.30) | −1.40 (−1.84, −0.96) | y = 0.91 − 0.11x (0·137) |
| BG (59) | 0.20 ± 1.39 (−0.16, 0.57) | 2.76 (2.11, 3.40) | −2.35 (−3.00, −1.71) | y = 0.20 + 0.001x (0·998) |
| NMK (43) | 0.10 ± 2.36 (−0.62, 0.83) | 4.72 (3.47, 5.98) | −4.51 (−5.77, −3.26) | y = 1.30 − 0.25x (0·361) |
© 2020 by the authors. Licensee MDPI, Basel, Switzerland. This article is an open access article distributed under the terms and conditions of the Creative Commons Attribution (CC BY) license (http://creativecommons.org/licenses/by/4.0/).
Share and Cite
García-Conesa, M.-T.; Philippou, E.; Pafilas, C.; Massaro, M.; Quarta, S.; Andrade, V.; Jorge, R.; Chervenkov, M.; Ivanova, T.; Dimitrova, D.; et al. Exploring the Validity of the 14-Item Mediterranean Diet Adherence Screener (MEDAS): A Cross-National Study in Seven European Countries around the Mediterranean Region. Nutrients 2020, 12, 2960. https://doi.org/10.3390/nu12102960
García-Conesa M-T, Philippou E, Pafilas C, Massaro M, Quarta S, Andrade V, Jorge R, Chervenkov M, Ivanova T, Dimitrova D, et al. Exploring the Validity of the 14-Item Mediterranean Diet Adherence Screener (MEDAS): A Cross-National Study in Seven European Countries around the Mediterranean Region. Nutrients. 2020; 12(10):2960. https://doi.org/10.3390/nu12102960
Chicago/Turabian StyleGarcía-Conesa, María-Teresa, Elena Philippou, Christos Pafilas, Marika Massaro, Stefano Quarta, Vanda Andrade, Rui Jorge, Mihail Chervenkov, Teodora Ivanova, Dessislava Dimitrova, and et al. 2020. "Exploring the Validity of the 14-Item Mediterranean Diet Adherence Screener (MEDAS): A Cross-National Study in Seven European Countries around the Mediterranean Region" Nutrients 12, no. 10: 2960. https://doi.org/10.3390/nu12102960
APA StyleGarcía-Conesa, M.-T., Philippou, E., Pafilas, C., Massaro, M., Quarta, S., Andrade, V., Jorge, R., Chervenkov, M., Ivanova, T., Dimitrova, D., Maksimova, V., Smilkov, K., Ackova, D. G., Miloseva, L., Ruskovska, T., Deligiannidou, G. E., Kontogiorgis, C. A., & Pinto, P. (2020). Exploring the Validity of the 14-Item Mediterranean Diet Adherence Screener (MEDAS): A Cross-National Study in Seven European Countries around the Mediterranean Region. Nutrients, 12(10), 2960. https://doi.org/10.3390/nu12102960