Fatty Acid Reference Intervals in Red Blood Cells among Pregnant Women in Norway–Cross Sectional Data from the ‘Little in Norway’ Cohort
Abstract
1. Introduction
2. Materials and Methods
2.1. Study Design
2.2. Population
2.3. Dietary Assessment
2.4. RBC Collection
2.5. Fatty Acids
2.6. Statistics
3. Results
3.1. Characterization of Study Population
3.2. Seafood Intake
3.3. Fatty Acid Status
4. Discussion
5. Conclusions
Supplementary Materials
Author Contributions
Funding
Acknowledgments
Conflicts of Interest
Abbreviations
| ALA | = | Alpha Linolenic Acid |
| DHA | = | DocosaHexaenoic Acid |
| e-FFQ | = | electronic-Food Frequency Questionnaire |
| EPA | = | EicosaPentaenoic Acid |
| FAME | = | Fatty Acid Methyl Esters |
| HUFA | = | Highly Unsaturated Fatty acids |
| LCPUFA | = | Long-Chain Polyunsaturated Fatty Acids |
| LiN | = | Little in Norway |
| PCA | = | Principal Component Analysis |
| PC1 | = | Principal Component 1 |
| PC2 | = | Principal Component 2 |
| PC3 | = | Principal Component 3 |
| PUFA | = | Polyunsaturated Fatty Acids |
| ω-3 | = | Omega-3 |
| ω-6 | = | Omega-6 |
| ω-9 | = | Omega-9 |
| RBC | = | Red Blood Cells |
References
- Makrides, M.; Gibson, R.A. Long-chain polyunsaturated fatty acid requirements during pregnancy and lactation. Am. J. Clin. Nutr. 2000, 71, 307S–311S. [Google Scholar] [CrossRef] [PubMed]
- Benefit-Risk Assessment of Fish and Fish Products in the Norwegian Diet—An Update. Available online: https://vkm.no/download/18.2994e95b15cc54507161ea1a/1498222018046/0a646edc5e.pdf (accessed on 29 May 2020).
- Steer, C.D.; Lattka, E.; Koletzko, B.; Golding, J.; Hibbeln, J.R. Maternal fatty acids in pregnancy, FADS polymorphisms, and child intelligence quotient at 8 y of age. Am. J. Clin. Nutr. 2013, 98, 1575–1582. [Google Scholar] [CrossRef] [PubMed]
- Markhus, M.W.; Rasinger, J.D.; Malde, M.K.; Frøyland, L.; Skotheim, S.; Braarud, H.C.; Stormark, K.M.; Graff, I.E. Docosahexaenoic acid status in pregnancy determines the maternal docosahexaenoic acid status 3-, 6- and 12 months postpartum. Results from a longitudinal observational study. PLoS ONE 2015, 10, e0136409. [Google Scholar] [CrossRef] [PubMed]
- Hornstra, G.; Al, M.D.; van Houwelingen, A.C.; Drongelen, M.M.F. Essential fatty acids in pregnancy and early human development. Eur. J. Obstet. Gynecol. Reprod. Biol. 1995, 61, 57–62. [Google Scholar] [CrossRef]
- Jackson, K.; Harris, W.A. Prenatal DHA test to help identify women at increased risk for early preterm birth: A proposal. Nutrients 2018, 10, 1933. [Google Scholar] [CrossRef] [PubMed]
- Lauritzen, L.; Brambilla, P.; Mazzocchi, A.; Harsløf, L.B.; Ciappolino, V.; Agostoni, C. DHA Effects in Brain Development and Function. Nutrients 2016, 8, 6. [Google Scholar] [CrossRef]
- Braarud, H.C.; Markhus, M.W.; Skotheim, S.; Stormark, K.M.; Frøyland, L.; Graff, I.E.; Kjellevold, M. Maternal DHA Status during pregnancy has a positive impact on infant problem solving: A Norwegian prospective observation study. Nutrients 2018, 10, 529. [Google Scholar] [CrossRef]
- Peltomaa, E.; Johnson, M.D.; Taipale, S.J. Marine cryptophytes are great sources of EPA and DHA. Mar. Drugs 2018, 16, 3. [Google Scholar] [CrossRef]
- Eilander, A.; Hundscheid, D.C.; Osendarp, S.J.; Transler, C.; Zock, P.L. Effects of n-3 long chain polyunsaturated fatty acid supplementation on visual and cognitive development throughout childhood: A review of human studies. Prostaglandins Leukot. Essent. 2007, 76, 189–203. [Google Scholar] [CrossRef]
- Koletzko, B.; Boey, C.C.M.; Campoy, C.; Carlson, S.E.; Chang, N.; Guillermo-Tuazon, M.A.; Joshi, S.; Prell, C.; Quak, S.H.; Sjarif, D.R.; et al. Current information and Asian perspectives on long-chain polyunsaturated fatty acids in pregnancy, lactation, and infancy: Systematic review and practice recommendations from an early nutrition academy workshop. Ann. Nutr. Metab. 2014, 65, 49–80. [Google Scholar] [CrossRef]
- van de Rest, O.; Hooijdonk, L.W.A.; Doets, E.; Schiepers, O.J.G.; Eilander, A.; de Groot, L.C.G.M. Vitamins and n-3 fatty acids for brain development and function: Review of human studies. Ann. Nutr. Metab. 2012, 60, 272–292. [Google Scholar] [CrossRef] [PubMed]
- Makrides, M.; Collins, C.T.; Gibson, R.A. Impact of fatty acid status on growth and neurobehavioural development in humans. Matern. Child Nutr. 2011, 7, 80–88. [Google Scholar] [CrossRef] [PubMed]
- Simmer, K.; Patole, S.K.; Rao, S.C. Longchain polyunsaturated fatty acid supplementation in infants born at term. Cochrane Database Syst. Rev. 2008, 1, CD000376. [Google Scholar]
- Qawasmi, A.; Landeros-Weisenberger, A.; Leckman, J.F.; Bloch, M. Meta-analysis of long-chain polyunsaturated fatty acid supplementation of formula and infant cognition. Pediatrics 2012, 129, 1141–1149. [Google Scholar] [CrossRef] [PubMed]
- Simmonds, L.A.; Sullivan, T.R.; Skubisz, M.; Middleton, P.F.; Best, K.P.; Yelland, L.N.; Quinlivan, J.; Zhou, S.J.; Liu, G.; McPhee, A.J.; et al. Omega-3 fatty acid supplementation in pregnancy—Baseline omega-3 status and early preterm birth: Exploratory analysis of a randomised controlled trial. BJOG 2020, 127, 975–981. [Google Scholar] [CrossRef] [PubMed]
- Zhang, Z.; Fulgoni, V.L.; Kris-Etherton, P.M.; Mitmesser, S.H. Dietary intakes of EPA and DHA omega-3 fatty acids among US childbearing-age and pregnant women: An analysis of NHANES 2001–2014. Nutrients 2018, 10, 416. [Google Scholar] [CrossRef]
- Middleton, P.; Gomersall, J.C.; Gould, J.F.; Shepherd, E.; Olsen, S.F.; Makrides, M. Omega-3 fatty acid addition during pregnancy. Cochrane Database Syst. Rev. 2018, 11, CD003402. [Google Scholar] [CrossRef]
- Lands, B.; Bibus, D.; Stark, K.D. Dynamic interactions of n-3 and n-6 fatty acid nutrients. Prostaglandins Leukot. Essent. 2018, 136, 15–21. [Google Scholar] [CrossRef]
- Katan, M.B.; Deslypere, J.P.; van Birgelen, A.P.; Penders, M.; Zegwaard, M. Kinetics of the incorporation of dietary fatty acids into serum cholesteryl esters, erythrocyte membranes, and adipose tissue: An 18-month controlled study. J. Lipid Res. 1997, 38, 2012–2022. [Google Scholar]
- Innis, S.M. Trans fatty intakes during pregnancy, infancy and early childhood. Atheroscler. Suppl. 2006, 7, 17–20. [Google Scholar] [CrossRef]
- Larsson, A.; Palm, M.; Hansson, L.O.; Axelsson, O. Reference values for clinical chemistry tests during normal pregnancy. BJOG 2008, 115, 874–881. [Google Scholar] [CrossRef] [PubMed]
- Horn, P.S.; Pesce, A.J. Reference intervals: An update. Clin. Chim. Acta 2003, 334, 5–23. [Google Scholar] [CrossRef]
- Clinical and Laboratory Standards Institute (CLSI). Defining, Establishing, and Verifying Reference Intervals in the Clinical Laboratory, 3rd ed.; CLSI EP28-A3c; CLSI: Wayne, PA, USA, 2008. [Google Scholar]
- Voortman, T.; Steegers-Theunissen, R.P.M.; Bergen, N.E.; Jaddoe, V.W.V.; Looman, C.W.N.; Kiefte-de Jong, J.C.; Schalekamp-Timmermans, S. Validation of a semi-quantitative food-frequency questionnaire for Dutch pregnant women from the general population using the method or triads. Nutrients 2020, 12, 1341. [Google Scholar] [CrossRef] [PubMed]
- Parker, G.; McClure, G.; Hegarty, B.D.; Smith, I.G. The validity of a food frequency questionnaire as a measure of PUFA status in pregnancy. BMC Pregnancy Childb. 2015, 15, 60. [Google Scholar] [CrossRef]
- Moe, V.; Fredriksen, E.; Kjellevold, M.; Dahl, L.; Markhus, M.W.; Stormark, K.M.; von Soest, T.; Olafsen, K.S.; Vannebo, U.T.; Smith, L. Little in Norway: A prospective longitudinal community-based cohort from pregnancy to child age 18 months. BMJ Open 2019, 9, e031050. [Google Scholar] [CrossRef]
- Markhus, M.W.; Graff, I.E.; Dahl, L.; Seldal, C.F.; Skotheim, S.; Braarud, H.C.; Stormark, K.M.; Malde, M.K. Establishment of a seafood index to assess the seafood consumption in pregnant women. Food Nutr. Res. 2013, 57, 19272. [Google Scholar] [CrossRef]
- Araujo, P.; Zeng, Y.; Du, Z.; Nguyen, T.; Frøyland, L.; Grung, B. Discrimination of n-3 rich oils by gas chromatography. Lipids 2010, 45, 1147–1158. [Google Scholar] [CrossRef]
- Ducas, É.; Girard, M.; Méthot, M.; Brien, M.; Thibault, L. Quality and safety of red blood cells stored in two additive solutions subjected to multiple room temperature exposures. Vox Sang. 2014, 107, 239–246. [Google Scholar]
- Araujo, P.; Bjørkkjær, T.; Frøyland, L.; Waagbø, R. Effect of storage time, temperature, antioxidant and thawing on fatty acid composition of plasma, serum and red blood cells—A pilot biobank study. Clin. Biochem. 2018, 52, 94–105. [Google Scholar] [CrossRef]
- Araujo, P.; Nguyen, T.T.; Frøyland, L.; Wang, J.; Kang, J.X. Evaluation of a rapid method for the quantitative analysis of fatty acids in various matrices. J. Chromatogr. A 2008, 1212, 106–113. [Google Scholar] [CrossRef]
- Harris, W.S.; von Schacky, C. The Omega-3 Index: A new risk factor for death from coronary heart disease? Prev. Med. 2004, 39, 212–220. [Google Scholar] [PubMed]
- Brantsæter, A.L.; Englund-Ögge, L.; Haugen, M.; Birgisdottir, B.E.; Knutsen, H.K.; Sengpiel, V.; Myhre, R.; Alexander, J.; Nilsen, R.M.; Jacobsson, B. Maternal intake of seafood and supplementary long chain n-3 poly-unsaturated fatty acids and preterm delivery. BMC Pregnancy Childb. 2017, 17, 41. [Google Scholar]
- Totland, T.H.; Melnæs, B.K.; Lundberg-Hallén, N.; Helland-Kigen, K.M.; Lund-Blix, N.A.; Myhre, J.B.; Anne Marte, A.; Johansen, A.M.W.; Løken, E.B.; Andersen, L.F. Norkost 3 En Landsomfattende Kostholdsundersøkelse Blant Menn og Kvinner i Norge i Alderen 18–70 år, 2010–11, 1st ed.; Universitetet i Oslo, Mattilsynet og Helsedirektoratet: Oslo, Norway, 2012; p. 51. [Google Scholar]
- Wheeler, S.J.; Poston, L.; Thomas, J.E.; Seed, P.T.; Baker, P.N.; Sanders, T.A.B. Maternal plasma fatty acid composition and pregnancy outcome in adolescents. Br. J. Nutr. 2011, 105, 601–610. [Google Scholar] [PubMed]
- Hoge, A.; Bernardy, F.; Donneau, A.-F.; Dardenne, N.; Degée, S.; Timmermans, M.; Nisolle, M.; Guillaume, M.; Castronovo, V. Low omega-3 index values and monounsaturated fatty acid levels in early pregnancy: An analysis of maternal erythrocytes fatty acids. Lipids Health Dis. 2018, 17, 63. [Google Scholar] [PubMed]
- Otto, S.J.; van Houwelingen, A.C.; Badart-Smook, A.; Hornstra, G. Changes in the maternal essential fatty acid profile during early pregnancy and the relation of the profile to diet. Am. J. Clin. Nutr. 2001, 73, 302–307. [Google Scholar]
- Enke, U.; Jaudszus, A.; Schleussner, E.; Seyfarth, L.; Jahreis, G.; Kuhnt, K. Fatty acid distribution of cord and maternal blood in human pregnancy: Special focus on individual trans fatty acids and conjugated linoleic acids. Lipids Health Dis. 2011, 10, 247. [Google Scholar]
- Terue Kawabata, T.; Kagawa, Y.; Kimura, F.; Miyazawa, T.; Saito, S.; Arima, T.; Nakai, K.; Yaegashi, N. Polyunsaturated fatty acid levels in maternal erythrocytes of Japanese women during pregnancy and after childbirth. Nutrients 2017, 9, 245. [Google Scholar]
- Saito, S.; Kawabata, T.; Tatsuta, N.; Kimura, F.; Miyazawa, T.; Mizuno, S.; Nishigori, H.; Arima, T.; Kagawa, Y.; Yoshimasu, K.; et al. Determinants of polyunsaturated fatty acid concentrations in erythrocytes of pregnant Japanese women from a birth cohort study: Study protocol and baseline findings of an adjunct study of the Japan environment & Children’s study. Environ. Health. Prev. Med. 2017, 22, 22. [Google Scholar]
- Our World in Data. Available online: https://ourworldindata.org/grapher/fish-and-seafood-consumption-per-capita (accessed on 29 May 2020).
- Magnusardottir, A.R.; Steingrimsdottir, L.; Thorgeirsdottir, H.; Hauksson, A.; Skuladottir, G.V. Red blood cell n-3 polyunsaturated fatty acids in first trimester of pregnancy are inversely associated with placental weight. Acta Obstet. Gynecol. Scand. 2009, 88, 91–97. [Google Scholar]
- Von Schacky, C. Omega-3 fatty acids in pregnancy-the case for a target omega-3 index. Nutrients 2020, 12, 898. [Google Scholar]
- Hoge, A.; Tabar, V.; Donneau, A.-F.; Dardenne, N.; Degée, S.; Timmermans, M.; Nisolle, M.; Guillaume, M.; Castronovo, V. Imbalance between Omega-6 and omega-3 polyunsaturated fatty acids in early pregnancy is predictive of postpartum depression in a Belgian cohort. Nutrients 2019, 11, 876. [Google Scholar] [CrossRef] [PubMed]
- Simopoulos, A.P. The importance of the omega-6/omega-3 fatty acid ratio in cardiovascular disease and other chronic diseases. Exp. Biol. Med. 2008, 233, 674–688. [Google Scholar] [CrossRef] [PubMed]
- da Rocha, C.M.; Kac, G. High dietary ratio of omega-6 to omega-3 polyunsaturated acids during pregnancy and prevalence of post-partum depression. Matern. Child Nutr. 2012, 8, 36–48. [Google Scholar] [CrossRef] [PubMed]
- Candela, C.G.; López, L.M.B.; Kohen, L. Importance of a balanced omega 6/omega 3 ratio for the maintenance of health. Nutritional recommendations. Nutr. Hosp. 2011, 26, 323–329. [Google Scholar]
- Harris, W.S. The omega-3 index: Clinical utility for therapeutic intervention. Curr. Cardiol. Rep. 2010, 12, 503–508. [Google Scholar] [CrossRef]
- Bigornia, S.J.; Harris, W.S.; Falcón, L.M.; Ordovás, J.M.; Lai, C.-Q.; Tucker, K.L. The omega-3 index is inversely associated with depressive symptoms among individuals with elevated oxidative stress biomarkers. J. Nutr. 2016, 146, 758–766. [Google Scholar] [CrossRef]
- Guu, T.W.; Mischoulon, D.; Sarris, J.; Hibbeln, J.; McNamara, R.K.; Hamazaki, K.; Freeman, M.P.; Maes, M.; Matsuoka, Y.J.; Belmaker, R.H.; et al. International Society for Nutritional Psychiatry Research Practice Guidelines for Omega-3 Fatty Acids in the Treatment of Major Depressive Disorder. Psychother. Psychosom. 2019, 88, 263–273. [Google Scholar] [CrossRef]
- Markhus, M.W.; Skotheim, S.; Graff, I.E.; Frøyland, L.; Braarud, H.C.; Stormark, K.M.; Malde, M.K. Low omega-3 index in pregnancy is a possible biological risk factor for postpartum depression. PLoS ONE 2013, 8, e67617. [Google Scholar] [CrossRef]
- Harris, W.S. The omega-3 index as a risk factor for coronary heart disease. Am. J. Clin. Nutr. 2008, 87, 1997S–2002S. [Google Scholar]
- Norwegian Directorate of Health. Recommendations on Diet, Nutrition and Physical Activity. 2014. Available online: https://www.helsebiblioteket.no/retningslinjer/ernaering/norske-anbefalinger-for-ernaering-og-fysisk-aktivitet (accessed on 29 May 2020).
- Altares, P.S.; Copo, A.R.I.; Gabuyo, Y.A.; Laddaran, A.T.; Mejia, L.D.P.; Policarpio, I.A.; Sy, E.A.G.; Tizon, H.D.; Yao, A.M.S.D. Elementary Statistics: A Modern Approach, 1st ed.; Rex Book Store: Manila, Philippines, 2003; p. 13. [Google Scholar]
- Statistisk Sentralbyrå, Statistics Norway. Available online: https://www.ssb.no/en/befolkning/statistikker/fodte/aar/2020-03-11 (accessed on 5 June 2020).
- Firestone, D.; Horowitz, W. IUPAC gas chromatographic method for determination of fatty acid composition. J. Ass. Off. Anal. Chem. 1979, 62, 709–721. [Google Scholar]


| Maternal age (years) | 30.1 ± 4.6 * |
| Gestation (weeks) | 16–32 |
| Median (weeks) | 28 |
| Range (weeks) | 17–40 |
| % | |
| Body mass index (BMI **) in kg/m2 | |
| <18.5 | 3.5 |
| 18.5–24.9 | 68.8 |
| ≥25 | 27.7 |
| Educational level | |
| <4 years of higher education † | 60.7 |
| ≥4 years of higher education | 39.3 |
| Marital status | |
| Living with partner/married | 96.8 |
| Not living with partner/other | 3.2 |
| Use of smoke/snuff tobacco during pregnancy | |
| Yes | 6.5 |
| No | 93.5 |
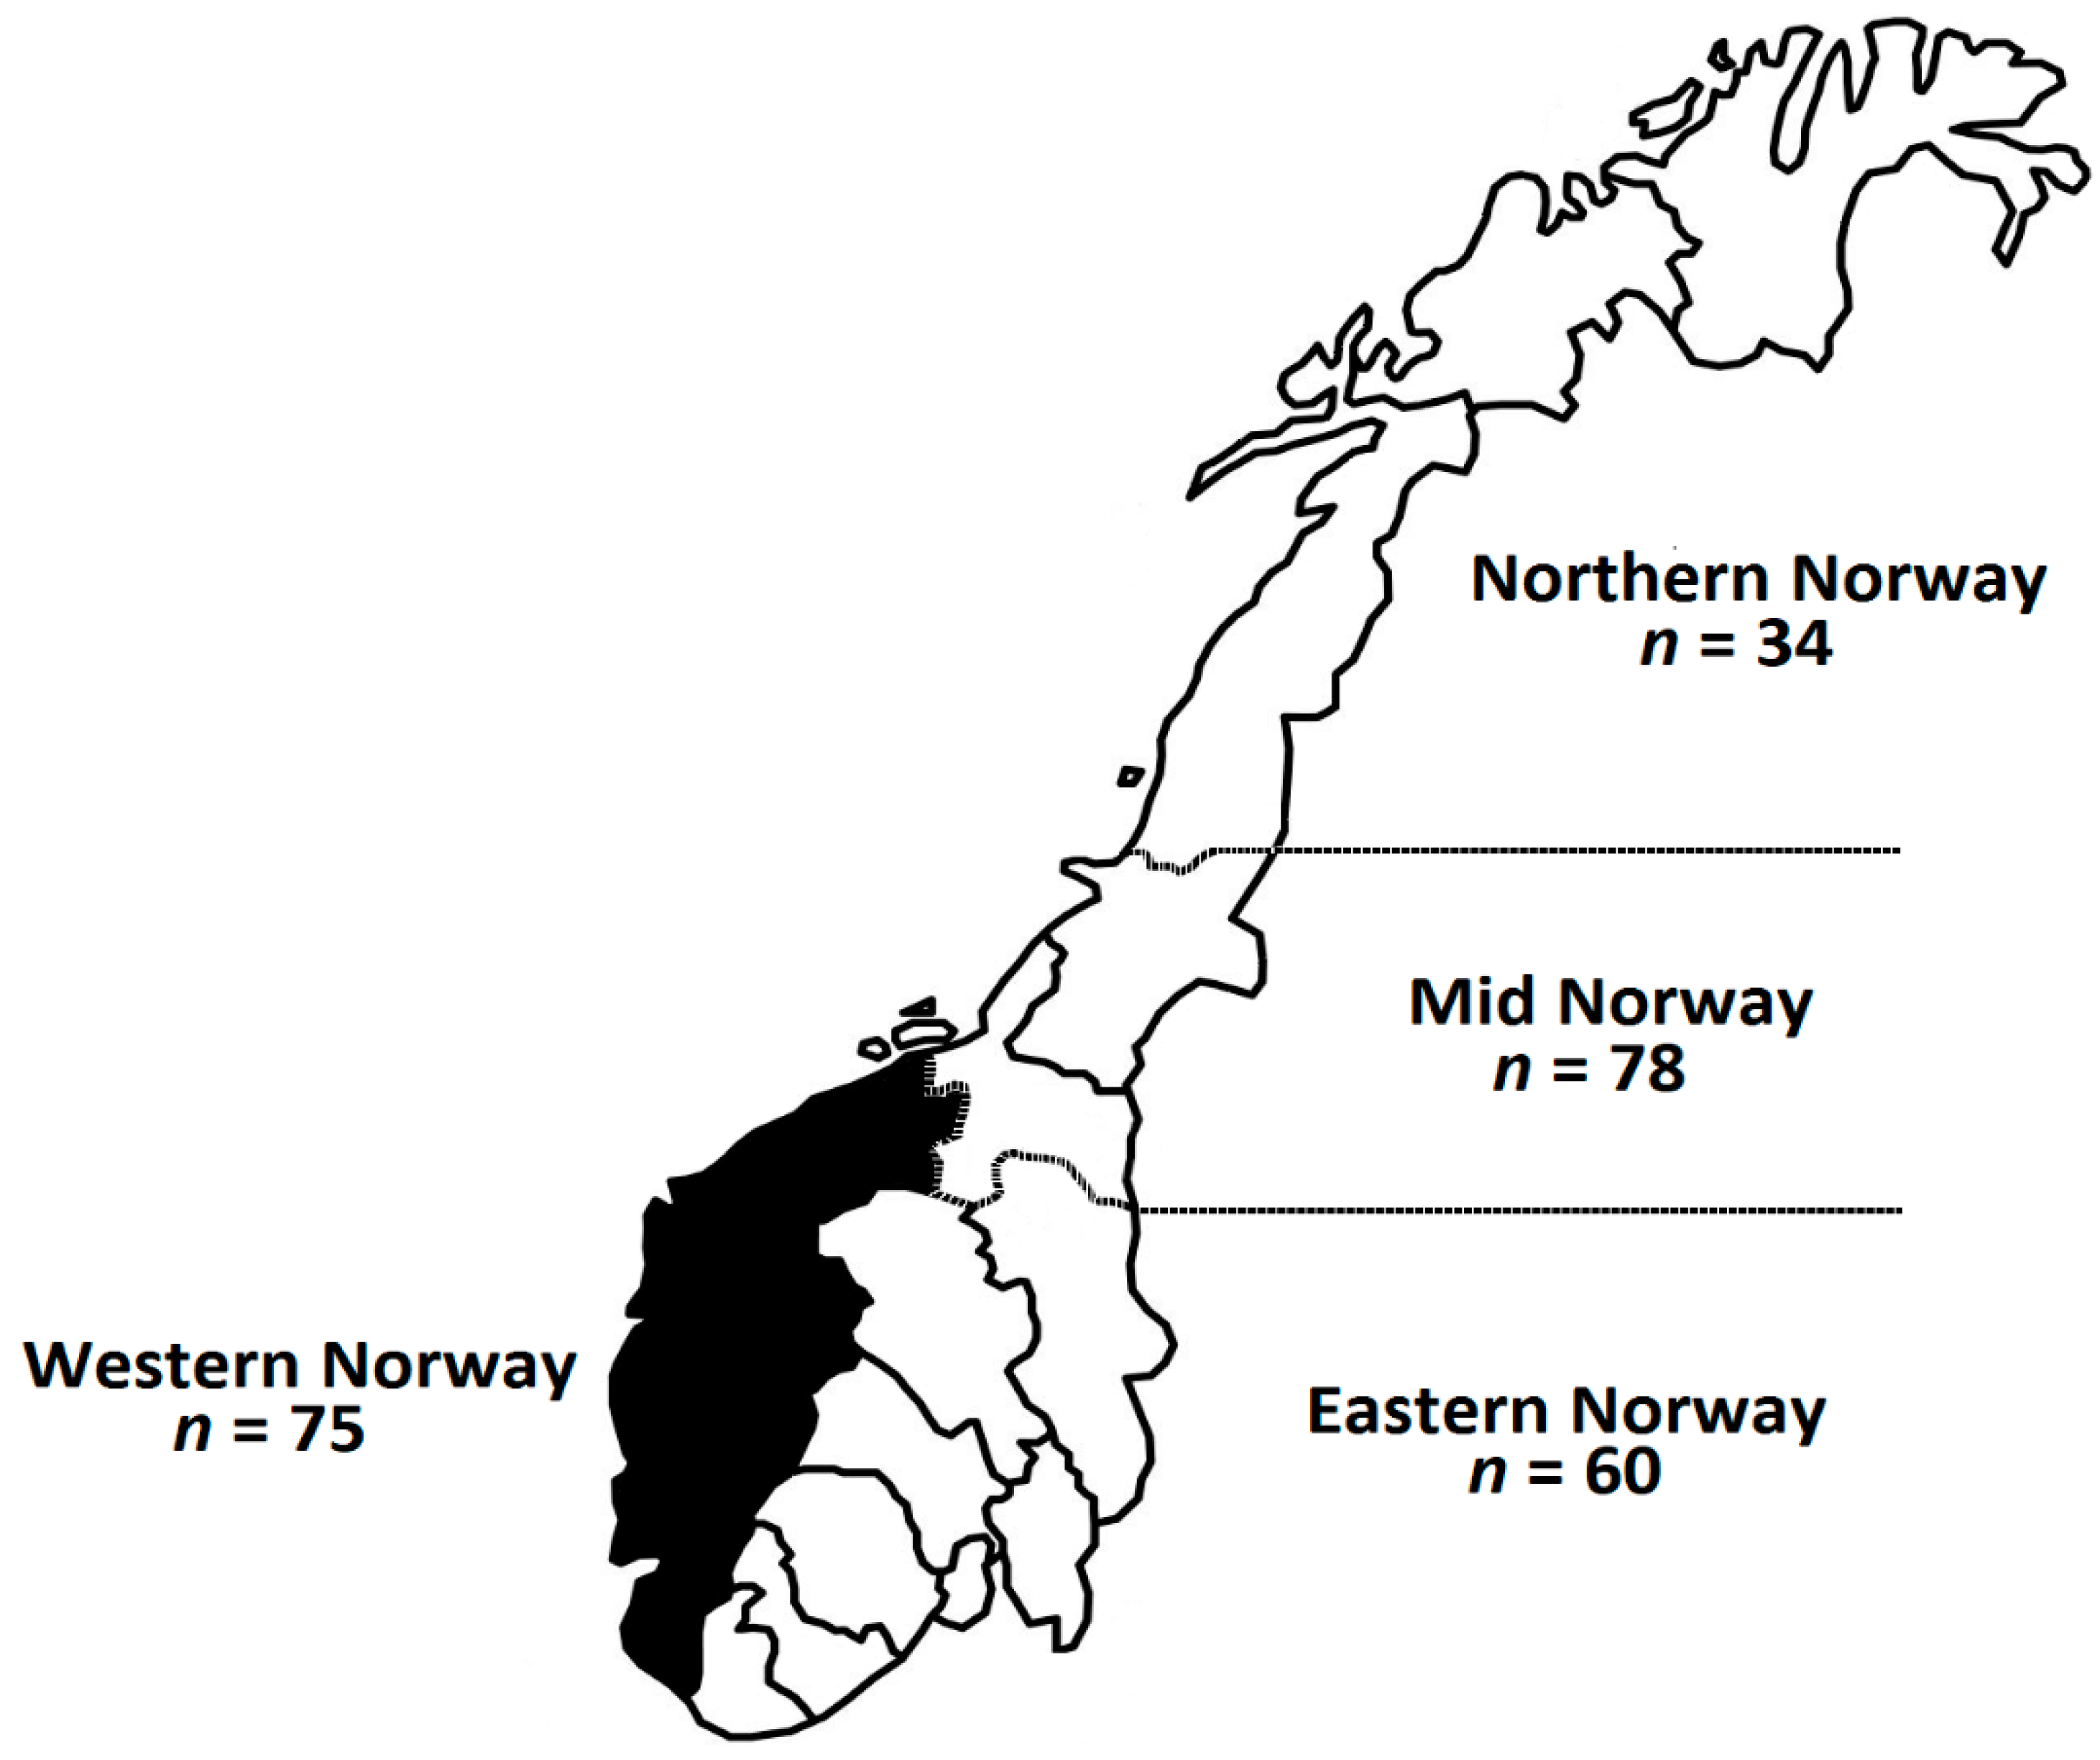
| Percentage of population per region | |
| Northern Norway | 13.8 |
| Mid Norway | 31.6 |
| Western Norway | 30.4 |
| Eastern Norway | 24.3 |
| Assigned Score for PCA * | ω-3-Supplement Intake Distribution | |||
|---|---|---|---|---|
| Seafood as dinner | Yes | No | ||
| <1time/month | 1 | 9 (4.4) | 5 (2.5) | 4 (2.0) |
| 1–3 times/month | 2 | 35 (17.2) | 27 (13.3) | 8 (3.9) |
| 1 time/week | 3 | 96 (47.3) | 74 (36.5) | 22 (10.8) |
| 2–3 times/week | 4 | 59 (29.1) | 46 (22.7) | 13 (6.4) |
| ≥4 times/week | 5 | 4 (2) | 4 (2.9) | |
| Seafood as spread or snack | ||||
| Never | 1 | 24 (11.8) | 15 (7.4) | 9 (4.4) |
| Rare | 2 | 45 (22,2) | 35 (17.2) | 10 (4.9) |
| 1–3 times/month | 3 | 56 (27.6) | 41 (20.2) | 15 (7.4) |
| 1–2 times/week | 4 | 59 (29.1) | 50 (24.6) | 9 (4.4) |
| 3–5 times/week | 5 | 17 (8.4) | 15 (7.4) | 2 (1.0) |
| ≥5 times/week | 6 | 2 (1) | 2 (1.0) | |
| Total ω-3-supplement intake | 0 or 1 | 156 (76.9) | 47 (23.2) | |
| Percentiles (%) | Percentiles (µg/g) | |||||||||||||||||||
|---|---|---|---|---|---|---|---|---|---|---|---|---|---|---|---|---|---|---|---|---|
| Mean | 2.5 | 5 | 10 | 25 | 50 | 75 | 90 | 95 | 97.5 | Mean | 2.5 | 5 | 10 | 25 | 50 | 75 | 90 | 95 | 97.5 | |
| % | ||||||||||||||||||||
| 14:0 | 0.65 | 0.27 | 0.35 | 0.39 | 0.49 | 0.62 | 0.77 | 0.96 | 1.11 | 1.22 | 14.75 | 7.14 | 7.48 | 8.68 | 10.38 | 13.48 | 17.33 | 22.24 | 26.97 | 30.66 |
| 16:0 | 23.10 | 20.60 | 20.83 | 21.19 | 21.72 | 22.70 | 23.68 | 25.51 | 26.96 | 29.62 | 509.41 | 400.25 | 413.49 | 430.96 | 458.06 | 500.95 | 548.11 | 599.90 | 623.18 | 652.36 |
| 18:0 | 14.12 | 11.72 | 12.22 | 12.56 | 13.16 | 14.04 | 14.82 | 15.55 | 16.85 | 18.82 | 308.39 | 266.68 | 277.86 | 282.71 | 290.24 | 307.58 | 324.14 | 339.64 | 348.88 | 359.40 |
| 22:0 | 0.63 | 0.31 | 0.34 | 0.40 | 0.50 | 0.61 | 0.74 | 0.86 | 0.94 | 1.00 | 13.79 | 7.26 | 8.24 | 9.34 | 11.18 | 13.73 | 16.30 | 18.46 | 19.91 | 21.21 |
| 16:1 | 1.04 | 0.36 | 0.51 | 0.65 | 0.84 | 0.98 | 1.20 | 1.50 | 1.67 | 1.90 | 23.58 | 7.54 | 10.33 | 13.27 | 17.08 | 21.07 | 27.79 | 35.97 | 43.36 | 47.43 |
| 18:1 | 16.71 | 14.00 | 14.45 | 14.80 | 15.45 | 16.58 | 17.63 | 18.88 | 19.68 | 20.18 | 371.49 | 264.10 | 280.12 | 298.38 | 319.83 | 358.57 | 409.14 | 476.29 | 510.59 | 536.99 |
| 24:1ω-9 | 1.75 | 0.88 | 1.07 | 1.17 | 1.34 | 1.64 | 2.01 | 2.50 | 2.76 | 3.13 | 38.07 | 20.36 | 22.90 | 25.49 | 30.42 | 36.73 | 44.04 | 51.83 | 57.73 | 64.76 |
| 18:2ω-6 | 11.98 | 8.34 | 9.01 | 9.52 | 10.55 | 11.52 | 13.13 | 14.74 | 16.10 | 17.08 | 268.62 | 160.28 | 173.28 | 191.40 | 220.38 | 255.68 | 301.01 | 359.55 | 402.95 | 453.61 |
| 20:3ω-6 | 1.57 | 0.93 | 1.06 | 1.14 | 1.35 | 1.56 | 1.76 | 2.05 | 2.19 | 2.41 | 35.03 | 17.29 | 20.70 | 24.04 | 29.43 | 34.13 | 40.77 | 46.03 | 49.96 | 54.82 |
| 20:4ω-6 | 10.84 | 5.05 | 6.87 | 8.56 | 9.95 | 11.28 | 12.11 | 12.77 | 13.14 | 13.52 | 240.27 | 92.32 | 135.45 | 182.19 | 223.29 | 247.75 | 273.12 | 289.50 | 297.74 | 313.66 |
| 22:4ω-6 | 1.64 | 0.41 | 0.69 | 0.91 | 1.31 | 1.67 | 2.03 | 2.31 | 2.44 | 2.62 | 36.31 | 10.00 | 13.49 | 20.00 | 28.77 | 37.33 | 45.15 | 50.55 | 55.20 | 57.91 |
| 18:3ω-3 | 0.29 | 0.13 | 0.15 | 0.17 | 0.21 | 0.27 | 0.35 | 0.44 | 0.51 | 0.54 | 8.70 | 5.14 | 5.32 | 5.51 | 6.50 | 9.49 | 10.00 | 10.63 | 12.27 | 13.52 |
| 20:5ω-3 | 0.79 | 0.23 | 0.27 | 0.32 | 0.45 | 0.64 | 1.01 | 1.33 | 1.82 | 2.12 | 17.86 | 5.99 | 6.61 | 7.83 | 10.00 | 15.06 | 22.17 | 29.85 | 40.73 | 51.25 |
| 22:5ω-3 | 1.79 | 0.56 | 0.83 | 1.26 | 1.53 | 1.82 | 2.09 | 2.36 | 2.65 | 2.80 | 39.71 | 11.08 | 17.34 | 28.62 | 34.32 | 40.41 | 45.75 | 52.72 | 55.66 | 61.97 |
| 22:6ω-3 | 6.92 | 3.76 | 4.18 | 5.14 | 5.98 | 6.94 | 7.86 | 8.63 | 9.38 | 10.12 | 152.74 | 64.25 | 82.84 | 114.74 | 135.66 | 153.41 | 172.38 | 194.38 | 209.45 | 218.08 |
| Omega-3 Index * | 7.71 | 4.14 | 4.66 | 5.53 | 6.60 | 7.70 | 8.86 | 9.87 | 10.67 | 11.90 | ||||||||||
| ω6/ω3 | 2.71 | 1.63 | 1.85 | 1.97 | 2.29 | 2.65 | 3.03 | 3.54 | 3.76 | 3.93 | ||||||||||
| Total ω-6 | 26.65 | 17.83 | 21.01 | 23.44 | 25.62 | 27.16 | 28.52 | 29.74 | 30.34 | 30.85 | ||||||||||
| Total ω-3 | 10.24 | 5.68 | 6.28 | 7.85 | 8.89 | 10.32 | 11.67 | 12.66 | 13.33 | 15.14 | ||||||||||
| Belgium [37] | Iceland [43] | Germany [39] | Japan [41] | Netherland [38] | Japan [40] | |
|---|---|---|---|---|---|---|
| 14:0 | × | × | × | |||
| 16:0 | × | × | ||||
| 18:0 | × | × | ||||
| 22:0 | × | × | × | × | ||
| 16:1 | × | × | × | × | ||
| 18:1 | × | × | ||||
| 24:1ω-9 | × | × | × | × | ||
| 18:2ω-6 | ||||||
| 20:3ω-6 | × | |||||
| 20:4ω-6 | ||||||
| 22:4ω-6 | × | |||||
| 18:3ω-3 | × | × | ||||
| 20:5ω-3 | ||||||
| 22:5ω-3 | × | |||||
| 22:6ω-3 |
© 2020 by the authors. Licensee MDPI, Basel, Switzerland. This article is an open access article distributed under the terms and conditions of the Creative Commons Attribution (CC BY) license (http://creativecommons.org/licenses/by/4.0/).
Share and Cite
Araujo, P.; Kjellevold, M.; Nerhus, I.; Dahl, L.; Aakre, I.; Moe, V.; Smith, L.; Markhus, M.W. Fatty Acid Reference Intervals in Red Blood Cells among Pregnant Women in Norway–Cross Sectional Data from the ‘Little in Norway’ Cohort. Nutrients 2020, 12, 2950. https://doi.org/10.3390/nu12102950
Araujo P, Kjellevold M, Nerhus I, Dahl L, Aakre I, Moe V, Smith L, Markhus MW. Fatty Acid Reference Intervals in Red Blood Cells among Pregnant Women in Norway–Cross Sectional Data from the ‘Little in Norway’ Cohort. Nutrients. 2020; 12(10):2950. https://doi.org/10.3390/nu12102950
Chicago/Turabian StyleAraujo, Pedro, Marian Kjellevold, Ive Nerhus, Lisbeth Dahl, Inger Aakre, Vibeke Moe, Lars Smith, and Maria Wik Markhus. 2020. "Fatty Acid Reference Intervals in Red Blood Cells among Pregnant Women in Norway–Cross Sectional Data from the ‘Little in Norway’ Cohort" Nutrients 12, no. 10: 2950. https://doi.org/10.3390/nu12102950
APA StyleAraujo, P., Kjellevold, M., Nerhus, I., Dahl, L., Aakre, I., Moe, V., Smith, L., & Markhus, M. W. (2020). Fatty Acid Reference Intervals in Red Blood Cells among Pregnant Women in Norway–Cross Sectional Data from the ‘Little in Norway’ Cohort. Nutrients, 12(10), 2950. https://doi.org/10.3390/nu12102950


