Alcohol Consumption, Drinking Patterns, and Cognitive Performance in Young Adults: A Cross-Sectional and Longitudinal Analysis


Abstract
1. Introduction
2. Materials and Methods
2.1. Ethics
2.2. Alcohol Consumption and Drinking Pattern
- -
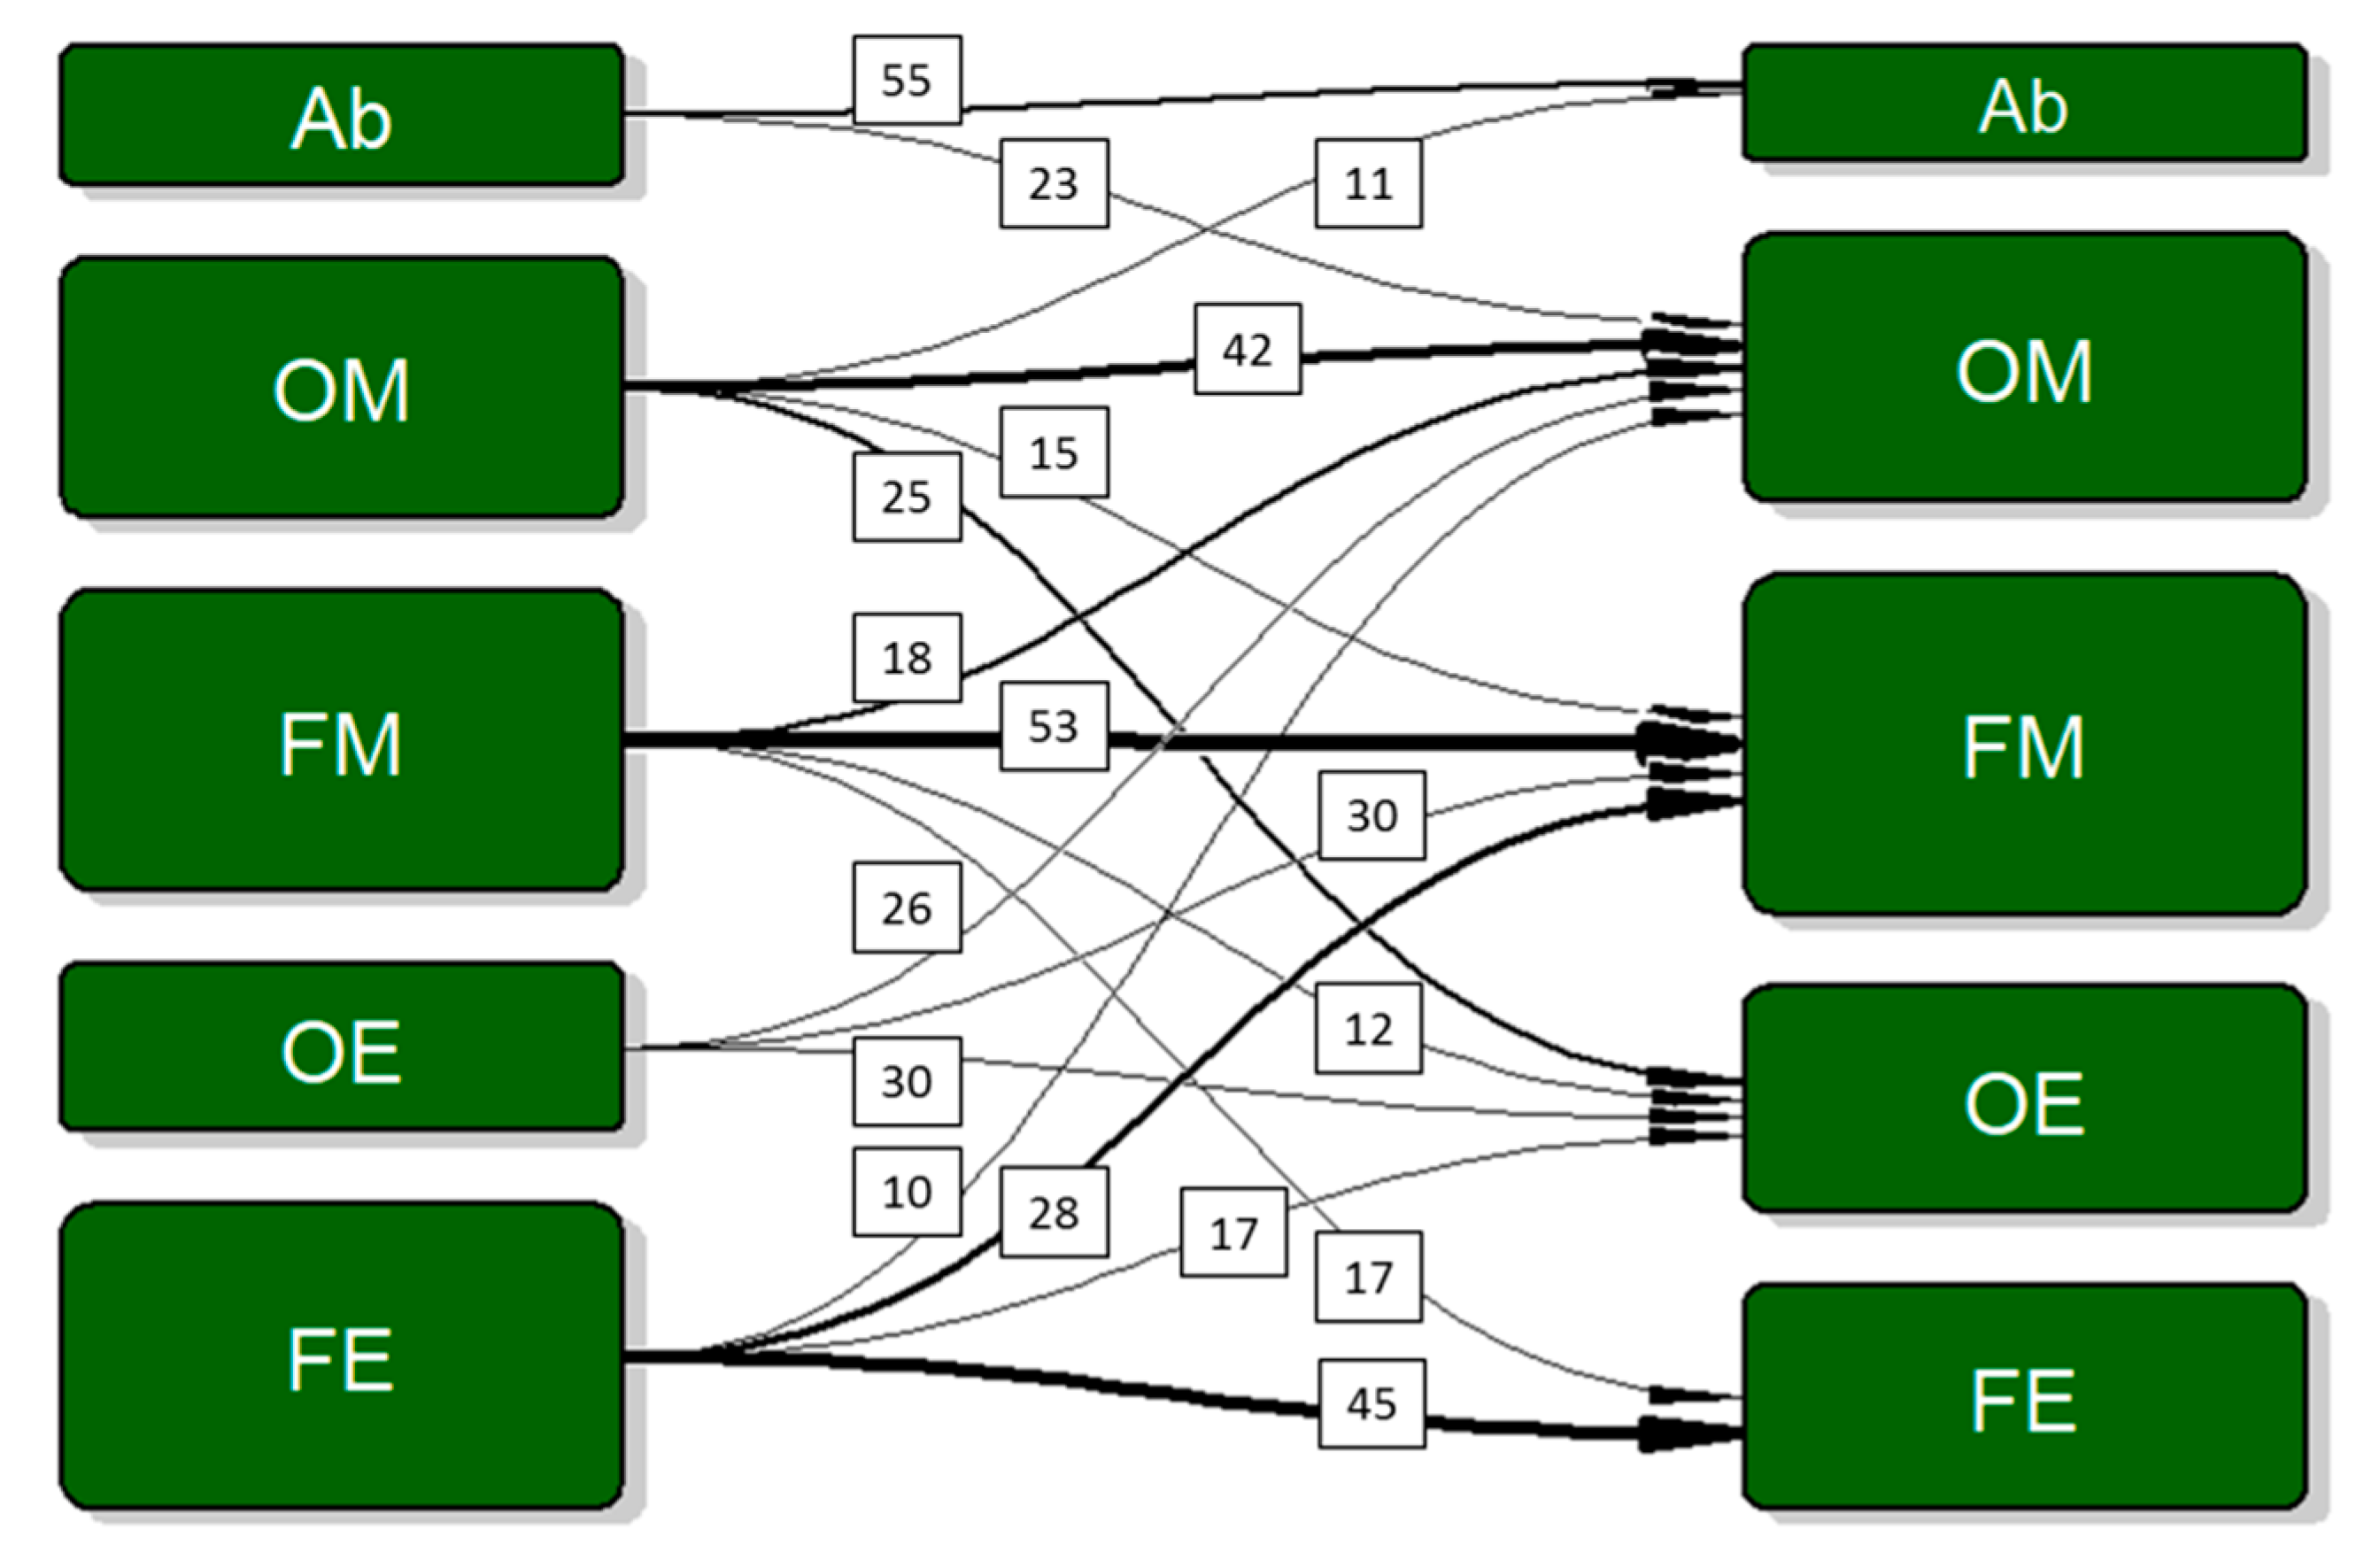
- Abstainers: participants reporting zero drinking occasions;
- -
- Occasional moderate drinkers: participants drinking on less than 40% of the occasions, of which less than 40% were binges;
- -
- Frequent moderate drinkers: participants drinking on more than 40% of the occasions, of which less than 40% were binges;
- -
- Occasional excessive drinkers: participants drinking on less than 40% of the occasions, of which more than 40% were binges;
- -
- Frequent excessive drinkers: participants drinking on more than 40% of the occasions, of which more than 40% were binges.
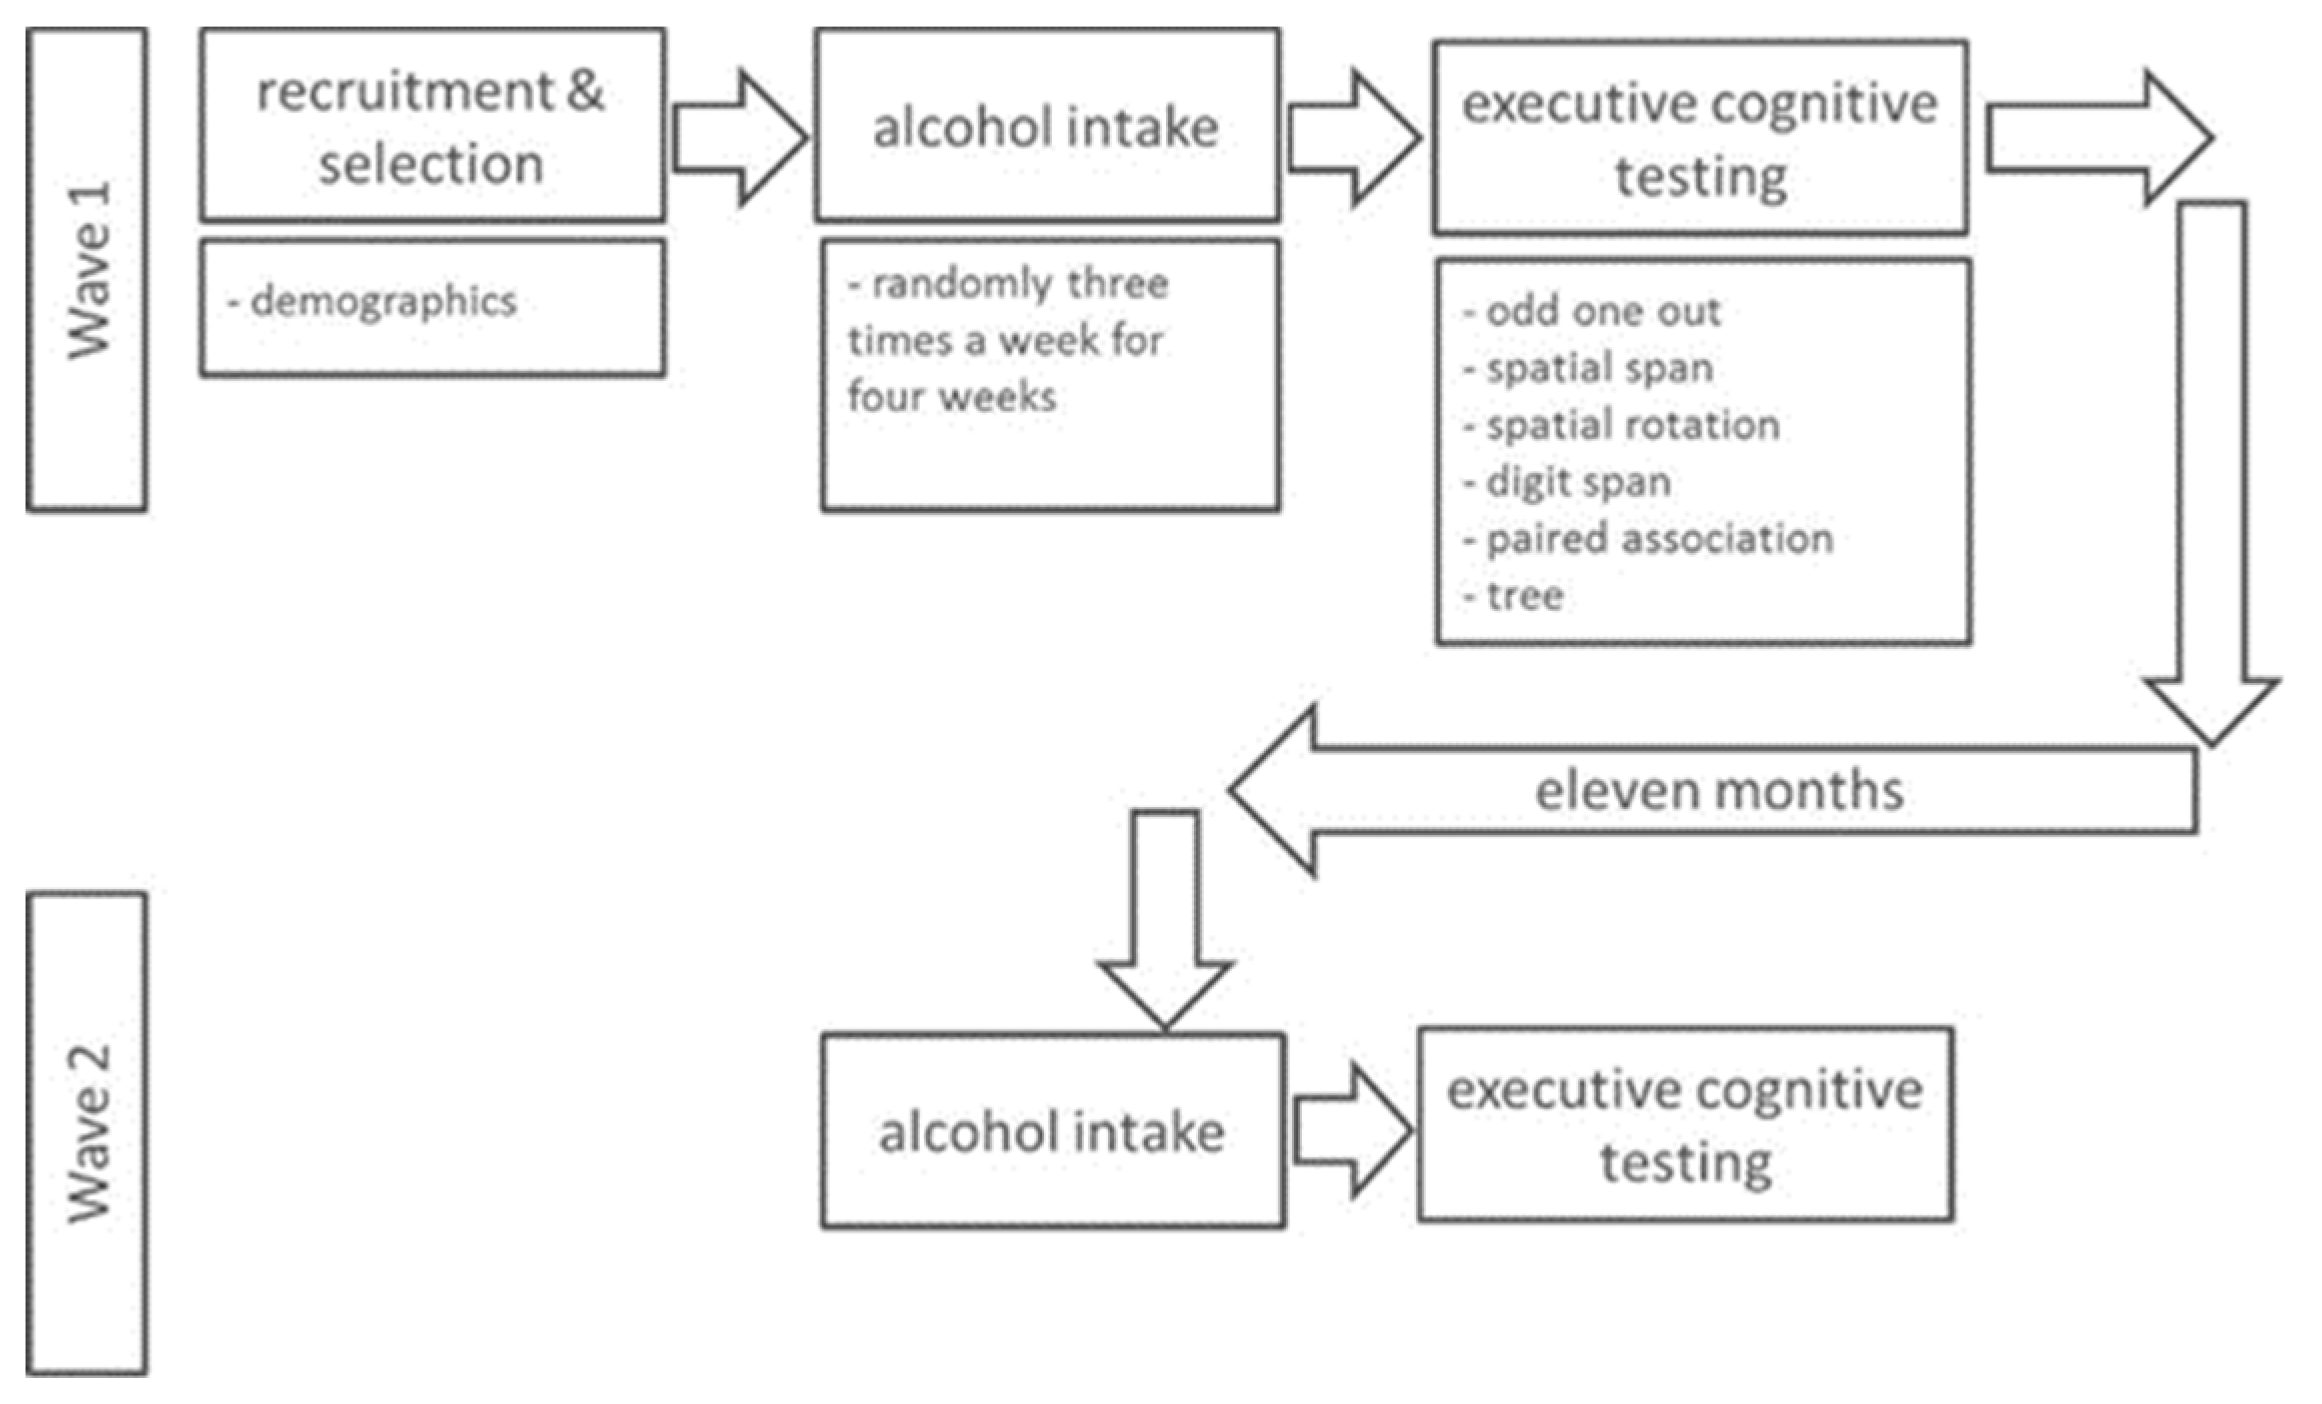
2.3. Cognition Tests
2.4. Procedure
2.5. Laboratory Study
2.6. Data Analysis
3. Results
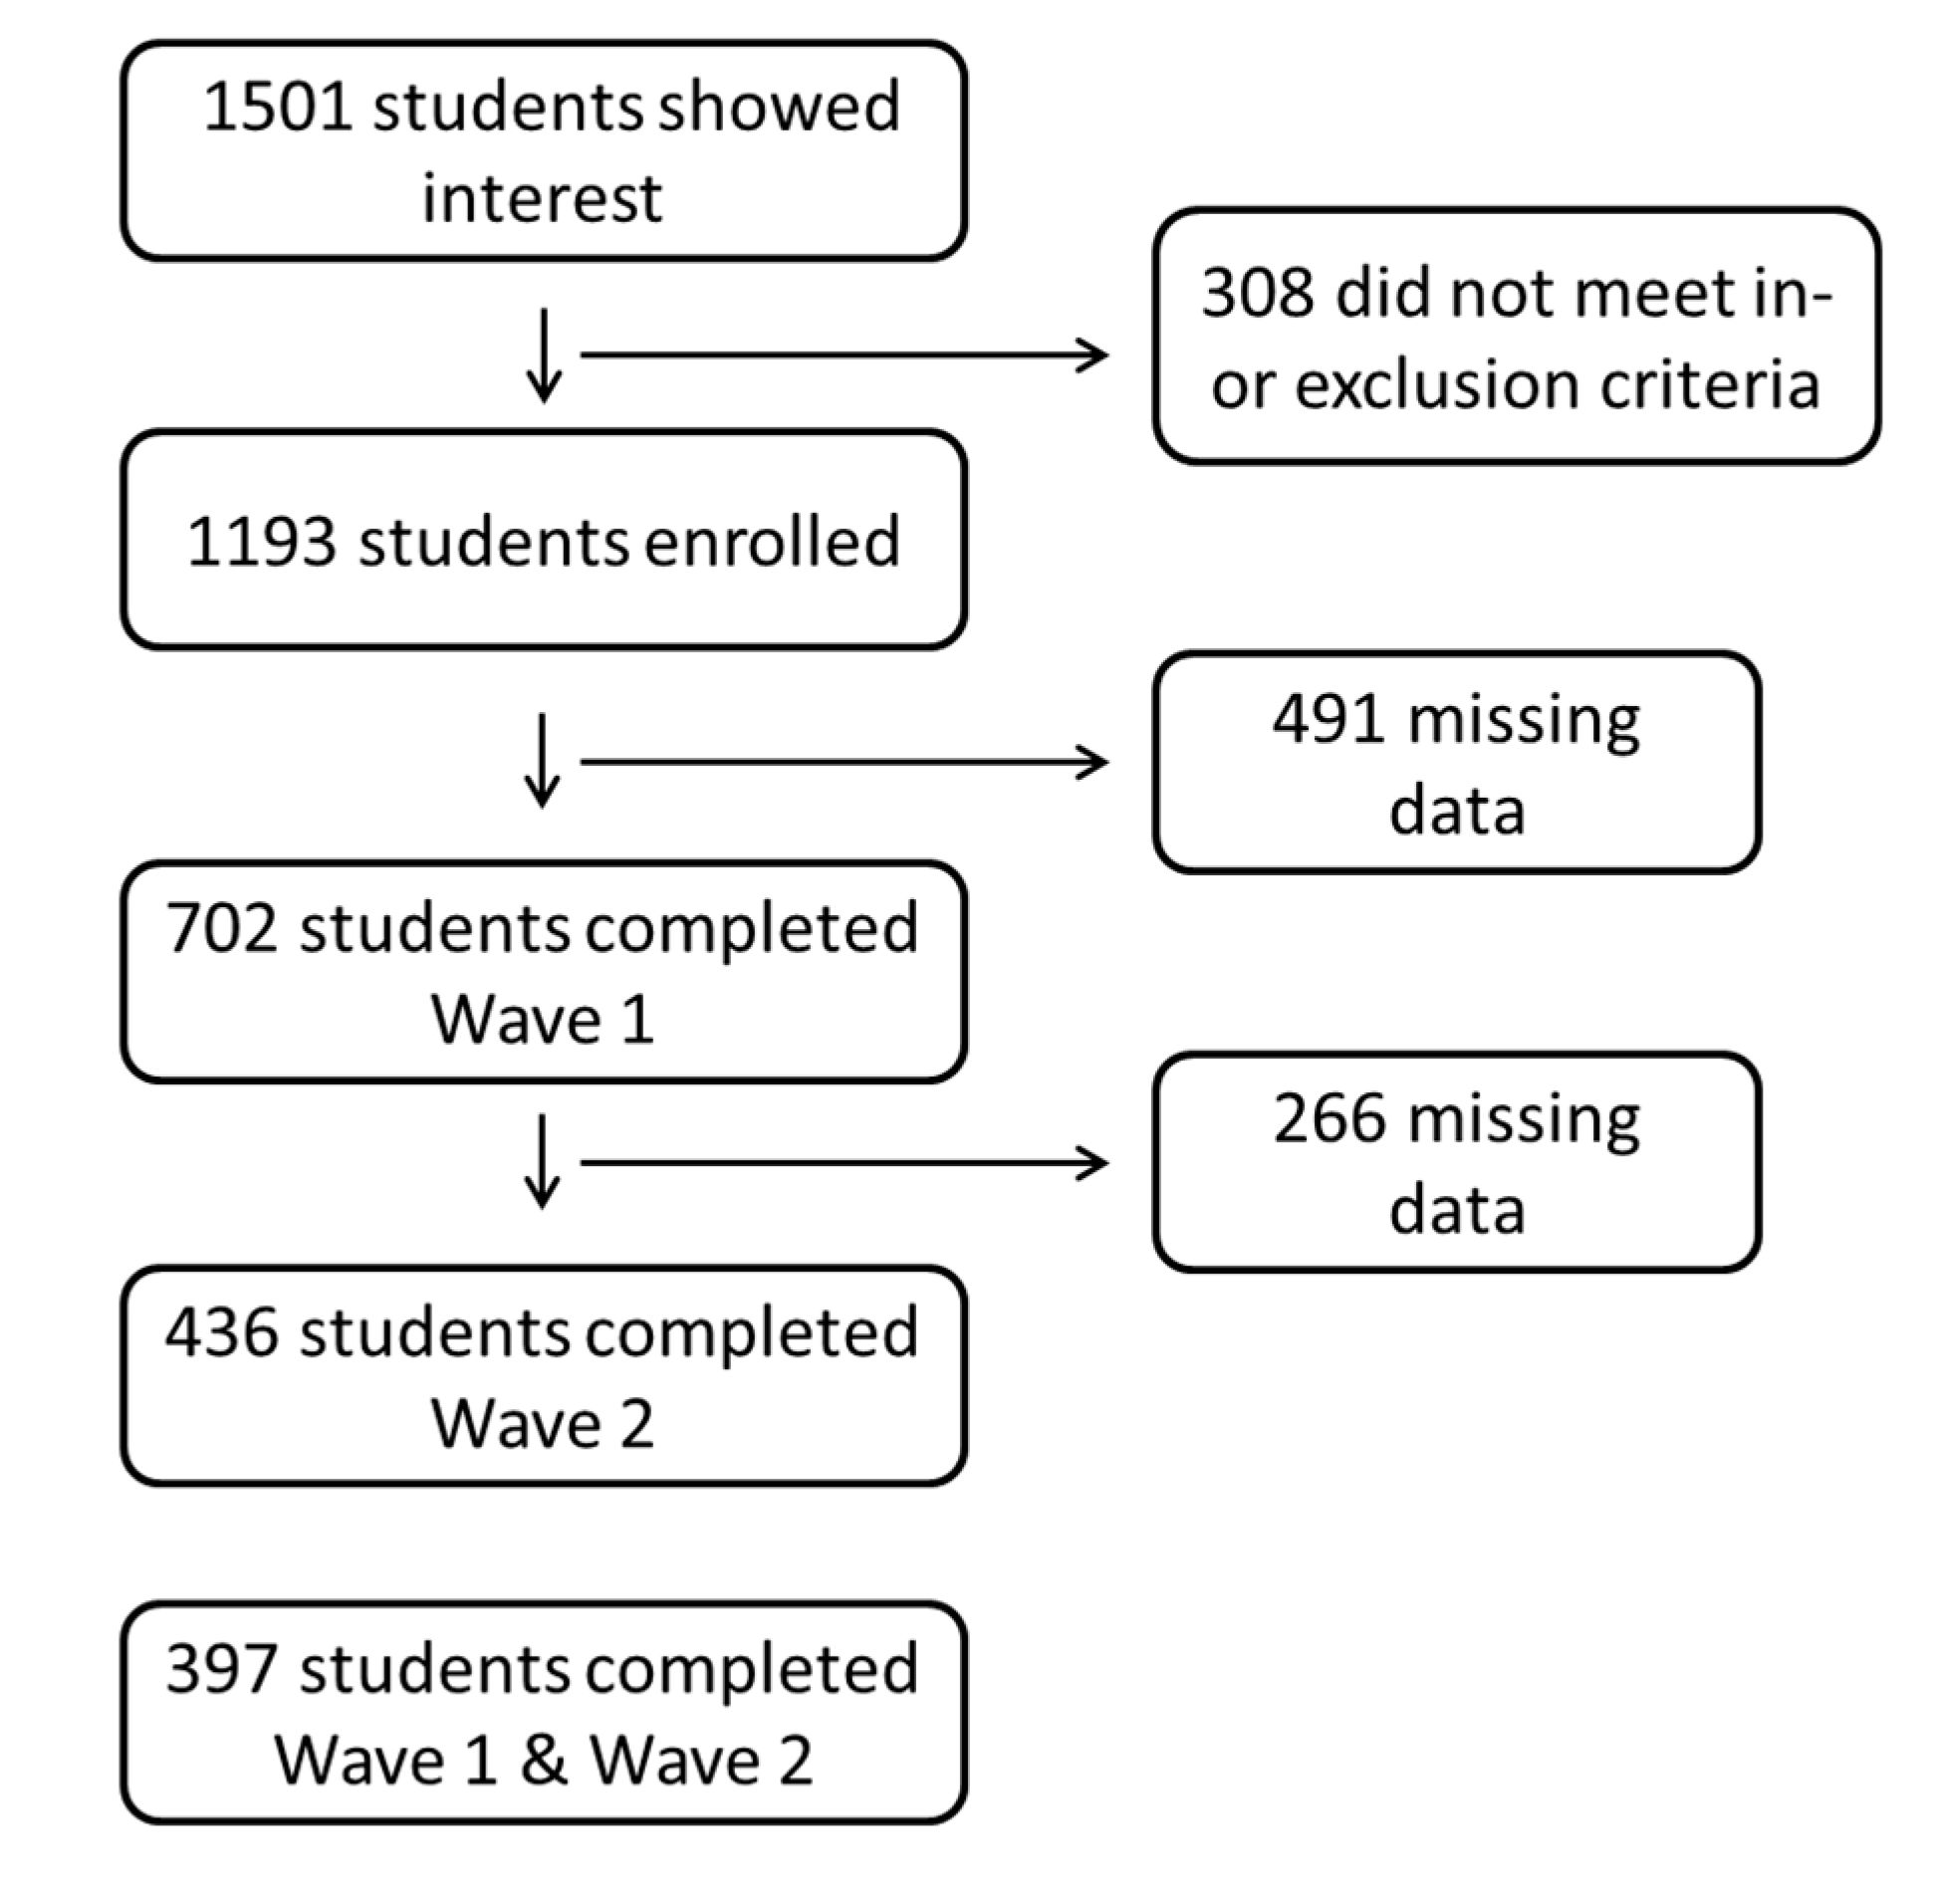
3.1. Participants
3.2. Alcohol Consumption: Levels and Patterns
3.3. Cognitive Performance
3.4. Alcohol Consumption and Cognitive Performance
3.5. Drinking Patterns and Cognitive Performance
3.6. Post Hoc Testing
4. Discussion
Supplementary Materials
Author Contributions
Funding
Acknowledgments
Conflicts of Interest
References
- Dutch Ministry of Health. Key Figures on Alcohol and Young People. 2017. Available online: https://www.staatvenz.nl/kerncijfers/alcohol-jongeren (accessed on 13 June 2018).
- Paus, T.; Keshavan, M.; Giedd, J.N. Why do many psychiatric disorders emerge during adolescence? Nat. Rev. Neurosci. 2008, 9, 947–957. [Google Scholar] [CrossRef] [PubMed]
- Giedd, J.N.; Blumenthal, J.; Jeffries, N.O.; Castellanos, F.X.; Liu, H.; Zijdenbos, A.; Paus, T.; Evans, A.C.; Rapoport, J.L. Brain development during childhood and adolescence: A longitudinal MRI study. Nat. Neurosci. 1999, 2, 861–863. [Google Scholar] [CrossRef] [PubMed]
- Boelema, S.R.; Harakeh, Z.; Ormel, J.; Hartman, C.A.; Vollebergh, W.A.; van Zandvoort, M.J. Executive functioning shows differential maturation from early to late adolescence: Longitudinal findings from a TRAILS study. Neuropsychology 2014, 28, 177–187. [Google Scholar] [CrossRef]
- Clark, D.B.; Thatcher, D.L.; Tapert, S.F. Alcohol, psychological dysregulation, and adolescent brain development. Alcohol. Clin. Exp. Res. 2008, 32, 375–385. [Google Scholar] [CrossRef]
- Oscar-Berman, M.; Marinkovic, K. Alcohol: Effects on neurobehavioral functions and the brain. Neuropsychol. Rev. 2007, 17, 239–257. [Google Scholar] [CrossRef]
- Nixon, K.; McClain, J.A. Adolescence as a critical window for developing an alcohol use disorder: Current findings in neuroscience. Curr. Opin. Psychiatry 2010, 23, 227–232. [Google Scholar] [CrossRef]
- Crego, A.; Rodriguez-Holguin, S.; Parada, M.; Mota, N.; Corral, M.; Cadaveira, F. Reduced anterior prefrontal cortex activation in young binge drinkers during a visual working memory task. Drug Alcohol Depend. 2010, 109, 45–56. [Google Scholar] [CrossRef]
- Crego, A.; Holguin, S.R.; Parada, M.; Mota, N.; Corral, M.; Cadaveira, F. Binge drinking affects attentional and visual working memory processing in young university students. Alcohol. Clin. Exp. Res. 2009, 33, 1870–1879. [Google Scholar] [CrossRef]
- Winward, J.L.; Hanson, K.L.; Bekman, N.M.; Tapert, S.F.; Brown, S.A. Adolescent heavy episodic drinking: Neurocognitive functioning during early abstinence. J. Int. Neuropsychol. Soc. JINS 2014, 20, 218–229. [Google Scholar] [CrossRef]
- Carbia, C.; Cadaveira, F.; Lopez-Caneda, E.; Caamano-Isorna, F.; Rodriguez Holguin, S.; Corral, M. Working memory over a six-year period in young binge drinkers. Alcohol 2017, 61, 17–23. [Google Scholar] [CrossRef]
- Nguyen-Louie, T.T.; Tracas, A.; Squeglia, L.M.; Matt, G.E.; Eberson-Shumate, S.; Tapert, S.F. Learning and Memory in Adolescent Moderate, Binge, and Extreme-Binge Drinkers. Alcohol. Clin. Exp. Res. 2016, 40, 1895–1904. [Google Scholar] [CrossRef] [PubMed]
- Parada, M.; Corral, M.; Mota, N.; Crego, A.; Rodriguez Holguin, S.; Cadaveira, F. Executive functioning and alcohol binge drinking in university students. Addict. Behav. 2012, 37, 167–172. [Google Scholar] [CrossRef] [PubMed]
- Squeglia, L.M.; Pulido, C.; Wetherill, R.R.; Jacobus, J.; Brown, G.G.; Tapert, S.F. Brain response to working memory over three years of adolescence: Influence of initiating heavy drinking. J. Stud. Alcohol Drugs 2012, 73, 749–760. [Google Scholar] [CrossRef] [PubMed]
- Wetherill, R.R.; Squeglia, L.M.; Yang, T.T.; Tapert, S.F. A longitudinal examination of adolescent response inhibition: Neural differences before and after the initiation of heavy drinking. Psychopharmacology 2013, 230, 663–671. [Google Scholar] [CrossRef]
- Hendriks, H.F.J.; Schrieks, I.C. Adolescent alcohol consumption: Brain health outcomes. J. Child Adolesc. Behav. 2015, 3, 238. [Google Scholar] [CrossRef]
- Randall, D.C.; Elsabagh, S.M.; Hartley, D.E.; File, S.E. Does drinking have effects on mood and cognition in male and female students? Pharmacol. Biochem. Behav. 2004, 78, 629–638. [Google Scholar] [CrossRef]
- Boelema, S.R.; Harakeh, Z.; van Zandvoort, M.J.; Reijneveld, S.A.; Verhulst, F.C.; Ormel, J.; Vollebergh, W.A. Adolescent Heavy Drinking Does Not Affect Maturation of Basic Executive Functioning: Longitudinal Findings from the TRAILS Study. PLoS ONE 2015, 10, e0139186. [Google Scholar] [CrossRef]
- Moskowitz, D.S.; Young, S.N. Ecological momentary assessment: What it is and why it is a method of the future in clinical psychopharmacology. J. Psychiatry Neurosci. JPN 2006, 31, 13–20. [Google Scholar]
- Mostofsky, E.; Mukamal, K.J.; Giovannucci, E.L.; Stampfer, M.J.; Rimm, E.B. Key Findings on Alcohol Consumption and a Variety of Health Outcomes from the Nurses’ Health Study. Am. J. Public Health 2016, 106, 1586–1591. [Google Scholar] [CrossRef]
- Bewick, B.M.; Mulhern, B.; Barkham, M.; Trusler, K.; Hill, A.J.; Stiles, W.B. Changes in undergraduate student alcohol consumption as they progress through university. BMC Public Health 2008, 8, 163. [Google Scholar] [CrossRef]
- Burke, T.A.; Olino, T.M.; Alloy, L.B. Initial Psychometric Validation of the Non-Suicidal Self-Injury Scar Cognition Scale. J. Psychopathol. Behav. Assess. 2017, 39, 546–562. [Google Scholar] [CrossRef] [PubMed]
- Owen, A.M.; Hampshire, A.; Grahn, J.A.; Stenton, R.; Dajani, S.; Burns, A.S.; Howard, R.J.; Ballard, C.G. Putting brain training to the test. Nature 2010, 465, 775–778. [Google Scholar] [CrossRef] [PubMed]
- Levine, B.; Kovacevic, N.; Nica, E.I.; Schwartz, M.L.; Gao, F.; Black, S.E. Quantified MRI and cognition in TBI with diffuse and focal damage. NeuroImage Clin. 2013, 2, 534–541. [Google Scholar] [CrossRef] [PubMed]
- Brenkel, M.; Shulman, K.; Hazan, E.; Herrmann, N.; Owen, A.M. Assessing Capacity in the Elderly: Comparing the MoCA with a Novel Computerized Battery of Executive Function. Dement. Geriatr. Cogn. Disord. Extra 2017, 7, 249–256. [Google Scholar] [CrossRef] [PubMed]
- Cattell, R.B. Culture-Free Intelligence Test, Scale 1. In The Measurement of Intelligence; Institute of Personality and Ability: Champaign, IL, USA, 1949. [Google Scholar]
- Kessels, R.P.; van Zandvoort, M.J.; Postma, A.; Kappelle, L.J.; de Haan, E.H. The Corsi Block-Tapping Task: Standardization and normative data. Appl. Neuropsychol. 2000, 7, 252–258. [Google Scholar] [CrossRef] [PubMed]
- Silverman, I.I.; Choi, J.; Mackewn, A.; Fisher, M.; Moro, J.; Olshansky, E. Evolved mechanisms underlying wayfinding. further studies on the hunter-gatherer theory of spatial sex differences. Evol. Hum. Behav. 2000, 21, 201–213. [Google Scholar] [CrossRef]
- Jasinski, L.J.; Berry, D.T.; Shandera, A.L.; Clark, J.A. Use of the Wechsler Adult Intelligence Scale Digit Span subtest for malingering detection: A meta-analytic review. J. Clin. Exp. Neuropsychol. 2011, 33, 300–314. [Google Scholar] [CrossRef]
- Gould, R.L.; Brown, R.G.; Owen, A.M.; Bullmore, E.T.; Williams, S.C.; Howard, R.J. Functional neuroanatomy of successful paired associate learning in Alzheimer’s disease. Am. J. Psychiatry 2005, 162, 2049–2060. [Google Scholar] [CrossRef]
- Shallice, T. Specific impairments of planning. Philosop. Trans. R. Soc. Lond. Ser. B Biol. Sci. 1982, 298, 199–209. [Google Scholar] [CrossRef]
- Phan, D.V.; Chan, C.L.; Pan, R.H.; Yang, N.P.; Hsu, H.C.; Ting, H.W.; Lai, K.R. A Study of the Effects of Daily Physical Activity on Memory and Attention Capacities in College Students. J. Healthc. Eng. 2018, 2018, 2942930. [Google Scholar] [CrossRef]
- Greenfield, T.K.; Kerr, W.C. Alcohol measurement methodology in epidemiology: Recent advances and opportunities. Addiction 2008, 103, 1082–1099. [Google Scholar] [CrossRef] [PubMed]
- Piasecki, T.M. Assessment of Alcohol Use in the Natural Environment. Alcohol. Clin. Exp. Res. 2019, 43, 564–577. [Google Scholar] [CrossRef] [PubMed]
- Cheng, C.; Huang, C.L.; Tsai, C.J.; Chou, P.H.; Lin, C.C.; Chang, C.K. Alcohol-related dementia: A systemic review of epidemiological studies. Psychosomatics 2017, 58, 331–342. [Google Scholar] [CrossRef] [PubMed]
- Stamates, A.L.; Lau-Barraco, C. The dimensionality of impulsivity: Perspectives and implications for emerging adult drinking. Exp. Clin. Psychopharmacol. 2017, 25, 521–533. [Google Scholar] [CrossRef]
- Peeters, M.; Janssen, T.; Monshouwer, K.; Boendermaker, W.; Pronk, T.; Wiers, R.; Vollebergh, W. Weaknesses in executive functioning predict the initiating of adolescents’ alcohol use. Dev. Cogn. Neurosci. 2015, 16, 139–146. [Google Scholar] [CrossRef]
- Xu, W.; Wang, H.; Wan, Y.; Tan, C.; Li, J.; Tan, L.; Yu, J.T. Alcohol consumption and dementia risk: A dose-response meta-analysis of prospective studies. Eur. J. Epidemiol. 2017, 32, 31–42. [Google Scholar] [CrossRef]
- Ilomaki, J.; Jokanovic, N.; Tan, E.C.; Lonnroos, E. Alcohol Consumption, Dementia and Cognitive Decline: An Overview of Systematic Reviews. Curr. Clin. Pharmacol. 2015, 10, 204–212. [Google Scholar] [CrossRef]
- Ronksley, P.E.; Brien, S.E.; Turner, B.J.; Mukamal, K.J.; Ghali, W.A. Association of alcohol consumption with selected cardiovascular disease outcomes: A systematic review and meta-analysis. BMJ 2011, 342, d671. [Google Scholar] [CrossRef]
- van Hemel-Ruiter, M.E.; de Jong, P.J.; Ostafin, B.D.; Wiers, R.W. Reward sensitivity, attentional bias, and executive control in early adolescent alcohol use. Addict. Behav. 2015, 40, 84–90. [Google Scholar] [CrossRef]


| Wave 1 | Wave 2 | |||||
|---|---|---|---|---|---|---|
| Men | Women | Total | Men | Women | Total | |
| Number | 251 | 451 | 702 | 147 | 289 | 436 |
| Age (y) | 21.1 ± 1.8 | 20.8 ± 1.6 | 20.9 ± 1.6 | |||
| Education | ||||||
| Polytechnic University (n) | 44 | 120 | 164 | 21 | 70 | 91 |
| University (n) | 207 | 331 | 538 | 126 | 219 | 345 |
| Characteristics | Abstainers | Occasional Moderate | Frequent Moderate | Occasional Excessive | Frequent Excessive |
|---|---|---|---|---|---|
| Number/% at Wave 1 | 84/12 | 159/23 | 108/15 | 168/24 | 183/26 |
| Number/% at Wave 2 | 43/10 | 103/23 | 82/19 | 127/29 | 81/19 |
| Female [%] at Wave 1 | 75 | 74 | 79 | 49 | 57 |
| Female [%] at Wave 2 | 74 | 79 | 80 | 50 | 57 |
| University student [%] at Wave 1 | 68 | 73 | 77 | 79 | 81 |
| University student [%] at Wave 2 | 67 | 78 | 80 | 80 | 84 |
| Alc. Cons. * at Wave 1 [gram/day] | 0 ± 0 | 6 ± 6 | 15 ± 10 | 21 ± 15 | 50 ± 28 |
| Alc. Cons. * at Wave 2 [gram/day] | 0 ± 0 | 6 ± 5 | 16 ± 10 | 21 ± 13 | 48 ± 27 |
| Test | Wave 1 | Wave 2 | Δ (Wave 2) − (Wave 1) * | p-Value |
|---|---|---|---|---|
| N = 702 | N = 436 | N = 398 | ||
| Digit span | 6.7 ± 1.6 | 6.8 ± 1.9 | 0.1 ± 1.8 | 0.85 |
| Odd one out | 10.2 ± 3.9 | 10.1 ± 4.6 | −0.1 ± 5.2 | 0.12 |
| Paired association | 5.2 ± 1.2 | 5.1 ± 1.4 | −0.1 ± 1.6 | 0.62 |
| Spatial rotation | 105 ± 42 | 115 ± 46 | 12 ± 51 | 0.35 |
| Spatial span | 6.2 ± 1.2 | 6.1 ± 1.2 | −0.0 ± 1.4 | 0.49 |
| Tree task | 29 ± 13 | 35 ± 13 | 5 ± 15 | 0.71 |
© 2020 by the authors. Licensee MDPI, Basel, Switzerland. This article is an open access article distributed under the terms and conditions of the Creative Commons Attribution (CC BY) license (http://creativecommons.org/licenses/by/4.0/).
Share and Cite
Hendriks, H.; van de Rest, O.; Snippe, A.; Kieboom, J.; Hogenelst, K. Alcohol Consumption, Drinking Patterns, and Cognitive Performance in Young Adults: A Cross-Sectional and Longitudinal Analysis. Nutrients 2020, 12, 200. https://doi.org/10.3390/nu12010200
Hendriks H, van de Rest O, Snippe A, Kieboom J, Hogenelst K. Alcohol Consumption, Drinking Patterns, and Cognitive Performance in Young Adults: A Cross-Sectional and Longitudinal Analysis. Nutrients. 2020; 12(1):200. https://doi.org/10.3390/nu12010200
Chicago/Turabian StyleHendriks, Henk, Ondine van de Rest, Almar Snippe, Jasper Kieboom, and Koen Hogenelst. 2020. "Alcohol Consumption, Drinking Patterns, and Cognitive Performance in Young Adults: A Cross-Sectional and Longitudinal Analysis" Nutrients 12, no. 1: 200. https://doi.org/10.3390/nu12010200
APA StyleHendriks, H., van de Rest, O., Snippe, A., Kieboom, J., & Hogenelst, K. (2020). Alcohol Consumption, Drinking Patterns, and Cognitive Performance in Young Adults: A Cross-Sectional and Longitudinal Analysis. Nutrients, 12(1), 200. https://doi.org/10.3390/nu12010200