Trans Fat Labeling Information on Brazilian Packaged Foods

 ,
,
Abstract
1. Introduction
2. Materials and Methods
2.1. Data Collection
2.2. Data Quality
2.3. Search for Terms in the List of Ingredients
- ○
- With trans fats: foods with information indicating a content of trans fats greater than zero on the nutrition facts panel;
- ○
- False negatives: foods with no trans fats declared on the nutrition facts panel but with specific sources of trans fats in the list of ingredients;
- ○
- Possible false negatives: foods with no trans fats declared on the nutrition facts panel but with unspecific sources of trans fats in the list of ingredients;
- ○
- Without trans fats: foods with no specific or unspecific terms related to trans fats in the list of ingredients.
2.4. Statistical Analysis
3. Results
4. Discussion
Author Contributions
Funding
Acknowledgments
Conflicts of Interest
Appendix A

| Food Category | Foods Included |
|---|---|
| Breakfast cereals and granola bars | Corn flakes, flavored oats, infant cereals, granolas, mueslis, granola bars, porridges, mix of cereals and fruits. |
| Bakery products | Breads, toasts, and cakes, including powders. |
| Convenience foods | Ready meals, French fries to frying, instant rice, instant noodles, instant soups, instant mashed potatoes, filled pastas, pizzas, pies, sandwiches, baby foods. |
| Unsweetened dairy products | Natural yogurts, milks, milk powders, milk compounds. Only products without sugar or nonnutritive sweeteners. |
| Sweetened dairy products | Yogurts, flavored milks, fermented milk, milk compounds, dairy beverages. |
| Snacks | Salted peanuts, salty snacks, potato chips, potato sticks, microwave popcorn (all flavors). |
| Cookies and crackers | Sweet and salty biscuits and cookies. |
| Canned vegetables | Canned beans and vegetables. |
| Oils and fats | Oils, margarines, butters, milk creams, vegetal fats. |
| Sauces, herbs, and dressings | Sauces, mayonnaises, herbs, catchup, salad dressings. |
| Coffee and tea | Coffees and herbs to prepare tea. |
| Candies and desserts | Chocolates, boiled sweets, flavored milk powder, jellies, cocoa powder, syrups, chocolate spreads, chewing gum, condensed milk, marshmallows, ice creams. Including versions with nonnutritive sweeteners. |
| Cereals, beans, other grain products | Beans, flours, rice, corns, pastas. |
| Packaged fruits and vegetables | Fruits and vegetables in natura, frozen fruit pulp, frozen vegetables. |
| Meat, poultry, seafood, and eggs | Meat, poultry, seafood, and egg, including chilled and frozen products. |
| Sugar and other nonnutritive sweeteners | Sugar, honey, nonnutritive sweeteners. |
| Processed meats | Burgers, sausages, canned fish, smoked meats, seasoned meats, salted meats, hams, salami, meat pates. |
| Fruit juices | Products declared as juices, fruit juices without water or added sugar, coconut water. |
| Nectars | Nectars made with juice and added water and/or sugar. |
| Fruit-flavored drinks | Fruit drink powder, fruit punch concentrate, fruit-flavored beverages. |
| Carbonated beverages | Sodas. Including diet and light versions. |
| Other beverages | Plant-based beverages, ready-to-drink teas, isotonic drinks, coconut milk. |
| Nuts and seeds | Nuts and seeds, including salted nuts. |
| Cheeses and cream cheeses | Cheeses, and cream cheeses. |
| Fruits preserves | Fruit jellies, fruit preserves, canned fruits, dried fruits, fruits sorbet. |
References
- Mozaffarian, D.; Katan, M.B.; Ascherio, A.; Stampfer, M.J.; Willett, W.C. Trans fatty acids and cardiovascular disease. N. Engl. J. Med. 2006, 354, 1601–1613. [Google Scholar] [CrossRef] [PubMed]
- Albers, M.J.; Harnack, L.J.; Steffen, L.M.; Jacobs, D.R. 2006 marketplace survey of trans-fatty acid content of margarines and butters, cookies and snack cakes, and savory snacks. J. Am. Diet. Assoc. 2008, 108, 367–370. [Google Scholar] [CrossRef] [PubMed]
- Silveira, B.M.; Gonzalez-Chica, D.A.; da Costa Proença, R.P. Reporting of trans-fat on labels of Brazilian food products. Public Health Nutr. 2013, 16, 2146–2153. [Google Scholar] [CrossRef] [PubMed]
- Mozaffarian, D.; Stampfer, M.J. Removing industrial trans fat from foods. BMJ 2010, 340, c1826. [Google Scholar] [CrossRef] [PubMed]
- Roe, M.; Pinchen, H.; Church, S.; Elahi, S.; Walker, M.; Farron-Wilson, M.; Buttriss, J.; Finglas, P. Trans fatty acids in a range of UK processed foods. Food Chem. 2013, 140, 427–431. [Google Scholar] [CrossRef] [PubMed]
- Mozaffarian, D.; Aro, A.; Willett, W.C. Health effects of trans-fatty acids: Experimental and observational evidence. Eur. J. Clin. Nutr. 2009, 63, S5–S21. [Google Scholar] [CrossRef] [PubMed]
- Teegala, S.M.; Willett, W.C.; Mozaffarian, D. Consumption and health effects of trans fatty acids: A review. J. AOAC Int. 2009, 92, 1250–1257. [Google Scholar] [PubMed]
- Bendsen, N.T.; Christensen, R.; Bartels, E.M.; Astrup, A. Consumption of industrial and ruminant trans fatty acids and risk of coronary heart disease: A systematic review and meta-analysis of cohort studies. Eur. J. Clin. Nutr. 2011, 65, 773–783. [Google Scholar] [CrossRef] [PubMed]
- WHO. World Health Organization. Draft Guidelines: Saturated Fatty Acid and Trans-Fatty Acid Intake for Adults and Children; WHO: Geneva, Switzerland, 2018. [Google Scholar]
- Wanders, A.J.; Zock, P.L.; Brouwer, I.A. Trans Fat Intake and Its Dietary Sources in General Populations Worldwide: A Systematic Review. Nutrients 2017, 9, 840. [Google Scholar] [CrossRef]
- Hyseni, L.; Bromley, H.; Kypridemos, C.; O’Flaherty, M.; Lloyd-Williams, F.; Guzman-Castillo, M.; Pearson-Stuttard, J.; Capewell, S. Systematic review of dietary trans-fat reduction interventions. Bull. World Health Organ. 2017, 95, 821–830G. [Google Scholar] [CrossRef]
- L’abbé, M.R.; Stender, S.; Skeaff, C.M.; Tavella, M. Approaches to removing trans fats from the food supply in industrialized and developing countries. Eur. J. Clin. Nutr. 2009, 63, S50–S67. [Google Scholar]
- WHO. World Health Organization. Thirteenth General Programme of Work, 2019–2023: Promote Health, Keep the World Safe, Serve the Vulnerable; WHO: Geneva, Switzerland, 2019. [Google Scholar]
- Brasil Agência Nacional de Vigilância Sanitária. Resolução-RDC Anvisa nº. 360, de 23 de Dezembro de 2003—Aprova o Regulamento Técnico Sobre Rotulagem Nutricional de Produtos Embalados; Brasil Agência Nacional de Vigilância Sanitária: Brasília, Brazil, 2003.
- Brasil Agência Nacional de Vigilância Sanitária. Resolução-RDC Anvisa nº. 359, de 23 de Dezembro de 2003; Brasil Agência Nacional de Vigilância Sanitária: Brasília, Brazil, 2003.
- Kraemer, M.V.D.S.; Machado, P.P.; Kliemann, N.; Chica, D.A.G.; Proença, R.P.D.C. The Brazilian population consumes larger serving sizes than those informed on labels. Br. Food J. 2015, 117, 719–730. [Google Scholar] [CrossRef]
- Brasil Agência Nacional de Vigilância Sanitária. Resolução da Diretoria Colegiada—RDC Nº 54, de 12 de Novembro de 2012. Dispõe Sobre o Regulamento Técnico Sobre Informação Nutricional Complementar; Brasil Agência Nacional de Vigilância Sanitária: Brasília, Brazil, 2012.
- Brasil Ministério da Saúde. Nota técnica. Ações do Governo Brasileiro Sobre as Gorduras Trans; Ministério da Saúde: Rio de Janeiro, Brazil, 2008. Available online: http://189.28.128.100/dab/docs/portaldab/documentos/nota_imprensa_gorduras_trans.pdf (accessed on 17 June 2019).
- Costa Louzada, M.L.; Martins, A.P.; Canella, D.S.; Baraldi, L.G.; Levy, R.B.; Claro, R.M.; Moubarac, J.C.; Cannon, G.; Monteiro, C.A. Ultra-processed foods and the nutritional dietary profile in Brazil. Rev. Saude Publica 2015, 49, 38. [Google Scholar] [CrossRef] [PubMed]
- Martins, A.P.B.; Levy, R.B.; Claro, R.M.; Moubarac, J.C.; Monteiro, C.A. Participação crescente de produtos ultraprocessados na dieta brasileira (1987–2009). Rev. Saúde Pública 2013, 47, 656–665. [Google Scholar] [CrossRef] [PubMed]
- Da Costa Louzada, M.L.; Ricardo, C.Z.; Steele, E.M.; Levy, R.B.; Cannon, G.; Monteiro, C.A. The share of ultra-processed foods determines the overall nutritional quality of diets in Brazil. Public Health Nutr. 2018, 21, 94–102. [Google Scholar] [CrossRef] [PubMed]
- Collaborators, G.B. Burden of disease in Brazil, 1990–2016: A systematic subnational analysis for the Global Burden of Disease Study 2016. Lancet 2018. [Google Scholar] [CrossRef]
- Wang, Q.; Afshin, A.; Yakoob, M.Y.; Singh, G.M.; Rehm, C.D.; Khatibzadeh, S.; Micha, R.; Shi, P.; Mozaffarian, D. Global Burden of Diseases Nutrition and Chronic Diseases Expert Group (NutriCoDE). Impact of Nonoptimal Intakes of Saturated, Polyunsaturated, and Trans Fat on Global Burdens of Coronary Heart Disease. J. Am. Heart Assoc. 2016, 5. [Google Scholar] [CrossRef]
- Baena, C.P.; Chowdhury, R.; Schio, N.A.; Sabbag, A.E.; Guarita-Souza, L.C.; Olandoski, M.; Franco, O.H.; Faria-Neto, J.R. Ischaemic heart disease deaths in Brazil: Current trends, regional disparities and future projections. Heart 2013, 99, 1359–1364. [Google Scholar] [CrossRef] [PubMed]
- Machado, P.P.; Claro, R.M.; Canella, D.S.; Sarti, F.M.; Levy, R.B. Price and convenience: The influence of supermarkets on consumption of ultra-processed foods and beverages in Brazil. Appetite 2017, 116, 381–388. [Google Scholar] [CrossRef]
- Euromonitor International. Grocery Retailers in Brazil. 2016. Available online: https://www.euromonitor.com/grocery-retailers-in-brazil/report (accessed on 15 March 2017).
- Kanter, R.; Reyes, M.; Corvalán, C. Photographic Methods for Measuring Packaged Food and Beverage Products in Supermarkets. Curr. Dev. Nutr. 2017, 1. [Google Scholar] [CrossRef]
- Naing, L.; Winn, T.; Rusli, B. Practical Issues in Calculating the Sample Size for Prevalence Studies. Arch. Orofac. Sci. 2006, 1, 9–14. [Google Scholar]
- Mike, R.; Stefanie, V. Informas Protocol: Food Labelling Module. 2015. Available online: https://figshare.com/articles/INFORMAS_Protocol_Food_Labelling_Module/5673643 (accessed on 17 June 2019).
- Hallgren, K.A. Computing Inter-Rater Reliability for Observational Data: An Overview and Tutorial. Tutor. Quant. Methods Psychol. 2012, 8, 23–34. [Google Scholar] [CrossRef] [PubMed]
- Dias, F.D.S.L.; Lima, M.F.; Velasco, P.C.D.; Salles-Costa, R.; Sardinha, F.L.D.C.; Carmo, M.D.G.T.D. Were policies in Brazil effective to reducing trans fat from industrial origin in foods? Rev. Saúde Pública 2018, 52. [Google Scholar] [CrossRef] [PubMed]
- ABIA. Associação Brasileira das Indústrias de Alimentação. Relatório Anual 2010. 2010. Available online: https://pt.calameo.com/read/000182377a98ff937e76a (accessed on 17 June 2019).
- Downs, S.M.; Thow, A.M.; Leeder, S.R. The effectiveness of policies for reducing dietary trans fat: A systematic review of the evidence. Bull. World Health Organ. 2013, 91, 262–269H. [Google Scholar] [CrossRef] [PubMed]
- Downs, S.M.; Bloem, M.Z.; Zheng, M.; Catterall, E.; Thomas, B.; Veerman, L.; Wu, J.H. The Impact of Policies to Reduce trans Fat Consumption: A Systematic Review of the Evidence. Curr. Dev. Nutr. 2017, 1. [Google Scholar] [CrossRef] [PubMed]
- European Commission. Report from the Commission to the European Parliament and the Council Regarding Trans Fats in Foods and in the Overall Diet of the Union Population; European Commission: Brussels, Belgium, 2015.
- Ricciuto, L.; Lin, K.; Tarasuk, V. A comparison of the fat composition and prices of margarines between 2002 and 2006, when new Canadian labelling regulations came into effect. Public Health Nutr. 2009, 12, 1270–1275. [Google Scholar] [CrossRef] [PubMed]
- Galdino, T.P.; Antunes, A.R.; Lamas, R.C.; Zingano, M.A.; Cruzat, V.F.; Coutinho, V.F.; Chagas, P. Biscoitos recheados: Quanto mais baratos maior teor de gordura trans? Sci. Med. 2010, 20, 270–276. [Google Scholar]
- De Morais Sato, P.; Mais, L.A.; Khandpur, N.; Ulian, M.D.; Bortoletto Martins, A.P.; Garcia, M.T.; Spinillo, C.G.; Urquizar Rojas, C.F.; Jaime, P.C.; Scagliusi, F.B. Consumers’ opinions on warning labels on food packages: A qualitative study in Brazil. PLoS ONE 2019, 16, e0218813. [Google Scholar] [CrossRef]
- Wang, E.Y.; Wei, H.; Caswell, J.A. The impact of mandatory trans fat labeling on product mix and consumer choice: A longitudinal analysis of the U.S. Market for margarine and spreads. Food Policy 2016, 64, 63–81. [Google Scholar] [CrossRef]
- Pinto, A.L.D.; Miranda, T.L.S.; Ferraz, V.P.; Athayde, D.D.; Salum, A. Determinação e verificação de como a gordura trans é notificada nos rótulos de alimentos, em especial naqueles expressos” 0% gordura trans”/Determination and verification of how” trans” fat is notified on food labels, particularly those expressed as being” 0% trans fat”. Braz. J. Food Technol. 2016, 19, 1. [Google Scholar]
- Nestle, M.; Ludwig, D.S. Front-of-Package Food Labels Public Health or Propaganda? JAMA 2010, 303, 2. [Google Scholar] [CrossRef] [PubMed]
- Monteiro, C.A.; Cannon, G.; Moubarac, J.C.; Levy, R.B.; Louzada, M.L.C.; Jaime, P.C. The UN Decade of Nutrition, the NOVA food classification and the trouble with ultra-processing. Public Health Nutr. 2018, 21, 5–17. [Google Scholar] [CrossRef] [PubMed]
- Ministry of Health of Brazil. Dietary Guidelines for the Brazilian Population; Ministry of Health of Brazil: Brasília, Brazil, 2015.
- Brasil Agência Nacional de Vigilância Sanitária. Relatório Preliminar de Análise de Impacto Regulatório sobre Rotulagem Nutricional; Agencia Nacional de Vigilância Sanitária: Brasília, Brasil, 2018.
- WHO. World Health Organization. Eliminating Trans Fats in Europe: A Policy Brief; WHO: Copenhagen, Denmark, 2015. [Google Scholar]
- Restrepo, B.J.; Rieger, M. Denmark’s Policy on Artificial Trans Fat and Cardiovascular Disease. Am. J. Prev. Med. 2016, 50, 69–76. [Google Scholar] [CrossRef] [PubMed]
- Commission Regulation (EU) 2019/649 Amending Annex III to Regulation (EC) No 1925/2006 of the European Parliament and of the Council as Regards Trans Fat, Other than Trans Fat Naturally Occurring in Fat of Animal Origin. Available online: https://eur-lex.europa.eu/legal-content/EN/TXT/PDF/?uri=CELEX:32019R0649&from=EN (accessed on 17 June 2019).
- PAHO. Pan American Health Organization. Trans Fat Free Americas; Pan American Health Organization: Washington, DC, USA, 2008. [Google Scholar]
- Colón-Ramos, U.; Monge-Rojas, R.; Campos, H. Impact of WHO recommendations to eliminate industrial trans-fatty acids from the food supply in Latin America and the Caribbean. Health Policy Plan 2014, 29, 529–541. [Google Scholar] [CrossRef] [PubMed]
- FDA. Food and Drug Administration. Final Determination Regarding Partially Hydrogenated Oils (Removing Trans Fat). Available online: https://www.fda.gov/food/ingredientspackaginglabeling/foodadditivesingredients/ucm449162.htm (accessed on 17 June 2019).
- WHO. World Health Organization. REPLACE Trans Fat: An Action Package to Eliminate Industrially-Produced Trans-Fatty Acids. 2018. Available online: https://www.who.int/docs/default-source/documents/replace-transfats/replace-action-package.pdf (accessed on 17 June 2019).
- Stender, S.; Astrup, A.; Dyerberg, J. What went in when trans went out? N. Engl. J. Med. 2009, 361, 314–316. [Google Scholar] [CrossRef] [PubMed]
- Mozaffarian, D.; Jacobson, M.F.; Greenstein, J.S. Food reformulations to reduce trans fatty acids. N. Engl. J. Med. 2010, 362, 2037–2039. [Google Scholar] [CrossRef] [PubMed]
- Mensink, R.P.; Sanders, T.A.; Baer, D.J.; Hayes, K.C.; Howles, P.N.; Marangoni, A. The Increasing Use of Interesterified Lipids in the Food Supply and Their Effects on Health Parameters. Adv. Nutr. 2016, 7, 719–729. [Google Scholar] [CrossRef] [PubMed]
- Mills, C.E.; Hall, W.L.; Berry, S.E.E. What are interesterified fats and should we be worried about them in our diet? Nutr. Bull. 2017, 42, 153–158. [Google Scholar] [CrossRef]
- Astrup, A.; Bertram, H.C.; Bonjour, J.P.; de Groot, L.C.; de Oliveira Otto, M.C.; Feeney, E.L.; Garg, M.L.; Givens, I.; Kok, F.J.; Krauss, R.M.; et al. WHO draft guidelines on dietary saturated and trans fatty acids: Time for a new approach? BMJ 2019, 366, l4137. [Google Scholar] [CrossRef]
- Scrinis, G.; Monteiro, C.A. Ultra-processed foods and the limits of product reformulation. Public Health Nutr. 2018, 21, 247–252. [Google Scholar] [CrossRef] [PubMed]
- Presidência da República. Lei Nº 8.078, de 11 de setembro de 1990. Dispõe Sobre A Proteção do Consumidor E dá Outras Providências; Presidência da República: Brasília, Brasil, 1990. [Google Scholar]


| Type of Term | Searched Items |
|---|---|
| Specific | Partially hydrogenated fat, hydrogenated vegetable oil, hydrogenated. |
| Unspecific | Vegetable fat, margarine, vegetable cream. |
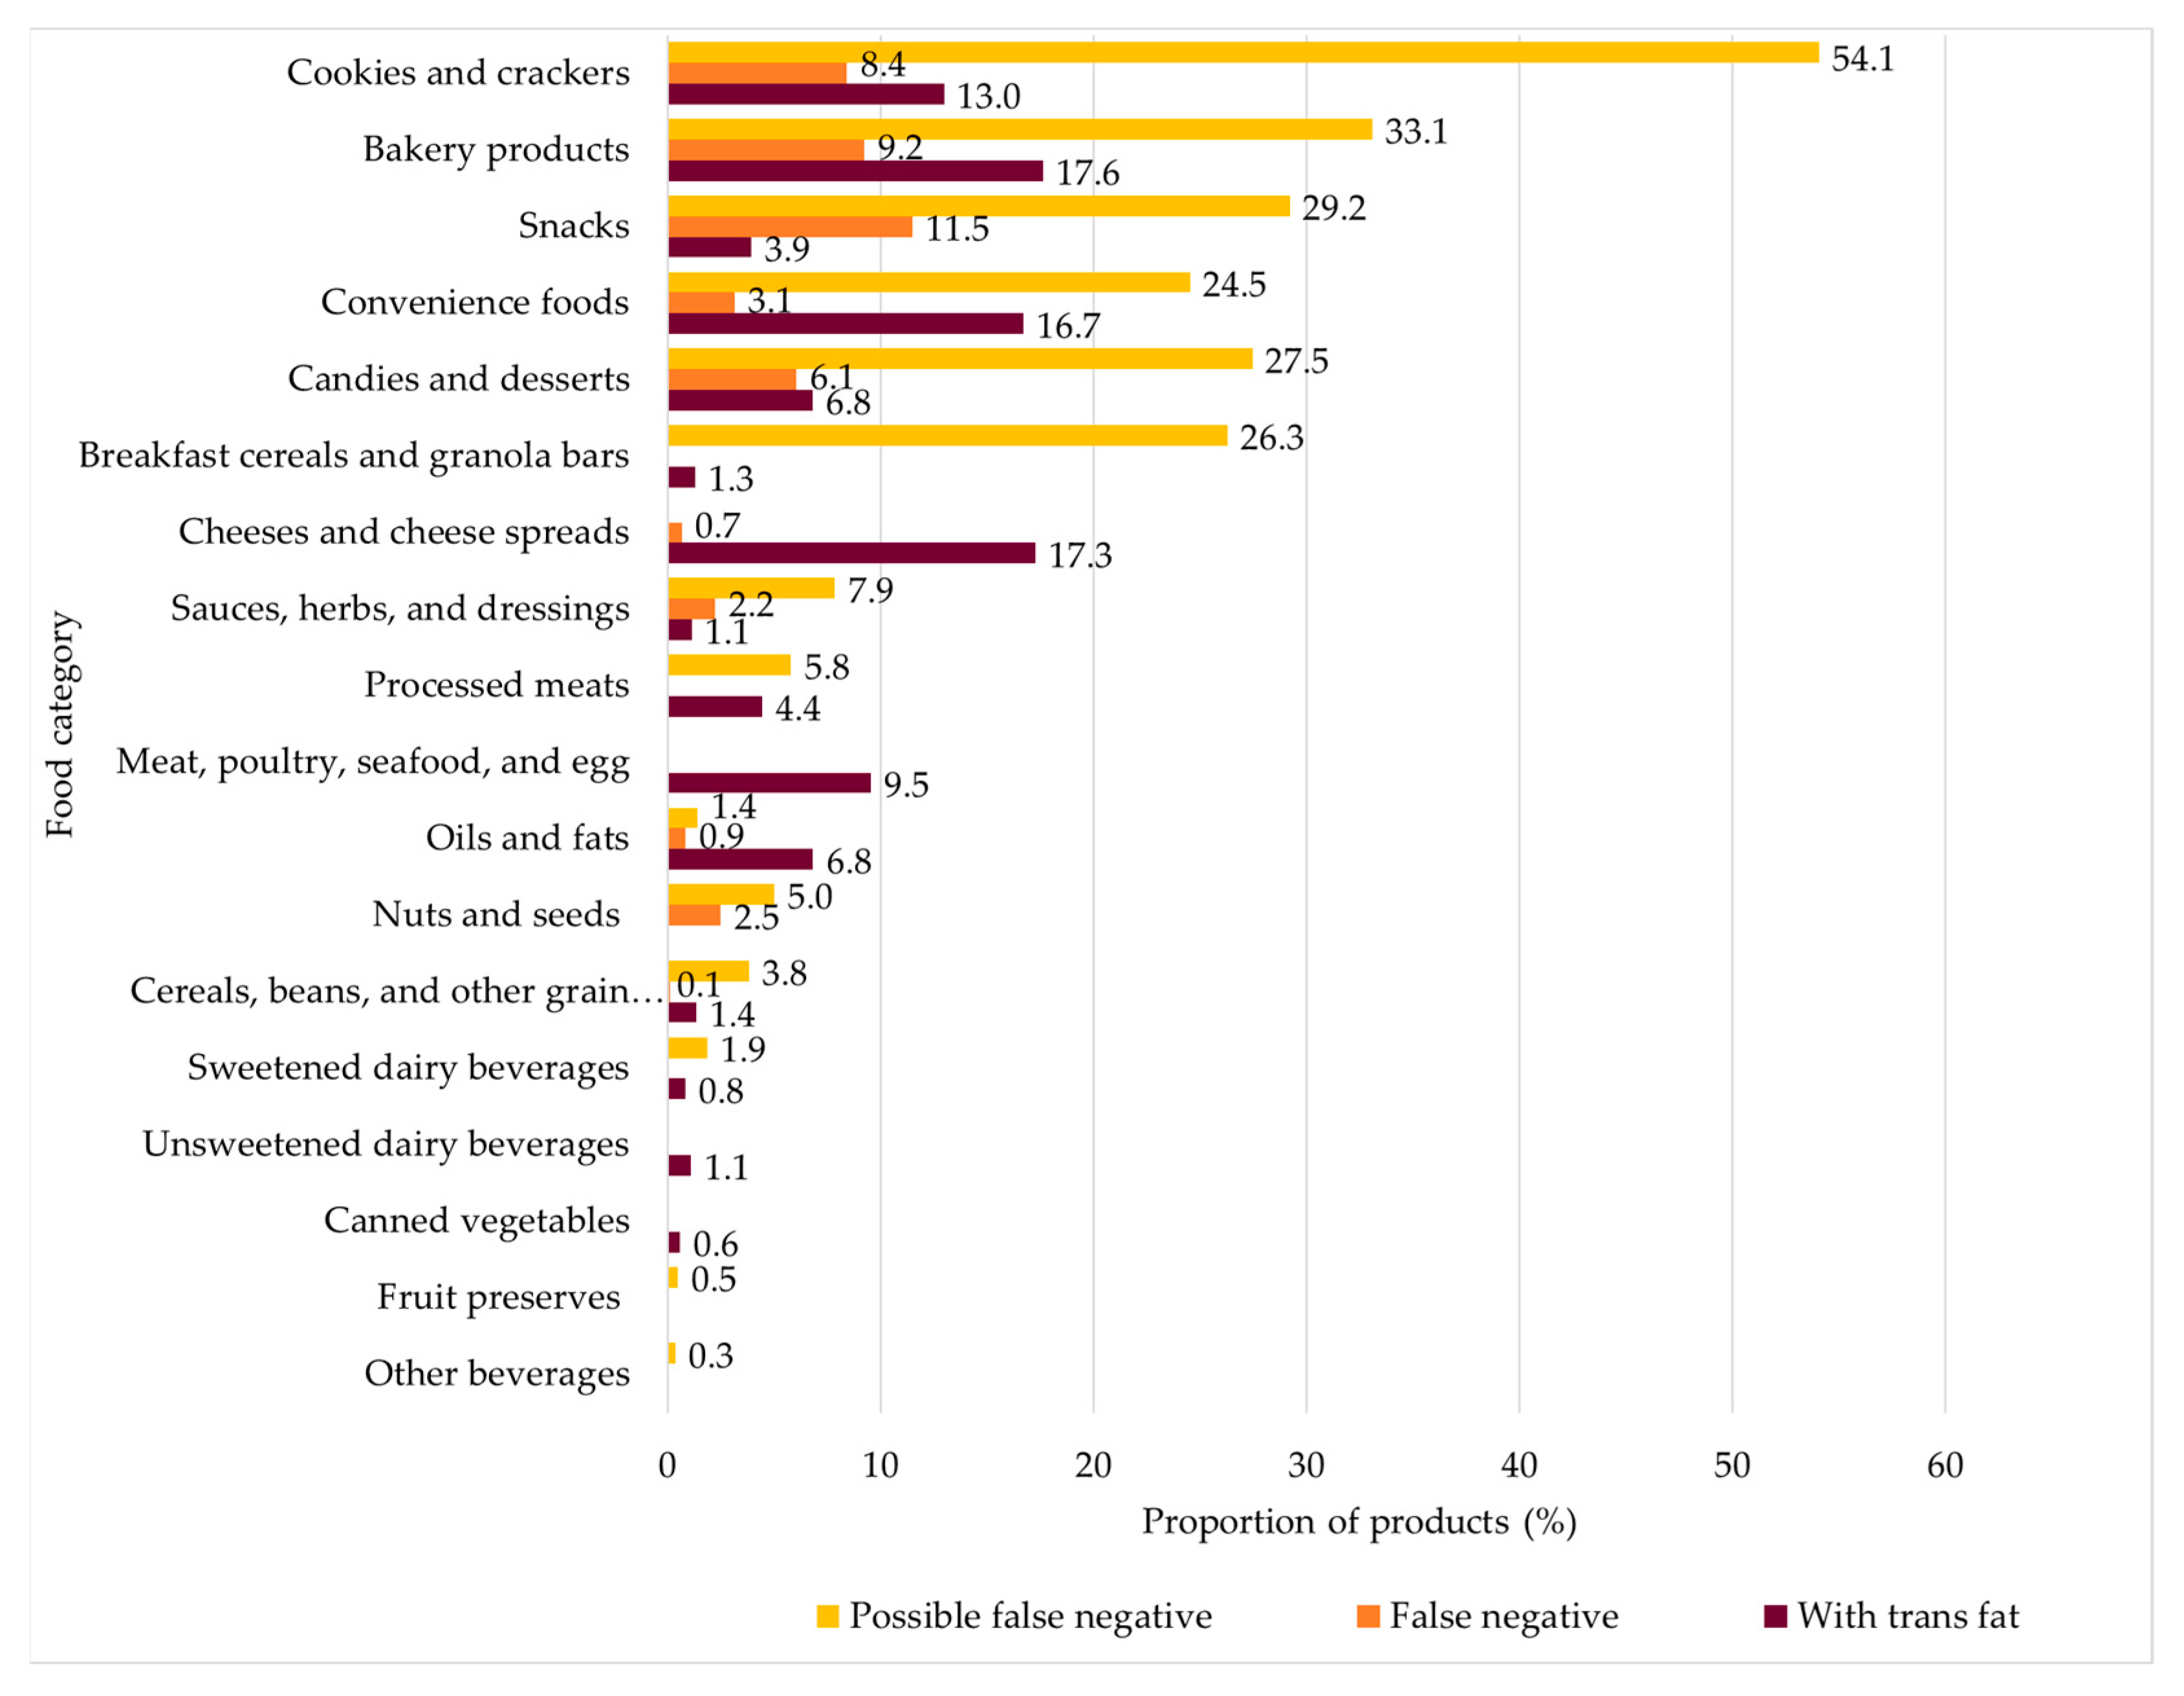
| Food Category | n | List of Ingredients | Nutrition Facts Panel | ||||||||||
|---|---|---|---|---|---|---|---|---|---|---|---|---|---|
| None | Specific | Unspecific | Zero or Insignificant | Above Zero | Not Informed | ||||||||
| n | % | n | % | n | % | n | % | n | % | n | % | ||
| Breakfast cereals and granola bars | 308 | 225 | 73.1 | 2 | 0.6 | 81 | 26.3 | 304 | 98.7 | 4 | 1.3 | 0 | 0.0 |
| Bakery products | 595 | 244 | 41.0 | 123 | 20.7 | 228 | 38.3 | 490 | 82.4 | 105 | 17.6 | 0 | 0.0 |
| Convenience foods | 795 | 477 | 60.0 | 48 | 6.0 | 270 | 34.0 | 651 | 81.9 | 133 | 16.7 | 11 | 1.4 |
| Unsweetened dairy beverages | 181 | 181 | 100.0 | 0 | 0.0 | 0 | 0.0 | 179 | 98.9 | 2 | 1.1 | 0 | 0.0 |
| Sweetened dairy beverages | 483 | 472 | 97.7 | 0 | 0.0 | 11 | 2.3 | 476 | 98.6 | 4 | 0.8 | 3 | 0.6 |
| Snacks | 356 | 203 | 57.0 | 45 | 12.6 | 108 | 30.3 | 340 | 95.5 | 14 | 3.9 | 2 | 0.6 |
| Cookies and crackers | 747 | 185 | 24.8 | 113 | 15.1 | 449 | 60.1 | 638 | 85.4 | 97 | 13.0 | 12 | 1.6 |
| Canned vegetables | 345 | 345 | 100.0 | 0 | 0.0 | 0 | 0.0 | 330 | 95.7 | 2 | 0.6 | 13 | 3.8 |
| Oils and fats | 351 | 338 | 96.3 | 7 | 2.0 | 6 | 1.7 | 325 | 92.6 | 24 | 6.8 | 2 | 0.6 |
| Sauces, herbs, and dressings | 801 | 720 | 89.9 | 18 | 2.2 | 63 | 7.9 | 785 | 98.0 | 9 | 1.1 | 7 | 0.9 |
| Coffee and tea | 94 | 94 | 100.0 | 0 | 0.0 | 0 | 0.0 | 84 | 89.4 | 0 | 0.0 | 10 | 10.6 |
| Candies and desserts | 1220 | 765 | 62.7 | 100 | 8.2 | 355 | 29.1 | 1132 | 92.8 | 83 | 6.8 | 5 | 0.4 |
| Cereals, beans, other grain products | 735 | 698 | 95.0 | 2 | 0.3 | 35 | 4.8 | 717 | 97.6 | 10 | 1.4 | 8 | 1.1 |
| Packaged fruits and vegetables | 907 | 907 | 100.0 | 0 | 0.0 | 0 | 0.0 | 841 | 92.7 | 0 | 0.0 | 66 | 7.3 |
| Meat, poultry, seafood, and eggs | 577 | 577 | 100.0 | 0 | 0.0 | 0 | 0.0 | 518 | 89.8 | 55 | 9.5 | 4 | 0.7 |
| Sugar and other nonnutritive sweeteners | 106 | 106 | 100.0 | 0 | 0.0 | 0 | 0.0 | 106 | 100.0 | 0 | 0.0 | 0 | 0.0 |
| Processed meats | 810 | 759 | 93.7 | 1 | 0.1 | 50 | 6.2 | 769 | 94.9 | 36 | 4.4 | 5 | 0.6 |
| Fruit juices | 150 | 150 | 100.0 | 0 | 0.0 | 0 | 0.0 | 150 | 100.0 | 0 | 0.0 | 0 | 0.0 |
| Nectars | 160 | 160 | 100.0 | 0 | 0.0 | 0 | 0.0 | 160 | 100.0 | 0 | 0.0 | 0 | 0.0 |
| Fruit-flavored drinks | 220 | 220 | 100.0 | 0 | 0.0 | 0 | 0.0 | 220 | 100.0 | 0 | 0.0 | 0 | 0.0 |
| Carbonated beverages | 106 | 106 | 100.0 | 0 | 0.0 | 0 | 0.0 | 106 | 100.0 | 0 | 0.0 | 0 | 0.0 |
| Other beverages | 286 | 285 | 99.7 | 0 | 0.0 | 1 | 0.3 | 281 | 98.3 | 0 | 0.0 | 5 | 1.7 |
| Nuts and seeds | 80 | 74 | 92.5 | 2 | 2.5 | 4 | 5.0 | 79 | 98.8 | 0 | 0.0 | 1 | 1.3 |
| Cheeses and cheese spreads | 607 | 594 | 97.9 | 11 | 1.8 | 2 | 0.3 | 502 | 82.7 | 105 | 17.3 | 0 | 0.0 |
| Fruit preserves | 414 | 412 | 99.5 | 0 | 0.0 | 2 | 0.5 | 410 | 99.0 | 0 | 0.0 | 4 | 1.0 |
| Total | 11,434 | 9297 | 81.3 | 472 | 4.1 | 1665 | 14.6 | 10,593 | 92.6 | 683 | 6.0 | 158 | 1.4 |
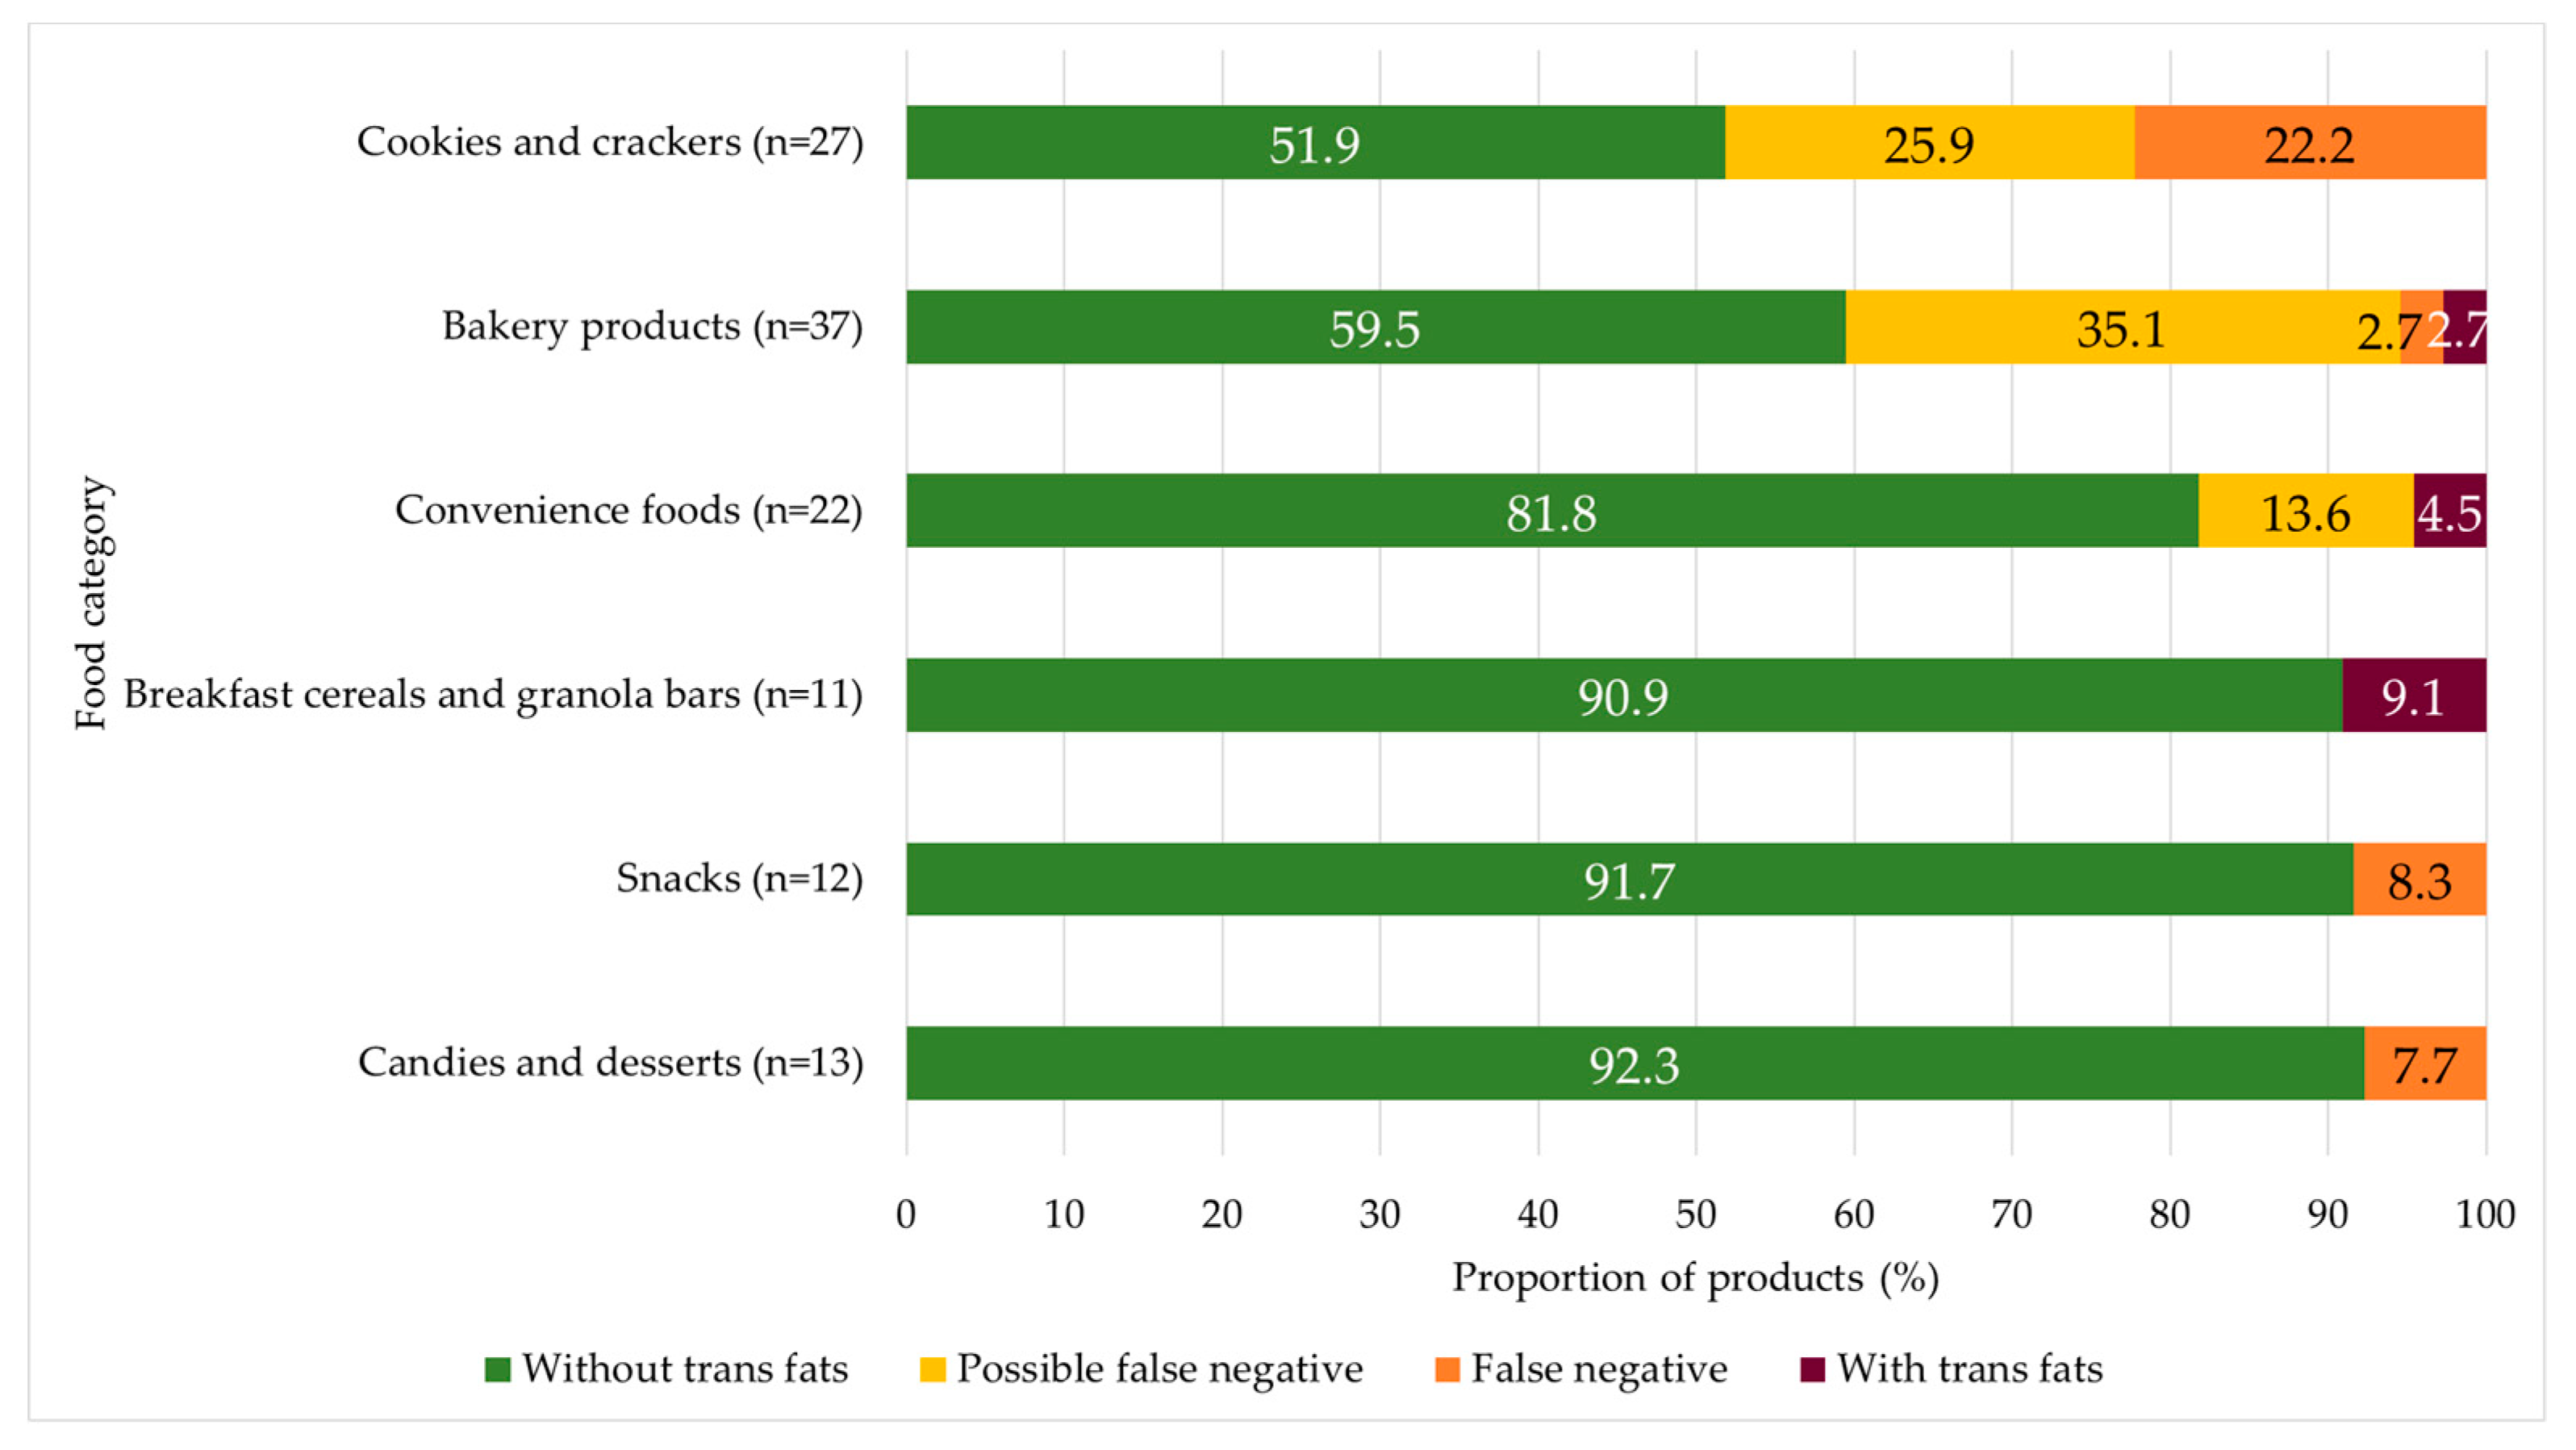
| Food Category | n Subsample | Presence of Claims | |||
|---|---|---|---|---|---|
| n | % | 95% CI | |||
| Bakery products | 175 | 37 | 21.1 | 15.7 | 27.8 |
| Cookies and crackers | 225 | 27 | 12.0 | 8.4 | 16.9 |
| Breakfast cereals and granola bars | 95 | 11 | 11.6 | 6.5 | 19.8 |
| Snacks | 108 | 12 | 11.1 | 6.4 | 18.6 |
| Convenience foods | 238 | 22 | 9.2 | 6.2 | 13.7 |
| Fruit preserves | 136 | 7 | 5.1 | 2.5 | 10.4 |
| Candies and desserts | 365 | 13 | 3.6 | 2.1 | 6.0 |
| Oils and fats | 106 | 3 | 2.8 | 0.9 | 8.5 |
| Sauces, herbs, and dressings | 262 | 7 | 2.7 | 1.3 | 5.5 |
| Cereals, beans, other grain products | 230 | 6 | 2.6 | 1.2 | 5.7 |
| Processed meats | 257 | 6 | 2.3 | 1.1 | 5.1 |
| Nectars | 50 | 1 | 2.0 | 0.3 | 13.1 |
| Packaged fruits and vegetables | 261 | 5 | 1.9 | 0.8 | 4.5 |
| Other beverages | 77 | 1 | 1.3 | 0.2 | 8.8 |
| Meat, poultry, seafood, and eggs | 171 | 2 | 1.2 | 0.3 | 4.6 |
| Unsweetened dairy beverages | 56 | 0 | 0.0 | 0.0 | 0.0 |
| Sweetened dairy beverages | 149 | 0 | 0.0 | 0.0 | 0.0 |
| Canned vegetables | 110 | 0 | 0.0 | 0.0 | 0.0 |
| Coffee and tea | 30 | 0 | 0.0 | 0.0 | 0.0 |
| Sugar and other nonnutritive sweeteners | 37 | 0 | 0.0 | 0.0 | 0.0 |
| Fruit juices | 53 | 0 | 0.0 | 0.0 | 0.0 |
| Fruit-flavored drinks | 63 | 0 | 0.0 | 0.0 | 0.0 |
| Carbonated beverages | 35 | 0 | 0.0 | 0.0 | 0.0 |
| Nuts and seeds | 22 | 0 | 0.0 | 0.0 | 0.0 |
| Cheeses and cheese spreads | 180 | 0 | 0.0 | 0.0 | 0.0 |
| Total | 3491 | 160 | 4.6 | 3.9 | 5.3 |
© 2019 by the authors. Licensee MDPI, Basel, Switzerland. This article is an open access article distributed under the terms and conditions of the Creative Commons Attribution (CC BY) license (http://creativecommons.org/licenses/by/4.0/).
Share and Cite
Ricardo, C.Z.; Peroseni, I.M.; Mais, L.A.; Martins, A.P.B.; Duran, A.C. Trans Fat Labeling Information on Brazilian Packaged Foods. Nutrients 2019, 11, 2130. https://doi.org/10.3390/nu11092130
Ricardo CZ, Peroseni IM, Mais LA, Martins APB, Duran AC. Trans Fat Labeling Information on Brazilian Packaged Foods. Nutrients. 2019; 11(9):2130. https://doi.org/10.3390/nu11092130
Chicago/Turabian StyleRicardo, Camila Zancheta, Isabela Mateus Peroseni, Laís Amaral Mais, Ana Paula Bortoletto Martins, and Ana Clara Duran. 2019. "Trans Fat Labeling Information on Brazilian Packaged Foods" Nutrients 11, no. 9: 2130. https://doi.org/10.3390/nu11092130
APA StyleRicardo, C. Z., Peroseni, I. M., Mais, L. A., Martins, A. P. B., & Duran, A. C. (2019). Trans Fat Labeling Information on Brazilian Packaged Foods. Nutrients, 11(9), 2130. https://doi.org/10.3390/nu11092130