Maternal Low-Fat Diet Programs the Hepatic Epigenome despite Exposure to an Obesogenic Postnatal Diet


Abstract
1. Introduction
2. Materials and Methods
2.1. Animals and Diets
2.2. Methylated DNA Immunoprecipitation (MeDIP) and Methylation-Sensitive Restriction Enzyme (MRE) Sequencing
2.3. DMR Identification
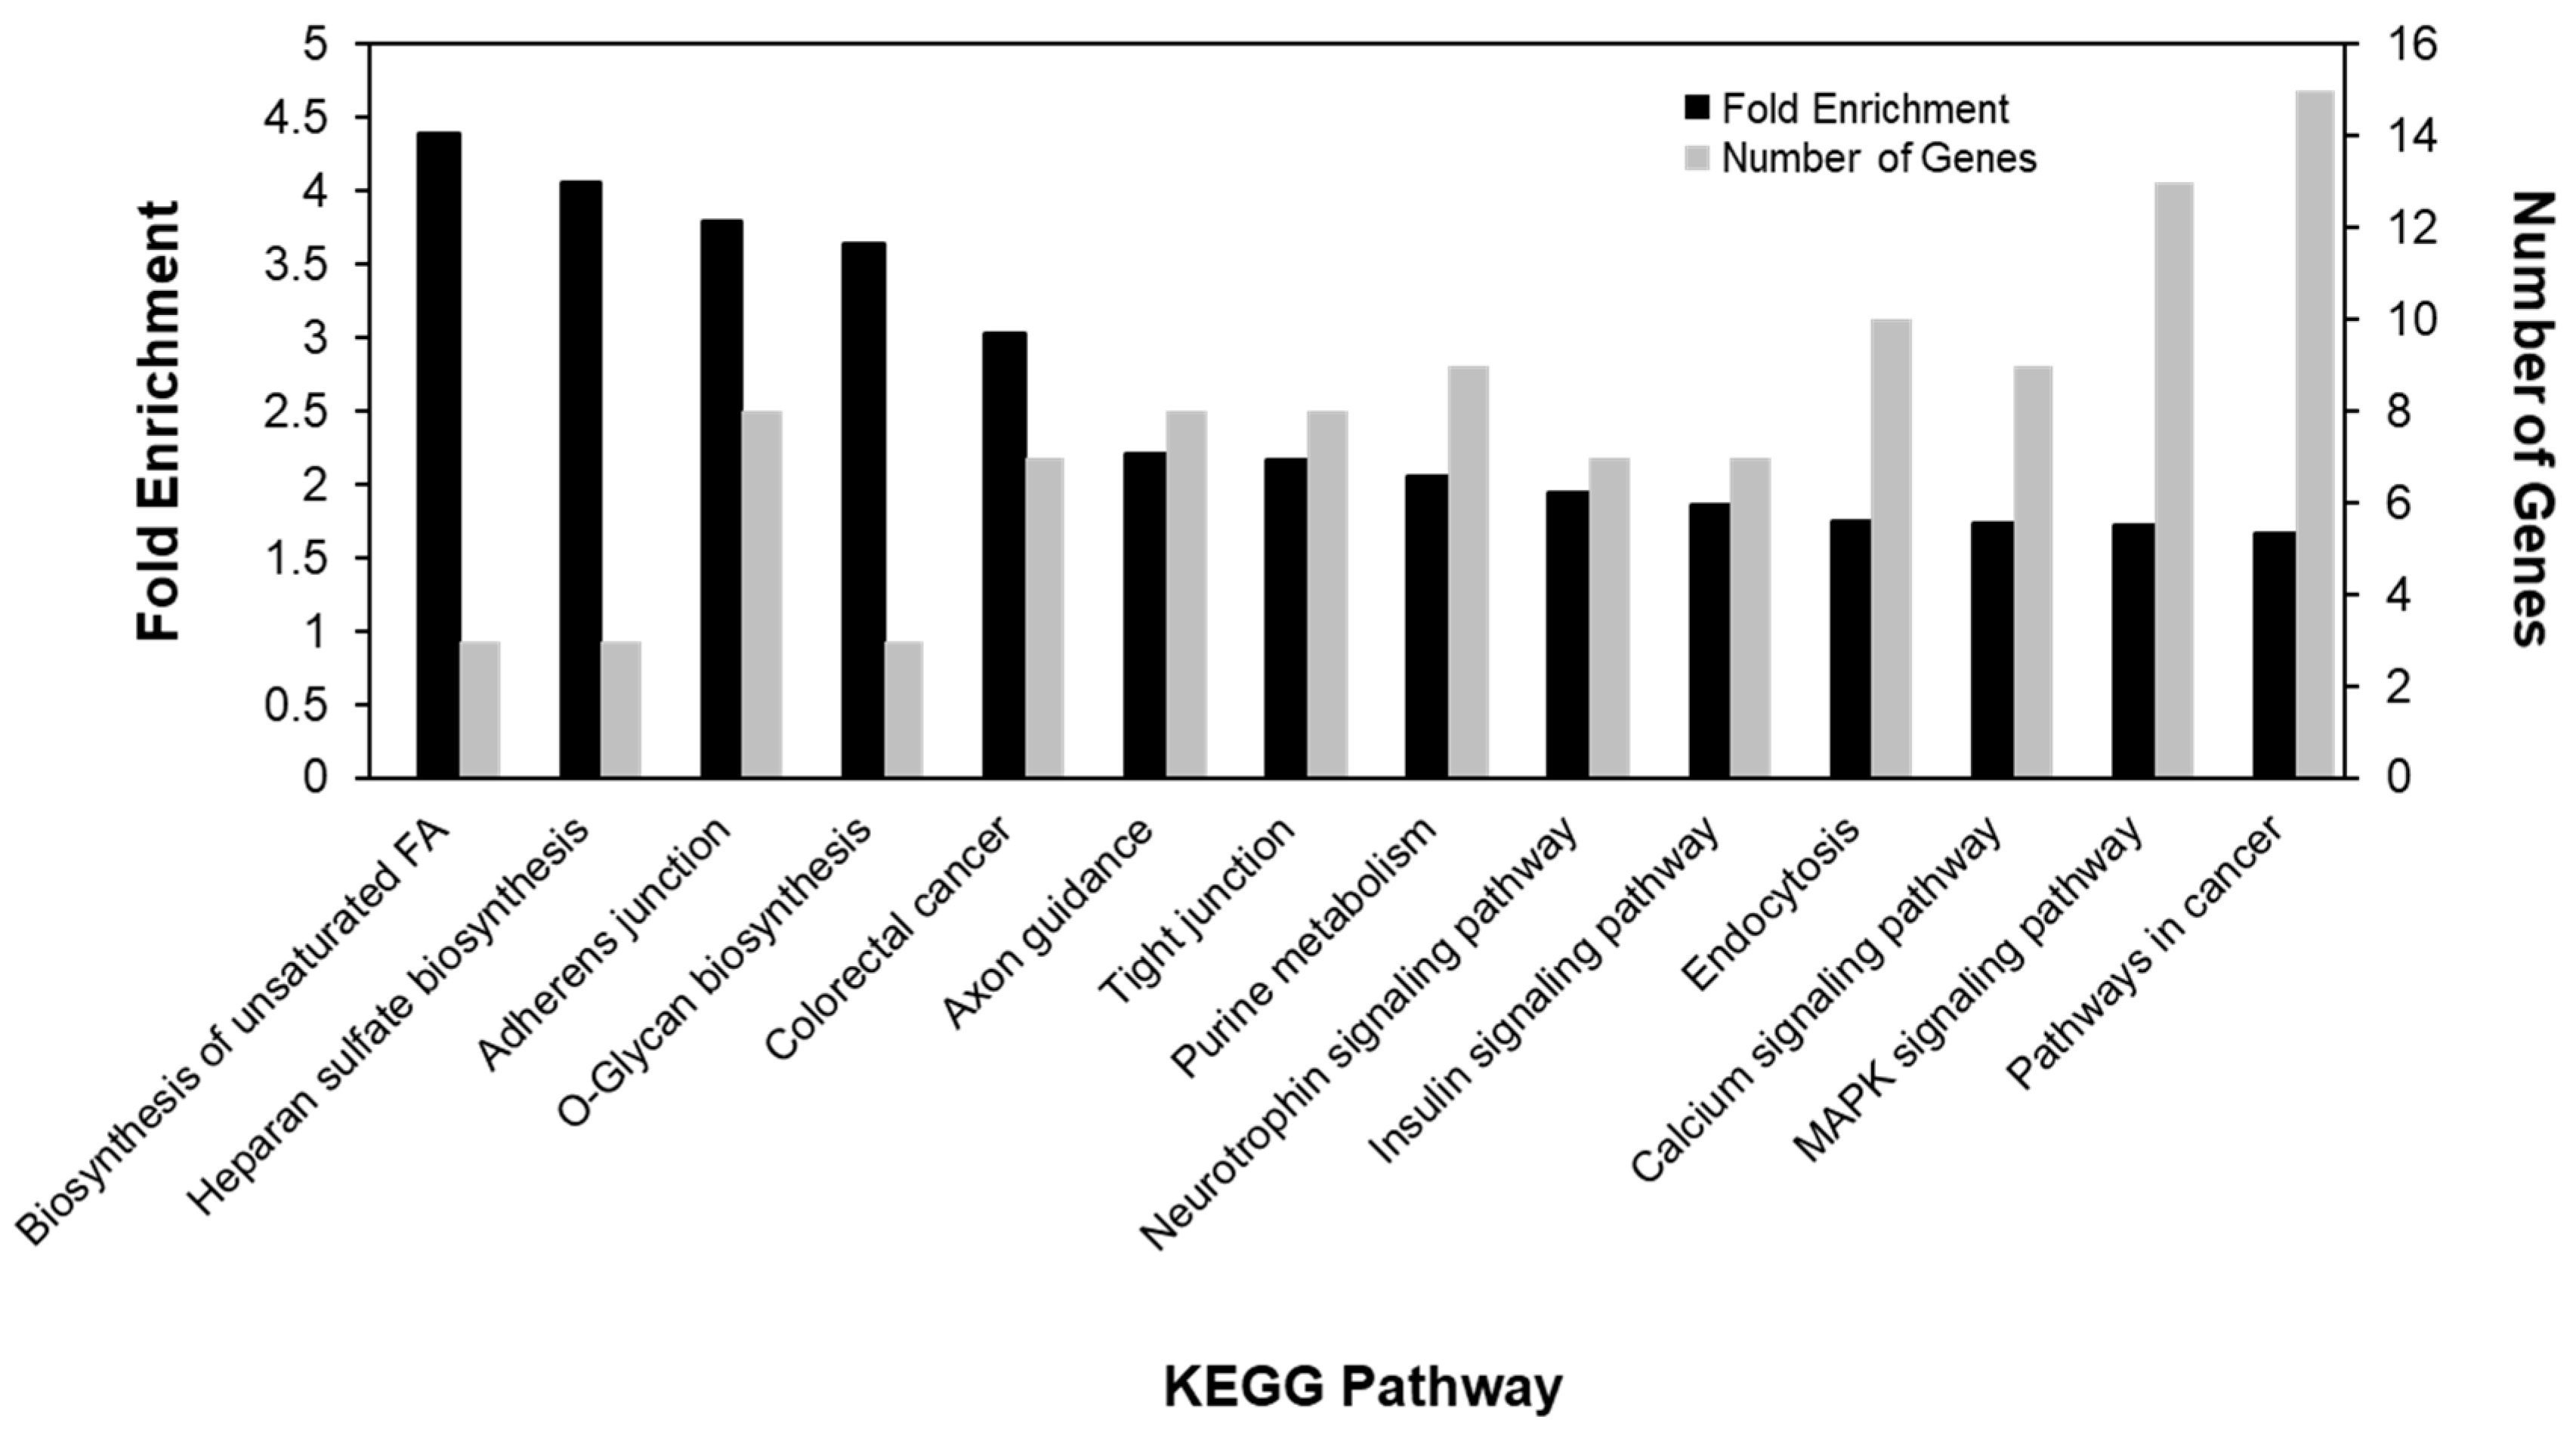
2.4. Annotation and Pathway Analysis
2.5. Methylation Specific PCR
2.6. Gene Expression
2.7. Analysis of Intergenic DMRs
2.8. Statistical Analysis
3. Results
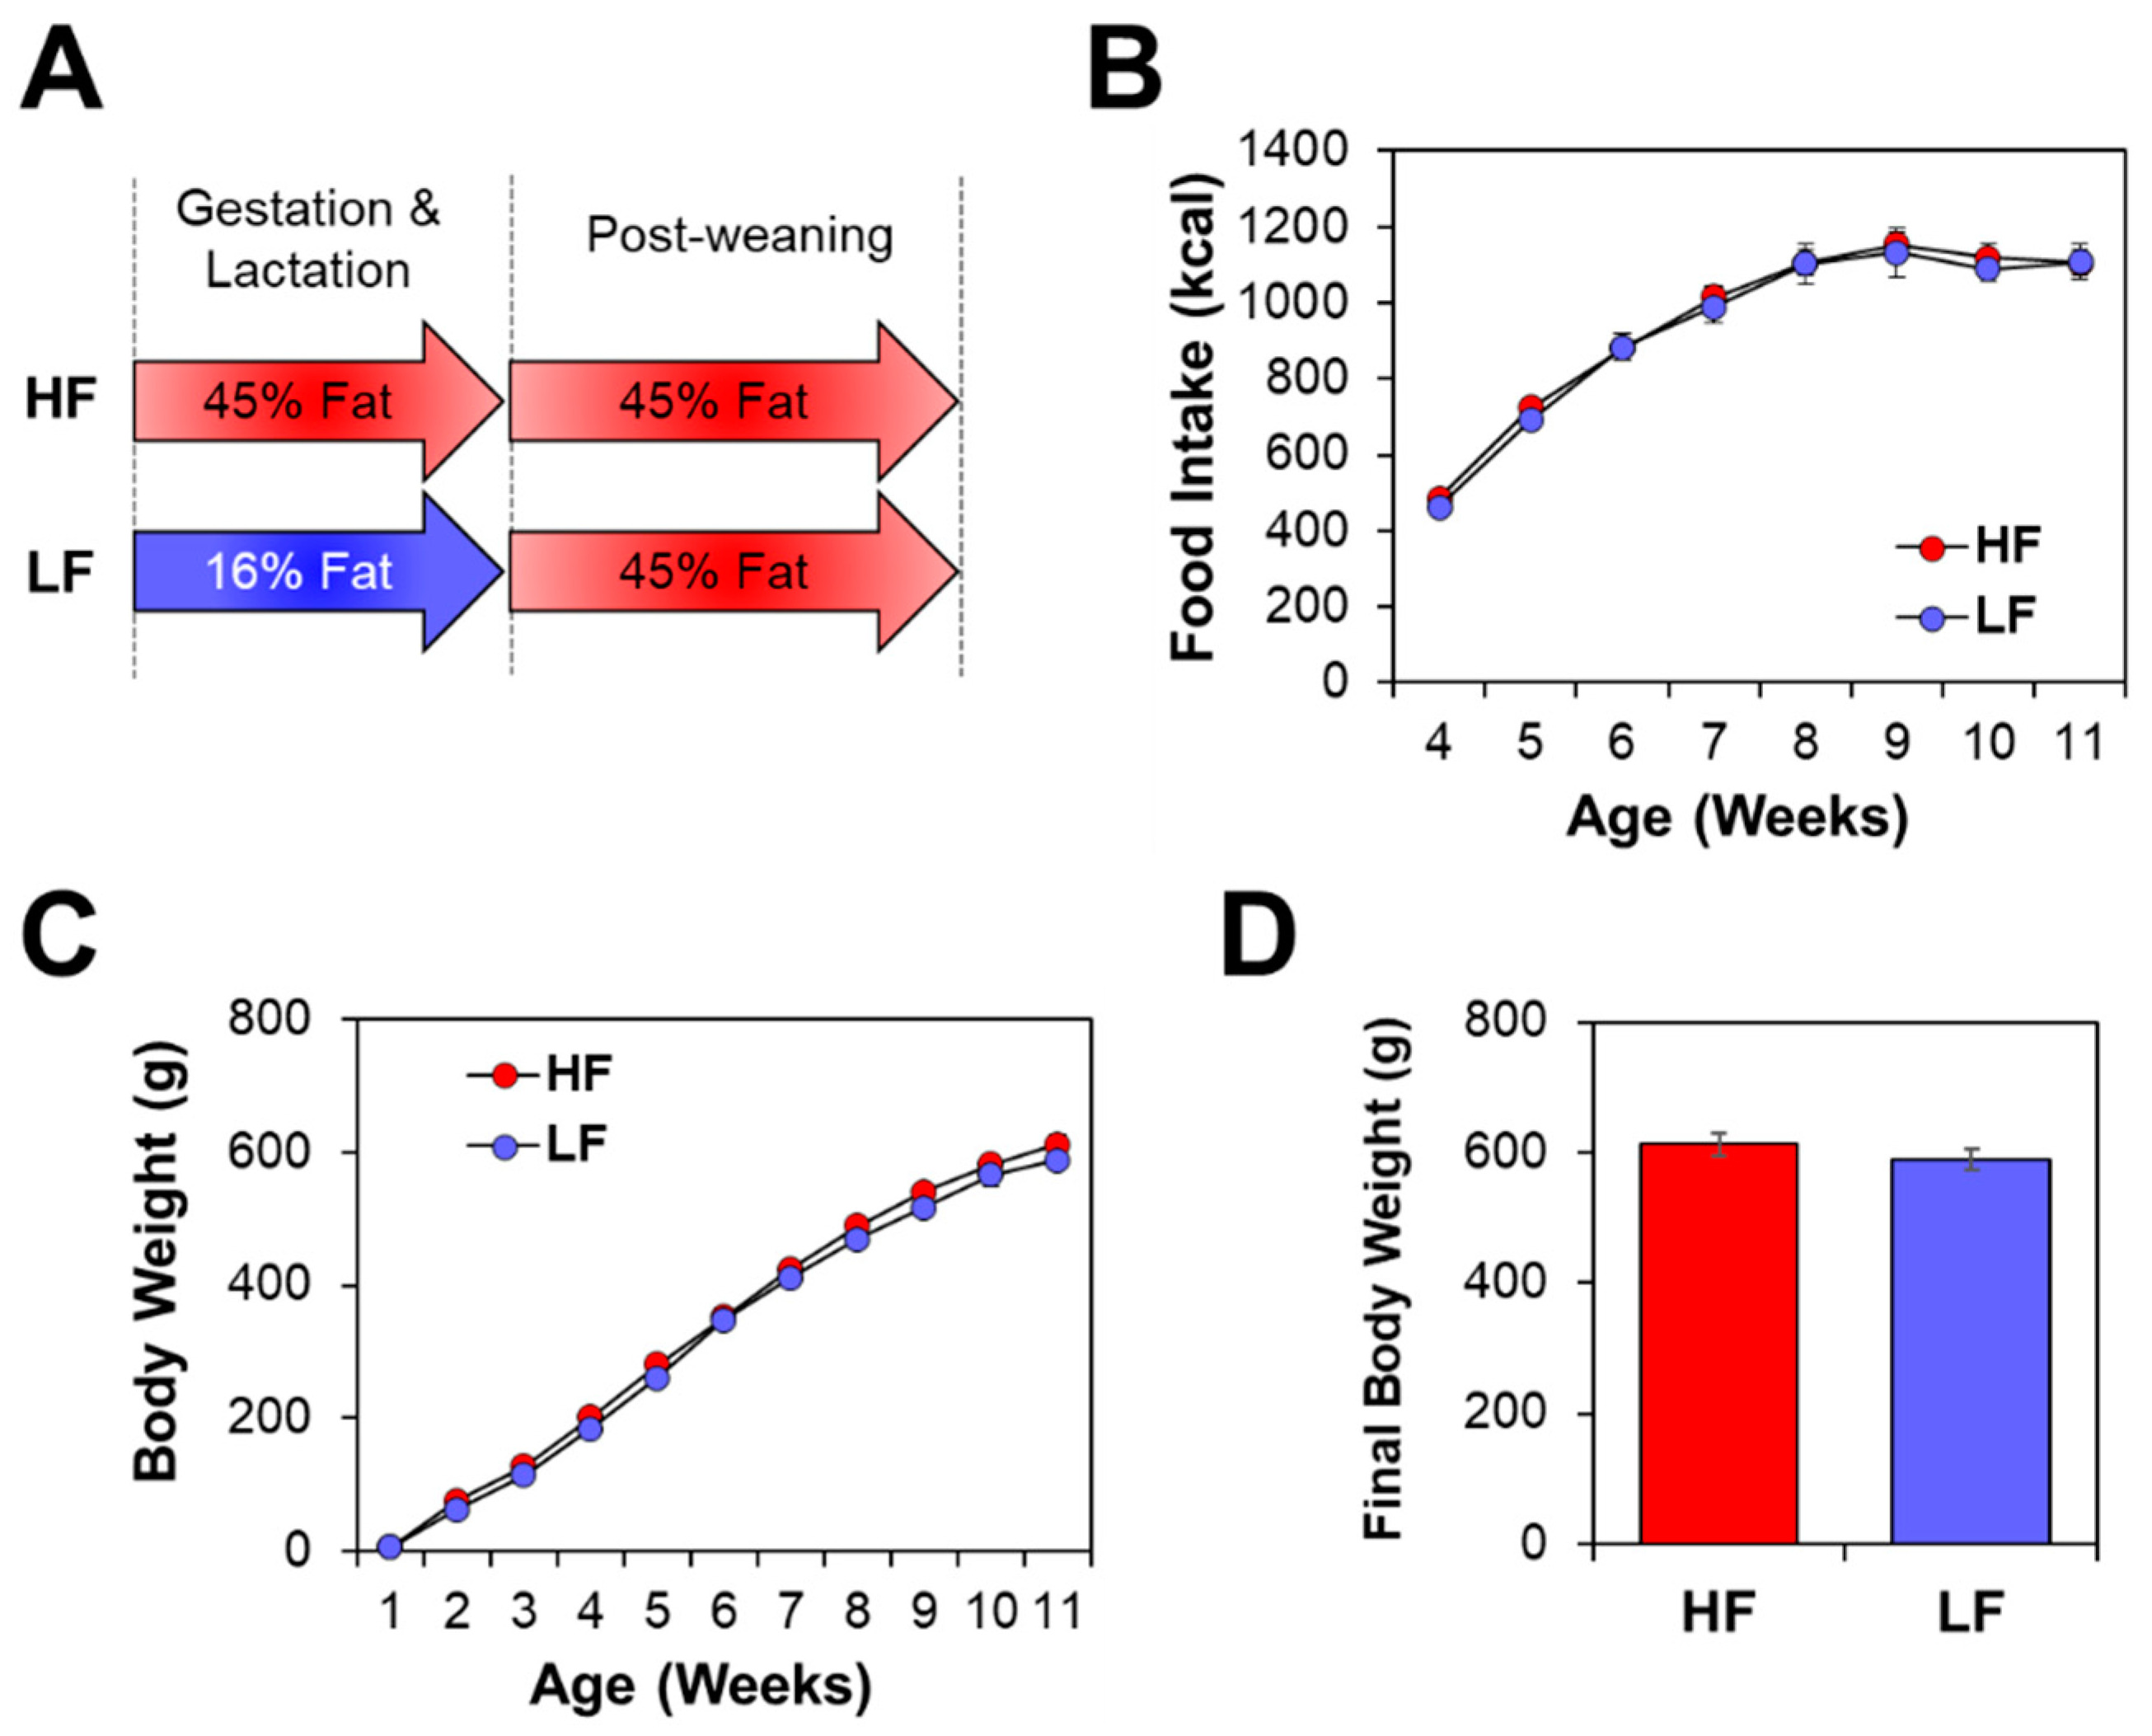
3.1. Offspring Phenotype
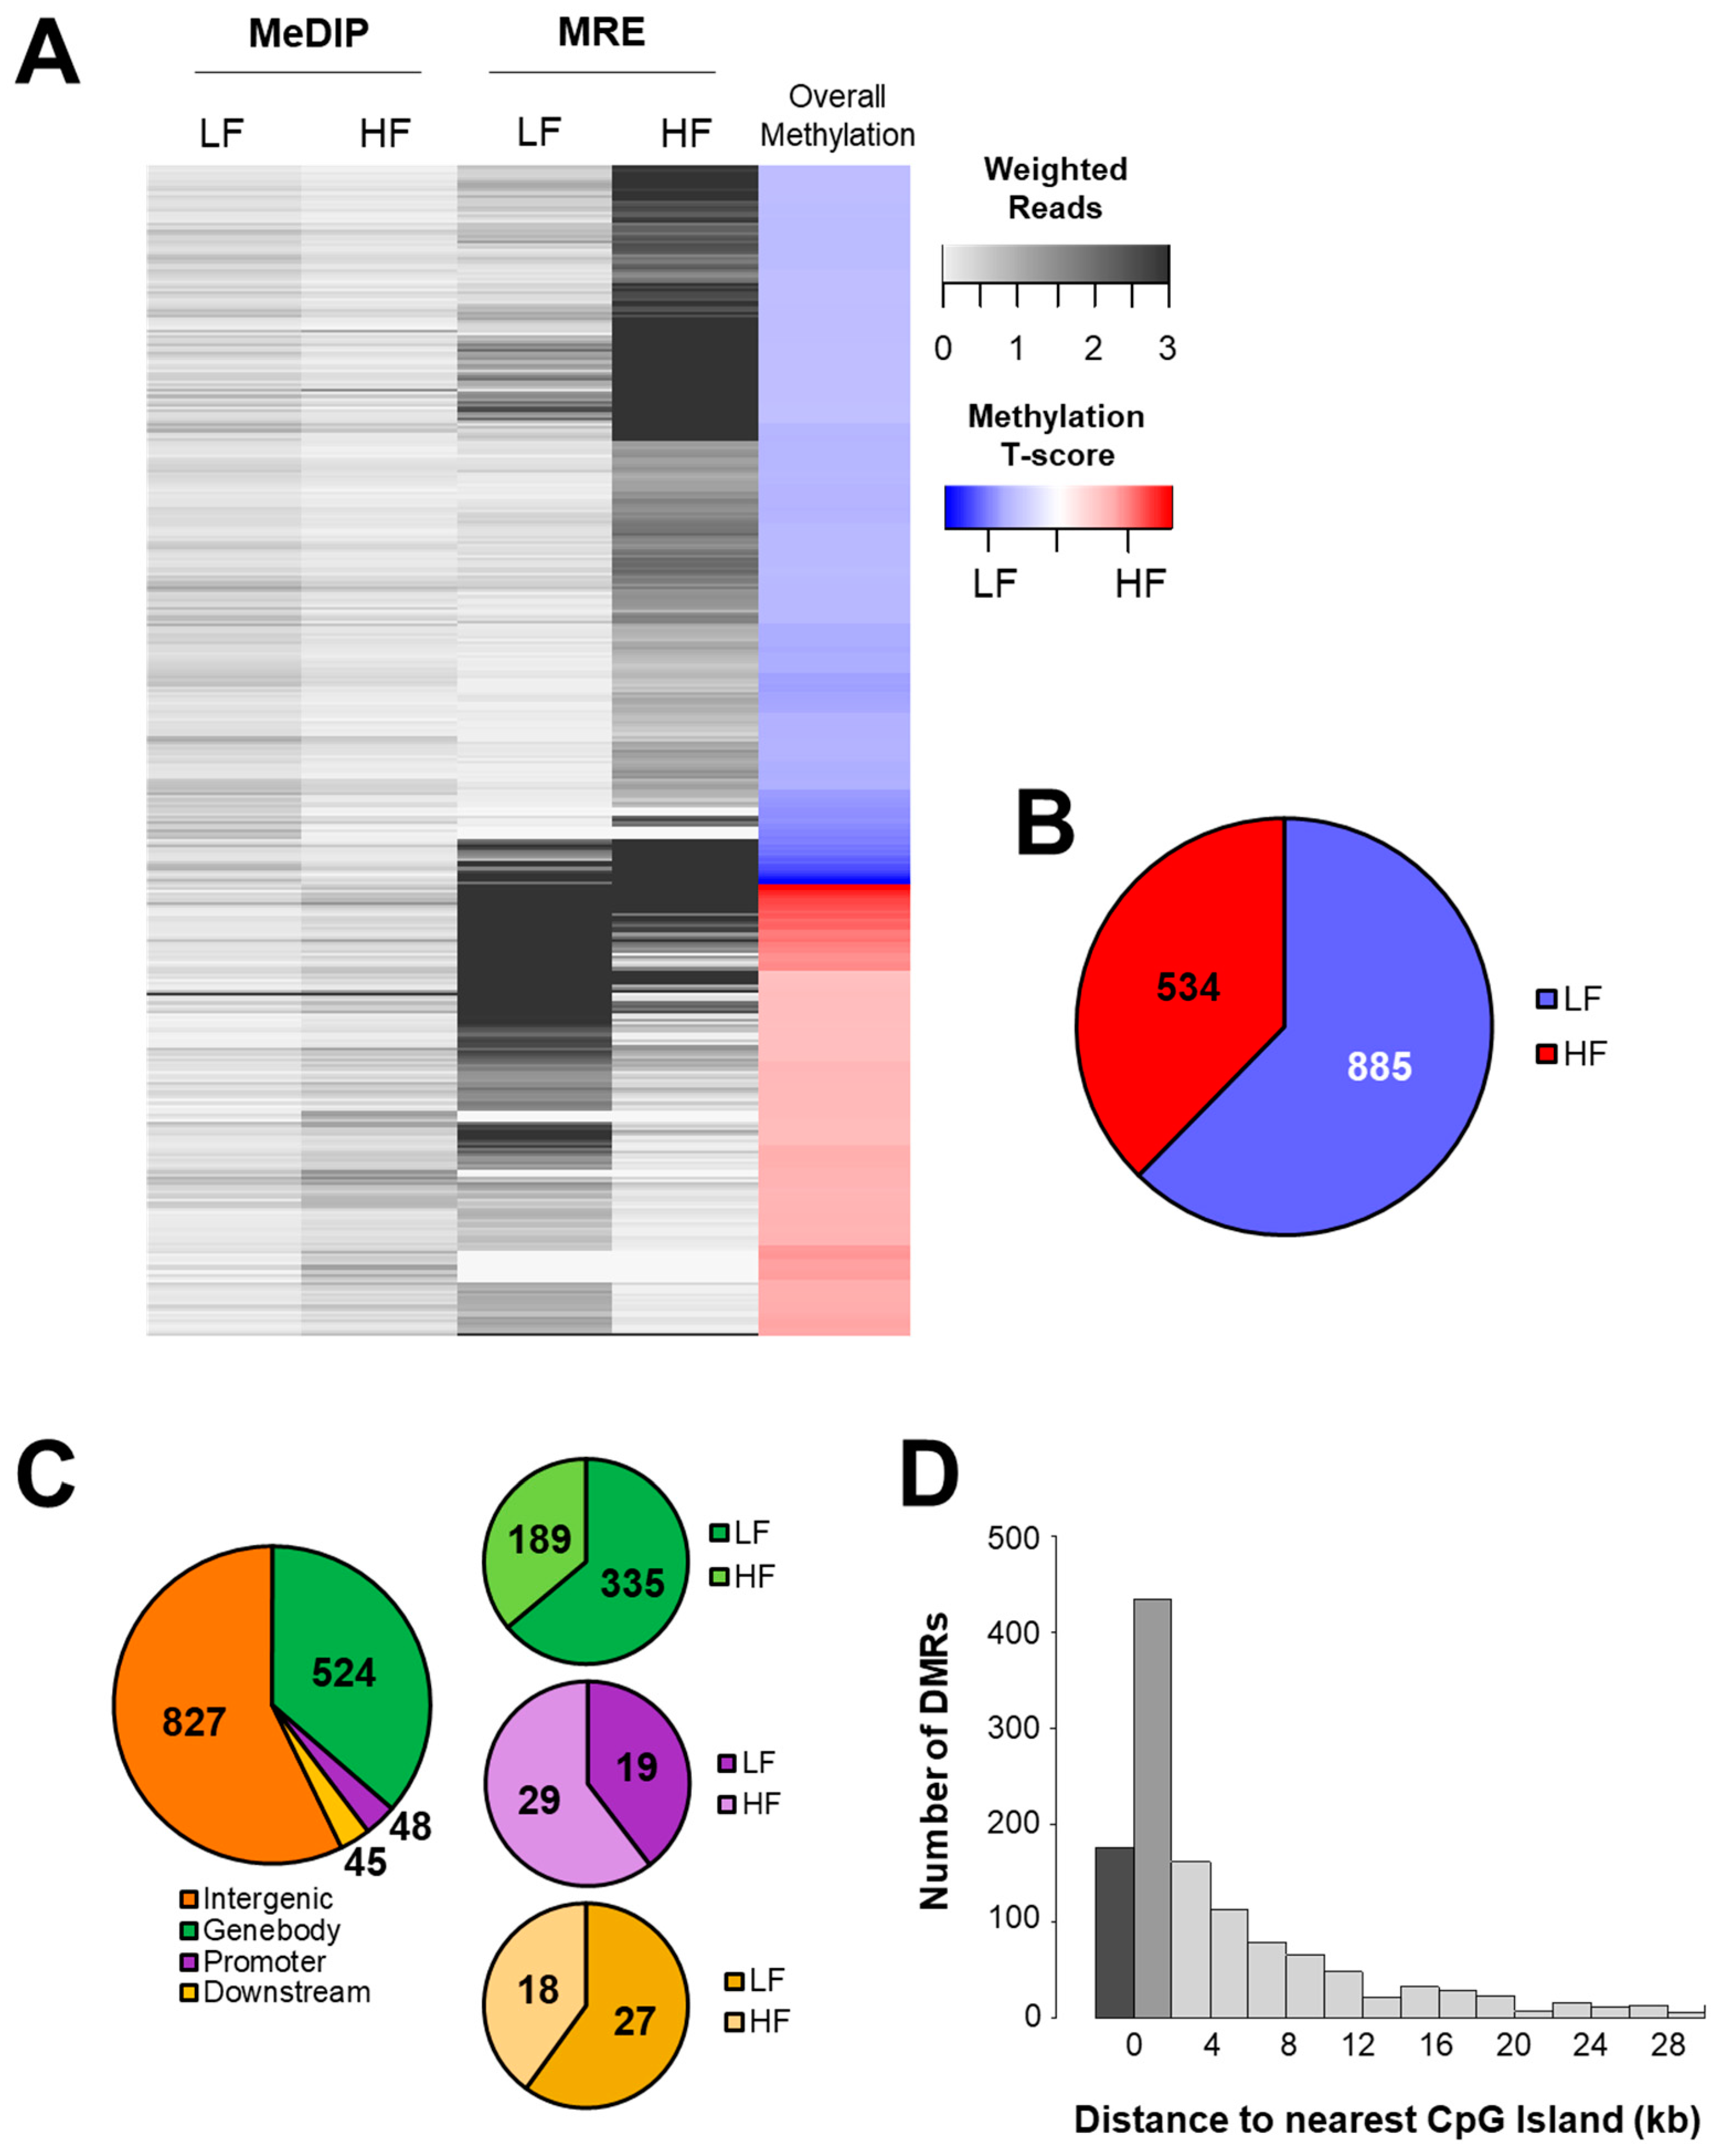
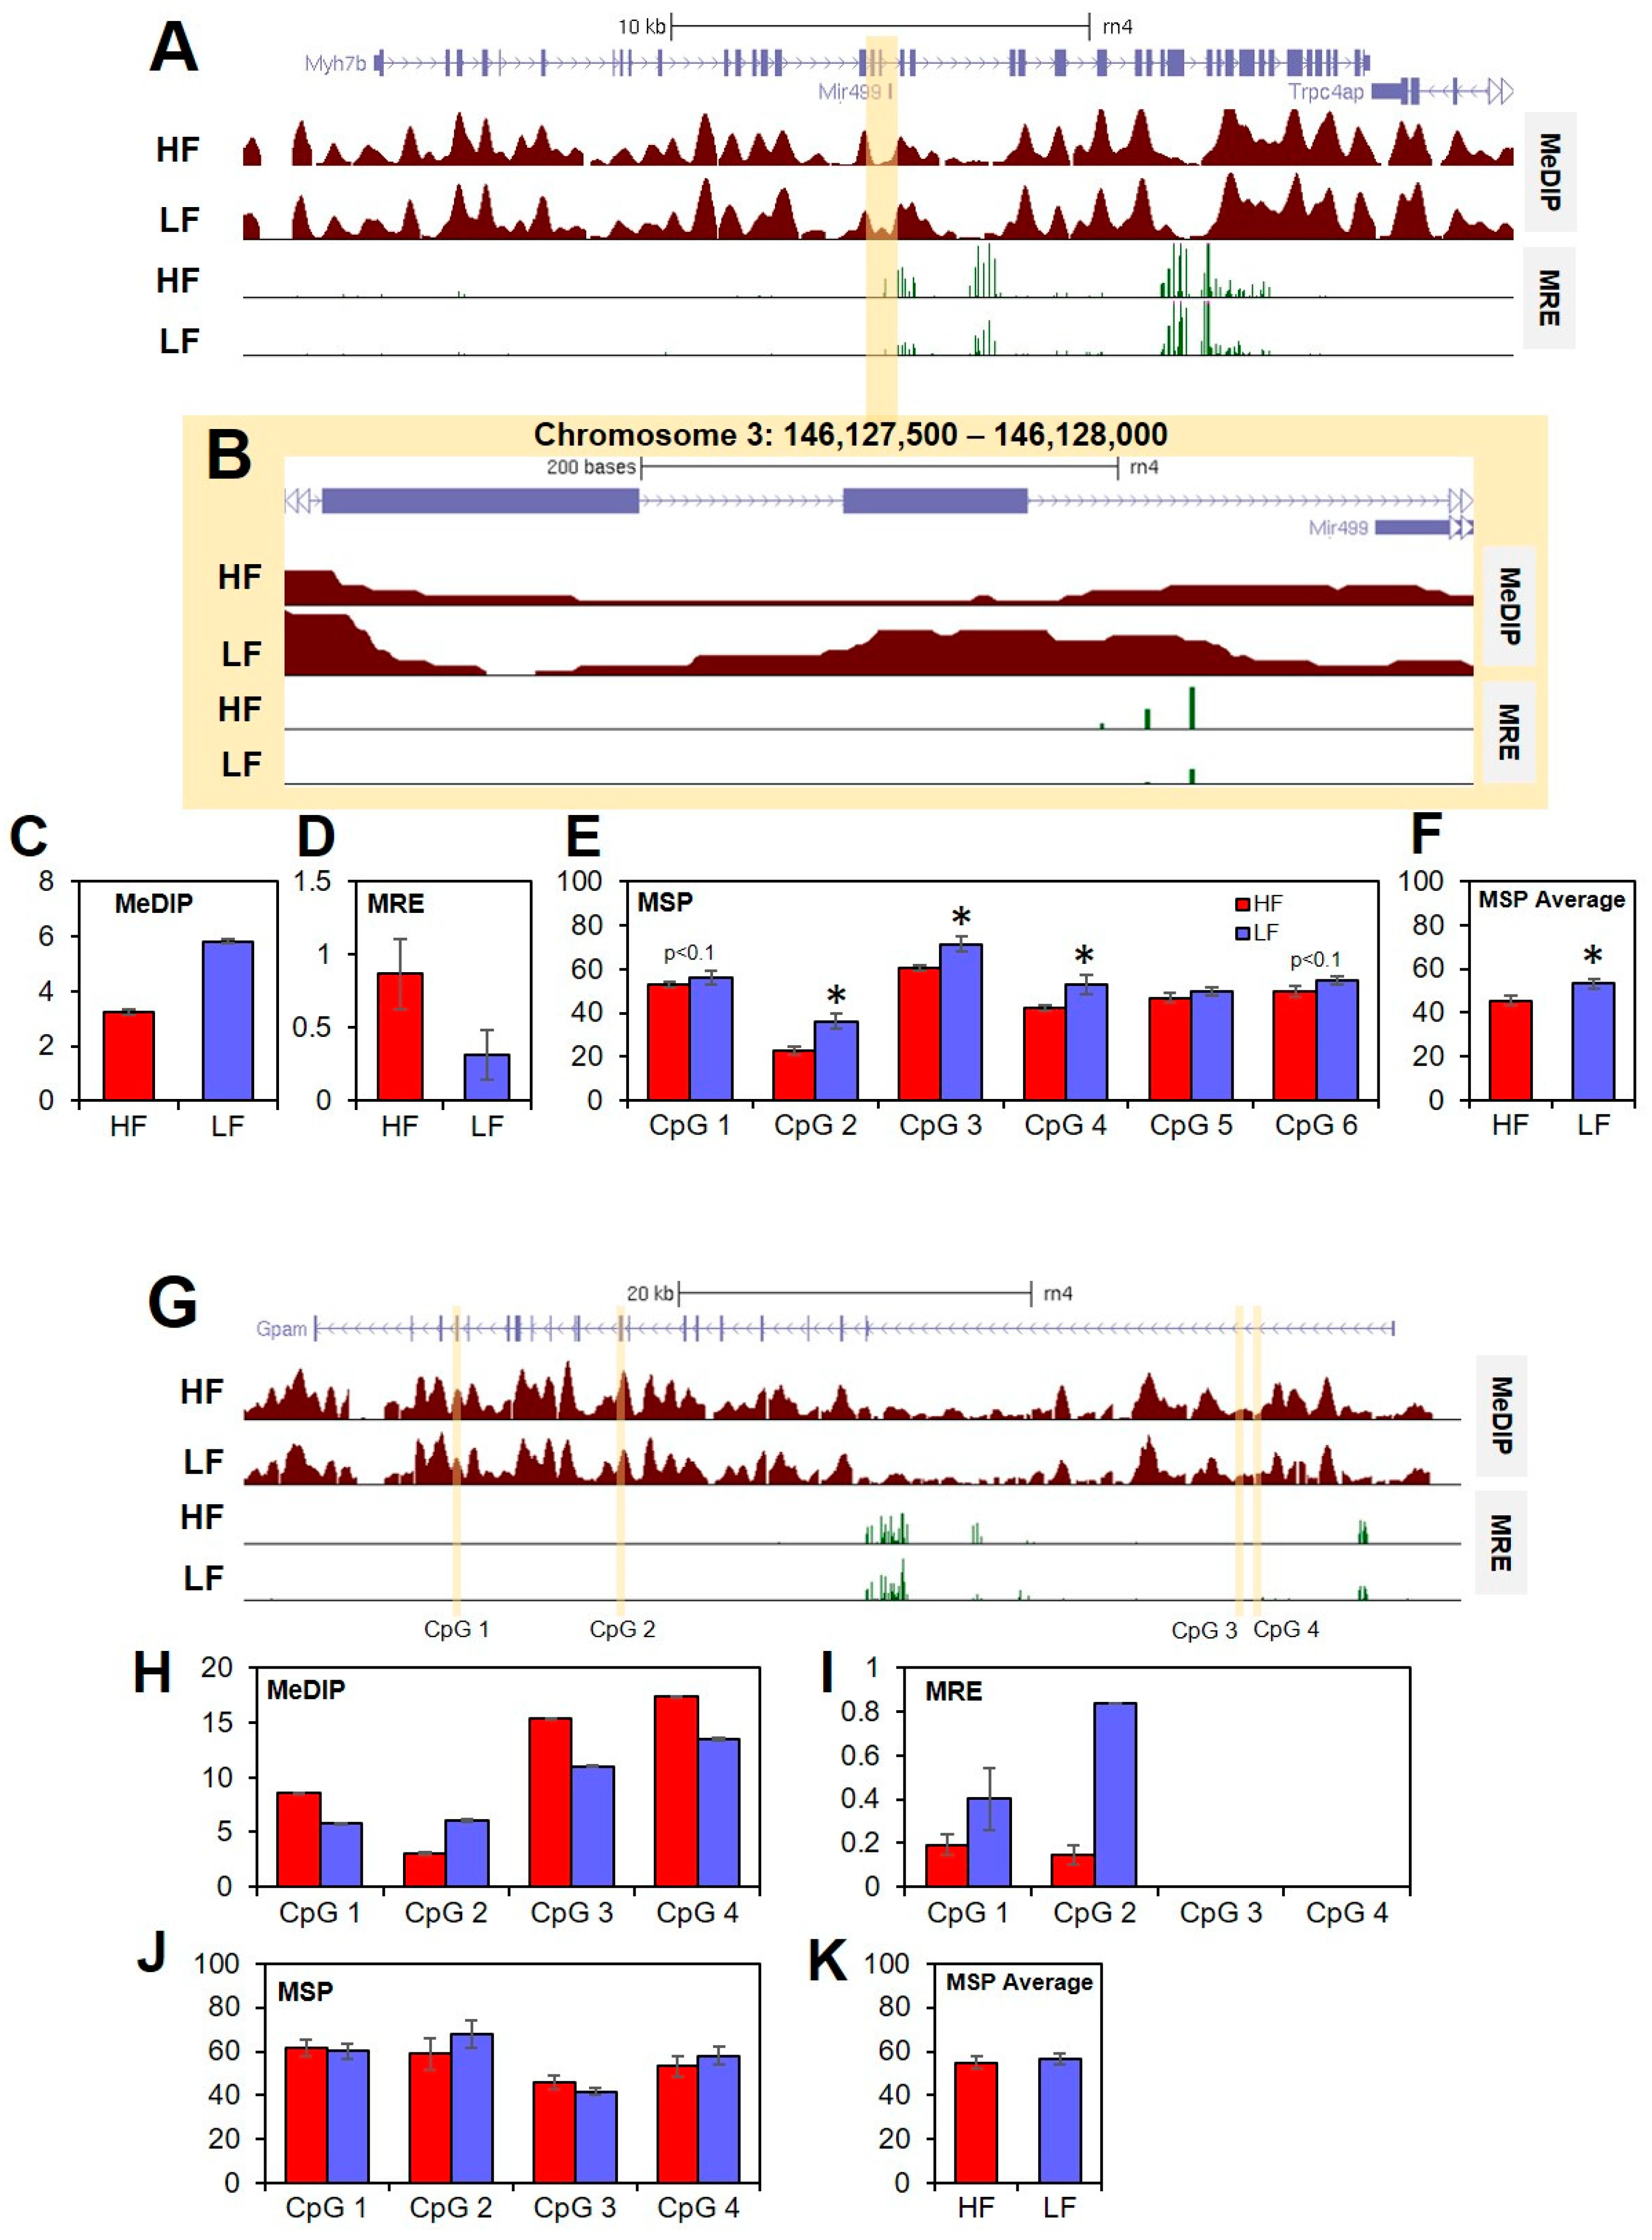
3.2. DNA Methylation
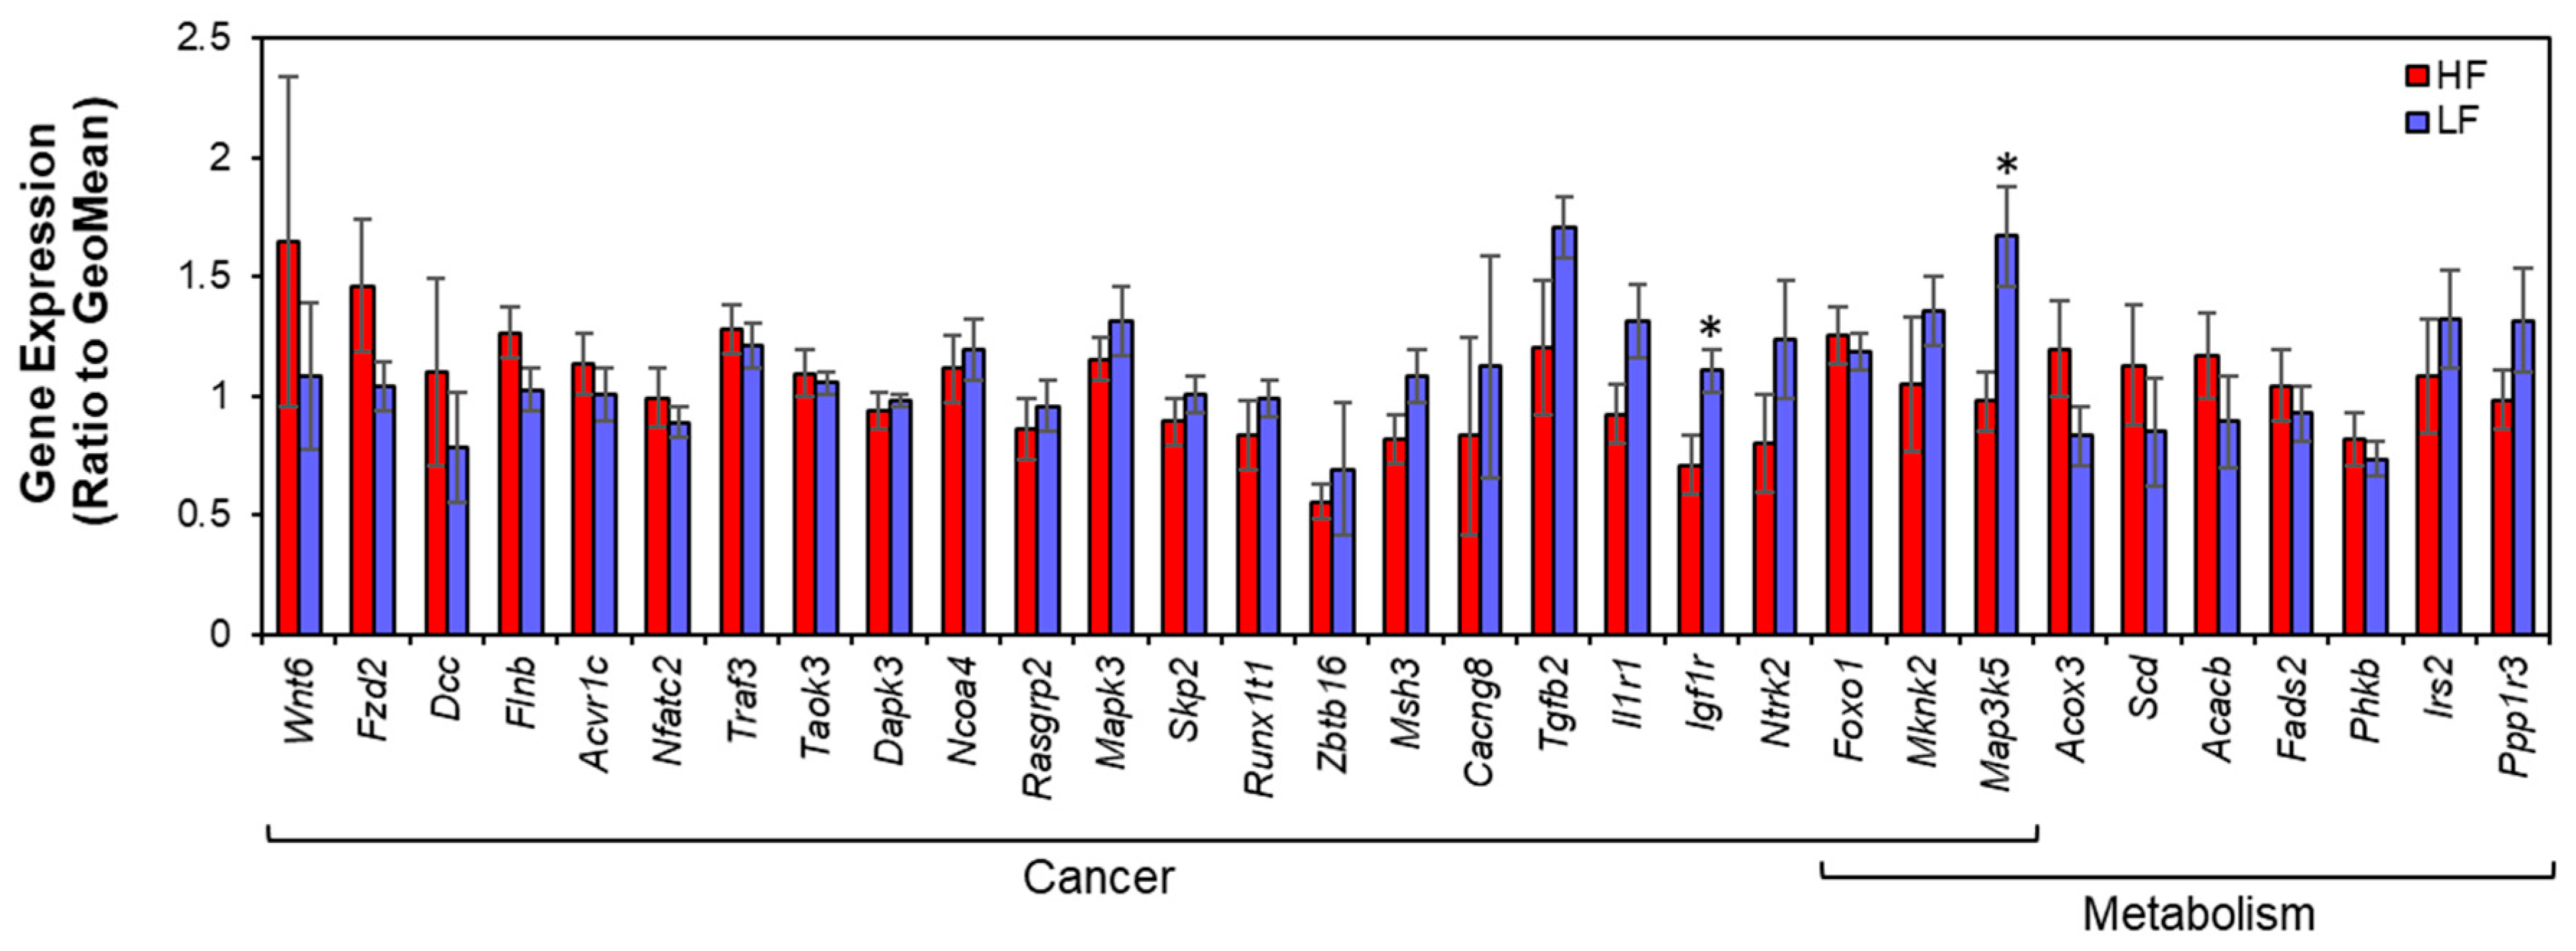
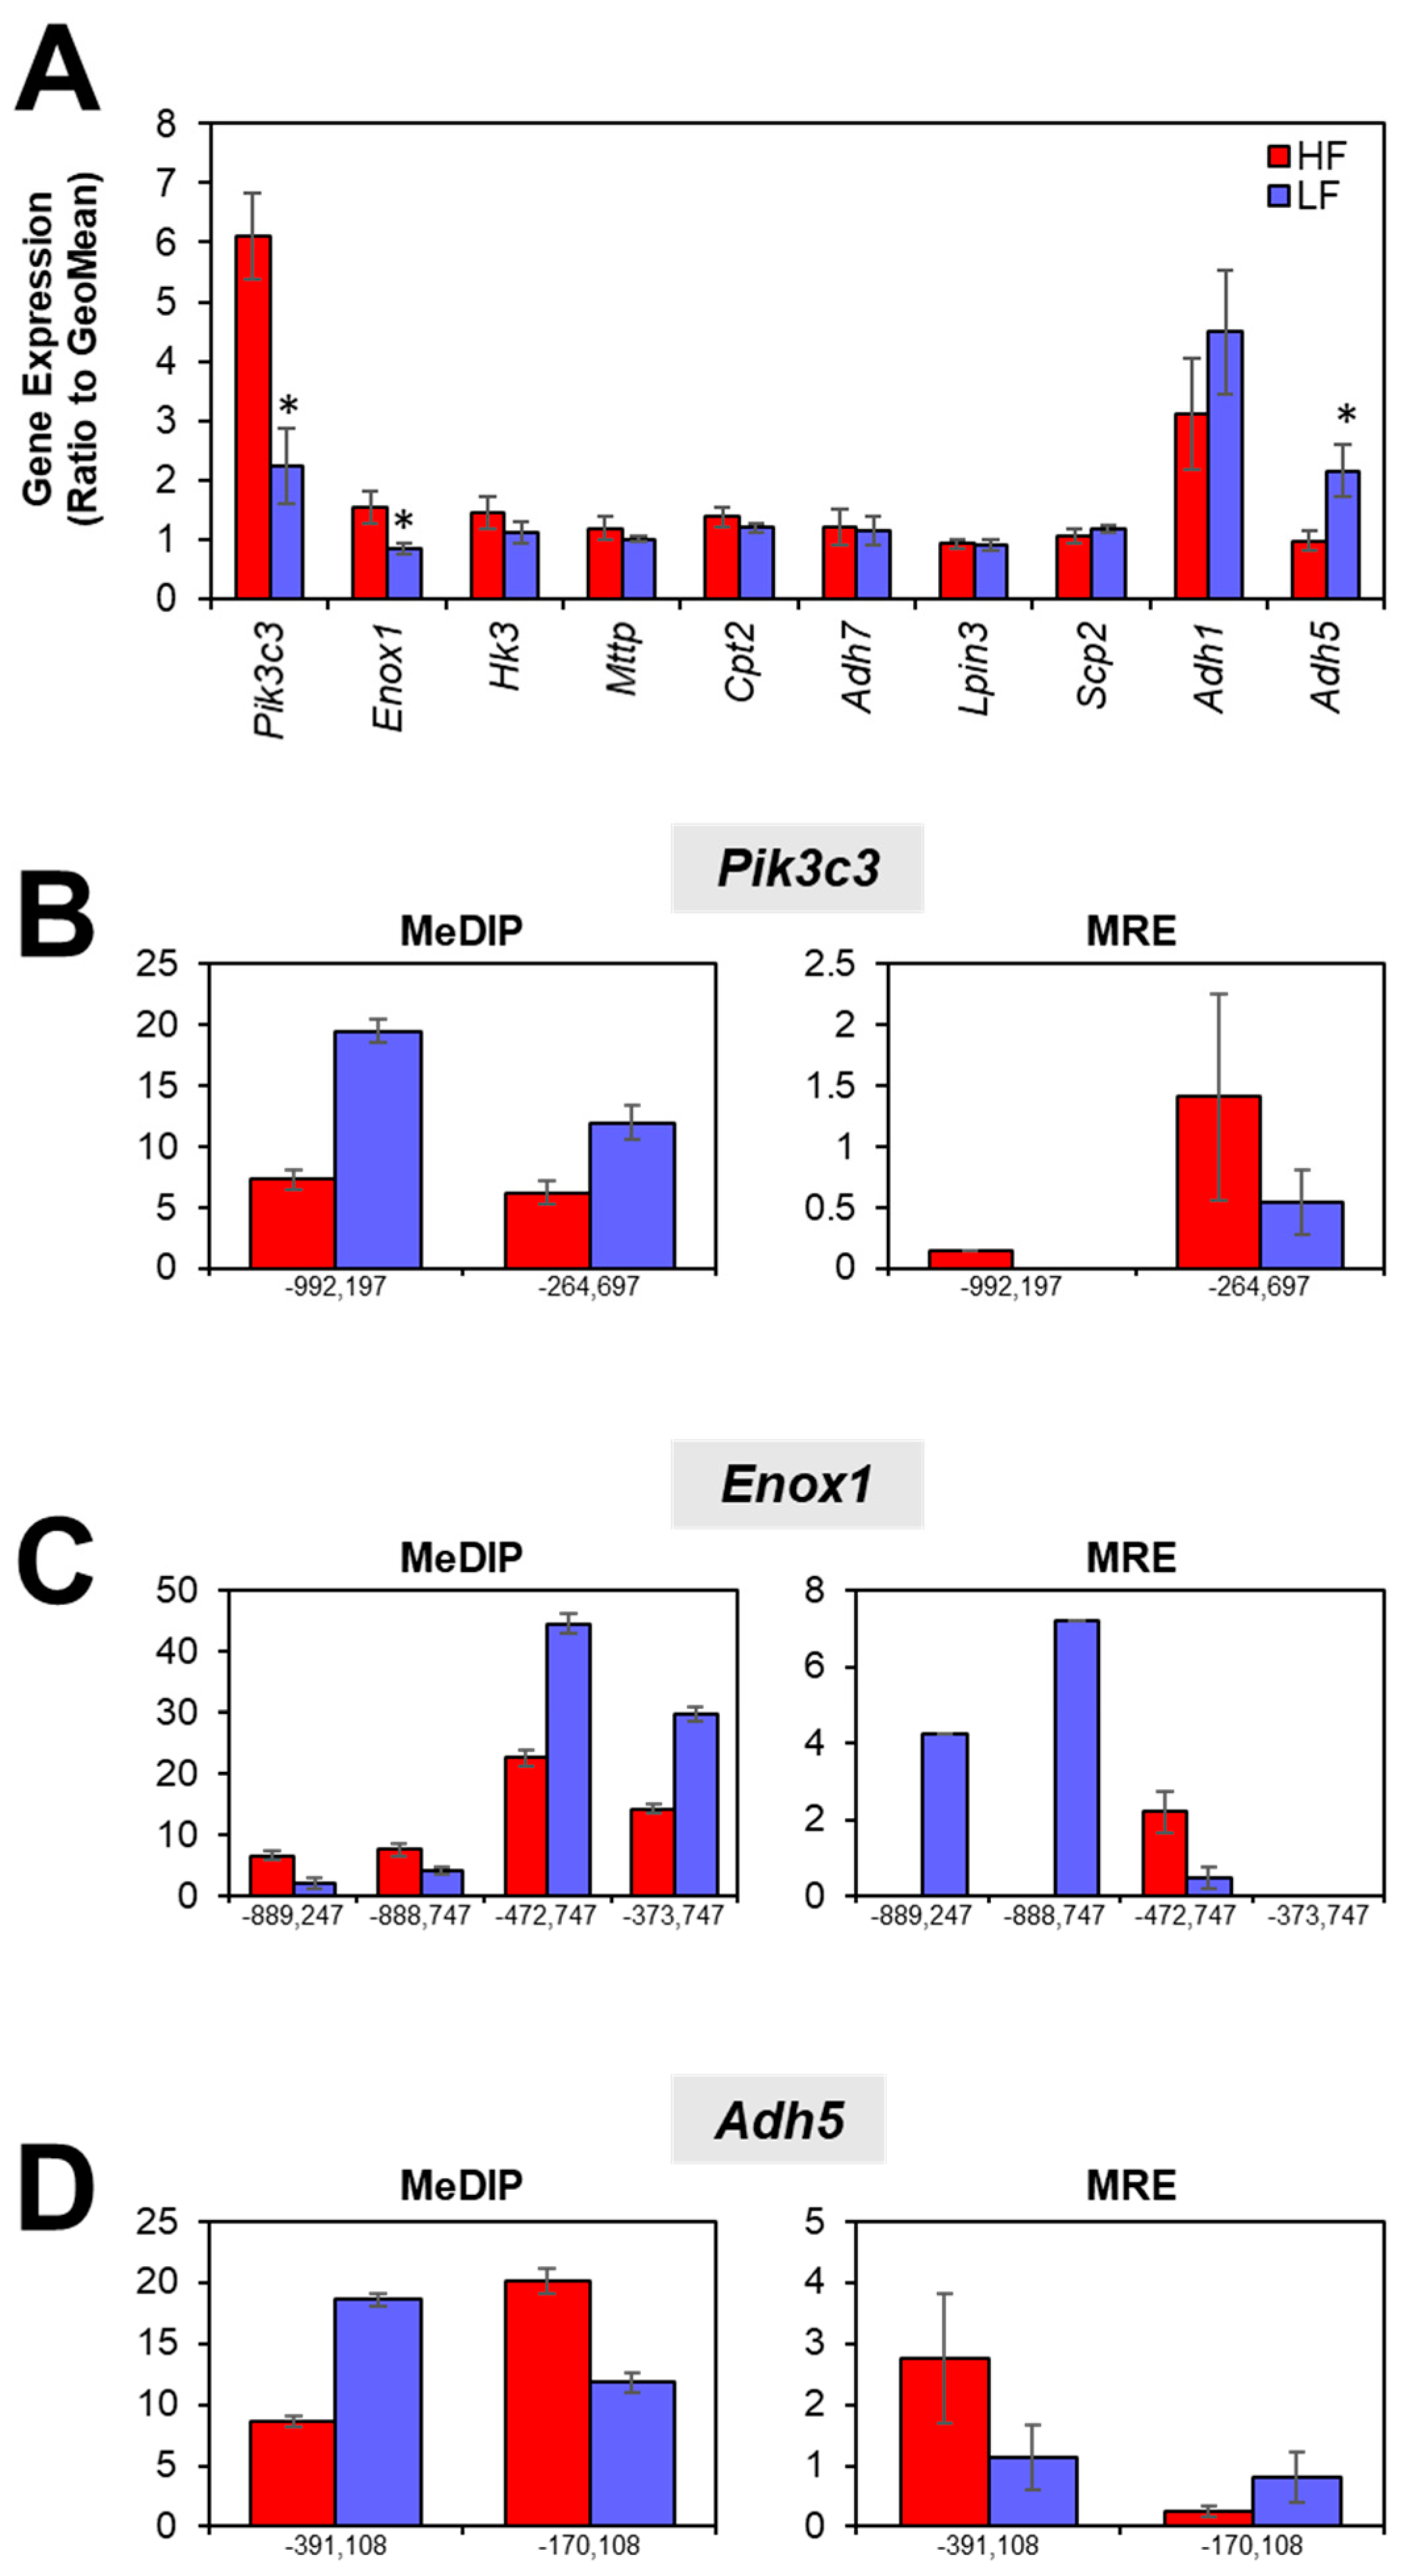
3.3. Gene Expression
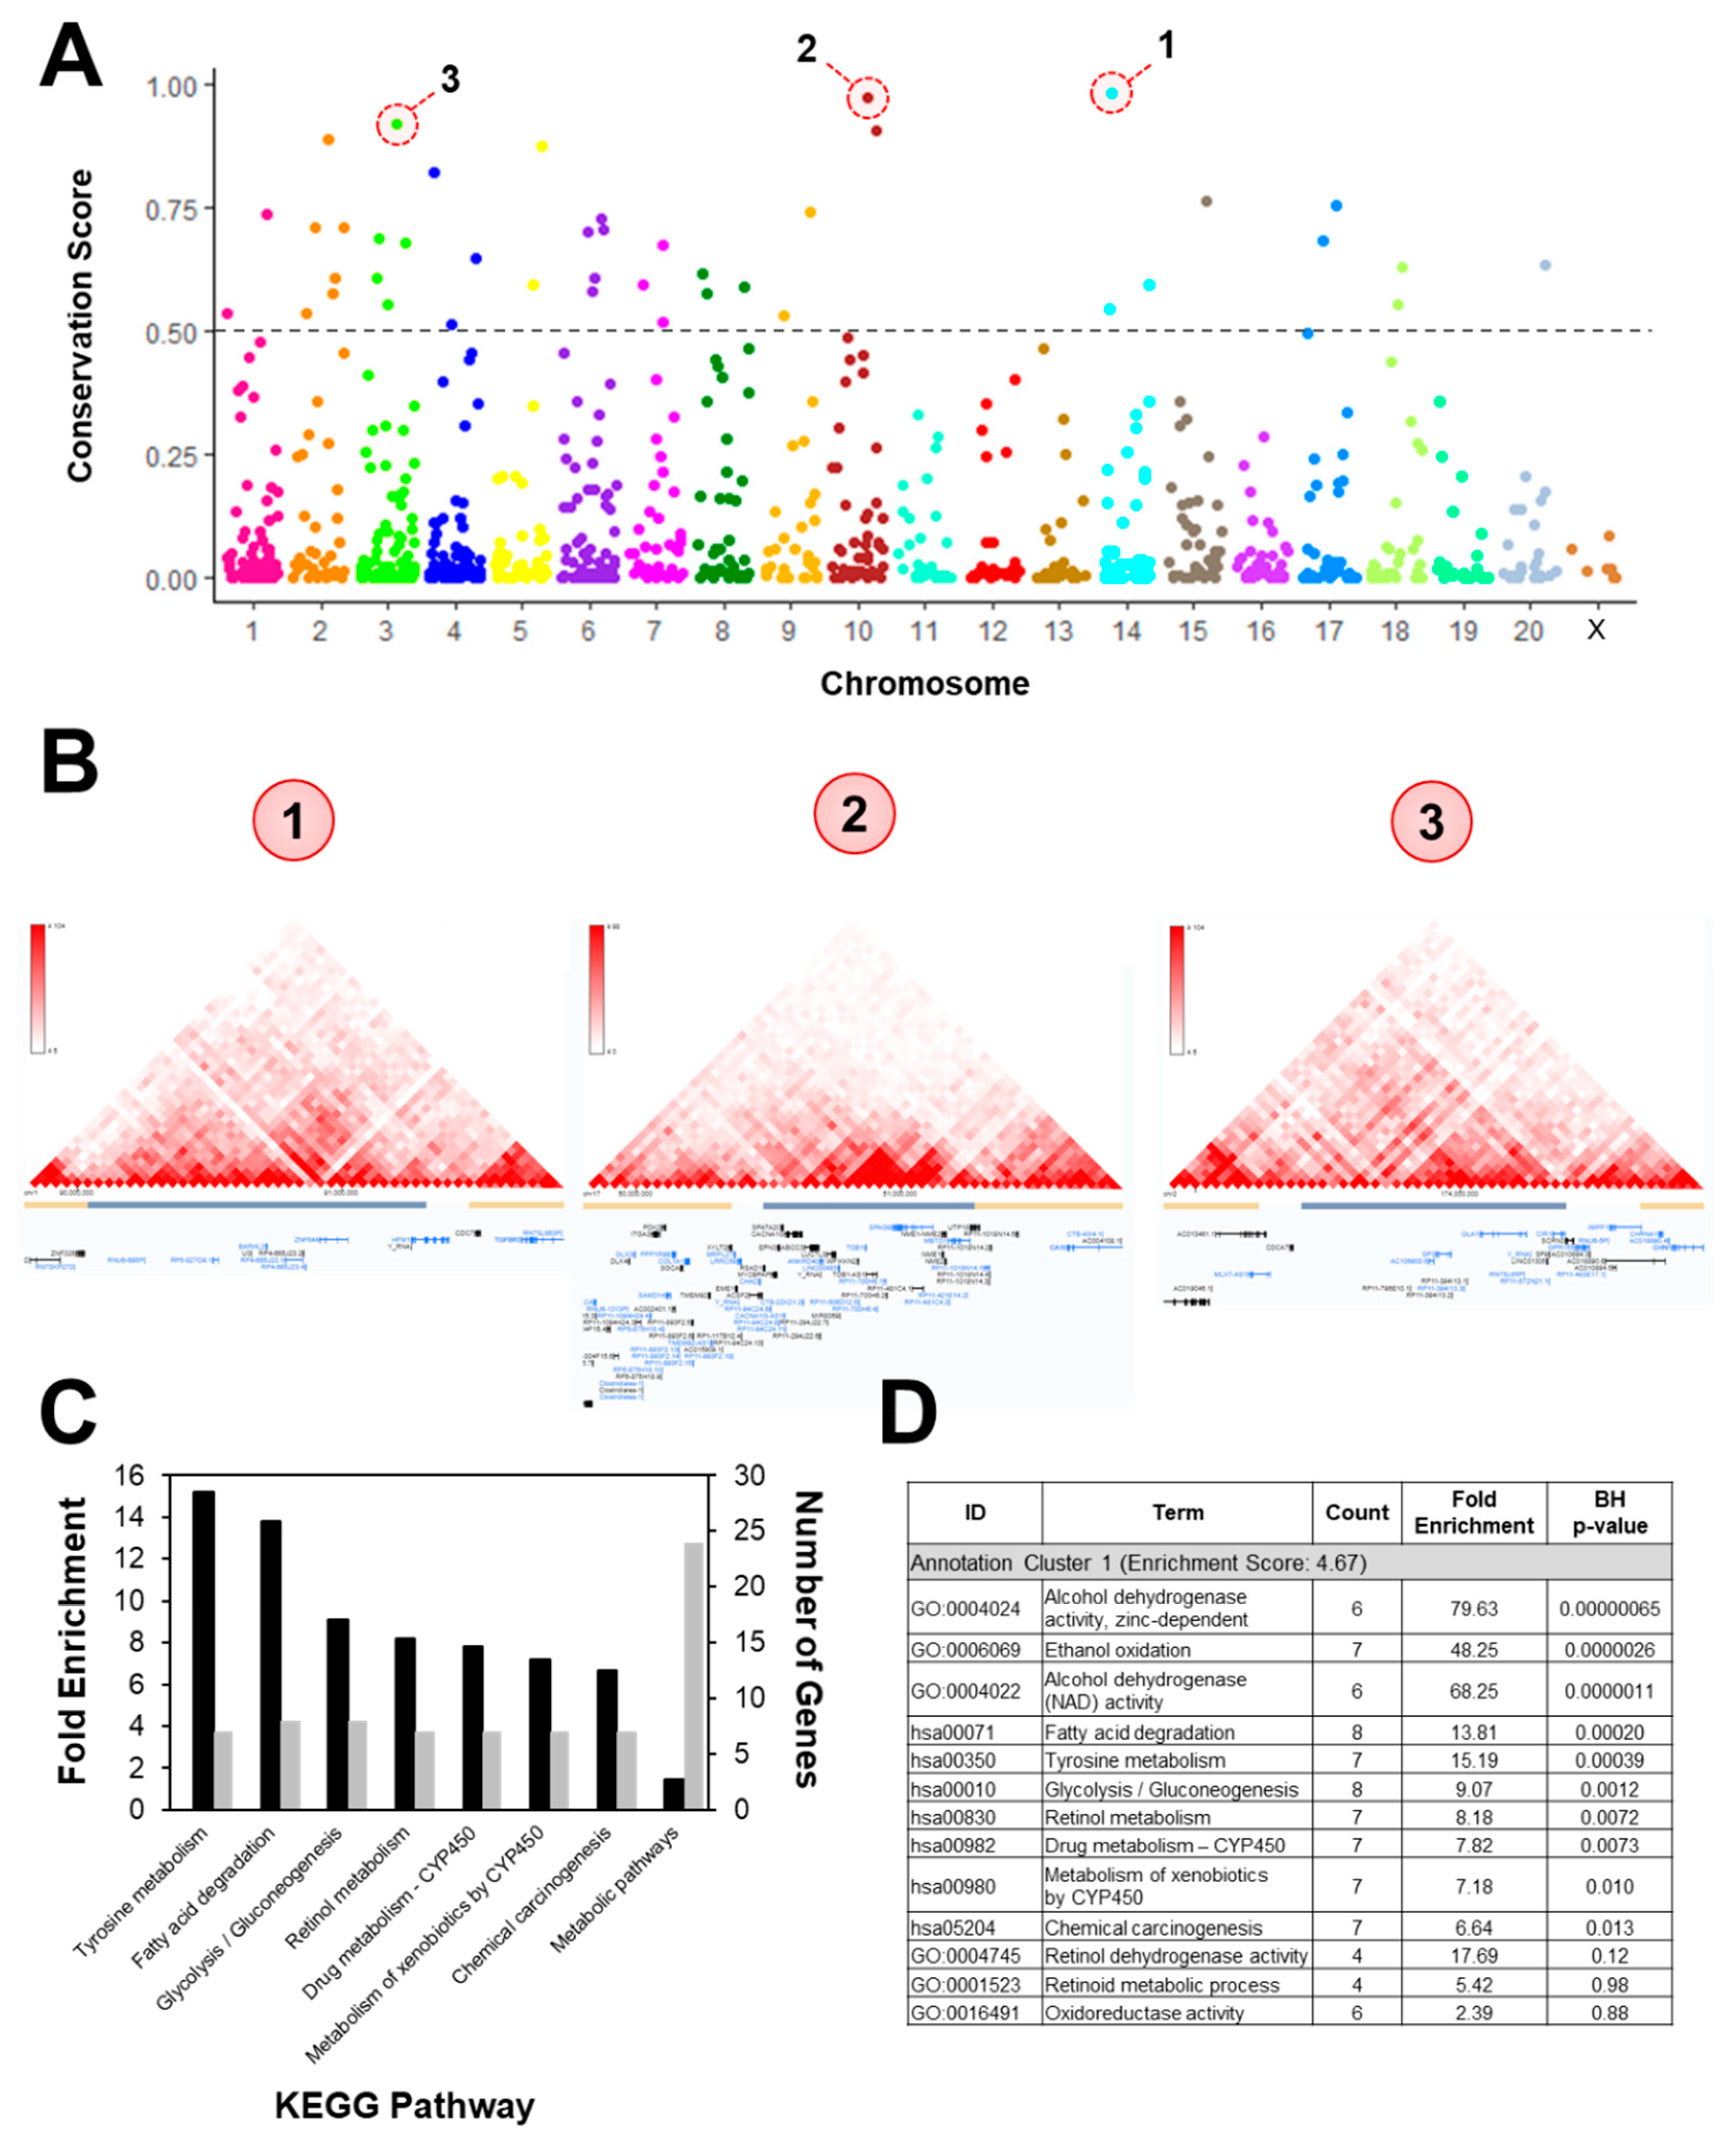
3.4. Intergenic CpGs
4. Discussion
5. Conclusions
Author Contributions
Funding
Acknowledgments
Conflicts of Interest
References
- Liu, Z.; Patil, I.Y.; Jiang, T.; Sancheti, H.; Walsh, J.P.; Stiles, B.L.; Yin, F.; Cadenas, E. High-fat diet induces hepatic insulin resistance and impairment of synaptic plasticity. PLoS ONE 2015, 10, e0128274. [Google Scholar] [CrossRef] [PubMed]
- Sakamoto, E.; Seino, Y.; Fukami, A.; Mizutani, N.; Tsunekawa, S.; Ishikawa, K.; Ogata, H.; Uenishi, E.; Kamiya, H.; Hamada, Y.; et al. Ingestion of a moderate high-sucrose diet results in glucose intolerance with reduced liver glucokinase activity and impaired glucagon-like peptide-1 secretion. J. Diabetes Investig. 2012, 3, 432–440. [Google Scholar] [CrossRef] [PubMed]
- Mauro, C.; Smith, J.; Cucchi, D.; Coe, D.; Fu, H.; Bonacina, F.; Baragetti, A.; Cermenati, G.; Caruso, D.; Mitro, N.; et al. Obesity-Induced Metabolic Stress Leads to Biased Effector Memory CD4(+) T Cell Differentiation via PI3K p110delta-Akt-Mediated Signals. Cell Metab. 2017, 25, 593–609. [Google Scholar] [CrossRef] [PubMed]
- Sverdlov, A.L.; Elezaby, A.; Behring, J.B.; Bachschmid, M.M.; Luptak, I.; Tu, V.H.; Siwik, D.A.; Miller, E.J.; Liesa, M.; Shirihai, O.S.; et al. High fat, high sucrose diet causes cardiac mitochondrial dysfunction due in part to oxidative post-translational modification of mitochondrial complex II. J. Mol. Cell. Cardiol. 2015, 78, 165–173. [Google Scholar] [CrossRef] [PubMed]
- Han, J.; Jiang, Y.; Liu, X.; Meng, Q.; Xi, Q.; Zhuang, Q.; Han, Y.; Gao, Y.; Ding, Q.; Wu, G. Dietary Fat Intake and Risk of Gastric Cancer: A Meta-Analysis of Observational Studies. PLoS ONE 2015, 10, e0138580. [Google Scholar] [CrossRef] [PubMed]
- Ni, T.; He, Z.; Dai, Y.; Yao, J.; Guo, Q.; Wei, L. Oroxylin A suppresses the development and growth of colorectal cancer through reprogram of HIF1alpha-modulated fatty acid metabolism. Cell Death Dis. 2017, 8, e2865. [Google Scholar] [CrossRef] [PubMed]
- de Almeida Faria, J.; Duque-Guimaraes, D.; Carpenter, A.A.; Loche, E.; Ozanne, S.E. A post-weaning obesogenic diet exacerbates the detrimental effects of maternal obesity on offspring insulin signaling in adipose tissue. Sci. Rep. 2017, 7, 44949. [Google Scholar] [CrossRef] [PubMed]
- Kruse, M.; Seki, Y.; Vuguin, P.M.; Du, X.Q.; Fiallo, A.; Glenn, A.S.; Singer, S.; Breuhahn, K.; Katz, E.B.; Charron, M.J. High-fat intake during pregnancy and lactation exacerbates high-fat diet-induced complications in male offspring in mice. Endocrinology 2013, 154, 3565–3576. [Google Scholar] [CrossRef]
- Loche, E.; Blackmore, H.L.; Carpenter, A.A.; Beeson, J.H.; Pinnock, A.; Ashmore, T.J.; Aiken, C.E.; de Almeida-Faria, J.; Schoonejans, J.M.; Giussani, D.A.; et al. Maternal diet-induced obesity programmes cardiac dysfunction in male mice independently of post-weaning diet. Cardiovasc. Res. 2018, 114, 1372–1384. [Google Scholar] [CrossRef]
- Richmond, R.C.; Sharp, G.C.; Herbert, G.; Atkinson, C.; Taylor, C.; Bhattacharya, S.; Campbell, D.; Hall, M.; Kazmi, N.; Gaunt, T.; et al. The long-term impact of folic acid in pregnancy on offspring DNA methylation: Follow-up of the Aberdeen Folic Acid Supplementation Trial (AFAST). Int. J. Epidemiol. 2018. [Google Scholar] [CrossRef]
- Pauwels, S.; Ghosh, M.; Duca, R.C.; Bekaert, B.; Freson, K.; Huybrechts, I.; Langie, S.A.S.; Koppen, G.; Devlieger, R.; Godderis, L. Maternal intake of methyl-group donors affects DNA methylation of metabolic genes in infants. Clin. Epigenetics 2017, 9, 16. [Google Scholar] [CrossRef] [PubMed]
- Geraghty, A.A.; Lindsay, K.L.; Alberdi, G.; McAuliffe, F.M.; Gibney, E.R. Nutrition During Pregnancy Impacts Offspring’s Epigenetic Status-Evidence from Human and Animal Studies. Nutr. Metab. Insights 2015, 8, 41–47. [Google Scholar] [CrossRef] [PubMed]
- Ge, Z.J.; Luo, S.M.; Lin, F.; Liang, Q.X.; Huang, L.; Wei, Y.C.; Hou, Y.; Han, Z.M.; Schatten, H.; Sun, Q.Y. DNA methylation in oocytes and liver of female mice and their offspring: Effects of high-fat-diet-induced obesity. Environ. Health Perspect. 2014, 122, 159–164. [Google Scholar] [CrossRef] [PubMed]
- Ding, Y.; Li, J.; Liu, S.; Zhang, L.; Xiao, H.; Li, J.; Chen, H.; Petersen, R.B.; Huang, K.; Zheng, L. DNA hypomethylation of inflammation-associated genes in adipose tissue of female mice after multigenerational high fat diet feeding. Int. J. Obes. 2014, 38, 198–204. [Google Scholar] [CrossRef] [PubMed]
- Dudley, K.J.; Sloboda, D.M.; Connor, K.L.; Beltrand, J.; Vickers, M.H. Offspring of mothers fed a high fat diet display hepatic cell cycle inhibition and associated changes in gene expression and DNA methylation. PLoS ONE 2011, 6, e21662. [Google Scholar] [CrossRef] [PubMed]
- Zhang, Y.; Wang, H.; Zhou, D.; Moody, L.; Lezmi, S.; Chen, H.; Pan, Y.X. High-fat diet caused widespread epigenomic differences on hepatic methylome in rat. Physiol. Genom. 2015, 47, 514–523. [Google Scholar] [CrossRef] [PubMed]
- Faa, G.; Sciot, R.; Farci, A.M.; Callea, F.; Ambu, R.; Congiu, T.; van Eyken, P.; Cappai, G.; Marras, A.; Costa, V.; et al. Iron concentration and distribution in the newborn liver. Liver 1994, 14, 193–199. [Google Scholar] [CrossRef] [PubMed]
- Matsuzaki, S.; Onda, M.; Tajiri, T.; Kim, D.Y. Hepatic lobar differences in progression of chronic liver disease: Correlation of asialoglycoprotein scintigraphy and hepatic functional reserve. Hepatology 1997, 25, 828–832. [Google Scholar] [CrossRef] [PubMed]
- Irwin, R.D.; Parker, J.S.; Lobenhofer, E.K.; Burka, L.T.; Blackshear, P.E.; Vallant, M.K.; Lebetkin, E.H.; Gerken, D.F.; Boorman, G.A. Transcriptional profiling of the left and median liver lobes of male f344/n rats following exposure to acetaminophen. Toxicol. Pathol. 2005, 33, 111–117. [Google Scholar]
- Moody, L.; Chen, H.; Pan, Y.X. Postnatal diet remodels hepatic DNA methylation in metabolic pathways established by a maternal high-fat diet. Epigenomics 2017, 9, 1387–1402. [Google Scholar] [CrossRef]
- Stevens, M.; Cheng, J.B.; Li, D.; Xie, M.; Hong, C.; Maire, C.L.; Ligon, K.L.; Hirst, M.; Marra, M.A.; Costello, J.F.; et al. Estimating absolute methylation levels at single-CpG resolution from methylation enrichment and restriction enzyme sequencing methods. Genome Res. 2013, 23, 1541–1553. [Google Scholar] [CrossRef] [PubMed]
- Stevens, A.; Begum, G.; Cook, A.; Connor, K.; Rumball, C.; Oliver, M.; Challis, J.; Bloomfield, F.; White, A. Epigenetic changes in the hypothalamic proopiomelanocortin and glucocorticoid receptor genes in the ovine fetus after periconceptional undernutrition. Endocrinology 2010, 151, 3652–3664. [Google Scholar] [CrossRef] [PubMed]
- Li, D.; Zhang, B.; Xing, X.; Wang, T. Combining MeDIP-seq and MRE-seq to investigate genome-wide CpG methylation. Methods 2015, 72, 29–40. [Google Scholar] [CrossRef] [PubMed]
- Zhang, B.; Zhou, Y.; Lin, N.; Lowdon, R.F.; Hong, C.; Nagarajan, R.P.; Cheng, J.B.; Li, D.; Stevens, M.; Lee, H.J.; et al. Functional DNA methylation differences between tissues, cell types, and across individuals discovered using the M & M algorithm. Genome Res. 2013, 23, 1522–1540. [Google Scholar] [PubMed]
- Irizarry, R.A.; Ladd-Acosta, C.; Wen, B.; Wu, Z.; Montano, C.; Onyango, P.; Cui, H.; Gabo, K.; Rongione, M.; Webster, M.; et al. The human colon cancer methylome shows similar hypo-and hypermethylation at conserved tissue-specific CpG island shores. Nat. Genet. 2009, 41, 178–186. [Google Scholar] [CrossRef] [PubMed]
- Dennis, G., Jr.; Sherman, B.T.; Hosack, D.A.; Yang, J.; Gao, W.; Lane, H.C.; Lempicki, R.A. DAVID: Database for Annotation, Visualization, and Integrated Discovery. Genome Biol. 2003, 4, R60. [Google Scholar] [CrossRef]
- Leung, D.; Jung, I.; Rajagopal, N.; Schmitt, A.; Selvaraj, S.; Lee, A.Y.; Yen, C.A.; Lin, S.; Lin, Y.; Qiu, Y.; et al. Integrative analysis of haplotype-resolved epigenomes across human tissues. Nature 2015, 518, 350–354. [Google Scholar] [CrossRef]
- Wang, Y.; Song, F.; Zhang, B.; Zhang, L.; Xu, J.; Kuang, D.; Li, D.; Choudhary, M.N.K.; Li, Y.; Hu, M.; et al. The 3D Genome Browser: A web-based browser for visualizing 3D genome organization and long-range chromatin interactions. Genome Biol. 2017, 19, 151. [Google Scholar] [CrossRef]
- Wankhade, U.D.; Zhong, Y.; Kang, P.; Alfaro, M.; Chintapalli, S.V.; Thakali, K.M.; Shankar, K. Enhanced offspring predisposition to steatohepatitis with maternal high-fat diet is associated with epigenetic and microbiome alterations. PLoS ONE 2017, 12, e0175675. [Google Scholar] [CrossRef]
- Turdi, S.; Ge, W.; Hu, N.; Bradley, K.M.; Wang, X.; Ren, J. Interaction between maternal and postnatal high fat diet leads to a greater risk of myocardial dysfunction in offspring via enhanced lipotoxicity, IRS-1 serine phosphorylation and mitochondrial defects. J. Mol. Cell. Cardiol. 2013, 55, 117–129. [Google Scholar] [CrossRef]
- Keleher, M.R.; Zaidi, R.; Shah, S.; Oakley, M.E.; Pavlatos, C.; El Idrissi, S.; Xing, X.; Li, D.; Wang, T.; Cheverud, J.M. Maternal high-fat diet associated with altered gene expression, DNA methylation, and obesity risk in mouse offspring. PLoS ONE 2018, 13, e0192606. [Google Scholar] [CrossRef] [PubMed]
- Sheen, J.M.; Yu, H.R.; Tain, Y.L.; Tsai, W.L.; Tiao, M.M.; Lin, I.C.; Tsai, C.C.; Lin, Y.J.; Huang, L.T. Combined maternal and postnatal high-fat diet leads to metabolic syndrome and is effectively reversed by resveratrol: A multiple-organ study. Sci. Rep. 2018, 8, 5607. [Google Scholar] [CrossRef] [PubMed]
- Zheng, J.; Xiao, X.; Zhang, Q.; Yu, M.; Xu, J.; Wang, Z. Maternal high-fat diet modulates hepatic glucose, lipid homeostasis and gene expression in the PPAR pathway in the early life of offspring. Int. J. Mol. Sci. 2014, 15, 14967–14983. [Google Scholar] [CrossRef] [PubMed]
- Larsen, T.D.; Sabey, K.H.; Knutson, A.J.; Gandy, T.C.T.; Louwagie, E.J.; Lauterboeck, L.; Mdaki, K.S.; Baack, M.L. Diabetic Pregnancy and Maternal High-Fat Diet Impair Mitochondrial Dynamism in the Developing Fetal Rat Heart by Sex-Specific Mechanisms. Int. J. Mol. Sci. 2019, 20, 3090. [Google Scholar] [CrossRef] [PubMed]
- Tamashiro, K.L.; Terrillion, C.E.; Hyun, J.; Koenig, J.I.; Moran, T.H. Prenatal stress or high-fat diet increases susceptibility to diet-induced obesity in rat offspring. Diabetes 2009, 58, 1116–1125. [Google Scholar] [CrossRef] [PubMed]
- Kriebel, J.; Herder, C.; Rathmann, W.; Wahl, S.; Kunze, S.; Molnos, S.; Volkova, N.; Schramm, K.; Carstensen-Kirberg, M.; Waldenberger, M.; et al. Association between DNA Methylation in Whole Blood and Measures of Glucose Metabolism: KORA F4 Study. PLoS ONE 2016, 11, e0152314. [Google Scholar] [CrossRef] [PubMed]
- Truong, V.; Huang, S.Y.; Dennis, J.; Lemire, M.; Zwingerman, N.; Aissi, D.; Kassam, I.; Perret, C.; Wells, P.; Morange, P.E.; et al. Blood triglyceride levels are associated with DNA methylation at the serine metabolism gene PHGDH. Sci. Rep. 2017, 7, 11207. [Google Scholar] [CrossRef] [PubMed]
- Zhong, J.; Agha, G.; Baccarelli, A.A. The Role of DNA Methylation in Cardiovascular Risk and Disease Methodological Aspects, Study Design, and Data Analysis for Epidemiological Studies. Circ. Res. 2016, 118, 119–131. [Google Scholar] [CrossRef]
- St-Onge, M.P.; Gallagher, D. Body composition changes with aging: The cause or the result of alterations in metabolic rate and macronutrient oxidation? Nutrition 2010, 26, 152–155. [Google Scholar] [CrossRef]
- Matsukawa, J.; Matsuzawa, A.; Takeda, K.; Ichijo, H. The ASK1-MAP kinase cascades in mammalian stress response. J. Biochem. 2004, 136, 261–265. [Google Scholar] [CrossRef]
- Steele-Perkins, G.; Turner, J.; Edman, J.C.; Hari, J.; Pierce, S.B.; Stover, C.; Rutter, W.J.; Roth, R.A. Expression and characterization of a functional human insulin-like growth factor I receptor. J. Biol. Chem. 1988, 263, 11486–11492. [Google Scholar] [PubMed]
- Fernandez, A.M.; Kim, J.K.; Yakar, S.; Dupont, J.; Hernandez-Sanchez, C.; Castle, A.L.; Filmore, J.; Shulman, G.I.; Le Roith, D. Functional inactivation of the IGF-I and insulin receptors in skeletal muscle causes type 2 diabetes. Genes Dev. 2001, 15, 1926–1934. [Google Scholar] [CrossRef] [PubMed]
- Ricco, R.C.; Ricco, R.G.; Queluz, M.C.; de Paula, M.T.S.; Atique, P.V.; Custodio, R.J.; Tourinho Filho, H.; Del Roio Liberatori, R., Jr.; Martinelli, C.E., Jr. IGF-1R mRNA expression is increased in obese children. Growth Horm. IGF Res. 2018, 39, 1–5. [Google Scholar] [CrossRef] [PubMed]
- Bluher, M.; Bashan, N.; Shai, I.; Harman-Boehm, I.; Tarnovscki, T.; Avinaoch, E.; Stumvoll, M.; Dietrich, A.; Kloting, N.; Rudich, A. Activated Ask1-MKK4-p38MAPK/JNK stress signaling pathway in human omental fat tissue may link macrophage infiltration to whole-body Insulin sensitivity. J. Clin. Endocrinol. Metab. 2009, 94, 2507–2515. [Google Scholar] [CrossRef] [PubMed]
- Ball, M.P.; Li, J.B.; Gao, Y.; Lee, J.H.; LeProust, E.M.; Park, I.H.; Xie, B.; Daley, G.Q.; Church, G.M. Targeted and genome-scale strategies reveal gene-body methylation signatures in human cells. Nat. Biotechnol. 2009, 27, 361–368. [Google Scholar] [CrossRef] [PubMed]
- Jjingo, D.; Conley, A.B.; Yi, S.V.; Lunyak, V.V.; Jordan, I.K. On the presence and role of human gene-body DNA methylation. Oncotarget 2012, 3, 462–474. [Google Scholar] [CrossRef] [PubMed]
- Yang, X.; Han, H.; De Carvalho, D.D.; Lay, F.D.; Jones, P.A.; Liang, G. Gene body methylation can alter gene expression and is a therapeutic target in cancer. Cancer Cell 2014, 26, 577–590. [Google Scholar] [CrossRef] [PubMed]
- Che, Y.; Wang, Z.P.; Yuan, Y.; Zhang, N.; Jin, Y.G.; Wan, C.X.; Tang, Q.Z. Role of autophagy in a model of obesity: A long-term high fat diet induces cardiac dysfunction. Mol. Med. Rep. 2018, 18, 3251–3261. [Google Scholar] [CrossRef] [PubMed]
- Papackova, Z.; Dankova, H.; Palenickova, E.; Kazdova, L.; Cahova, M. Effect of Short-and Long-Term High-Fat Feeding on Autophagy Flux and Lysosomal Activity in Rat Liver. Physiol. Res. 2012, 61, S67–S76. [Google Scholar] [PubMed]
- Yamamoto, T.; Takabatake, Y.; Takahashi, A.; Kimura, T.; Namba, T.; Matsuda, J.; Minami, S.; Kaimori, J.Y.; Matsui, I.; Matsusaka, T.; et al. High-Fat Diet-Induced Lysosomal Dysfunction and Impaired Autophagic Flux Contribute to Lipotoxicity in the Kidney. J. Am. Soc. Nephrol. 2017, 28, 1534–1551. [Google Scholar] [CrossRef] [PubMed]
- Fortin, J.P.; Hansen, K.D. Reconstructing A/B compartments as revealed by Hi-C using long-range correlations in epigenetic data. Genome Biol. 2015, 16, 180. [Google Scholar] [CrossRef] [PubMed]
- Strakovsky, R.S.; Wang, H.; Engeseth, N.J.; Flaws, J.A.; Helferich, W.G.; Pan, Y.X.; Lezmi, S. Developmental bisphenol A (BPA) exposure leads to sex-specific modification of hepatic gene expression and epigenome at birth that may exacerbate high-fat diet-induced hepatic steatosis. Toxicol. Appl. Pharmacol. 2015, 284, 101–112. [Google Scholar] [CrossRef] [PubMed]
- Strakovsky, R.S.; Zhang, X.; Zhou, D.; Pan, Y.X. Gestational high fat diet programs hepatic phosphoenolpyruvate carboxykinase gene expression and histone modification in neonatal offspring rats. J. Physiol. 2011, 589, 2707–2717. [Google Scholar] [CrossRef] [PubMed]
- Zhou, D.; Wang, H.; Cui, H.; Chen, H.; Pan, Y.X. Early-life exposure to high-fat diet may predispose rats to gender-specific hepatic fat accumulation by programming Pepck expression. J. Nutr. Biochem. 2015, 26, 433–440. [Google Scholar] [CrossRef] [PubMed]
- Zhang, X.; Strakovsky, R.; Zhou, D.; Zhang, Y.; Pan, Y.X. A maternal high-fat diet represses the expression of antioxidant defense genes and induces the cellular senescence pathway in the liver of male offspring rats. J. Nutr. 2011, 141, 1254–1259. [Google Scholar] [CrossRef] [PubMed]
- Moody, L.; Wang, H.; Jung, P.M.; Chen, H.; Pan, Y.X. Maternal and Post-weaning High-Fat Diets Produce Distinct DNA Methylation Patterns in Hepatic Metabolic Pathways within Specific Genomic Contexts. Int. J. Mol. Sci. 2019, 20, 3229. [Google Scholar] [CrossRef] [PubMed]
- Yuan, X.; Tsujimoto, K.; Hashimoto, K.; Kawahori, K.; Hanzawa, N.; Hamaguchi, M.; Seki, T.; Nawa, M.; Ehara, T.; Kitamura, Y.; et al. Epigenetic modulation of Fgf21 in the perinatal mouse liver ameliorates diet-induced obesity in adulthood. Nat. Commun. 2018, 9, 636. [Google Scholar] [CrossRef] [PubMed]
- Maegawa, S.; Lu, Y.; Tahara, T.; Lee, J.T.; Madzo, J.; Liang, S.; Jelinek, J.; Colman, R.J.; Issa, J.J. Caloric restriction delays age-related methylation drift. Nat. Commun. 2017, 8, 539. [Google Scholar] [CrossRef] [PubMed]
- Guan, D.; Xiong, Y.; Borck, P.C.; Jang, C.; Doulias, P.T.; Papazyan, R.; Fang, B.; Jiang, C.; Zhang, Y.; Briggs, E.R.; et al. Diet-Induced Circadian Enhancer Remodeling Synchronizes Opposing Hepatic Lipid Metabolic Processes. Cell 2018, 174, 831–842. [Google Scholar] [CrossRef] [PubMed]
- Thomas, R.M.; Sai, H.; Wells, A.D. Conserved intergenic elements and DNA methylation cooperate to regulate transcription at the il17 locus. J. Biol. Chem. 2012, 287, 25049–25059. [Google Scholar] [CrossRef] [PubMed]
- Caplakova, V.; Babusikova, E.; Blahovcova, E.; Balharek, T.; Zelieskova, M.; Hatok, J. DNA Methylation Machinery in the Endometrium and Endometrial Cancer. Anticancer Res. 2016, 36, 4407–4420. [Google Scholar] [CrossRef] [PubMed]


| Gene | CpG Site | Position | Methylation | Primers (5′ → 3′) | Efficiency * |
|---|---|---|---|---|---|
| Gpam | CpG 1 | Forward +52,479 | U | GTAGTGGAATAAGAAGTTTTCGGAG | 98.20% |
| Reverse +52,587 | U | ACCTTCAAATAACAATCACGCTAC | |||
| Forward +52,485 | M | AGAGTAGTAGTGGAATAAGAAGTTTTTGG | 99.10% | ||
| Reverse +52,586 | M | CACCTTCAAATAACAATCACACTAC | |||
| CpG 2 | Forward +44,337 | U | GGTGGAGAGGTATTTGTTATGGA | 108.20% | |
| Reverse +44,416 | U | CCACACAATCTACAAACTTCACAA | |||
| Forward +44,332 | M | TTAGAGGTGGAGAGGTATTTGTTAC | 101.19% | ||
| Reverse +44,414 | M | ACACAATCTACAAACTTCACGAAAA | |||
| CpG 3 | Forward +7619 | U | TGTAATTTTTTATTTTAATTTATGTGATTTTTGA | 95.56% | |
| Reverse +7736 | U | TTTCTACTTCACAATTACTAATCAACCCA | |||
| Forward +7633 | M | TTAATTTACGTGATTTTTGATTGTTATTATTTT | 98.50% | ||
| Reverse +7736 | M | CTACTTCACGATTACTAATCAACCCG | |||
| CpG 4 | Forward +7288 | U | AAGTTAAGTTGTAGTGGTTGGGTAATTG | 93.47% | |
| Reverse +7360 | U | CCCACTTATTTTAAACAACATCAAACC | |||
| Forward +7289 | M | AGTCGTAGTGGTCGGGTAATCG | 107.81% | ||
| Reverse +7357 | M | CCGCTTATTTTAAACAACATCGAA | |||
| Myh7b | CpG 1 | Forward +9089 | U | TGGGTTCGTGTGGGAAATG | 99.33% |
| Reverse +9181 | U | CCACCTCAACTCTCCCTAAACAA | |||
| Forward +9089 | M | CGGGTTCGTGTGGGAAAC | 92.99% | ||
| Reverse +9181 | M | CCGCCTCAACTCTCCCTAAA | |||
| CpG 2 | Forward +9607 | U | AGGAGTATAAATGGGAGGGTATTGATT | 91.86% | |
| Reverse +9757 | U | CATACACAACTTCCAACACCATCC | |||
| Forward +9621 | M | CGTGTTGGAGTAGGAGGAGTATAAAC | 102.11% | ||
| Reverse +9753 | M | CGCAACTTCCGACACCATC | |||
| CpG 3 | Forward +10,000 | U | TGATTTGAGGATTATGTGTATTGGATTT | 99.04% | |
| Reverse +10,069 | U | CCAATTTCTTTTTCCATTCTCCATAC | |||
| Forward +9995 | M | CGAGGATTACGTGTATTGGATTTTAA | 103.13% | ||
| Reverse +10,065 | M | TTTCTTTTTCCATTCTCCGTACAATA | |||
| CpG 4 | Forward +11,606 | U | AGGAGTGTATGTTTTTTAAGGTTTTAGATG | 96.42% | |
| Reverse +11,701 | U | AACAAAACTACTAAAAATTAAATAACTTCCCA | |||
| Forward +11,606 | M | AGGAGTGTATGTTTTTTAAGGTTTTAGACG | 98.73% | ||
| Reverse +11,701 | M | ACGAAACTACTAAAAATTAAATAACTTCCCA | |||
| CpG 5 | Forward +12,857 | U | GATTTGGATTTGTTGTTAAGGGTTTT | 102.17% | |
| Reverse +12,924 | U | AACCAACACCCACCACTACCTAA | |||
| Forward +12,859 | M | TTCGGATTTGTCGTTAAGGGTT | 106.16% | ||
| Reverse 12,927 | M | CCAACACCCACCGCTACC | |||
| CpG 6 | Forward +13,120 | U | TTATTTGGATATGGGATAAGAGAGGG | 98.27% | |
| Reverse +13,216 | U | CACCATCTAAAATAATACTACTTTCTTTCACTTAT | |||
| Forward +13,120 | M | TTATTTGGATACGGGATAAGAGAGG | 102.64% | ||
| Reverse +13,219 | M | CGTCTAAAATAATACTACTTTCTTTCGCTT |
| Gene | Ensembl ID | Common Name | Position | Primers (5′ → 3′) | Efficiency * |
|---|---|---|---|---|---|
| Acacb | ENSRNOT00000078868.1 | Acetyl-CoA Carboxylase Beta | Forward +1081 | ACCCCAAACTTCCAGAGC | 105.70% |
| Reverse +1189 | TGGGCTACAATGGTGGAG | ||||
| Acox3 | ENSRNOT00000049798.3 | Acyl-CoA Oxidase 3, Pristanoyl | Forward +1553 | TGACTGGTTGGACTCAGA | 94.56% |
| Reverse +1629 | TCTGATGACTCTCTCGGA | ||||
| Actb | ENSRNOT00000042459.4 | Actin Beta | Forward +451 | GAGACCTTCAACACCCCAGC | 104.67% |
| Reverse +526 | CAGTGGTACGACCAGAGGCA | ||||
| Acvr1c | ENSRNOT00000059280.4 | Activin A Receptor Type 1C | Forward +511 | TGATTTATGATGCCACTGCC | 100.24% |
| Reverse +586 | ATTGTCCTTGCGATGGTTCT | ||||
| Adh1 | ENSRNOT00000036993.4 | Alcohol Dehydrogenase 1 | Forward +257 | ATGAAGGAGTTGGGATAG | 100.37% |
| Reverse +318 | ATCACCTGTTCTTACGCT | ||||
| Adh5 | ENSRNOT00000016891.6 | Alcohol Dehydrogenase 5 | Forward +637 | GTGTGTCTGATTGGATGTGG | 117.98% |
| Reverse +700 | TGACCTTGGCAGTGTTGA | ||||
| Adh7 | ENSRNOT00000015870.4 | Alcohol Dehydrogenase 7 | Forward +262 | GAAGCAGTTGGGATTGTGGAGA | 108.18% |
| Reverse +328 | TCACTTTGTCACCTGGTCTCACTG | ||||
| Cacng8 | ENSRNOT00000078444.1 | Calcium Voltage-Gated Channel Auxiliary Subunit Gamma 8 | Forward +297 | CTGCGTGAAGATCAACCACT | 108.34% |
| Reverse +395 | ATAGGAAAGATGCTGGAGGC | ||||
| Cpt2 | ENSRNOT00000016954.3 | Carnitine Palmitoyltransferase 2 | Forward +310 | GACACCATGAAGAGATACCT | 107.28% |
| Reverse +387 | ACACAACGCTTCTGTTCT | ||||
| Dapk3 | ENSRNOT00000027634.4 | Death Associated Protein Kinase 3 | Forward +624 | TTCGTCGCCCCTGAGATTGTAA | 103.21% |
| Reverse +685 | ATGACGCCGATGCTCCACATAT | ||||
| Dcc | ENSRNOT00000064947.3 | DCC Netrin 1 Receptor | Forward +1144 | GTGGCTGAAAATGAGGCTGGC | 100.76% |
| Reverse +1208 | ATGGCAGGCTTGGGGACAA | ||||
| Enox1 | ENSRNOT00000074868.2 | Ecto-NOX Disulfide-Thiol Exchanger 1 | Forward +167 | TTGAGAGCATCGCACAGTGT | 93.82% |
| Reverse +239 | ATGCTCCCCAAACCATCA | ||||
| Fads2 | ENSRNOT00000059280.4 | Fatty Acid Desaturase 2 | Forward +711 | CGTGTTTGTCCTTGGAGAGTGGC | 108.89% |
| Reverse +790 | CATGCTGGTGGTTGTAGGGCA | ||||
| Flnb | ENSRNOT00000066546.1 | Filamin B | Forward +353 | GCTGGAGAATGTGTCTGT | 108.69% |
| Reverse +422 | ACTGTCAATGGACACGAG | ||||
| Foxo1 | ENSRNOT00000018244.5 | Forkhead Box O1 | Forward +994 | AGGATAAGGGCGACAGCAACAG | 102.12% |
| Reverse +1056 | GGGACAGATTGTGGCGAATTG | ||||
| Fzd2 | ENSRNOT00000032944.2 | Frizzled Class Receptor 2 | Forward +818 | TTTTGCCCGTCTCTGGAT | 93.13% |
| Reverse +889 | TAGGTGGTGACCGTGAAGAA | ||||
| Gapdh | ENSRNOT00000050443.4 | Glyceraldehyde-3-Phosphate Dehydrogenase | Forward +220 | CTCTACCCACGGCAAGTTCAACG | 100.39% |
| Reverse +311 | CTCGCTCCTGGAAGATGGTGATG | ||||
| Hk3 | ENSRNOT00000031935.2 | Hexokinase 3 | Forward +973 | CCCTGGTTCCTGGTGCTCAG | 119.40% |
| Reverse +1050 | CCAGCACCAGCCTTACCAGC | ||||
| Igfr1 | ENSRNOT00000019267.6 | Insulin Like Growth Factor 1 Receptor | Forward +2239 | CTGAGAGGAGGCGGAGAGATG | 109.39% |
| Reverse +2304 | TGTTCCTGCTTCGGCTGG | ||||
| Il1r1 | ENSRNOT00000019673.4 | Interleukin 1 Receptor Type 1 | Forward +393 | GGGTTCATTTGTCTCATTGTGC | 101.20% |
| Reverse +465 | TGACCTCATTTGGATACTCCGT | ||||
| Irs2 | ENSRNOT00000032918.6 | Insulin Receptor Substrate 2 | Forward +3373 | CTTGAAGCGGCTAAGTCT | 109.86% |
| Reverse +3435 | TGGCTGACTTGAAGGAAG | ||||
| Lpin3 | ENSRNOT00000022403.5 | Lipin 3 | Forward +578 | CCCTCATCGCAGCCTAAAGACAT | 108.38% |
| Reverse +657 | AGGTCAGCAGATGAAAGGTTGGC | ||||
| Map3k5 | ENSRNOT00000051496.6 | Mitogen-Activated Protein Kinase Kinase Kinase 5 | Forward +455 | GTTTTTACAACGCTGACATCGC | 105.77% |
| Reverse +525 | ATGATAAAACAGGGAAGGCTGC | ||||
| Mapk3 | ENSRNOT00000087625.1 | Mitogen-Activated Protein Kinase 3 | Forward +618 | CACTGGCTTTCTTACCGAGT | 111.47% |
| Reverse +696 | GGTGTAGCCCTTGGAGTTAA | ||||
| Mknk2 | ENSRNOT00000041106.5 | MAP Kinase Interacting Serine/Threonine Kinase 2 | Forward +177 | TTCAGGGCTTCCACCGTTCG | 107.33% |
| Reverse +246 | TGGGCGGGGTCTAAGGTGAA | ||||
| Msh3 | ENSRNOT00000018449.7 | MutS Homolog 3 | Forward +166 | TGTCCCCCACAGAACCAGCA | 109.37% |
| Reverse +229 | TTCCCCAGTGACCTCTTCCTGC | ||||
| Mttp | ENSRNOT00000014631.6 | Microsomal Triglyceride Transfer Protein | Forward +1042 | TAGAACCTGAGAACCTGTCCAACGC | 107.54% |
| Reverse +1113 | AAGTGCGGAGGTGCTGAATGAAG | ||||
| Ncoa4 | ENSRNOT00000066062.3 | Nuclear Receptor Coactivator 4 | Forward +611 | CCTAGTTCTTCAAGTGTCAGGC | 108.75% |
| Reverse +686 | TGGATGCTGACTTCTGCTCT | ||||
| Nfatc2 | ENSRNOT00000065615.1 | Nuclear Factor Of Activated T Cells 2 | Forward +1599 | GGAGCCAAAGAACAACATGCGGG | 100.47% |
| Reverse +1674 | CAGCTCGATGTCAGCGTTTCGGA | ||||
| Ntrk2 | ENSRNOT00000042145.2 | Neurotrophic Receptor Tyrosine Kinase 2 | Forward +979 | TCCTGGACAAACTCGTCA | 99.47% |
| Reverse +1058 | GGCTTACAAGGCGTTTCT | ||||
| Pik3c3 | ENSRNOT00000066816.2 | Phosphatidylinositol 3-Kinase Catalytic Subunit Type 3 | Forward +60 | CTGTGACCTGGACATCAA | 93.26% |
| Reverse +119 | TGTTCTCTCTTCCCTTCC | ||||
| Phkb | ENSRNOT00000049624.4 | Phosphorylase Kinase Regulatory Subunit Beta | Forward +369 | GCCATAAAGTGTATGAGAGGAG | 106.60% |
| Reverse +435 | TGAACTGCTGGACCTTATCA | ||||
| Ppp1r3b | ENSRNOT00000051720.2 | Protein Phosphatase 1 Regulatory Subunit 3B | Forward +838 | TATGAAAGAATGGAGTTCGCCGTG | 107.84% |
| Reverse +909 | TTTGCCTTTGTTGCTGTCCCAGTA | ||||
| Rasgrp2 | ENSRNOT00000028646.6 | RAS Guanyl Releasing Protein 2 | Forward +490 | CAAGAAGGAAACCGCAGGCAC | 108.06% |
| Reverse +565 | TCACCTGCCGCTTCCACTTGT | ||||
| Rpl7a | ENSRNOT00000044551.4 | Ribosomal Protein L7a | Forward +64 | GAGGCCAAAAAGGTGGTCAATCC | 105.33% |
| Reverse +127 | CCTGCCCAATGCCGAAGTTCT | ||||
| Runx1t1 | ENSRNOT00000066191.1 | RUNX1 Translocation Partner 1 | Forward +796 | TCCCACTGAGACCTTTTG | 109.60% |
| Reverse +894 | CAGGGTTCTGTTTGGCTA | ||||
| Scd | ENSRNOT00000018447.5 | Stearoyl-CoA Desaturase | Forward +942 | TCAATCTCGGGAGAACATCCTG | 109.77% |
| Reverse +1013 | AAGGCGTGATGGTAGTTGTGGA | ||||
| Scp2 | ENSRNOT00000015420.5 | Sterol Carrier Protein 2 | Forward +203 | GGCTATGTGTACGGTGAATCCA | 105.56% |
| Reverse +280 | AATGATAGGGATGCCAGTCAGC | ||||
| Skp2 | ENSRNOT00000089178.1 | S-Phase Kinase Associated Protein 2 | Forward +809 | CTGGATTTTCTGAGTCTGCC | 100.52% |
| Reverse +882 | CCAGGAGAGGTTCAGTTCAT | ||||
| Taok3 | ENSRNOT00000089043.1 | TAO Kinase 3 | Forward +403 | GCTGAAGCACCCGAACACCAT | 103.35% |
| Reverse +476 | ACTCCATCACCAACCAAGCGG | ||||
| Tgfb2 | ENSRNOT00000003313.5 | Transforming Growth Factor Beta 2 | Forward +1664 | ACAATGCTAACTTCTGTGCTGG | 91.24% |
| Reverse +1735 | TGAGGACTTTGGTGTGTTGTGT | ||||
| Traf3 | ENSRNOT00000010906.6 | TNF Receptor Associated Factor 3 | Forward +870 | CTCTTCTGAGGAGTGAGTTGA | 108.60% |
| Reverse +942 | CGCTTAAAACTACAGGTGC | ||||
| Wnt6 | ENSRNOT00000023439.6 | Wnt Family Member 6 | Forward +452 | GGGGGTTCGAGAATGTCAGTTCC | 103.79% |
| Reverse +517 | GCCTTGCTGTGACTGGAGCAGTT | ||||
| Zbtb16 | ENSRNOT00000045356.3 | Zinc Finger and BTB Domain Containing 16 | Forward +1695 | GCATTTACTGGCTCATTCAG | 100.89% |
| Reverse +1770 | ATCTTCCTTTGAGAACTGGG |
| GO Number | GO Annotation | Count | Fold Enrichment | FDR p-Value |
|---|---|---|---|---|
| Annotation Cluster 1 (Enrichment Score: 6.24) | ||||
| GO:0046872 | Metal ion binding | 111 | 1.54 | 2.37 × 10⁻⁴ |
| GO:0043167 | Ion binding | 113 | 1.52 | 1.70 × 10⁻⁴ |
| GO:0043169 | Cation binding | 111 | 1.52 | 1.61 × 10⁻⁴ |
| Annotation Cluster 2 (Enrichment Score: 5.24) | ||||
| GO:0000902 | Cell morphogenesis | 26 | 3.02 | 0.0013 |
| GO:0032989 | Cellular component morphogenesis | 26 | 2.73 | 0.0045 |
| GO:0000904 | Cell morphogenesis involved in differentiation | 20 | 3.27 | 0.0046 |
| Annotation Cluster 3 (Enrichment Score: 4.57) | ||||
| GO:0005216 | Ion channel activity | 24 | 2.83 | 0.0016 |
| GO:0005261 | Cation channel activity | 20 | 3.18 | 0.0017 |
| GO:0022838 | Substrate specific channel activity | 24 | 2.75 | 0.0018 |
| GO:0015267 | Channel activity | 24 | 2.65 | 0.0028 |
| GO:0022803 | Passive transmembrane transporter activity | 24 | 2.65 | 0.0028 |
| GO:0022836 | Gated channel activity | 20 | 2.95 | 0.0033 |
| Annotation Cluster 4 (Enrichment Score: 4.18) | ||||
| GO:0048667 | Cell morphogenesis involved in neuron differentiation | 19 | 3.63 | 0.0029 |
| GO:0000904 | Cell morphogenesis involved in differentiation | 20 | 3.27 | 0.0046 |
| GO:0007409 | Axonogenesis | 17 | 3.61 | 0.0056 |
| GO:0048666 | Neuron development | 23 | 2.62 | 0.014 |
| GO:0048812 | Neuron projection morphogenesis | 17 | 3.12 | 0.021 |
| GO:0031175 | Neuron projection development | 19 | 2.75 | 0.034 |
| GO:0048858 | Cell projection morphogenesis | 17 | 2.82 | 0.045 |
| GO:0032990 | Cell part morphogenesis | 17 | 2.71 | 0.066 |
| Annotation Cluster 5 (Enrichment Score: 4.08) | ||||
| GO:0022836 | Gated channel activity | 20 | 2.95 | 0.0033 |
| GO:0005244 | Voltage-gated ion channel activity | 15 | 3.47 | 0.0062 |
| GO:0022832 | Voltage-gated channel activity | 15 | 3.47 | 0.0062 |
| Annotation Cluster 6 (Enrichment Score: 3.45) | ||||
| GO:0051960 | Regulation of nervous system development | 17 | 2.95 | 0.036 |
| GO:0060284 | Regulation of cell development | 17 | 2.87 | 0.044 |
| GO:0045664 | Regulation of neuron differentiation | 14 | 3.31 | 0.042 |
| GO:0050767 | Regulation of neurogenesis | 15 | 2.86 | 0.086 |
| Gene | Function | Chromosome | Location | Genomic Feature | HF MeDIP | LF MeDIP | HF MRE | LF MRE | Conservation |
|---|---|---|---|---|---|---|---|---|---|
| ACVR1C | Cancer | 3 | 40041000–40041500 | Intron 3/8 | 2.33 (0.89) | 2.58 (1.02) | 1.64 (0) | 0 | 0.0040 (0.016) |
| CACNG2 | Cancer | 7 | 116000000–116000500 | Intron 1/3 | 8.27 (3.47) | 12.26 (4.78) | 0.74 (0.42) | 0.31 (0.24) | 0.77 (0.36) |
| CACNG8 | Cancer | 1 | 64069000–64069500 | Exon 4/4 | 2.56 (1.15) | 2.00 (0.82) | 0.27 (0) | 6.07 (0) | 0.18 (0.34) |
| DAPK3 | Cancer | 7 | 10009000–10009500 | Exon 7/9 | 12.89 (6.18) | 18.09 (10.40) | 1.10 (0.68) | 0.14 (0) | 0.38 (0.45) |
| DCC | Cancer | 18 | 69043500–69044000 | Intron 1/28 | 8.56 (3.39) | 21.00 (9.64) | 3.68 (1.51) | 2.16 (1.46) | 0.0054 (0.0087) |
| FLNB | Cancer | 15 | 19052000–19052500 | Intron 1/44 | 4.89 (2.41) | 5.98 (2.59) | 2.06 (2.03) | 0.51 (0.58) | 0.014 (0.017) |
| FZD2 | Cancer | 10 | 91707500–91708000 | Promoter | 6.27 (3.41) | 1.40 (0.55) | 0.27 (0.21) | 0.95 (0.71) | 0.061 (0.094) |
| IGF1R | Cancer | 1 | 122713500–122714000 | Intron 1/20 | 4.31 (1.20) | 3.10 (1.81) | 0.71 (0) | 1.39 (0.99) | 0.0057 (0.011) |
| IL1R1 | Cancer | 9 | 39589500–39590000 | Intron 1/10 | 7.39 (4.28) | 4.33 (1.62) | 0.12 (0) | 1.00 (0.93) | 0.0053 (0.0099) |
| MAP3K5 | Cancer | 1 | 15307000–15307500 | Intron 8/12 | 1.88 (0.83) | 4.86 (2.15) | 7.37 (0) | 1.13 (0) | 0.018 (0.050) |
| MSH3 | Cancer | 2 | 22480500–22481000 | Intron 20/23 | 10.93 (4.44) | 4.08 (2.34) | 0.42 (0.42) | 1.60 (0.93) | 0.0050 (0.014) |
| NCOA4 | Cancer | 16 | 7641000–7641500 | Promoter | 12.59 (3.16) | 5.25 (2.38) | 0.27 (0.085) | 1.10 (0.84) | 0.0026 (0.0036) |
| NFATC2 | Cancer | 3 | 159682000–159682500 | Intron 8/9 | 10.58 (5.74) | 3.06 (1.24) | 1.07 (0) | 1.73 (2.32) | 0.015 (0.0038) |
| NTRK2 | Cancer | 17 | 11700500–11701500 | Intron 12/13 | 7.81 (3.75) | 17.72 (8.57) | 4.31 (3.07) | 1.21 (1.92) | 0.28 (0.41) |
| RASGRP2 | Cancer | 1 | 209198000–209198500 | Intron 15/16 | 4.29 (2.91) | 6.10 (4.07) | 0.85 (0.14) | 0.19 (0) | 0.22 (0.33) |
| RUNX1T1 | Cancer | 5 | 28230500–28231000 | Exon 1/11 | 2.63 (1.09) | 1.00 (0) | 1.70 (1.81) | 8.70 (11.88) | 0.31 (0.43) |
| SKP2 | Cancer | 2 | 58774500–58775000 | Exon 8/10 | 8.21 (4.43) | 17.98 (10.69) | 0.93 (1.08) | 0 | 0.13 (0.30) |
| TAOK3 | Cancer | 12 | 40571000–40571500 | Intron 5/19 | 12.23 (7.54) | 7.64 (3.88) | 1.51 (2.00) | 4.16 (5.87) | 0.23 (0.41) |
| TGFB2 | Cancer | 13 | 102723000–102723500 | Intron 6/7 | 10.45 (6.36) | 4.61 (2.68) | 0.24 (0) | 3.47 (0.13) | 0.39 (0.47) |
| TRAF3 | Cancer | 6 | 135924000–135924500 | Promoter | 5.27 (2.45) | 1.50 (0.71) | 0.47 (0.57) | 10.45 (21.93) | 0.036 (0.073) |
| WNT6 | Cancer | 9 | 74115500–74117500 | Intron 3/3 | 8.30 (6.35) | 15.22 (7.88) | 3.40 (4.52) | 3.54 (5.89) | 0.26 (0.43) |
| ZBTB16 | Cancer | 8 | 52035000–52036000 | Intron 2/6 | 5.24 (2.69) | 7.58 (2.93) | 4.00 (0.63) | 0.70 (0.30) | 0.45 (0.49) |
| FOXO1 | Cancer/Metabolism | 2 | 141195500–141196000 | Intron 1/2 | 4.84 (2.03) | 1.33 (0.58) | 0.18 (0.084) | 1.31 (0.27) | 0.013 (0.026) |
| MAPK3 | Cancer/Metabolism | 1 | 185936000–185936500 | Exon 2/10 | 7.00 (3.22) | 13.88 (6.77) | 8.62 (0) | 2.72 (0) | 0.74 (0.39) |
| MKNK2 | Cancer/Metabolism | 7 | 10559000–10559500 | Exon 14/14 | 8.85 (3.70) | 14.22 (6.72) | 3.20 (2.54) | 0.98 (0.97) | 0.32 (0.42) |
| ACACB | Metabolism | 12 | 43424500–43425000 | Intron 30/58 | 4.67 (2.22) | 5.63 (2.80) | 9.21 (0.59) | 3.01 (1.59) | 0.0020 (0.0041) |
| ACOX3 | Metabolism | 14 | 80781000–80781500 | Intron 13/19 | 15.48 (9.69) | 3.00 (1.58) | 0 | 0 | 0.0047 (0.016) |
| FADS2 | Metabolism | 1 | 212532500–212533000 | Intron 4/10 | 7.83 (3.78) | 12.44 (4.55) | 1.67 (1.44) | 0.87 (0.92) | 0.27 (0.44) |
| IRS2 | Metabolism | 16 | 83384000–83384500 | Intron 1/1 | 9.39 (4.22) | 1.67 (0.71) | 0.24 (0.17) | 2.82 (0.27) | 0.00077 (0.0032) |
| PHKB | Metabolism | 19 | 22453500–22454000 | Intron 13/29 | 4.43 (2.08) | 11.92 (5.76) | 0.91 (0.18) | 0.19 (0) | 0.038 (0.12) |
| PPP1R3B | Metabolism | 16 | 60562000–60562500 | Intron 1/1 | 4.08 (2.56) | 1.00 (0) | 0.49 (0) | 6.85 (0) | 0.026 (0.076) |
| SCD1 | Metabolism | 1 | 249463500–249464000 | Intron 5/5 | 10.82 (4.11) | 16.68 (5.85) | 1.89 (1.58) | 0.47 (0.40) | 0.012 (0.037) |
© 2019 by the authors. Licensee MDPI, Basel, Switzerland. This article is an open access article distributed under the terms and conditions of the Creative Commons Attribution (CC BY) license (http://creativecommons.org/licenses/by/4.0/).
Share and Cite
Moody, L.; Shao, J.; Chen, H.; Pan, Y.-X. Maternal Low-Fat Diet Programs the Hepatic Epigenome despite Exposure to an Obesogenic Postnatal Diet. Nutrients 2019, 11, 2075. https://doi.org/10.3390/nu11092075
Moody L, Shao J, Chen H, Pan Y-X. Maternal Low-Fat Diet Programs the Hepatic Epigenome despite Exposure to an Obesogenic Postnatal Diet. Nutrients. 2019; 11(9):2075. https://doi.org/10.3390/nu11092075
Chicago/Turabian StyleMoody, Laura, Justin Shao, Hong Chen, and Yuan-Xiang Pan. 2019. "Maternal Low-Fat Diet Programs the Hepatic Epigenome despite Exposure to an Obesogenic Postnatal Diet" Nutrients 11, no. 9: 2075. https://doi.org/10.3390/nu11092075
APA StyleMoody, L., Shao, J., Chen, H., & Pan, Y.-X. (2019). Maternal Low-Fat Diet Programs the Hepatic Epigenome despite Exposure to an Obesogenic Postnatal Diet. Nutrients, 11(9), 2075. https://doi.org/10.3390/nu11092075