Determination of Urinary Caffeine Metabolites as Biomarkers for Drug Metabolic Enzyme Activities

 and
and 
Abstract
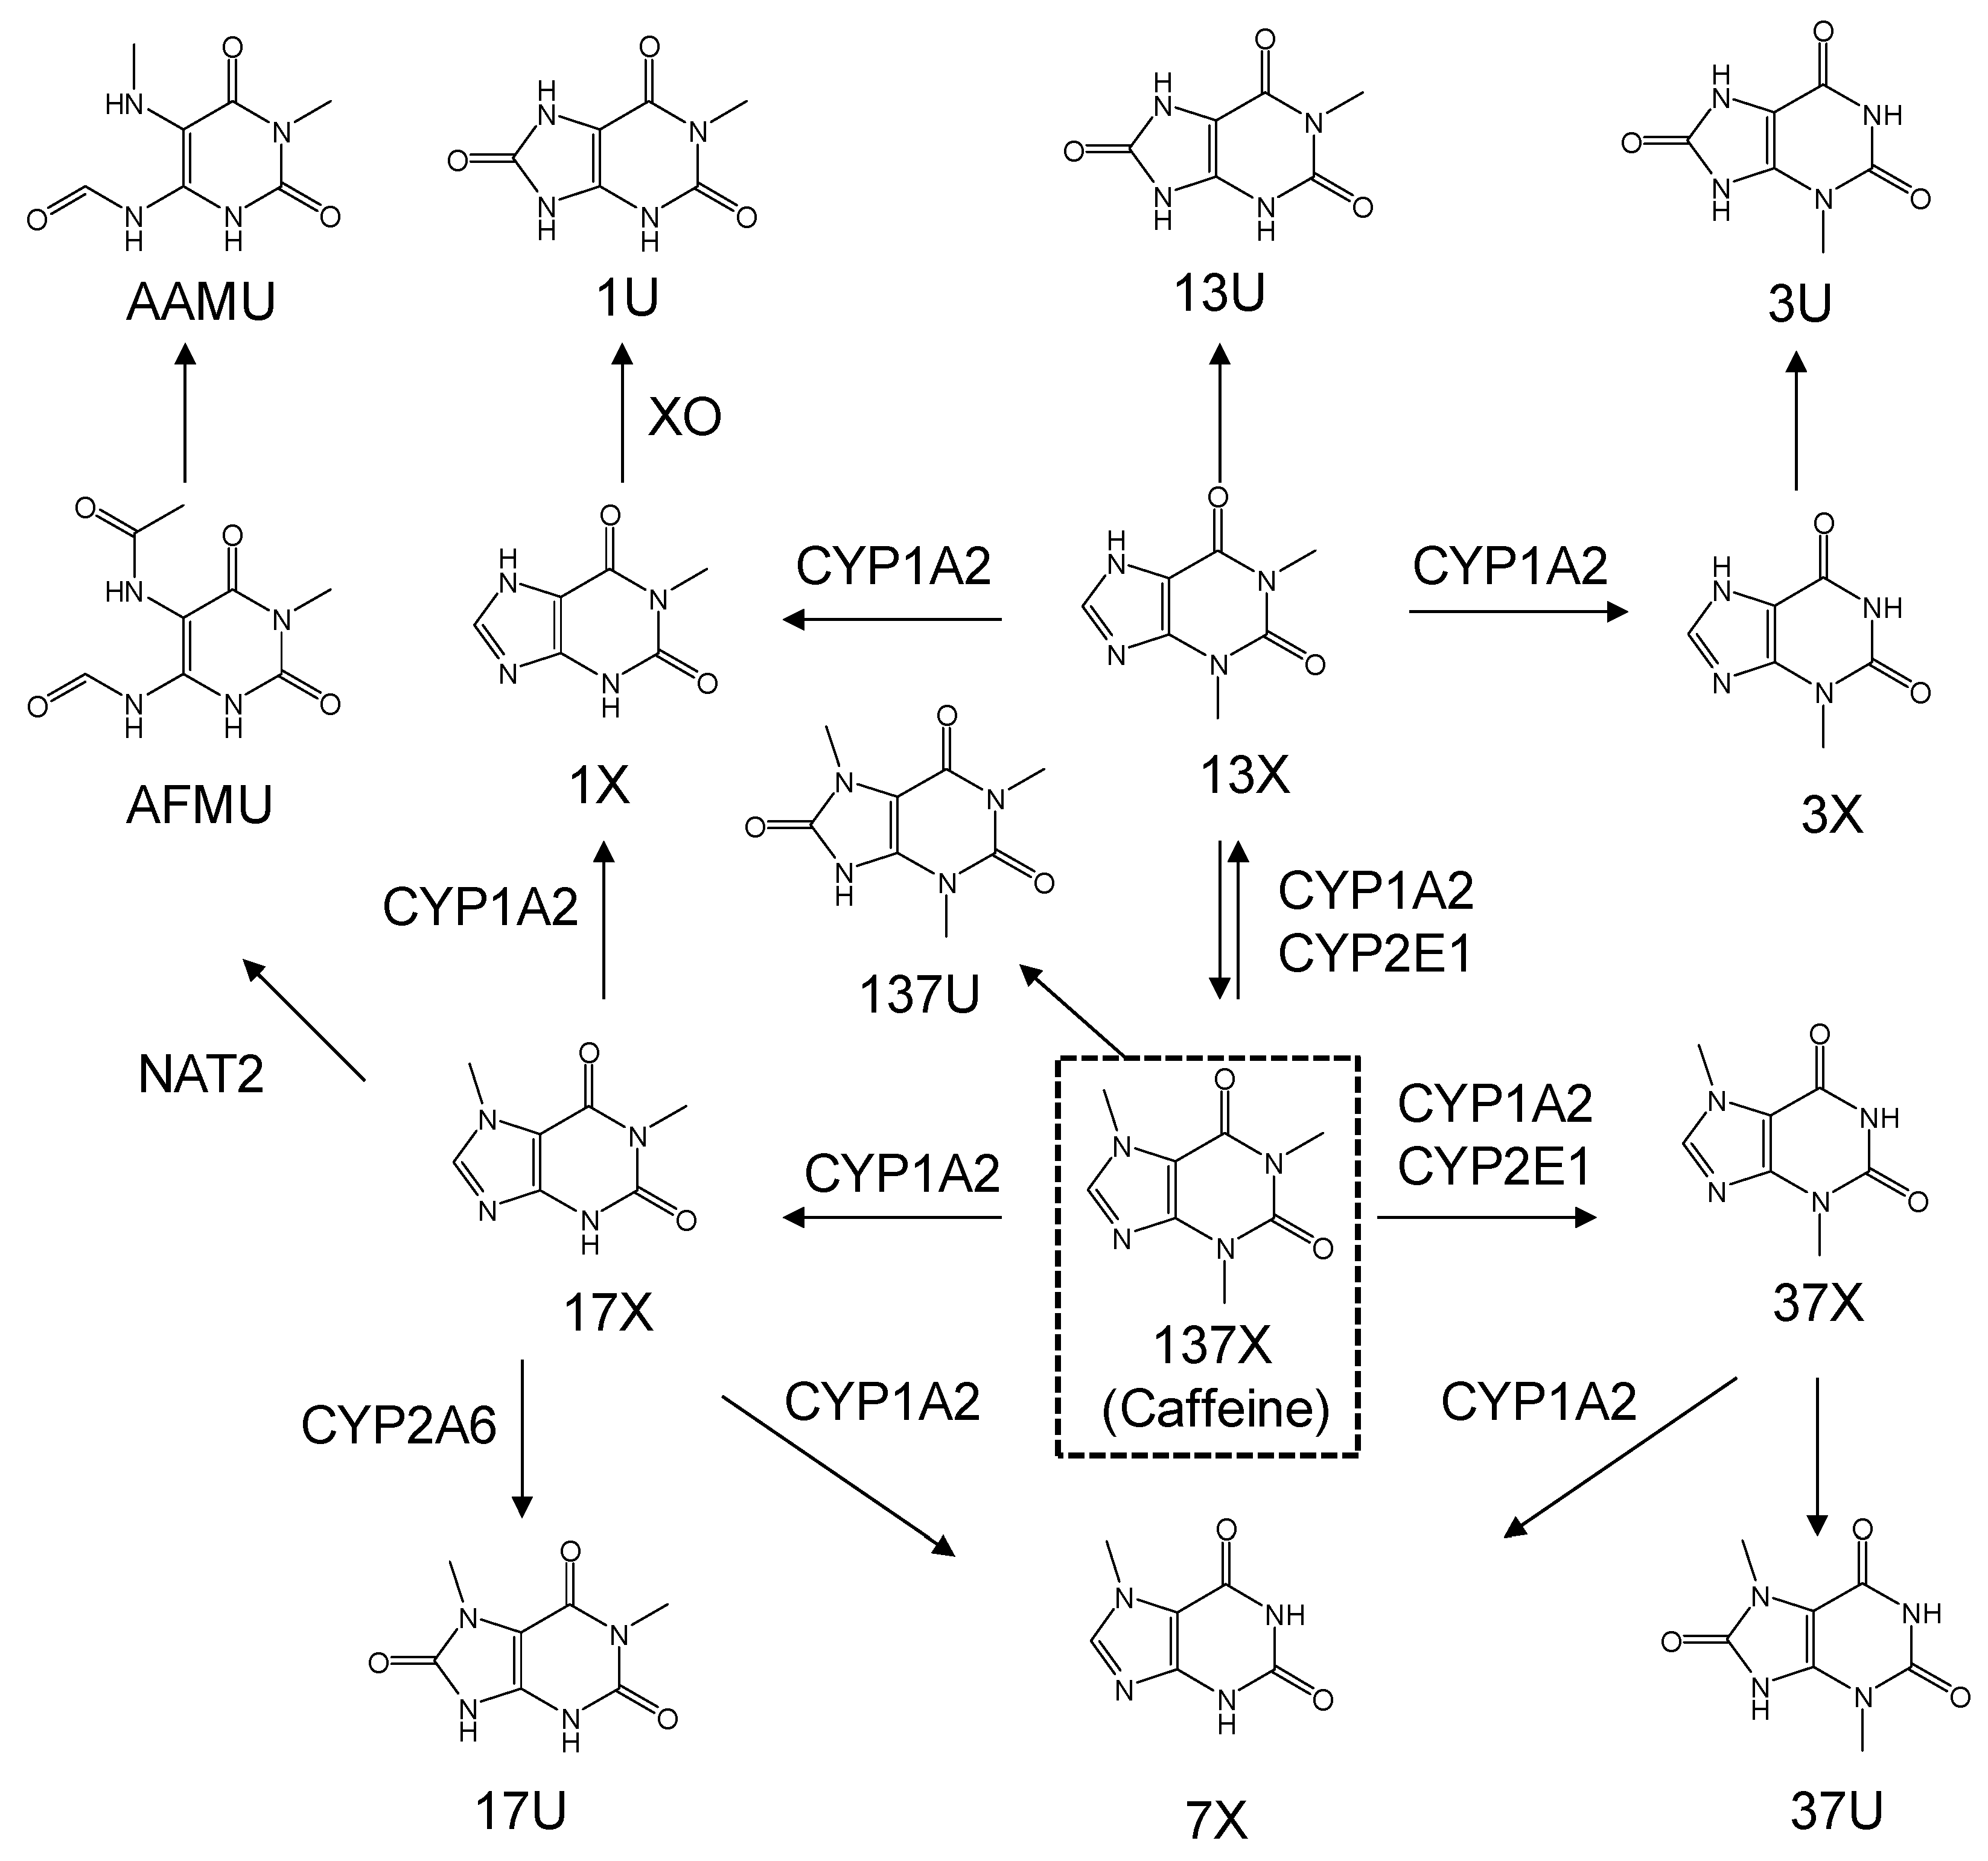
1. Introduction
2. Materials and Methods
2.1. Chemicals and Reagents
2.2. Human Urine Specimens
2.3. Urine Sample Preparation and Standard Samples
2.4. Method Validation
2.4.1. Selectivity, Linearity, and LLOQ
2.4.2. Precision and Accuracy
2.4.3. Matrix Effect and Recovery
2.4.4. Stability
2.5. LC-MS/MS Analysis
2.6. Metabolic Ratio Calculation
3. Results
3.1. LC-MS/MS
3.2. Method Validation
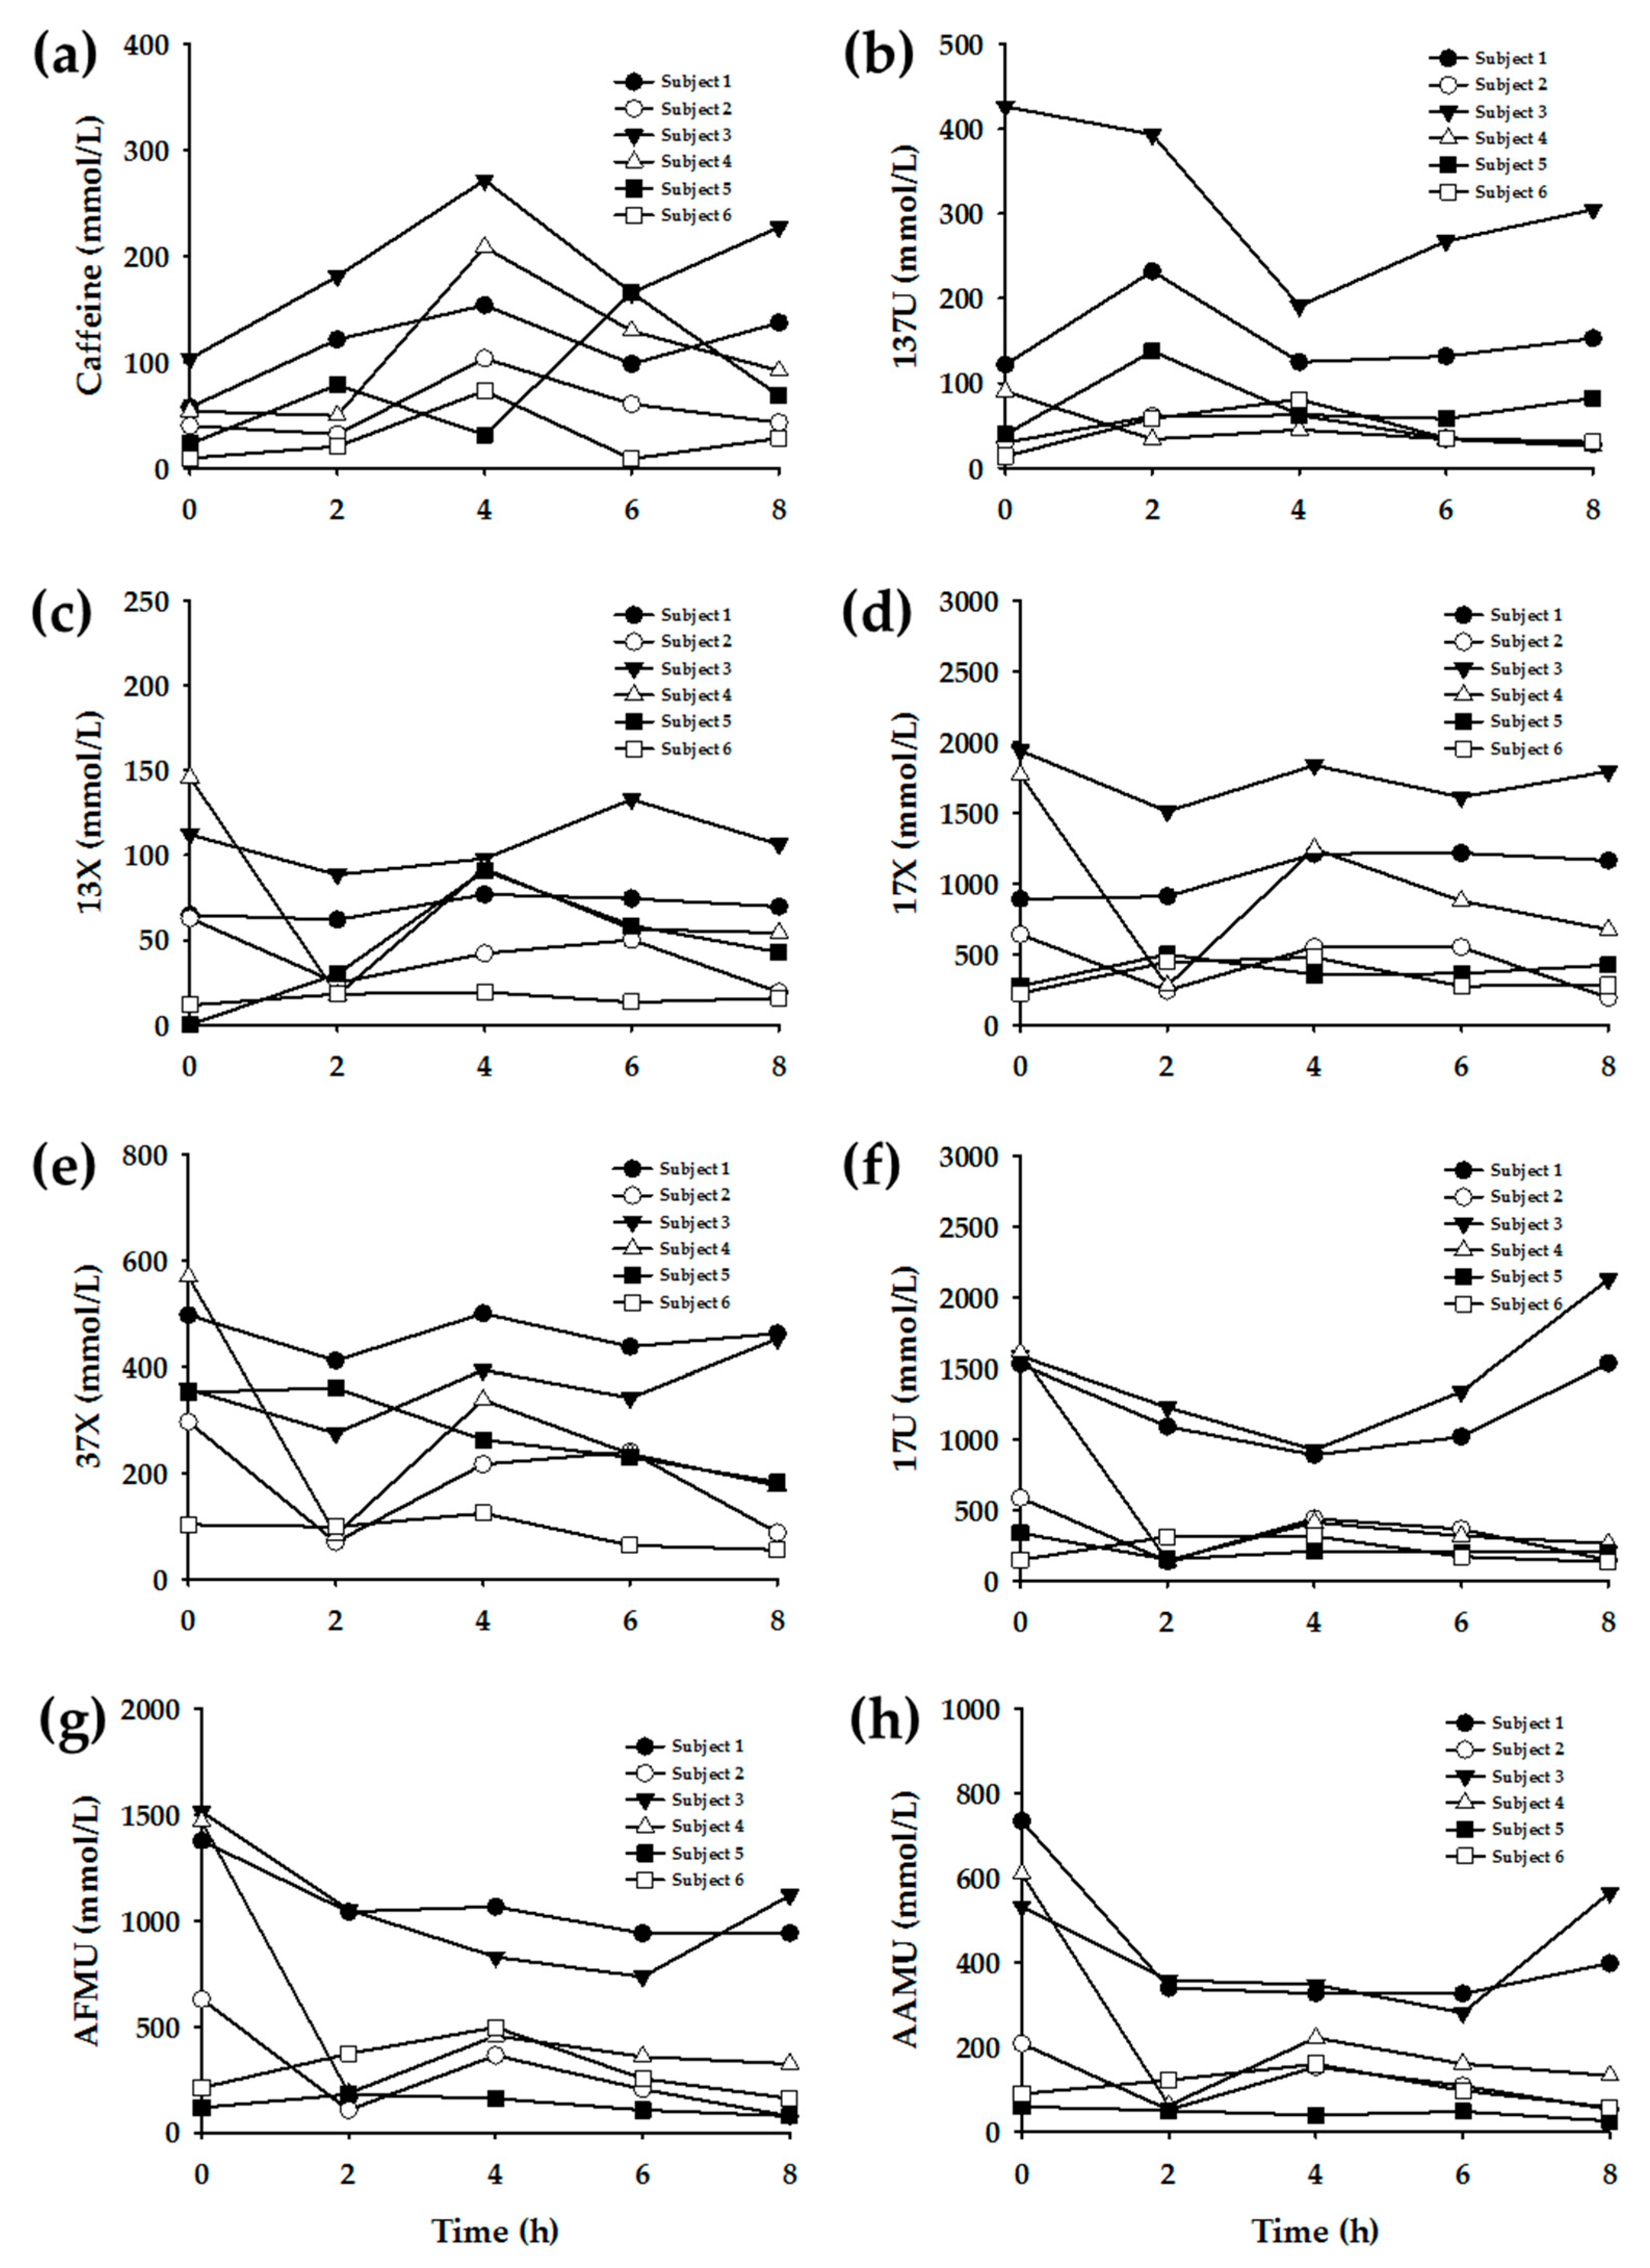
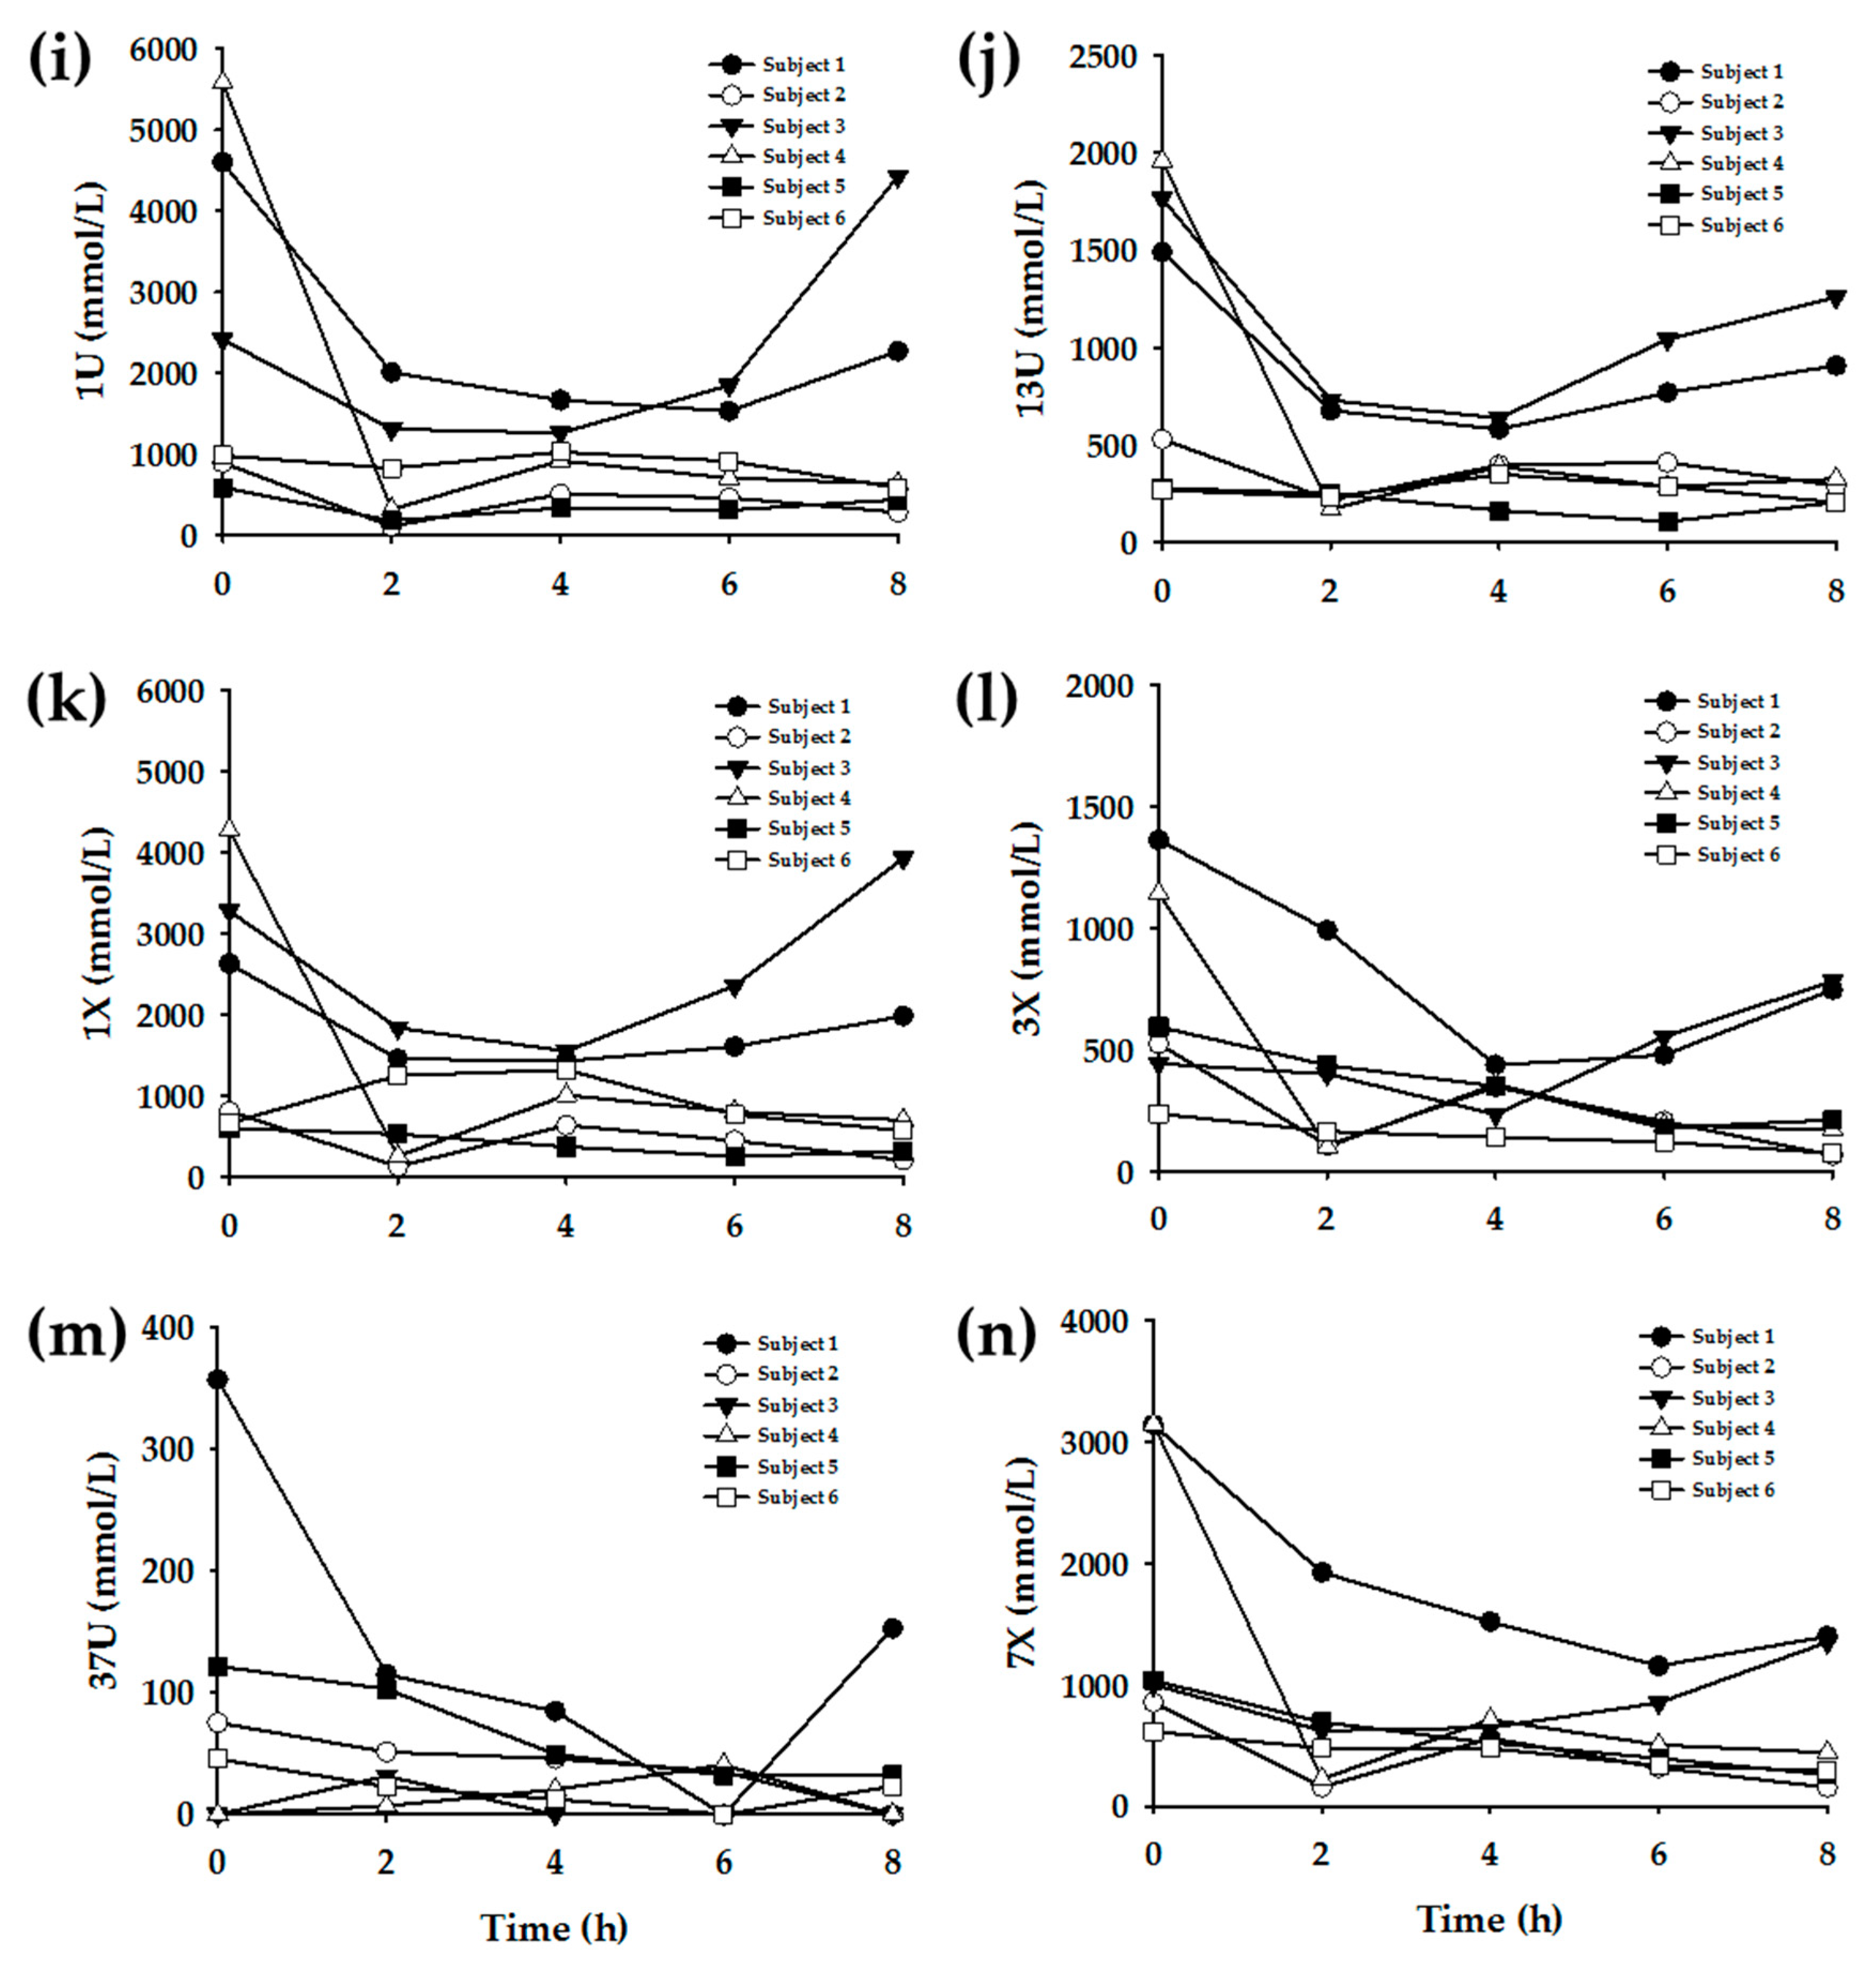
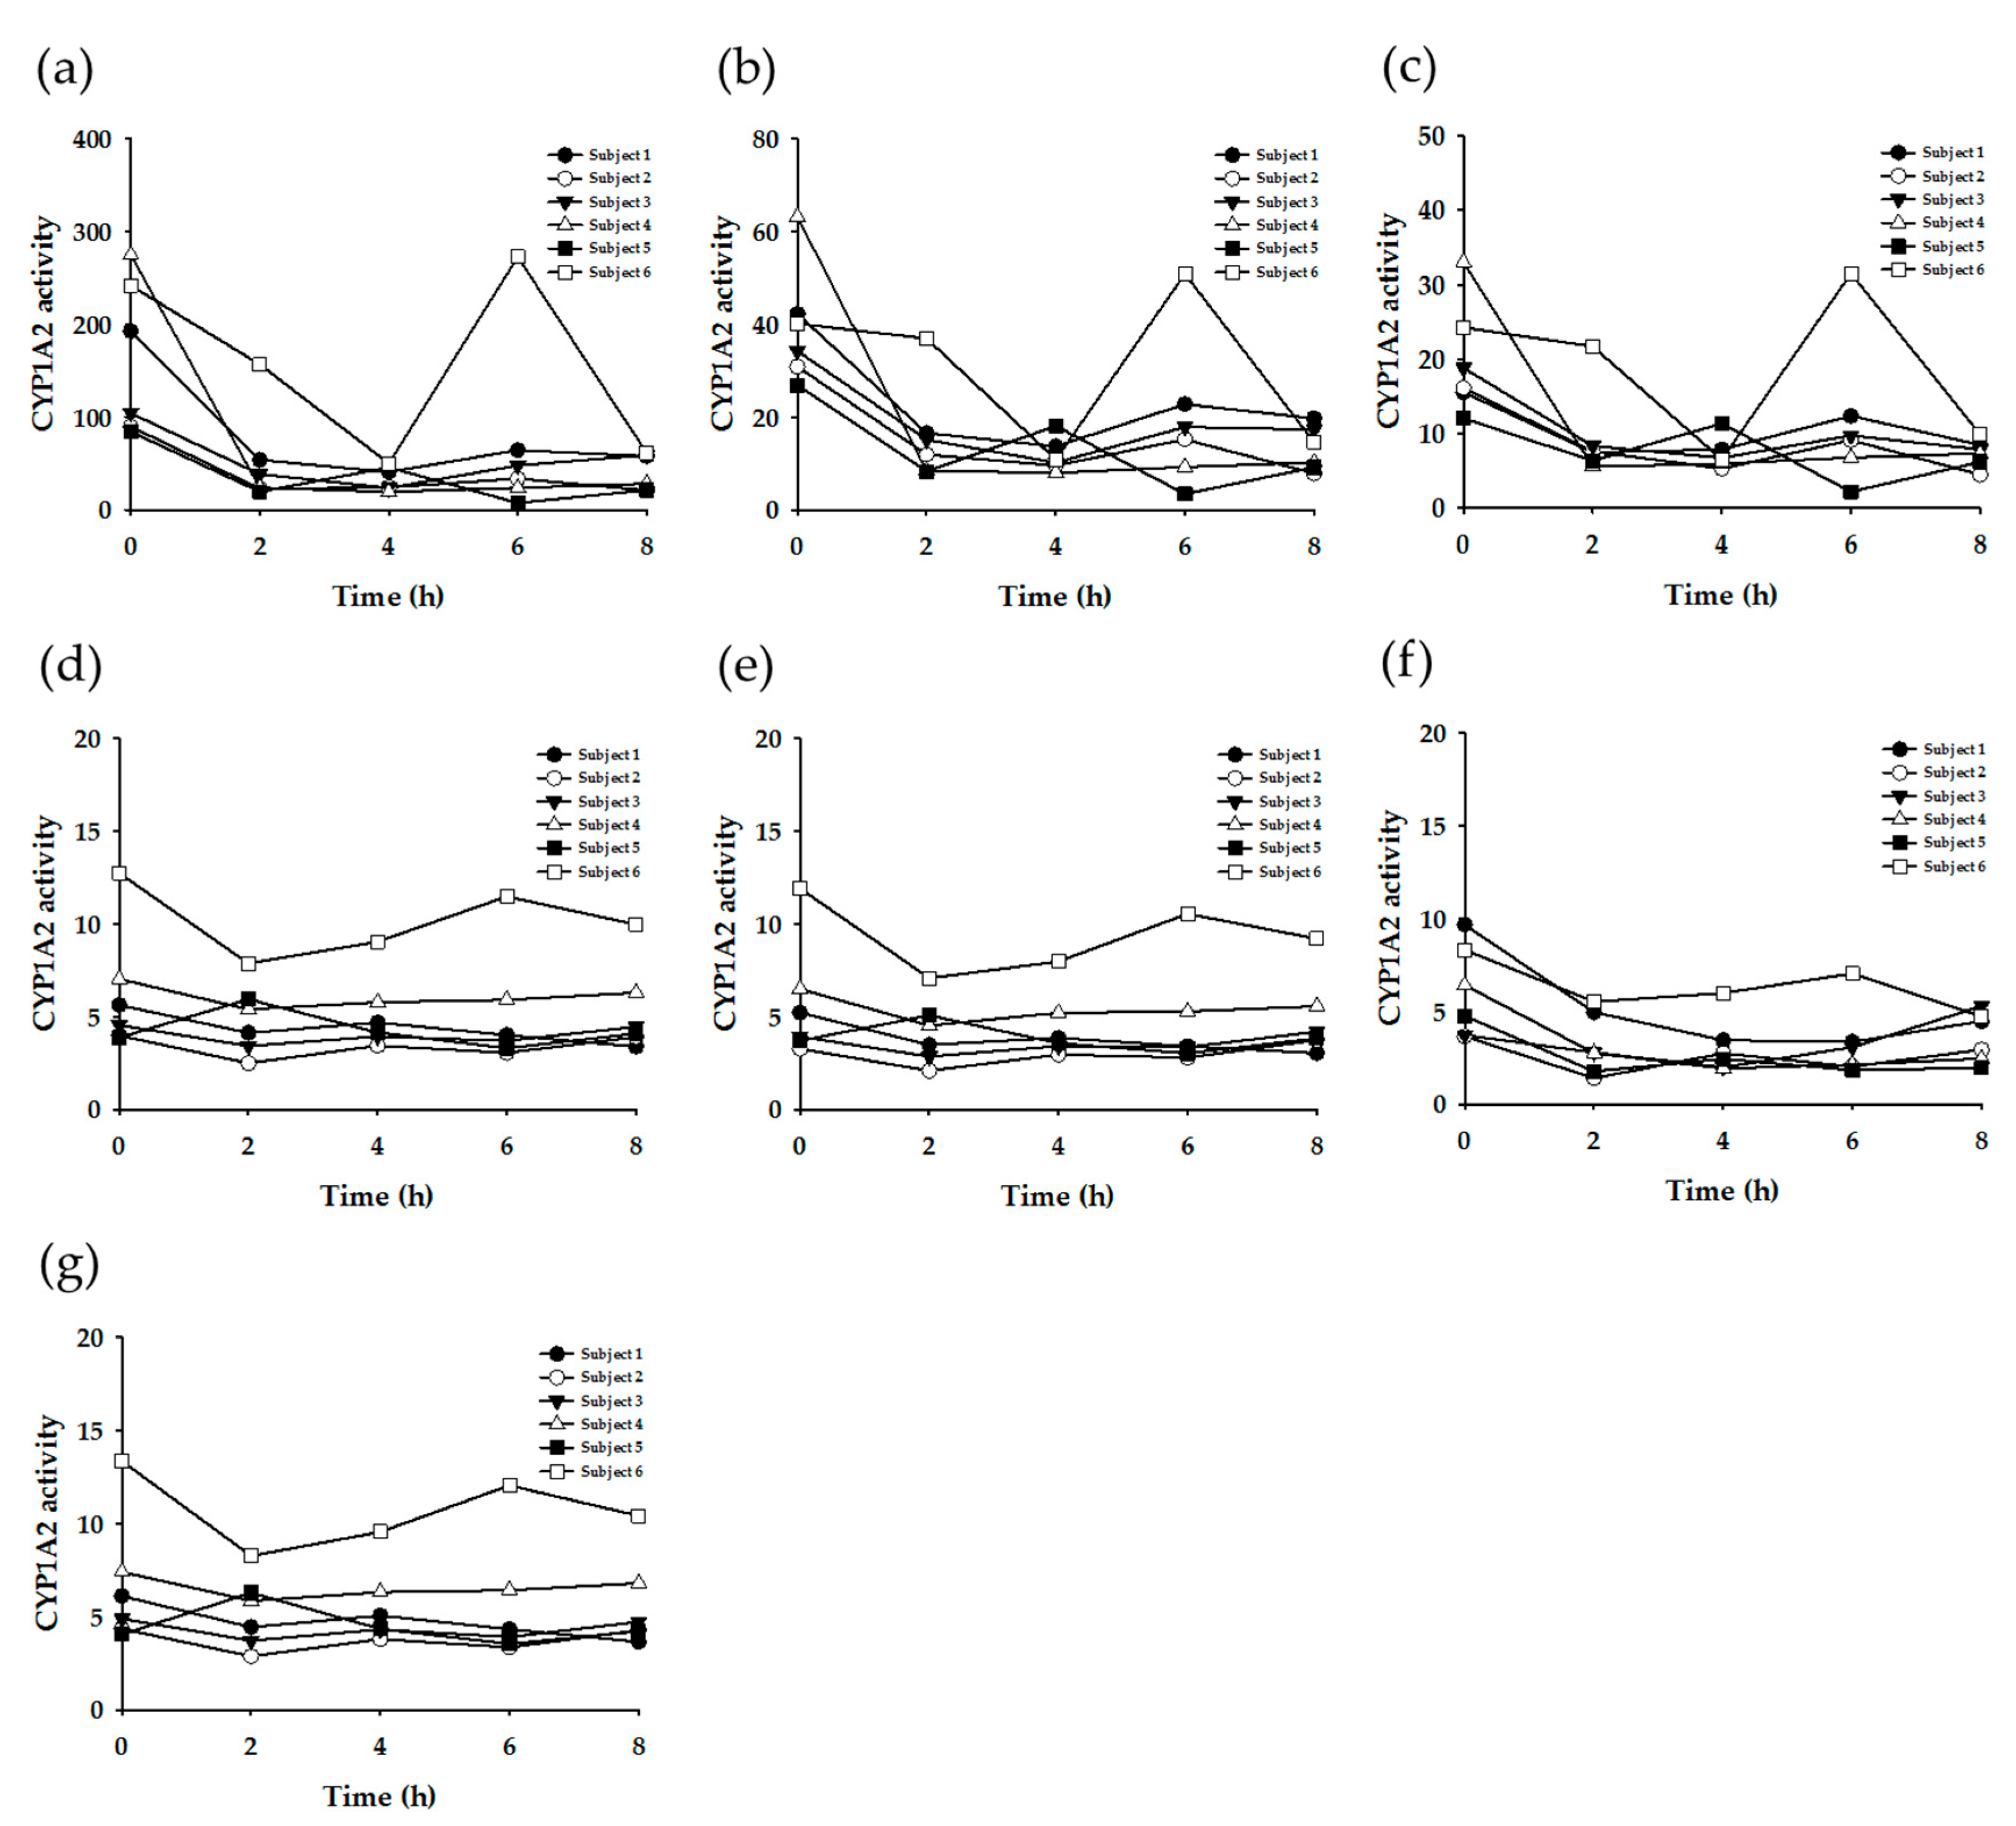
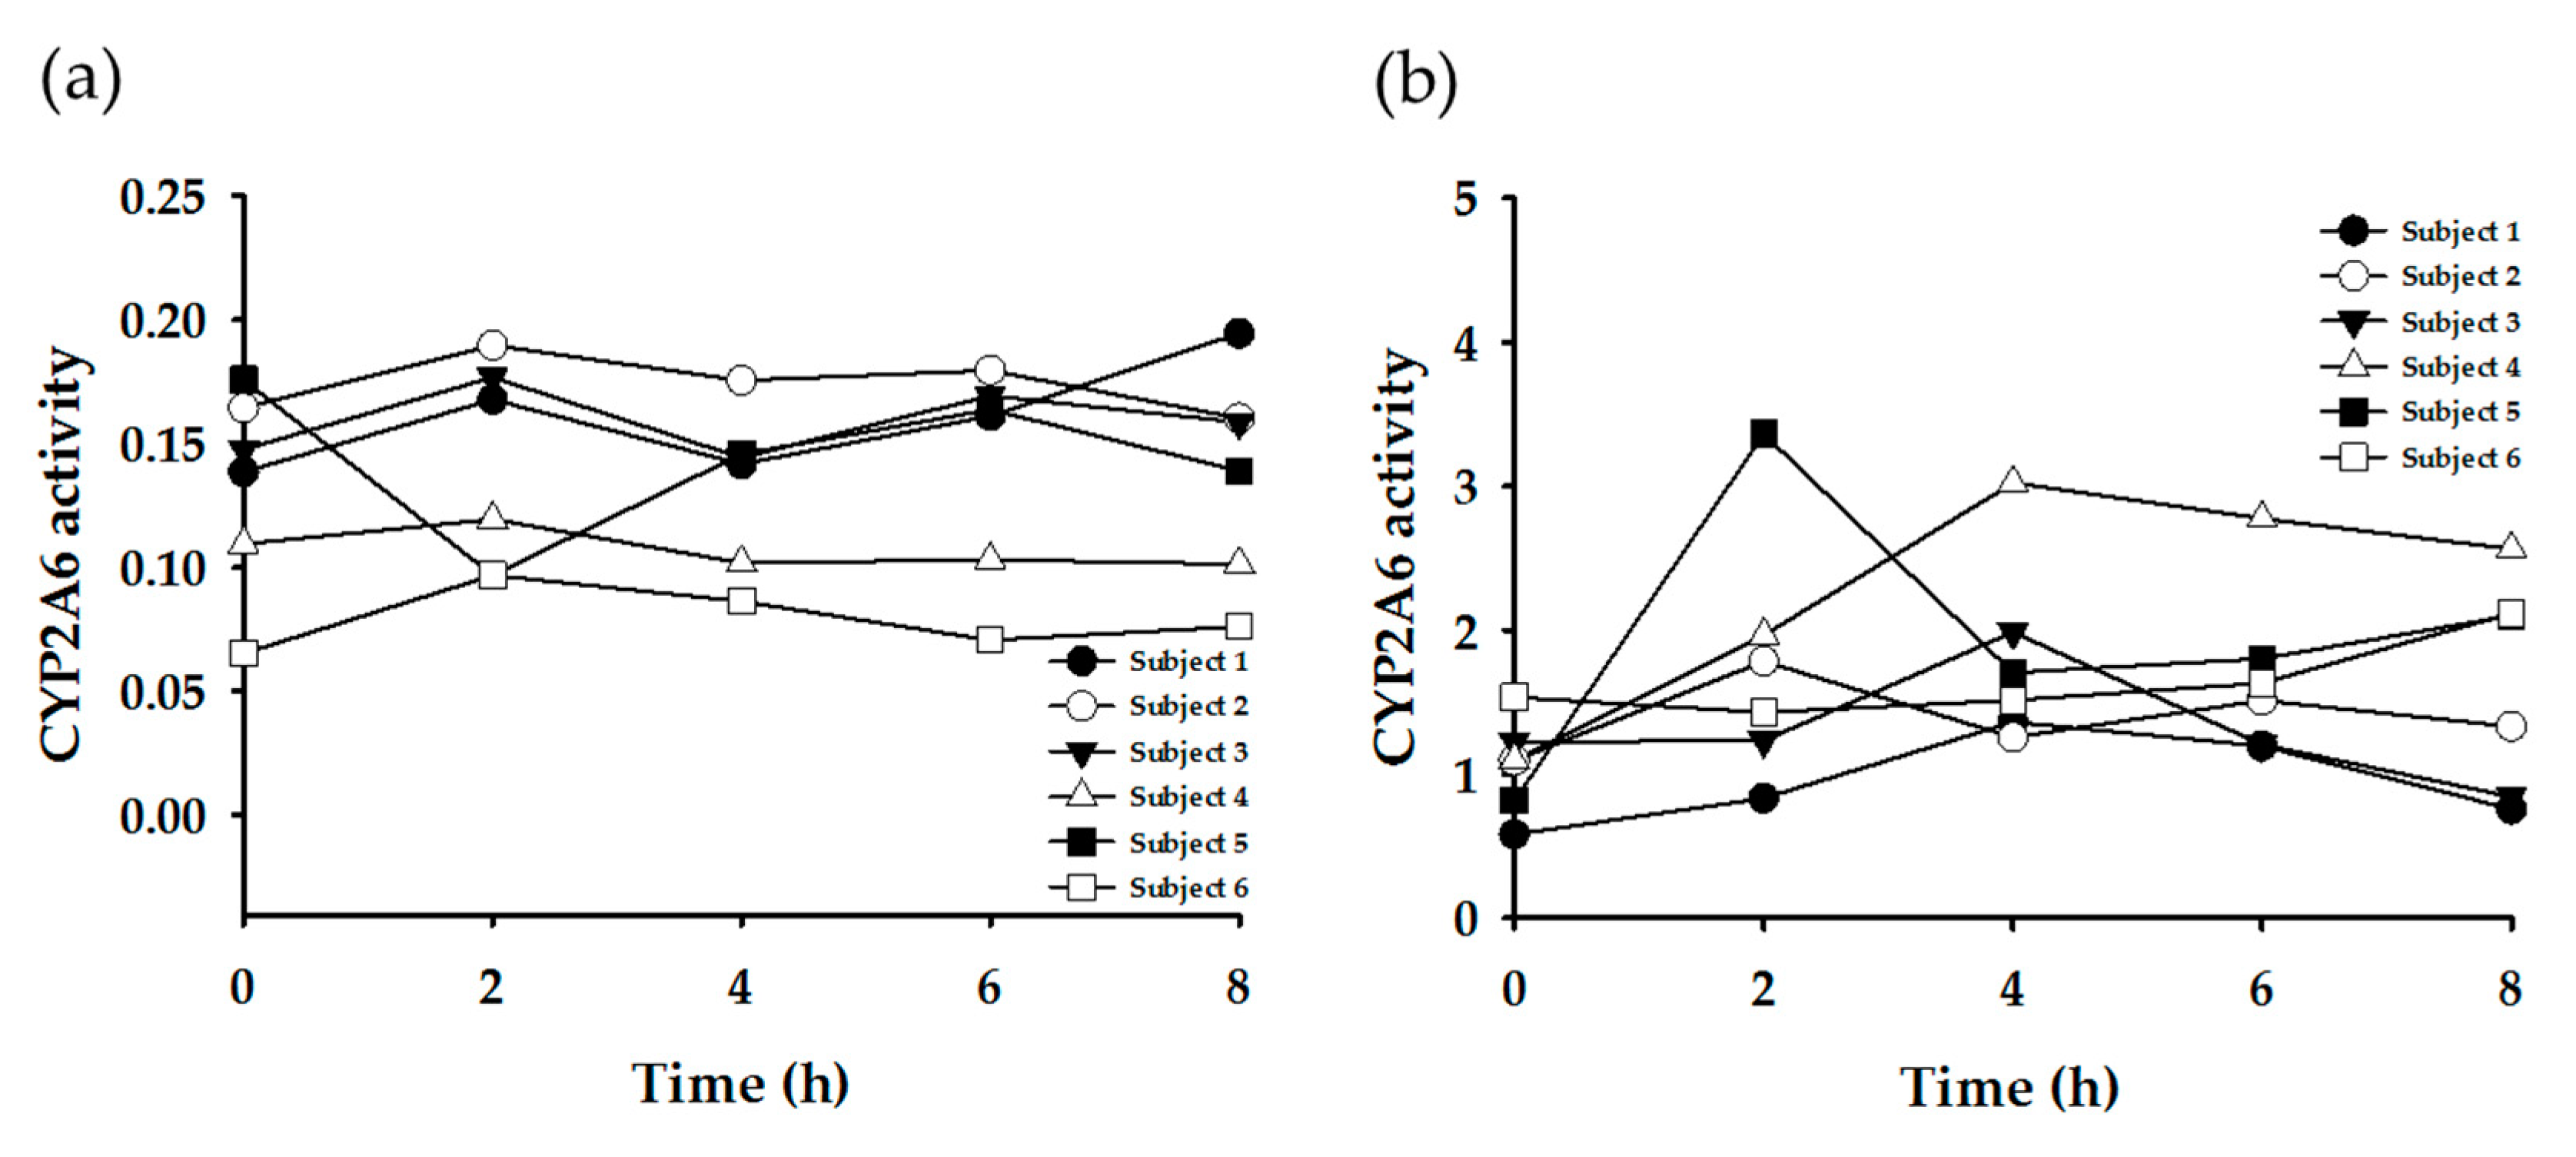
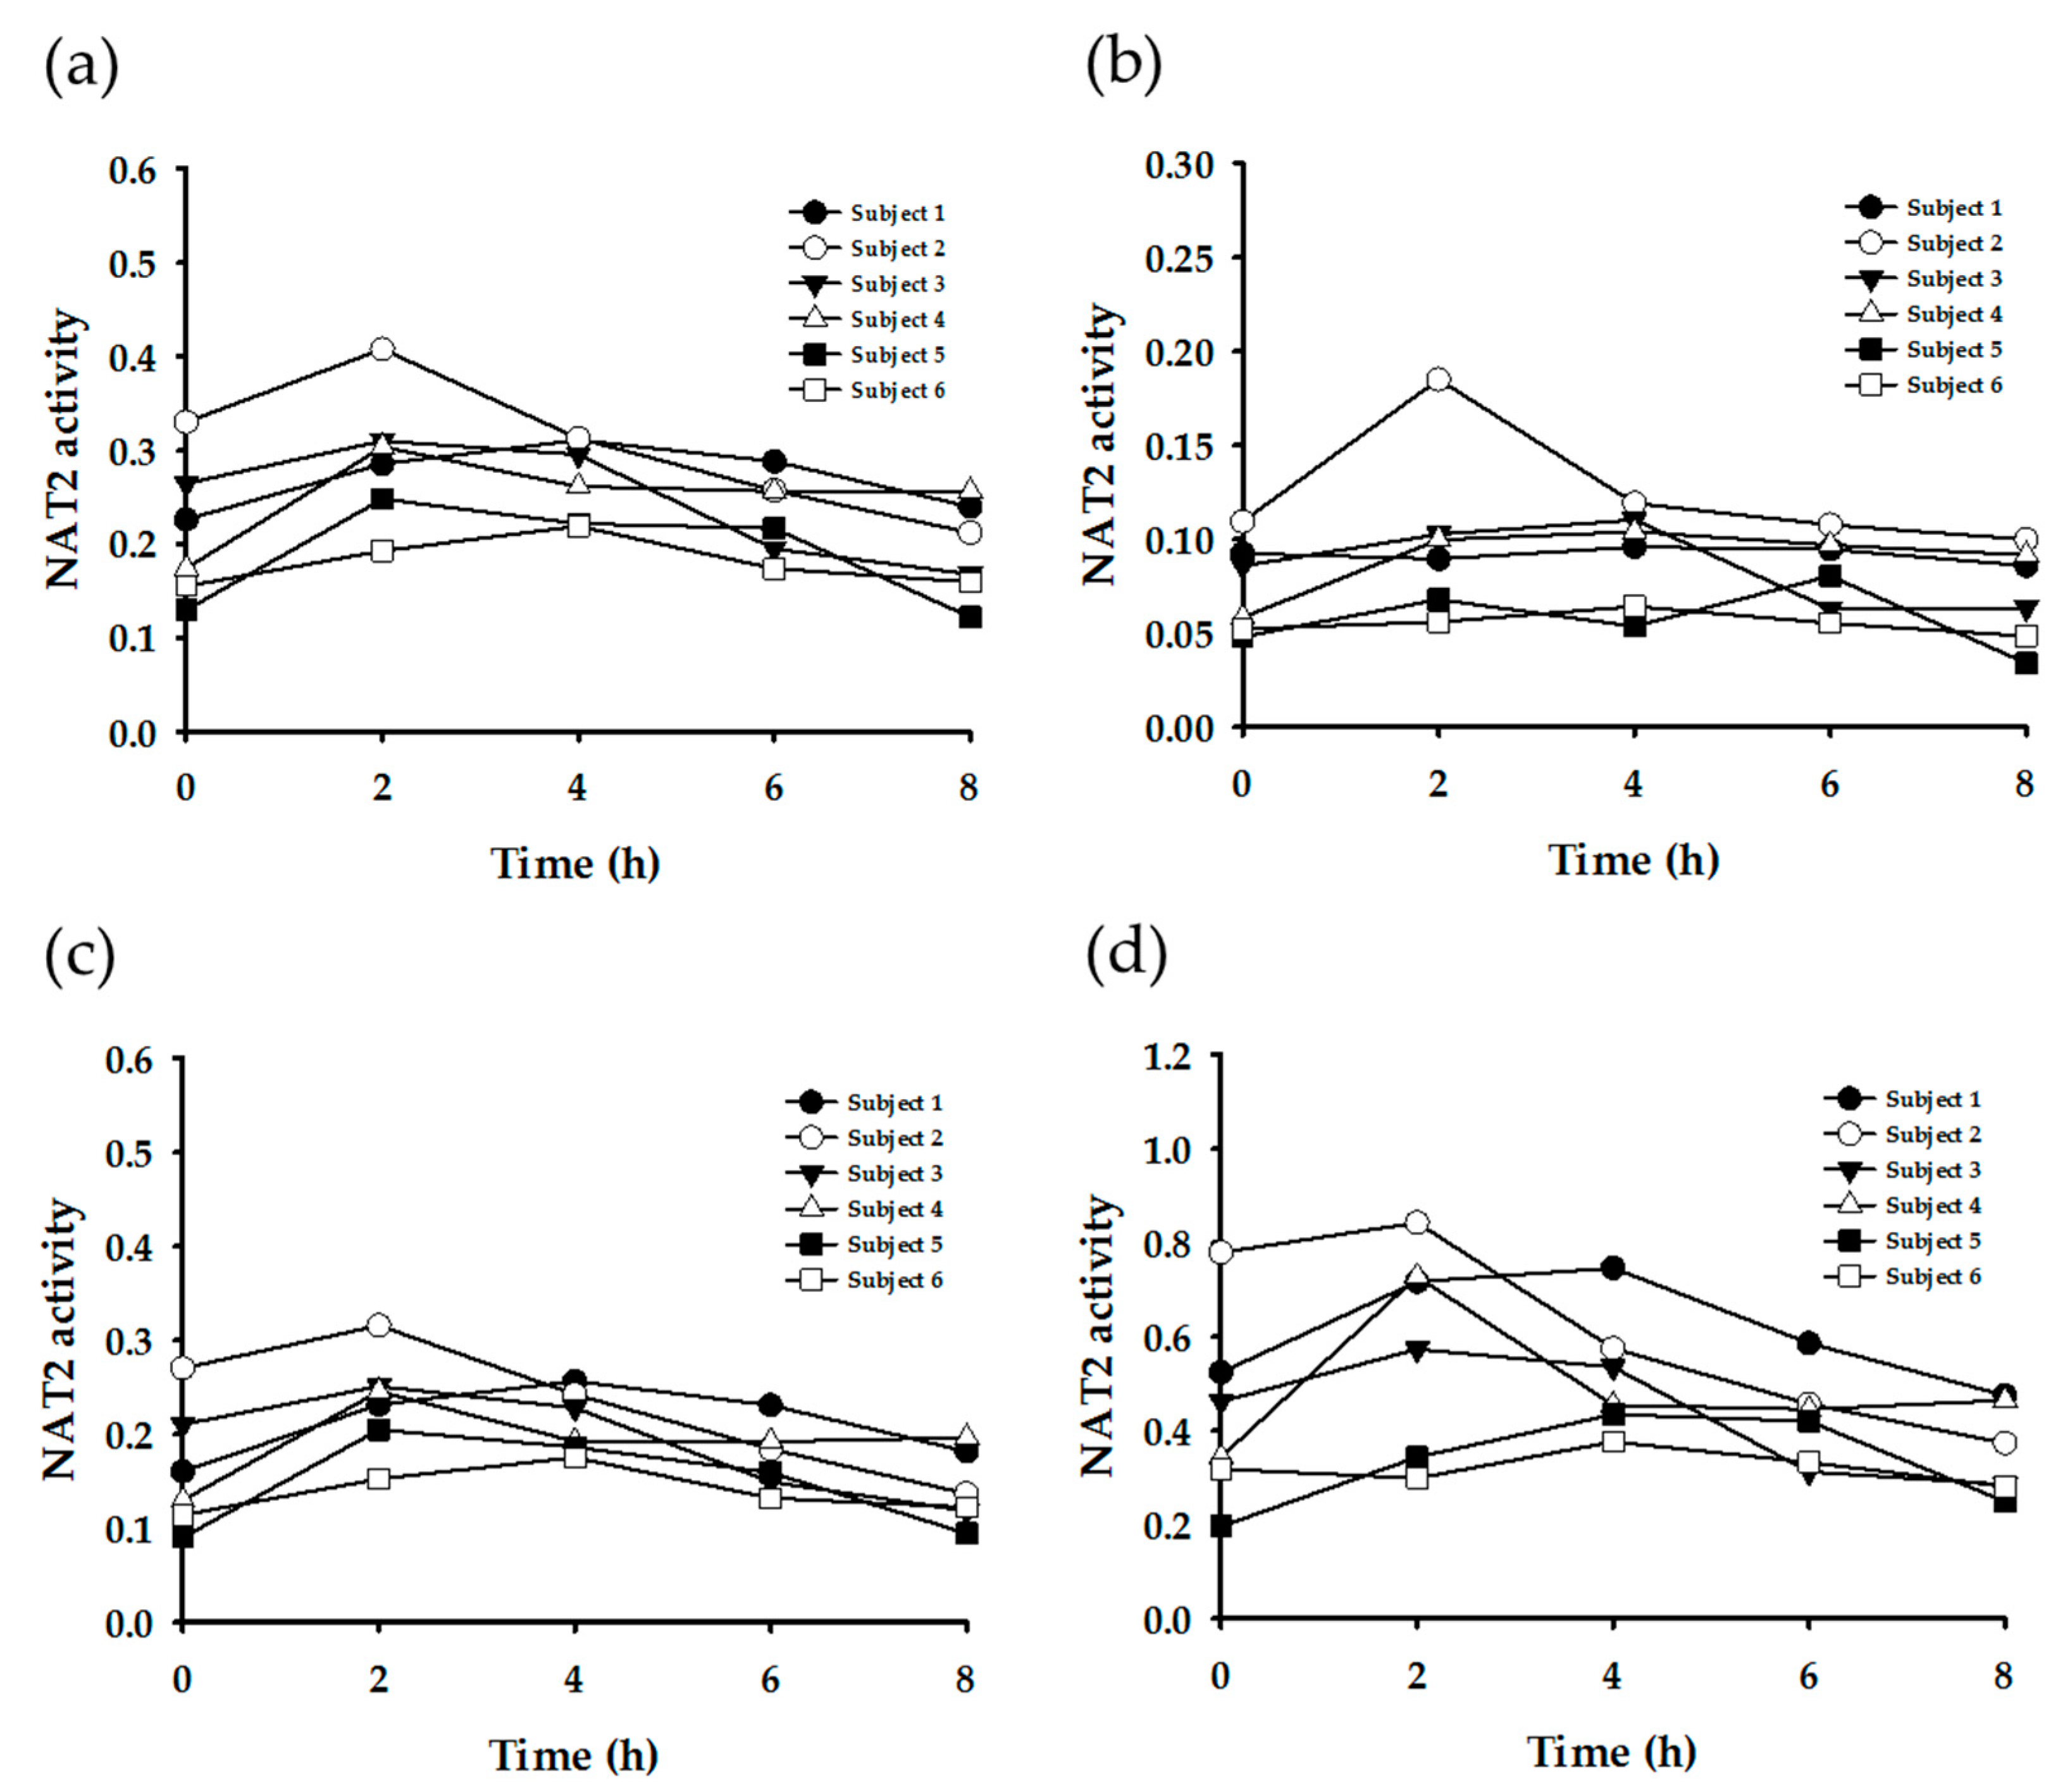
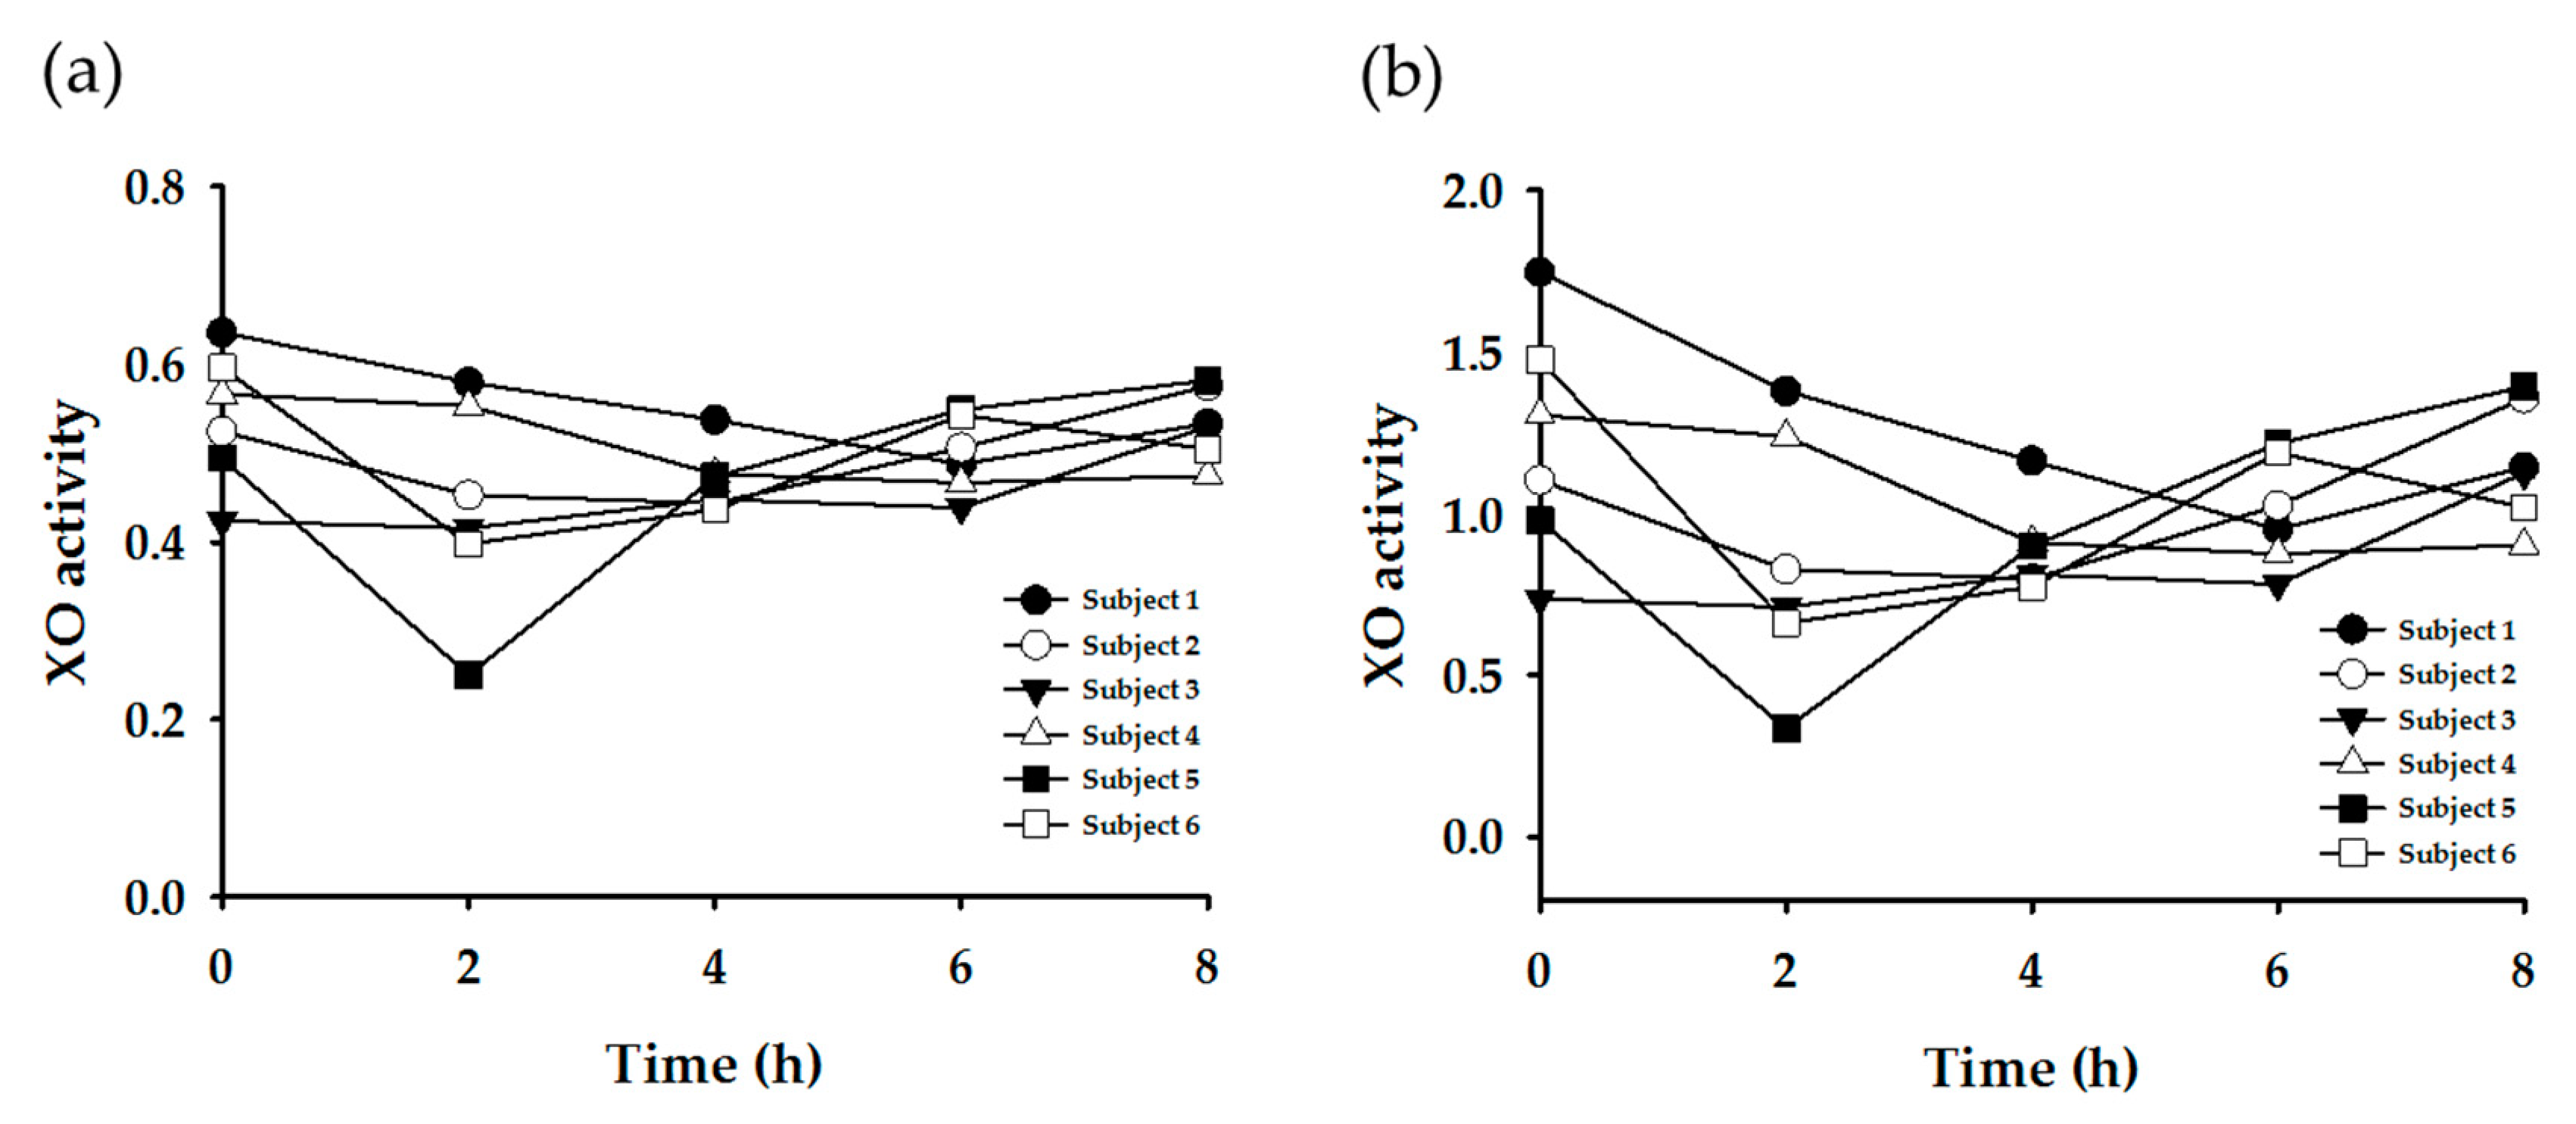
3.3. Enzyme Phenotyping Based on Urinary Caffeine Metabolite Ratio
4. Discussion
5. Conclusions
Supplementary Materials
Author Contributions
Funding
Conflicts of Interest
References
- Ashihara, H.; Sano, H.; Crozier, A. Caffeine and related purine alkaloids: Biosynthesis, catabolism, function and genetic engineering. Phytochemistry 2008, 69, 841–856. [Google Scholar] [CrossRef] [PubMed]
- Butt, M.S.; Sultan, M.T. Coffee and its consumption: Benefits and risks. Crit. Rev. Food Sci. Nutr. 2011, 51, 363–373. [Google Scholar] [CrossRef] [PubMed]
- Juliano, L.M.; Ferre, S.; Griffiths, R.R. The pharmacology of caffeine. In The ASAM Principles of Addiction Medicine, 5th ed.; Wolters Kluwer Health Adis (ESP): Alphen aan den Rijn, The Netherlands, 2014. [Google Scholar]
- Hakooz, N.M. Caffeine metabolic ratios for the in vivo evaluation of CYP1A2, N-acetyltransferase 2, xanthine oxidase and CYP2A6 enzymatic activities. Curr. Drug Metab. 2009, 10, 329–338. [Google Scholar] [CrossRef] [PubMed]
- Kot, M.; Daniel, W.A. Caffeine as a marker substrate for testing cytochrome P450 activity in human and rat. Pharmacol. Rep. 2008, 60, 789–797. [Google Scholar] [PubMed]
- Miners, J.O.; Birkett, D.J. The use of caffeine as a metabolic probe for human drug metabolizing enzymes. Gen. Pharmacol. 1996, 27, 245–249. [Google Scholar] [CrossRef]
- Begas, E.; Kouvaras, E.; Tsakalof, A.; Papakosta, S.; Asprodini, E.K. In vivo evaluation of CYP1A2, CYP2A6, NAT-2 and xanthine oxidase activities in a Greek population sample by the RP-HPLC monitoring of caffeine metabolic ratios. Biomed. Chromatogr. 2007, 21, 190–200. [Google Scholar] [CrossRef] [PubMed]
- Caubet, M.S.; Comte, B.; Brazier, J.L. Determination of urinary 13C-caffeine metabolites by liquid chromatography-mass spectrometry: The use of metabolic ratios to assess CYP1A2 activity. J. Pharm. Biomed. Anal. 2004, 34, 379–389. [Google Scholar] [CrossRef]
- Chung, W.G.; Kang, J.H.; Park, C.S.; Cho, M.H.; Cha, Y.N. Effect of age and smoking on in vivo CYP1A2, flavin-containing monooxygenase, and xanthine oxidase activities in Koreans: Determination by caffeine metabolism. Clin. Pharmacol. Ther. 2000, 67, 258–266. [Google Scholar] [CrossRef] [PubMed]
- Jetter, A.; Kinzig-Schippers, M.; Illauer, M.; Hermann, R.; Erb, K.; Borlak, J.; Wolf, H.; Smith, G.; Cascorbi, I.; Sorgel, F.; et al. Phenotyping of N-acetyltransferase type 2 by caffeine from uncontrolled dietary exposure. Eur. J. Clin. Pharmacol. 2004, 60, 17–21. [Google Scholar] [CrossRef]
- Marchei, E.; Pellegrini, M.; Pacifici, R.; Palmi, I.; Pichini, S. Development and validation of a high-performance liquid chromatography-mass spectrometry assay for methylxanthines and taurine in dietary supplements. J. Pharm. Biomed. Anal. 2005, 37, 499–507. [Google Scholar] [CrossRef]
- Nordmark, A.; Lundgren, S.; Cnattingius, S.; Rane, A. Dietary caffeine as a probe agent for assessment of cytochrome P4501A2 activity in random urine samples. Br. J. Clin. Pharmacol. 1999, 47, 397–402. [Google Scholar] [CrossRef] [PubMed]
- Rybak, M.E.; Pao, C.I.; Pfeiffer, C.M. Determination of urine caffeine and its metabolites by use of high-performance liquid chromatography-tandem mass spectrometry: Estimating dietary caffeine exposure and metabolic phenotyping in population studies. Anal. Bioanal. Chem. 2014, 406, 771–784. [Google Scholar] [CrossRef]
- Schneider, H.; Ma, L.; Glatt, H. Extractionless method for the determination of urinary caffeine metabolites using high-performance liquid chromatography coupled with tandem mass spectrometry. J. Chromatogr. B Analyt. Technol. Biomed. Life Sci. 2003, 789, 227–237. [Google Scholar] [CrossRef]
- Thevis, M.; Opfermann, G.; Krug, O.; Schanzer, W. Electrospray ionization mass spectrometric characterization and quantitation of xanthine derivatives using isotopically labelled analogues: An application for equine doping control analysis. Rapid Commun. Mass Spectrom. 2004, 18, 1553–1560. [Google Scholar] [CrossRef] [PubMed]
- Weimann, A.; Sabroe, M.; Poulsen, H.E. Measurement of caffeine and five of the major metabolites in urine by high-performance liquid chromatography/tandem mass spectrometry. J. Mass Spectrom. 2005, 40, 307–316. [Google Scholar] [CrossRef]
- Aklillu, E.; Carrillo, J.A.; Makonnen, E.; Hellman, K.; Pitarque, M.; Bertilsson, L.; Ingelman-Sundberg, M. Genetic polymorphism of CYP1A2 in Ethiopians affecting induction and expression: Characterization of novel haplotypes with single-nucleotide polymorphisms in intron 1. Mol. Pharmacol. 2003, 64, 659–669. [Google Scholar] [CrossRef]
- Carrillo, J.A.; Benitez, J. Caffeine metabolism in a healthy Spanish population: N-acetylator phenotype and oxidation pathways. Clin. Pharmacol. Ther. 1994, 55, 293–304. [Google Scholar] [CrossRef]
- De Kesel, P.M.; Lambert, W.E.; Stove, C.P. Paraxanthine/Caffeine Concentration Ratios in Hair: An Alternative for Plasma-Based Phenotyping of Cytochrome P450 1A2? Clin. Pharmacokinet. 2015, 54, 771–781. [Google Scholar] [CrossRef]
- Jetter, A.; Kinzig, M.; Rodamer, M.; Tomalik-Scharte, D.; Sorgel, F.; Fuhr, U. Phenotyping of N-acetyltransferase type 2 and xanthine oxidase with caffeine: When should urine samples be collected? Eur. J. Clin. Pharmacol. 2009, 65, 411–417. [Google Scholar] [CrossRef]
- Bioanalytical Method Validation: Guidance for Industry. Available online: https://www.fda.gov/downloads/drugs/guidances/ucm070107.pdf (accessed on 19 August 2018).
- Nyeki, A.; Buclin, T.; Biollaz, J.; Decosterd, L.A. NAT2 and CYP1A2 phenotyping with caffeine: Head-to-head comparison of AFMU vs. AAMU in the urine metabolite ratios. Br. J. Clin. Pharmacol. 2003, 55, 62–67. [Google Scholar] [CrossRef] [PubMed]
- Kang, T.S.; Jin, S.K.; Lee, J.E.; Woo, S.W.; Roh, J. Comparison of genetic polymorphisms of the NAT2 gene between Korean and four other ethnic groups. J. Clin. Pharm. Ther. 2009, 34, 709–718. [Google Scholar] [CrossRef] [PubMed]
- Rihs, H.P.; John, A.; Scherenberg, M.; Seidel, A.; Bruning, T. Concordance between the deduced acetylation status generated by high-speed: Real-time PCR based NAT2 genotyping of seven single nucleotide polymorphisms and human NAT2 phenotypes determined by a caffeine assay. Clin. Chim. Acta 2007, 376, 240–243. [Google Scholar] [CrossRef] [PubMed]
- Ardan, T.; Kovaceva, J.; Cejkova, J. Comparative histochemical and immunohistochemical study on xanthine oxidoreductase/xanthine oxidase in mammalian corneal epithelium. Acta Histochem. 2004, 106, 69–75. [Google Scholar] [CrossRef] [PubMed]
- de Araujo, M.; Franco, Y.E.M.; Alberto, T.G.; Messias, M.C.F.; Leme, C.W.; Sawaya, A.; Carvalho, P.O. Kinetic study on the inhibition of xanthine oxidase by acylated derivatives of flavonoids synthesised enzymatically. J. Enzyme Inhib. Med. Chem. 2017, 32, 978–985. [Google Scholar] [CrossRef] [PubMed]
- Kitamura, S.; Sugihara, K.; Ohta, S. Drug-metabolizing ability of molybdenum hydroxylases. Drug Metab. Pharmacokinet. 2006, 21, 83–98. [Google Scholar] [CrossRef] [PubMed]
- Pacher, P.; Nivorozhkin, A.; Szabo, C. Therapeutic effects of xanthine oxidase inhibitors: Renaissance half a century after the discovery of allopurinol. Pharmacol. Rev. 2006, 58, 87–114. [Google Scholar] [CrossRef] [PubMed]
- Pritsos, C.A. Cellular distribution, metabolism and regulation of the xanthine oxidoreductase enzyme system. Chem. Biol. Interact. 2000, 129, 195–208. [Google Scholar] [CrossRef]
- Choughule, K.V.; Barnaba, C.; Joswig-Jones, C.A.; Jones, J.P. In vitro oxidative metabolism of 6-mercaptopurine in human liver: Insights into the role of the molybdoflavoenzymes aldehyde oxidase, xanthine oxidase, and xanthine dehydrogenase. Drug Metab. Dispos. 2014, 42, 1334–1340. [Google Scholar] [CrossRef] [PubMed]
- Aklillu, E.; Carrillo, J.A.; Makonnen, E.; Bertilsson, L.; Ingelman-Sundberg, M. Xanthine oxidase activity is influenced by environmental factors in Ethiopians. Eur. J. Clin. Pharmacol. 2003, 59, 533–536. [Google Scholar] [CrossRef]
- Park, S.L.; Murphy, S.E.; Wilkens, L.R.; Stram, D.O.; Hecht, S.S.; Le Marchand, L. Association of CYP2A6 activity with lung cancer incidence in smokers: The multiethnic cohort study. PLoS ONE 2017, 12, e0178435. [Google Scholar] [CrossRef] [PubMed]
- Soeroso, N.N.; Zain-Hamid, R.; Sinaga, B.Y.M.; Sadewa, A.H.; Syafiuddin, T.; Syahruddin, E.; Tann, G.; Mutiara, E. Genetic Polymorphism of CYP2A6 and Its Relationship with Nicotine Metabolism in Male Bataknese Smokers Suffered from Lung Cancer in Indonesia. Open Access Maced. J. Med. Sci. 2018, 6, 1199–1205. [Google Scholar] [CrossRef] [PubMed]
- Tanner, J.A.; Henderson, J.A.; Buchwald, D.; Howard, B.V.; Nez Henderson, P.; Tyndale, R.F. Variation in CYP2A6 and nicotine metabolism among two American Indian tribal groups differing in smoking patterns and risk for tobacco-related cancer. Pharmacogenet. Genom. 2017, 27, 169–178. [Google Scholar] [CrossRef] [PubMed]
- Yuan, J.M.; Nelson, H.H.; Carmella, S.G.; Wang, R.; Kuriger-Laber, J.; Jin, A.; Adams-Haduch, J.; Hecht, S.S.; Koh, W.P.; Murphy, S.E. CYP2A6 genetic polymorphisms and biomarkers of tobacco smoke constituents in relation to risk of lung cancer in the Singapore Chinese Health Study. Carcinogenesis 2017, 38, 411–418. [Google Scholar] [CrossRef] [PubMed]


| Intra-Day Assay (n = 5) | Inter-Day Assay (n = 5) | |||||||||||||||
|---|---|---|---|---|---|---|---|---|---|---|---|---|---|---|---|---|
| Analyte | LLOQ | Low QC | Middle QC | High QC | LLOQ | Low QC | Middle QC | High QC | ||||||||
| A | RSD | A | RSD | A | RSD | A | RSD | A | RSD | A | RSD | A | RSD | A | RSD | |
| (%) | (%) | (%) | (%) | (%) | (%) | (%) | (%) | (%) | (%) | (%) | (%) | (%) | (%) | (%) | (%) | |
| 137U | 106.3 | 3.0 | 115.0 | 1.1 | 104.2 | 1.1 | 108.7 | 0.9 | 108.6 | 8.1 | 113.0 | 3.5 | 104.7 | 5.9 | 106.3 | 1.9 |
| 13X | 102.4 | 16.3 | 94.0 | 4.9 | 100.4 | 5.2 | 101.5 | 4.1 | 91.4 | 10.8 | 91.2 | 4.5 | 94.3 | 6.7 | 96.0 | 11.0 |
| 17X | 109.0 | 3.3 | 112.4 | 2.4 | 101.8 | 2.5 | 101.1 | 9.6 | 109.4 | 3.0 | 110.0 | 3.8 | 108.6 | 4.0 | 100.4 | 1.7 |
| 37X | 102.5 | 4.6 | 105.2 | 3.8 | 98.2 | 3.6 | 99.4 | 5.2 | 106.5 | 7.4 | 100.8 | 4.1 | 104.9 | 3.3 | 101.5 | 2.6 |
| 17U | 102.6 | 2.0 | 102.9 | 9.9 | 86.6 | 1.6 | 95.7 | 4.7 | 106.4 | 11.4 | 90.5 | 6.8 | 87.0 | 2.0 | 95.0 | 3.3 |
| AFMU | 103.4 | 8.1 | 96.8 | 4.8 | 98.9 | 1.8 | 89.1 | 5.5 | 95.0 | 5.6 | 92.5 | 3.9 | 95.6 | 4.0 | 89.1 | 2.2 |
| AAMU | 111.9 | 7.7 | 107.4 | 5.6 | 105.3 | 4.5 | 101.0 | 7.0 | 106.0 | 6.8 | 106.6 | 5.6 | 103.0 | 2.7 | 107.4 | 4.1 |
| 1U | 104.3 | 3.3 | 101.0 | 1.9 | 102.8 | 7.3 | 88.7 | 2.4 | 114.0 | 6.3 | 105.2 | 6.8 | 107.5 | 7.8 | 88.1 | 1.8 |
| 13U | 104.7 | 11.4 | 96.4 | 9.7 | 113.3 | 1.1 | 108.0 | 2.3 | 110.9 | 4.7 | 99.3 | 9.3 | 114.3 | 0.5 | 111.7 | 2.6 |
| 1X | 104.4 | 6.0 | 108.7 | 5.8 | 101.9 | 1.3 | 102.2 | 7.2 | 106.0 | 7.0 | 100.7 | 10.3 | 101.0 | 3.7 | 96.8 | 6.2 |
| 3X | 101.7 | 12.9 | 101.5 | 3.9 | 102.4 | 9.1 | 104.3 | 5.9 | 97.0 | 2.9 | 97.2 | 9.4 | 98.2 | 7.8 | 107.7 | 4.3 |
| 37U | 96.3 | 6.1 | 97.1 | 5.1 | 102.7 | 11.7 | 101.9 | 1.7 | 102.4 | 4.2 | 100.0 | 6.3 | 97.4 | 8.3 | 100.0 | 5.5 |
| 7X | 108.6 | 2.1 | 103.4 | 7.7 | 98.7 | 2.0 | 101.0 | 7.2 | 103.3 | 6.3 | 106.1 | 3.7 | 100.2 | 9.6 | 97.2 | 6.3 |
| 137X | 92.8 | 8.7 | 107.3 | 3.9 | 103.7 | 9.9 | 103.5 | 6.6 | 93.4 | 7.4 | 108.9 | 8.4 | 110.1 | 3.0 | 105.5 | 9.5 |
| Metabolite | Concentration Range (μM) | Metabolite | Concentration Range (μM) |
|---|---|---|---|
| 137U | 13.9–426.3 | 1U | 104.5–5577.5 |
| 13X | 0–145.9 | 13U | 104.6–1957.9 |
| 17X | 191.8–1941.3 | 1X | 126.3–4273.4 |
| 37X | 54.9–569.3 | 3X | 65.2–1362.3 |
| 17U | 131.6–2127.2 | 37U | 0–357.2 |
| AFMU | 76.8–1514.9 | 7X | 154.3–3145.5 |
| AAMU | 26.1–735.0 | 137X (caffeine) | 8.7–271.7 |
| Enzyme | Equation | Reference | |
|---|---|---|---|
| CYP1A2 | (a) | (AFMU + 1X + 1U + 17X + 17U)/137X | [4,17,18] |
| (b) | (17X + 17U)/137X | [4] | |
| (c) | 17X/137X | [4] | |
| (d) | (AAMU + 1X + 1U)/17U | [4] | |
| (e) | (AFMU + 1X + 1U)/17U | [4] | |
| (f) | (AFMU + 1X + 1U)/17X | [4] | |
| (g) | (AAMU + AFMU + 1X + 1U)/17U | [4] | |
| CYP2A6 | (a) | 17U/(AFMU + 1U + 1X + 17X + 17U) | [4] |
| (b) | 17X/17U | [4] | |
| NAT2 | (a) | (AAMU + AFMU)/(AAMU + AFMU + 1X + 1U) | [4,10,20] |
| (b) | AAMU/(AAMU + 1X + 1U) | [4] | |
| (c) | AFMU/(AFMU + 1X + 1U) | [4] | |
| (d) | AFMU/1X | [4] | |
| XO | (a) | 1U/1X + 1U | [4,20] |
| (b) | 1U/1X | [4] |
© 2019 by the authors. Licensee MDPI, Basel, Switzerland. This article is an open access article distributed under the terms and conditions of the Creative Commons Attribution (CC BY) license (http://creativecommons.org/licenses/by/4.0/).
Share and Cite
Kim, H.J.; Choi, M.S.; Rehman, S.U.; Ji, Y.S.; Yu, J.S.; Nakamura, K.; Yoo, H.H. Determination of Urinary Caffeine Metabolites as Biomarkers for Drug Metabolic Enzyme Activities. Nutrients 2019, 11, 1947. https://doi.org/10.3390/nu11081947
Kim HJ, Choi MS, Rehman SU, Ji YS, Yu JS, Nakamura K, Yoo HH. Determination of Urinary Caffeine Metabolites as Biomarkers for Drug Metabolic Enzyme Activities. Nutrients. 2019; 11(8):1947. https://doi.org/10.3390/nu11081947
Chicago/Turabian StyleKim, Hyeong Jun, Min Sun Choi, Shaheed Ur Rehman, Young Seok Ji, Jun Sang Yu, Katsunori Nakamura, and Hye Hyun Yoo. 2019. "Determination of Urinary Caffeine Metabolites as Biomarkers for Drug Metabolic Enzyme Activities" Nutrients 11, no. 8: 1947. https://doi.org/10.3390/nu11081947
APA StyleKim, H. J., Choi, M. S., Rehman, S. U., Ji, Y. S., Yu, J. S., Nakamura, K., & Yoo, H. H. (2019). Determination of Urinary Caffeine Metabolites as Biomarkers for Drug Metabolic Enzyme Activities. Nutrients, 11(8), 1947. https://doi.org/10.3390/nu11081947